Article

Simulation Study on the Performance of an Enhanced Vapor-Injection Heat-Pump Drying System

1
School of Energy & Environment, Zhongyuan University of Technology, Zhengzhou 450007, China
2
Zhengzhou Heating Group Co. Ltd., Zhengzhou 450052, China
*
Authors to whom correspondence should be addressed.
Energies 2022, 15(24), 9542; https://doi.org/10.3390/en15249542
Submission received: 11 November 2022 / Revised: 11 December 2022 / Accepted: 14 December 2022 / Published: 15 December 2022
(This article belongs to the Special Issue Phase Change Materials: The Ideal Solution for Thermal Management)

Abstract

:
The performance of an enhanced vapor-injection heat-pump drying system was designed and theoretically studied in cold areas. According to the simulation findings, the ideal vapor-injection charge of the system ranges from 12.3 to 13.9%, and its ideal intermediate pressure is between 1.278 and 1.498 MPa when the evaporation temperature is above 0 °C. The ideal vapor-injection charge of the system ranges from 13 to 20%, and its optimal intermediate pressure ranges from 1.078 to 1.278 MPa when the evaporation temperature is −15–0 °C. The ideal vapor-injection charge of the system ranges from 20 to 24%, and the intermediate pressure ranges from 0.898 to 1.078 MPa when the evaporation temperature is below −15 °C. The heat and humidity exhausted air source heat-pump drying (HHE–ASHPD) system has higher dehumidification efficiency than the closed heat-pump drying (CHPD) system under the same air temperature, humidity, and volume parameters.

1. Introduction

Drying technology is widely used in agriculture, food, biology, building materials, and other fields [1]; however, the drying process requires a lot of energy, and this accounts for 15% of the total industrial energy consumption [2,3]. According to the different principles, common drying technology can be divided into hot air drying [4], microwave drying [5], infrared radiation drying [6], vacuum freeze drying [7], etc.; however, hot air drying has poor drying quality, a long drying time, and high energy consumption [8]. Microwave drying easily causes high localised temperatures and excessive heating [9]. Infrared radiation drying has the disadvantages of limited penetration depth and uneven drying [10]. Vacuum freeze drying involves higher energy consumption [11]. By comparison, heat-pump drying has the advantages of high efficiency and energy conservation, adjustable temperature and humidity, high drying quality, and various structural forms; thus, it attracts much attention in the field of drying [12].
The heat pump was first utilized for dehumidification in 1943 by the German Sulzer Company; since then, heat-pump drying technology has advanced quickly in a variety of industries [13] and is now widely employed in the fields of food, wood, medical, and other technology [14,15]. Mei et al. [16] studied the effect of the system on total flavonoids in the blade of clinacanthus nutans by combining solar energy and heat-pump drying. The experimental results showed that the percentage of extractable substances and flavonoid substances in the materials dried in combination with a heat pump and solar energy increased significantly. To recover waste heat and address exhaust-gas pollution, Chua et al. [17] paired the heat pump with a tower-type coal-fired corn-drying system. Bithika et al. [18] improved the banana-drying model by adding narrow parameters, which significantly improved the fitting results. Wang et al. [19] developed a part air dehumidification cascade-like heat-pump dryer system combined with a set of heat pipes for heat recovery; meanwhile, Perna et al. [20] proposed the accurate concept of the dominant frequency of the heat pipe to provide a good basis for fully characterizing the device’s thermofluidic operation. By fusing solar energy with heat-pump systems, Qiu et al. [21] built a novel form of heat recovery and accumulation of heat-drying systems and studied the impact of various economic devices on system heat recovery. According to experimental findings, the solar-assisted heat-pump desiccators (SAHPD) system could conserve 40.53% of energy by using heat storage and heat recovery. Salih et al. [22] explained the drying process of tomatoes by using a heat-pump dryer to dry tomato slices at different temperatures. Jeyaprakash et al. [23] studied the change of tomato flavour in heat-pump drying and compared it with freeze drying, finally finding that heat-pump drying had better flavour retention. In order to dry cassava trash, Yahya et al. [24] investigated the effectiveness of solar desiccators (SD) and the SAHPD system. According to experimental results, the SD and SF of SAHPD were, respectively, 43.2–75.4% and 22.4–58.4%, and the corresponding average values were, respectively, 66.7% and 44.6%. A completely new solar heat-pump drying system was proposed by Hao et al. [25] who also conducted simulation and experimentation to evaluate the system’s performance. The results demonstrated that there was little discrepancy between the simulation value and the actual value, and its efficiency was higher than the open solar efficiency of 0.23 g of water/g of dry matter. In their analysis of the development of heat-pump drying technology and discussion of its uses for drying wood and food, Chua et al. [26] provided a summary. In order to manage the wind speed of the two-stage evaporator, Du et al. [27] developed a new type of two-stage evaporator heat pump. They also evaluated the performance and characteristics of the evaporator under various operating conditions. Tucker et al. [28] used the Midilli and Kucuk model to match the experimental data and the Arrhenius-type equation to explain the link between water diffusivity and temperature. Le et al. [29] compared the performance of the heat-pump dryer under different weather conditions. The specific moisture extraction rate (SMER) of the system was 0.37 kg/kWh, 0.33 kg/kWh, and 0.26 kg/kWh under sunny, intermittent cloudy and overcast weather conditions, respectively.
In this paper, a multifunctional heat-pump drying system is designed, which can complete the conversion between the CHPD system and the HHE–ASHPD system using enhanced vapor-injection technology. The performance of the HHE–ASHPD system at various evaporation temperatures is simulated mathematically, and the dehumidification effectiveness of the two systems under various conditions is compared to confirm the applicability of the system selection and produce a theoretical framework for further investigation.

2. Model Establishment

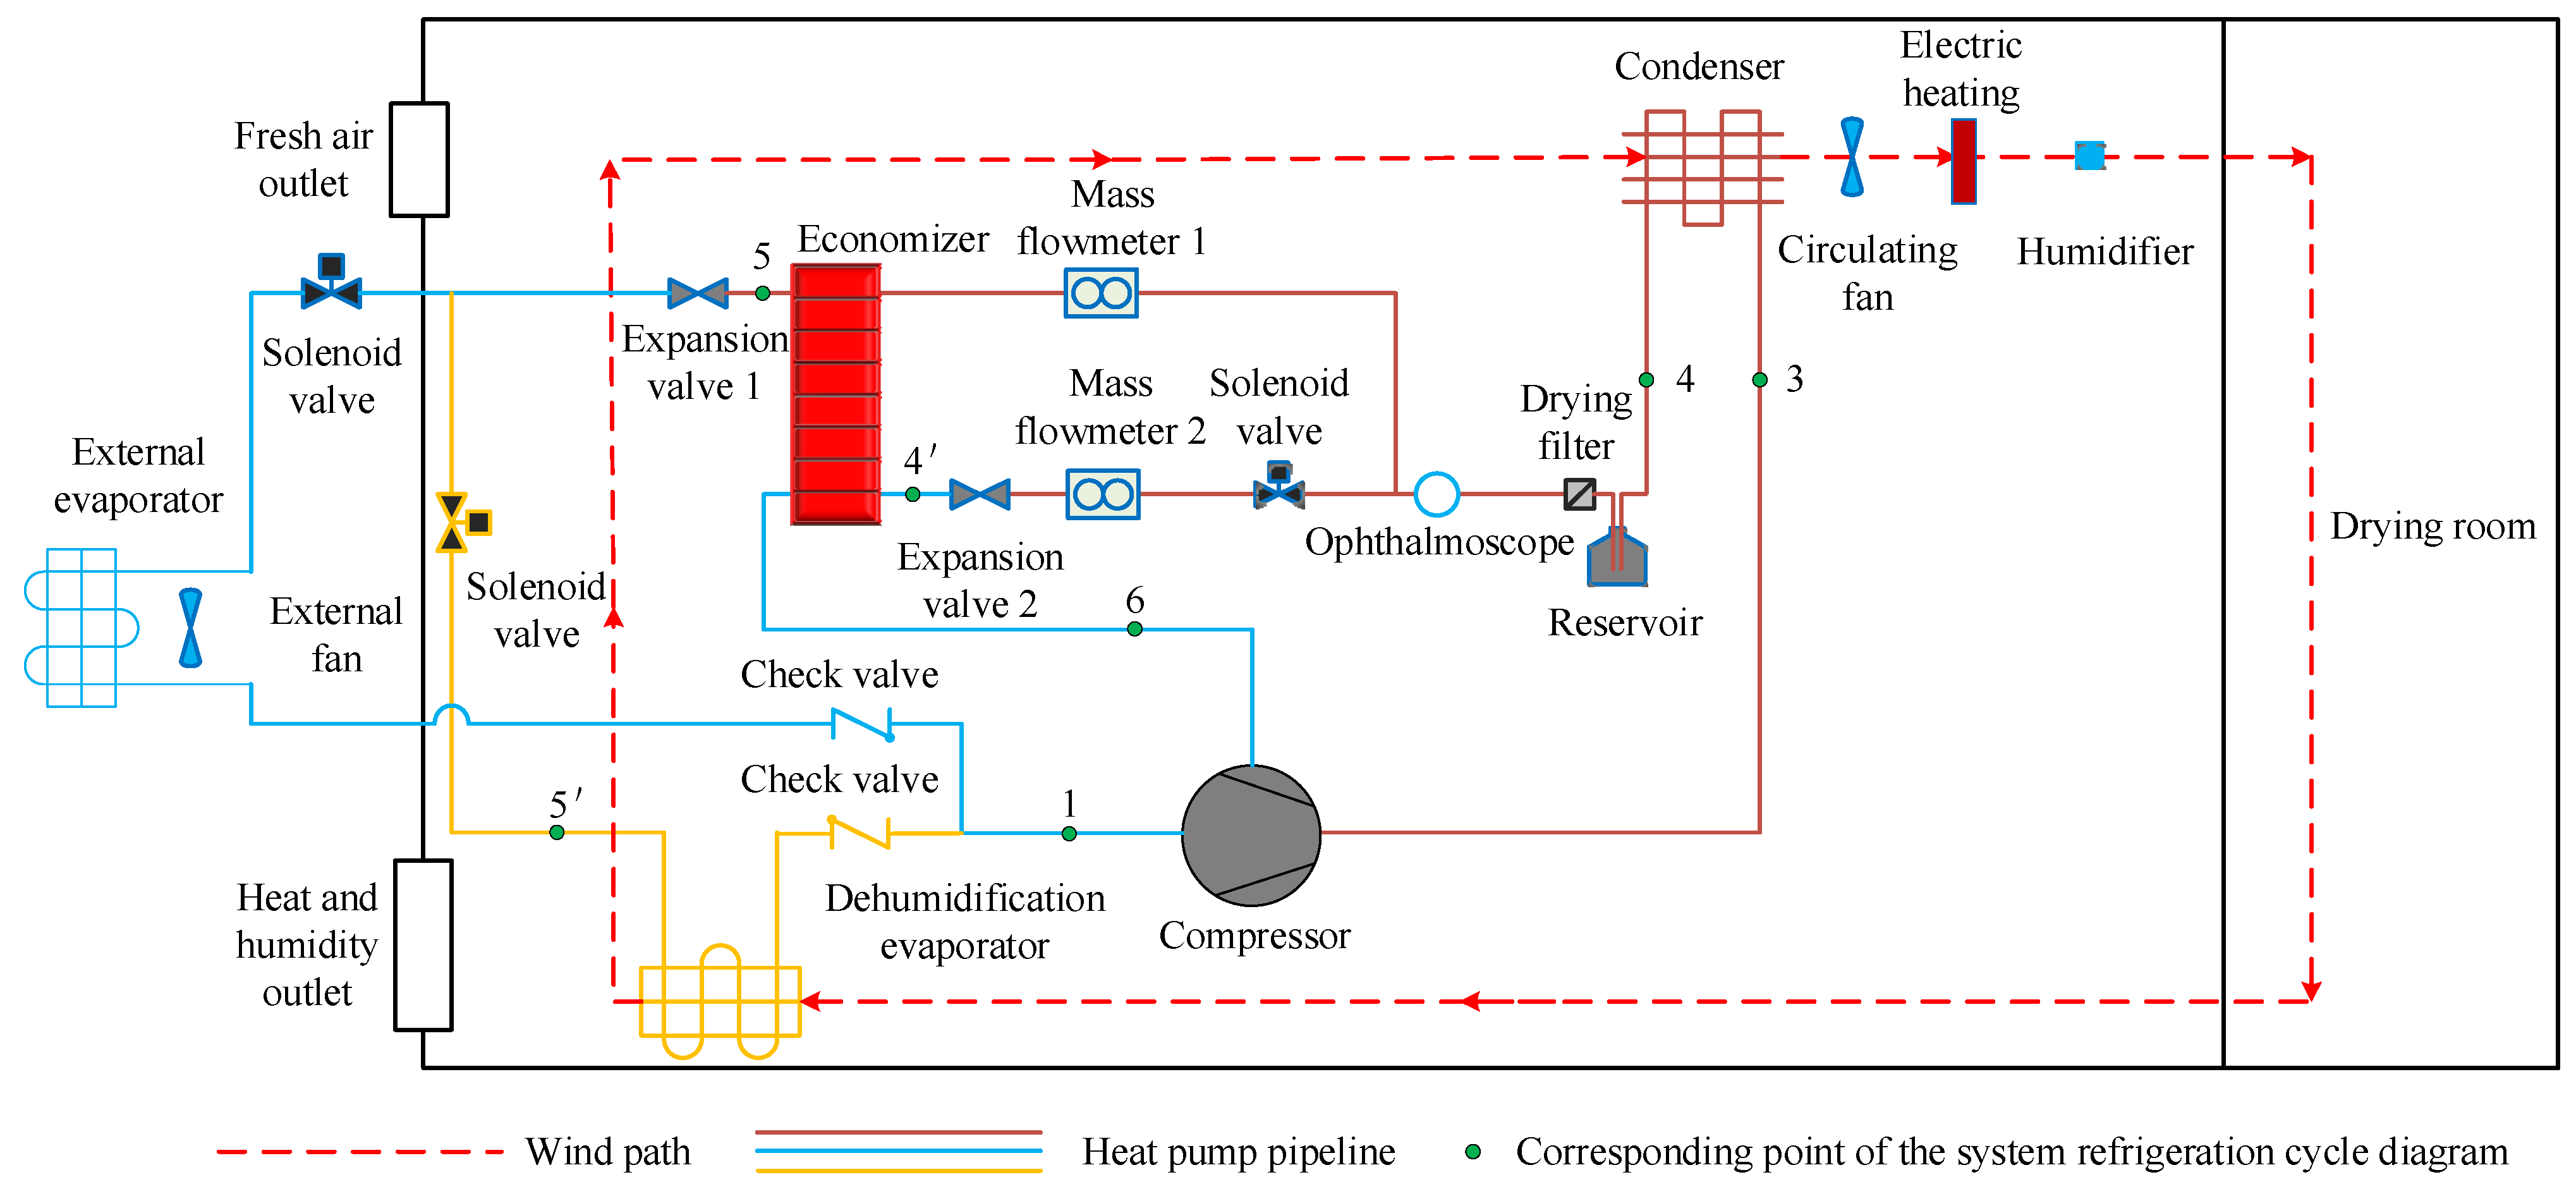
2.1. System Principles

The heat-pump drying system designed in this paper is shown in Figure 1. The solid line is the heat-pump circulation system, which is mainly composed of a compressor, electronic expansion valves, condenser, dehumidifying evaporator, external evaporator, solenoid valves, filter dryer, liquid storage tank, and liquid mirror. For the CHPD system, the refrigerant is compressed by the compressor before entering the condenser, where it is throttled and depressurized by the expansion valve before entering the dehumidification evaporator to exchange heat with the air and finish the dehumidification cycle. For the HHE–ASHPD system, it opens solenoid valve 12 and closes solenoid valve 13. The air in the drying chamber is heated by the condenser cycle. When the air humidity reaches the desired level, humidity and heat removal port 21 is opened to remove the humidity, and the new air port 20 is opened to introduce fresh air. The air in the drying chamber continues to circulate after the humidity removal is complete. For the HHE–ASHPD system, the compressor employs enhanced vapor-injection technology to enhance the unit’s operation in low-temperature situations.

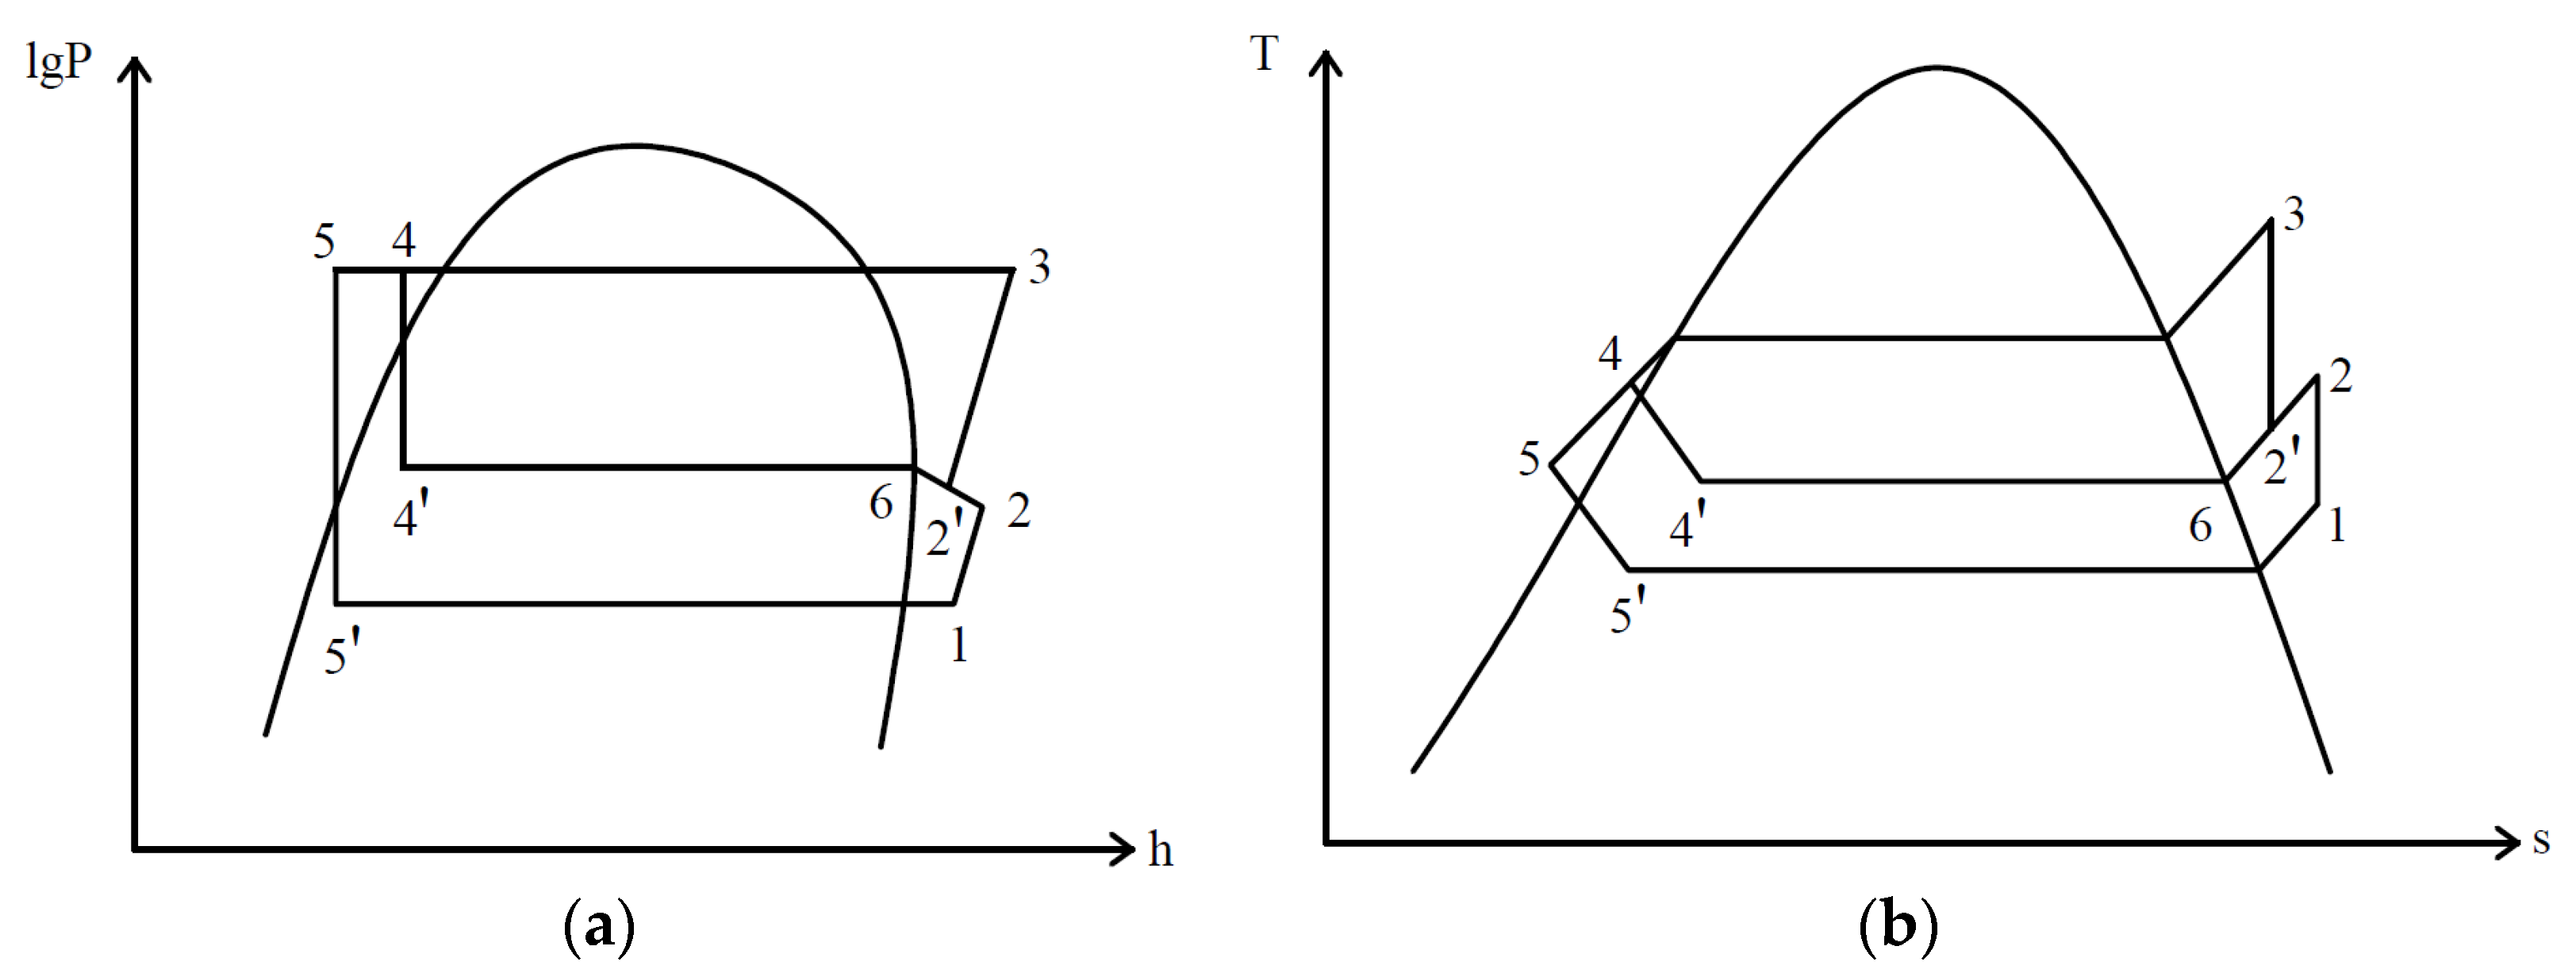
2.2. Thermodynamic Cycle Analysis

The P-h and T-s diagram of the heat-pump drying system designed in this paper is shown in Figure 2. The P-h diagram is used as an example to analyze the thermodynamic cycle of this system in this paper. The compression process can be divided into three stages: the first stage of compression before the vapor injection (1–2), the middle stage of the vapor injection (2–2′, 6–2′), and the second stage of compression after the vapor injection (2′–3). The refrigerant is diverted into two routes after heat exchange with the external environment in the condenser (3–4). The branch subcooled liquid refrigerant enters the economizer through throttling and, finally, enters the compressor (4–4′–6). The subcooled liquid refrigerant of the main route passes through the economizer, then enters the evaporator through throttling and, finally, enters the compressor for circulation (4–5–5′–1).

2.3. Compressor Model

In order to replenish gas and enhance enthalpy, the experimental system uses a compressor with frequency conversion, and the model follows the formula [30]. This is the formula for model fitting:
y = c 1 + c 2 T e + c 3 T c + c 4 T e 2 + c 5 T e T c + c 6 T c 2 + c 7 T e 3 + c 8 T e 2 T c + c 9 T e T c 2 + c 10 T c 3
where y are compressor power, heating capacity, COP, mass flow rate and other parameters. Te is the evaporation temperature of the system, °C; Tc is the condensation temperature of the system, and °C; c 1 , c 2 , c 3 , c 4 , c 5 , c 6 , c 7 , c 8 , c 9 and c 10 are the constants corresponding to each performance of the compressor, which can be obtained through the compressor selection software or calculated according to the performance parameters.
The compressor power consumption is:
W = m ( ( h 2 h 1 ) + ( 1 + a ) ( h 3 h 2 ) )
where m is the refrigerant mass flow rate, and kg/s; a is the injection ratio between the air admixed with increasing enthalpy.

2.4. Expansion Valve Model

The throttling process can be regarded as an isoenthalpy process, ignoring the pressure drop and heat leakage loss when the refrigerant flows through the expansion valve. The calculation formula is as follows:
m = C A t h 2 ρ ( P i n P o u t )
where Ath is the circulation area of the electronic expansion valve, m2; ρ is the density of refrigerant flowing through the expansion valve, kg/m3; Pin is the inlet refrigerant pressure of the expansion valve, MPa; Pout is the refrigerant pressure at the outlet of the expansion valve, MPa; and C is the mass flow coefficient, which can be calculated according to the empirical formula proposed by Wile [31]:
C = 0.02005 ρ + 0.634 ν
where ν is the specific volume of refrigerant.

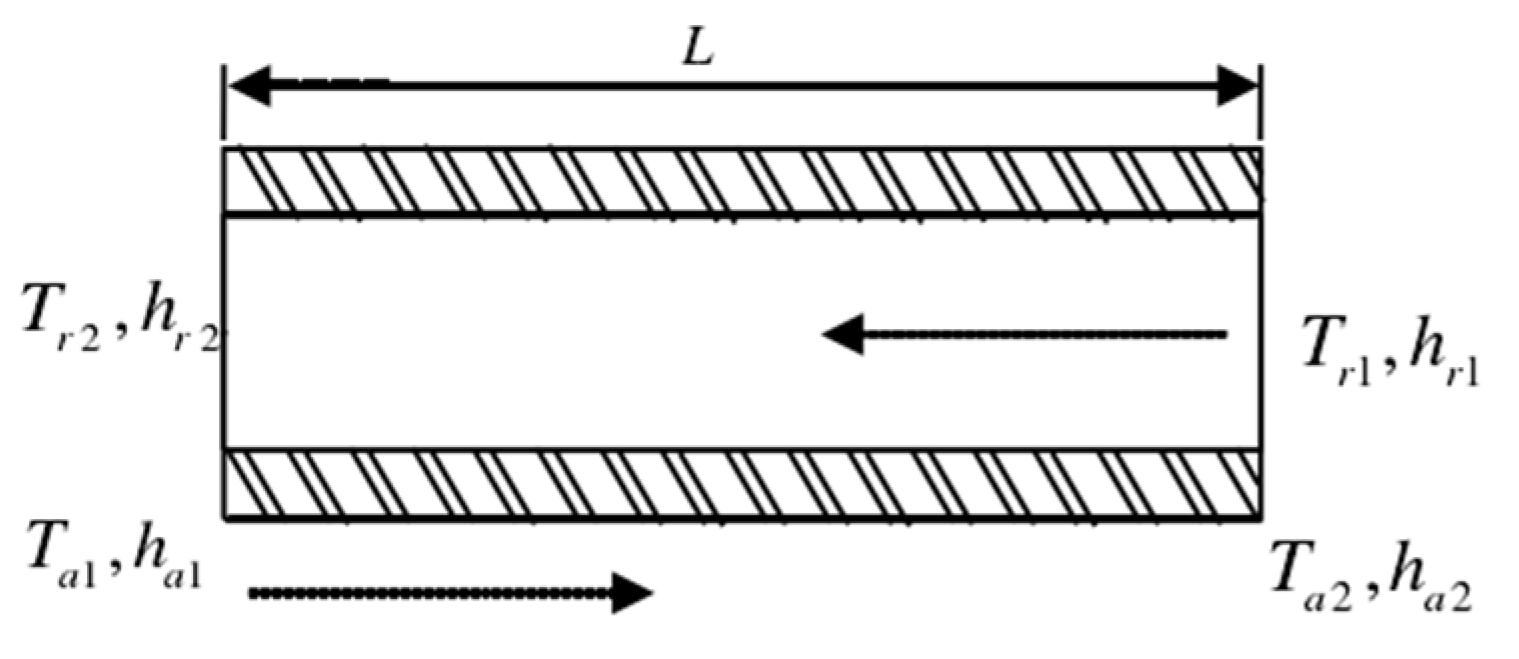
2.5. Finned Heat-Exchanger Model

Finned heat-exchangers are used in the condenser, external evaporator, and dehumidifying evaporator of the heat-pump system. Aluminum serves as the fin and a smooth copper tube serves as the refrigerant pipeline. Although the refrigerant will typically be in a two-phase state when it enters the evaporator, the process of refrigerant heat transfer in a heat-exchanger can be divided into three stages: the liquid phase region, the two-phase region, and the gas-phase region. As a result, only the condenser model refrigerant heat-transfer state is divided into three stages, and the refrigerant in the evaporator only exists in the two-phase section. As depicted in Figure 3, the heat-exchanger model is condensed into several one-dimensional flow heat-transfer model components.

2.5.1. Heat Transfer on the Refrigerant Side

  • Single-Phase Region
    m h , i n = m h , o u t
    m h ( h h , i n h h , o u t ) = α i A i ( T w T h m )
    where mh is the mass flow rate of refrigerant flowing through the heat-exchanger, kg/s; hh is the enthalpy value of the import and exported refrigerant in the heat-exchanger, kJ/kg; Tw is copper tube wall temperature, °C; Thm is the average refrigerant temperature of the heat-exchanger, °C; and Ai is the heat-transfer area, m2.
  • Two-Phase Region
The calculation formula proposed by Teraga and Guy [32] is used to calculate the corresponding two-phase region in this paper,
α t p { α r ( x ) ( 0.2 < x < x d ) α r ( x d ) ( x x d 1 x d ) 2 ( α r ( x d ) α s ) ( x x d )

2.5.2. Heat Transfer on the Air Side

  • Heat-Transfer Coefficient under Dry Conditions
m l , i n = m l , o u t
m a ( h a , i n h a , o u t ) = α A ( T a m T w )
where, ml,in, ml,out, and ma are the mass flow rate of wet air, kg/s; ha,in, and ha,out are the enthalpy value of wet air at the inlet and outlet of the heat-exchanger, kJ/kg; α is the heat-transfer coefficient under dry conditions, W/(m2·°C); A is the heat-exchange area of the heat-exchanger, m2; and Tw is the average temperature of the air outside the pipe, °C.
  • Heat-Transfer Coefficient under Wet Conditions
m a ( h a , i n h a , o u t ) = ξ α A ( T a m T w )
where, ξ is the moisture-separation coefficient of the heat-exchanger; a’ is the heat-transfer coefficient under wet condition, W/(m2·°C); A’ is the heat-exchange area of the heat-exchanger, m2; Tam is the average air temperature outside the tube; and °C; Tw is the wall temperature of copper pipe, °C.

2.6. Economizer Model

The major purpose of the economizer, a specially designed plate heat-exchanger, is to undercool the refrigerant in the main circuit and to increase system effectiveness. In the main circuit, which passes via the heat-exchanger, the refrigerant is liquid, and the vapor-injection channel is a two-phase gas liquid. The two paths satisfy the requirements for energy conservation and the vapor-injection ratio in the following paths:
a = ( h 3 h 4 ) / ( h 1 i h 4 )

2.7. Wet Air Model

The fundamental component of the moist air calculation model is the computation of physical parameters, including partial vapor pressure, relative humidity, water vapor saturation pressure, and others [33]. The following is the calculating formula:
The saturated vapor pressure is calculated by Gerry’s formula [34]. When the temperature is greater than 0.01 °C, the water surface equation is adopted:
lg H s = 31.46656 3142.305 T 8.2 lg T + 0.00248 T
When the temperature is less than 0.01 °C, the ice surface equation is adopted:
lg H s = 6.757169 2445.5646 T + 8.23121 lg T 0.01677006 T + 1.20514 × 10 5 T 2
P s = 101325 760 H s
Partial vapor pressure:
P k = P s , b A ( t t s ) B
A = 0.00001 ( 65 + 6.75 / ν )
where B is the ambient atmospheric pressure; and Ps,b is the saturated steam pressure.

2.8. Heat-Pump System and Wet Air Model Solution

Figure 4 displays the established system model. The simulation approach disregards the pressure drop and heat transfer of the connecting pipe fittings, and the system’s constraint criteria are the equal flow of refrigerant at the interface and the system’s overall energy conservation. The flow chart of the wet air mode solution is shown in Figure 5.

3. Analysis and Discussion of Simulation Results

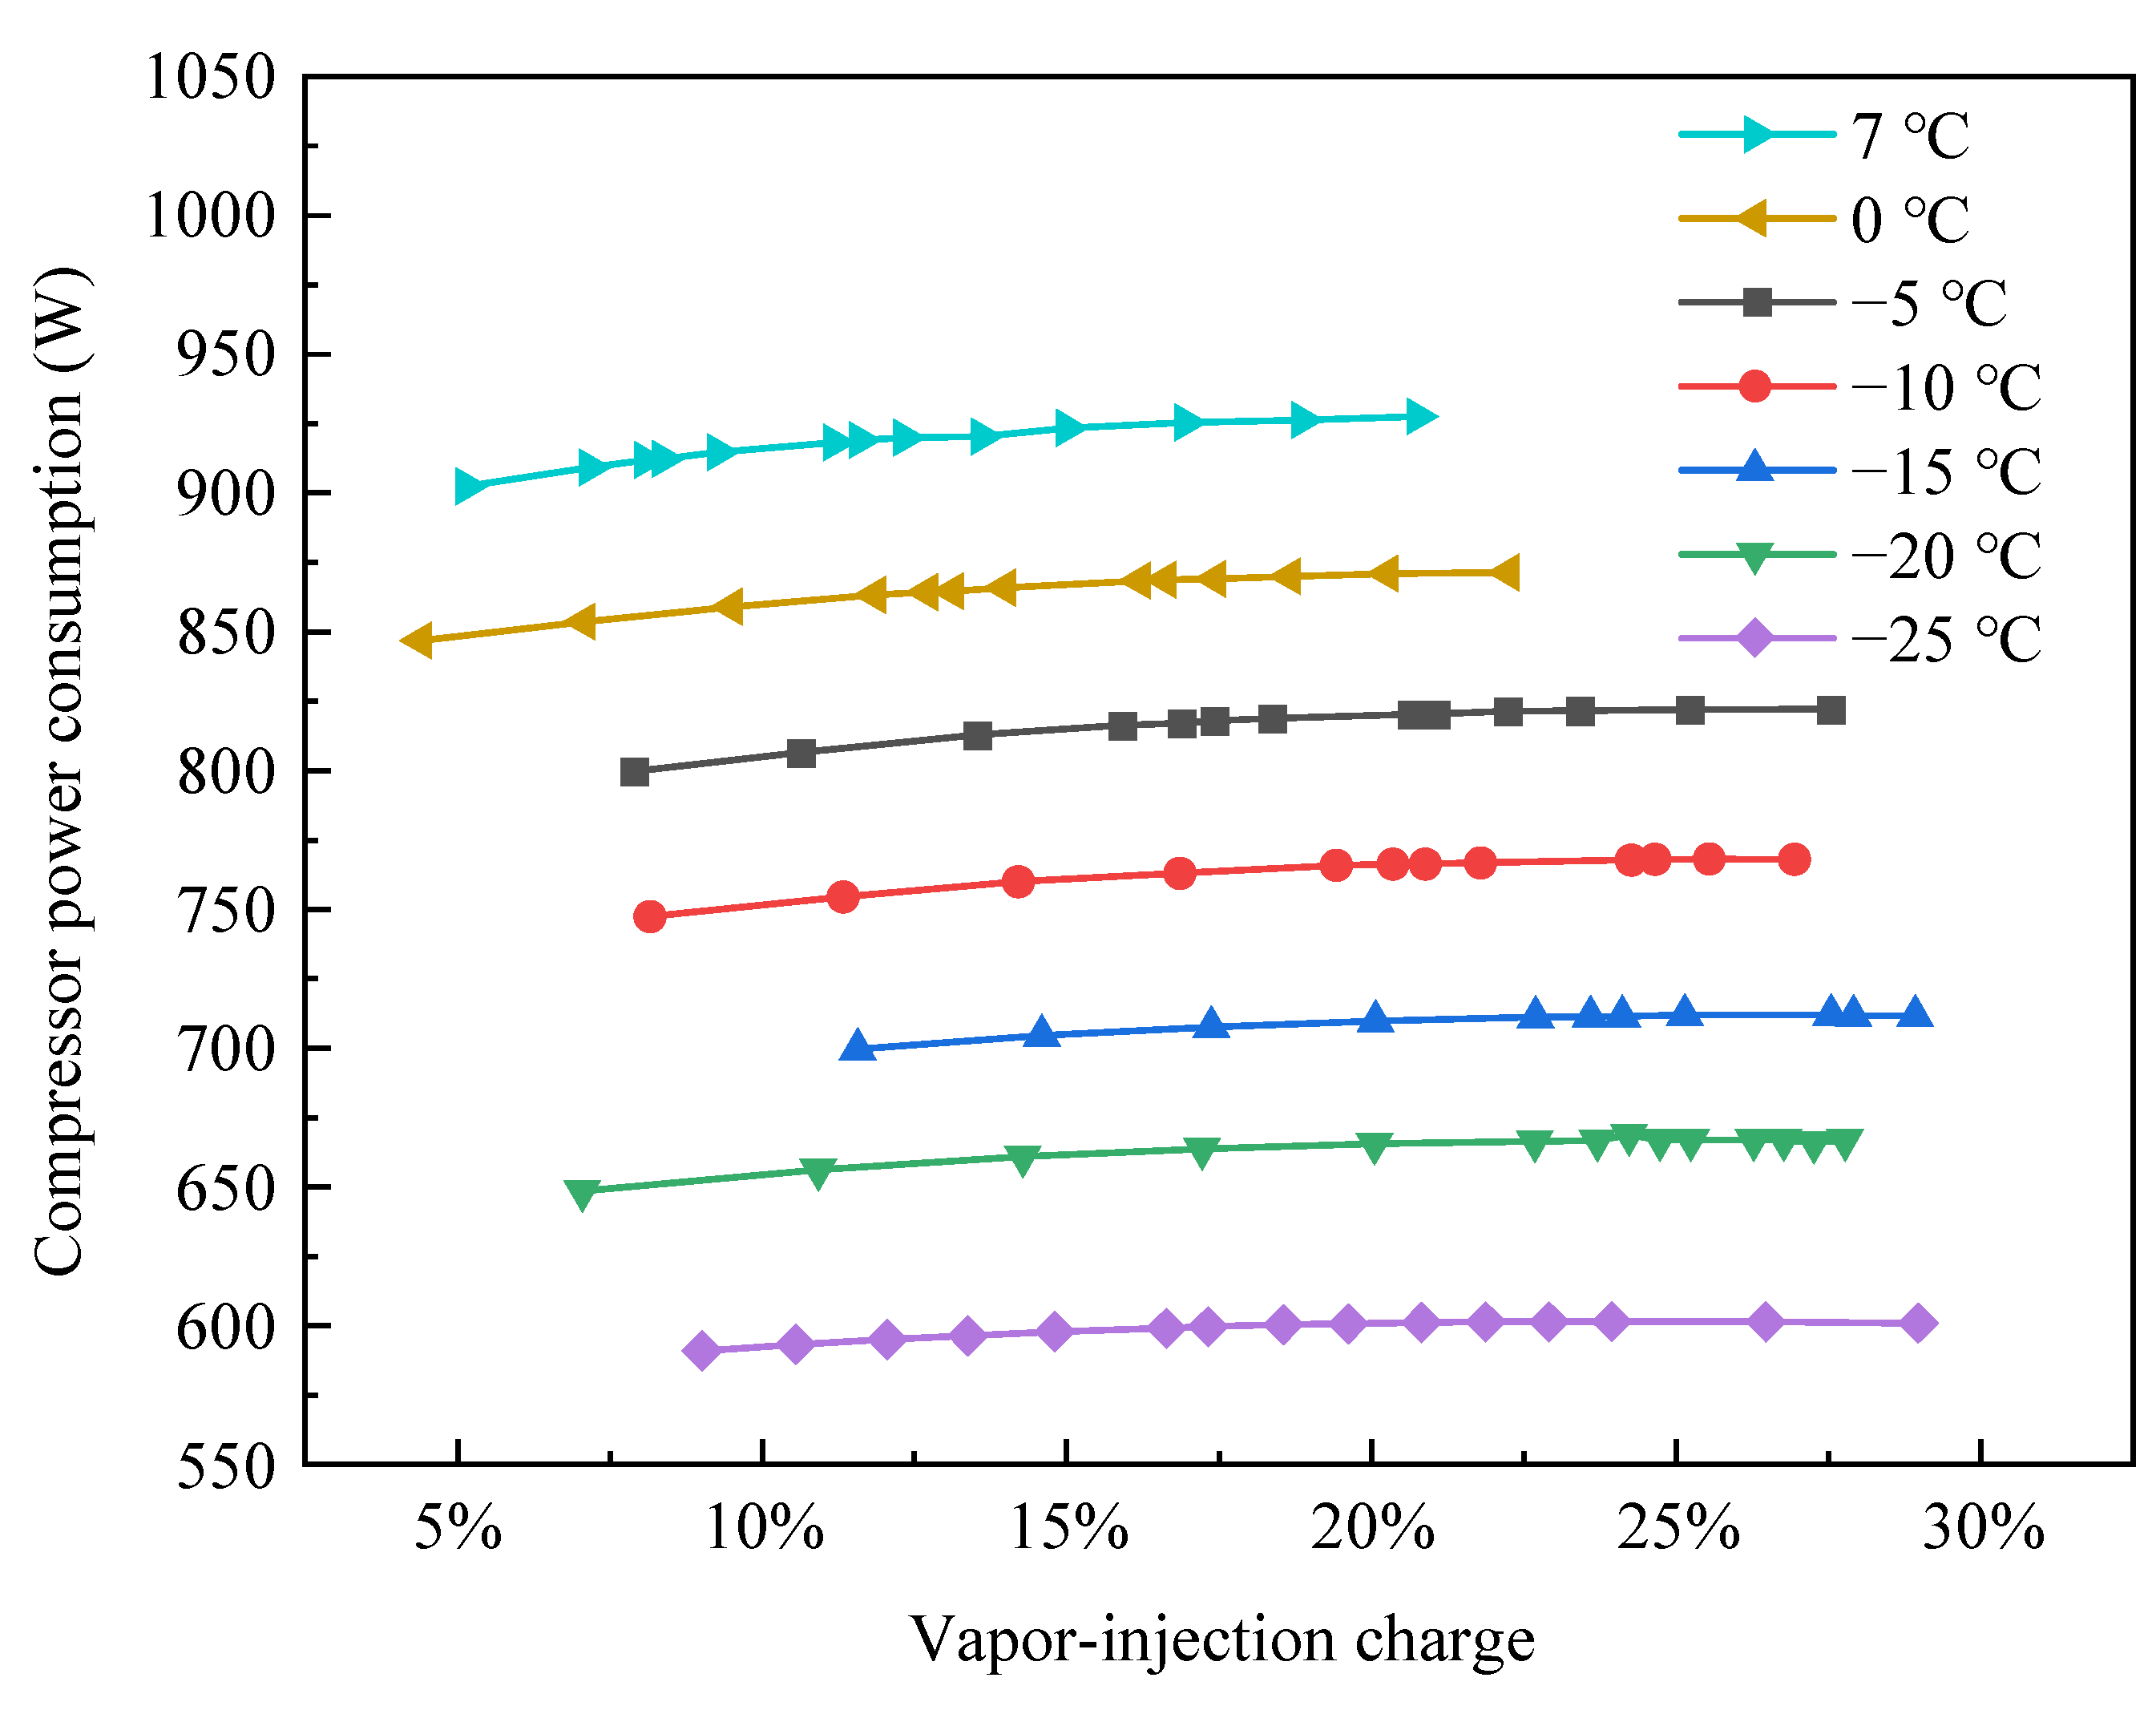
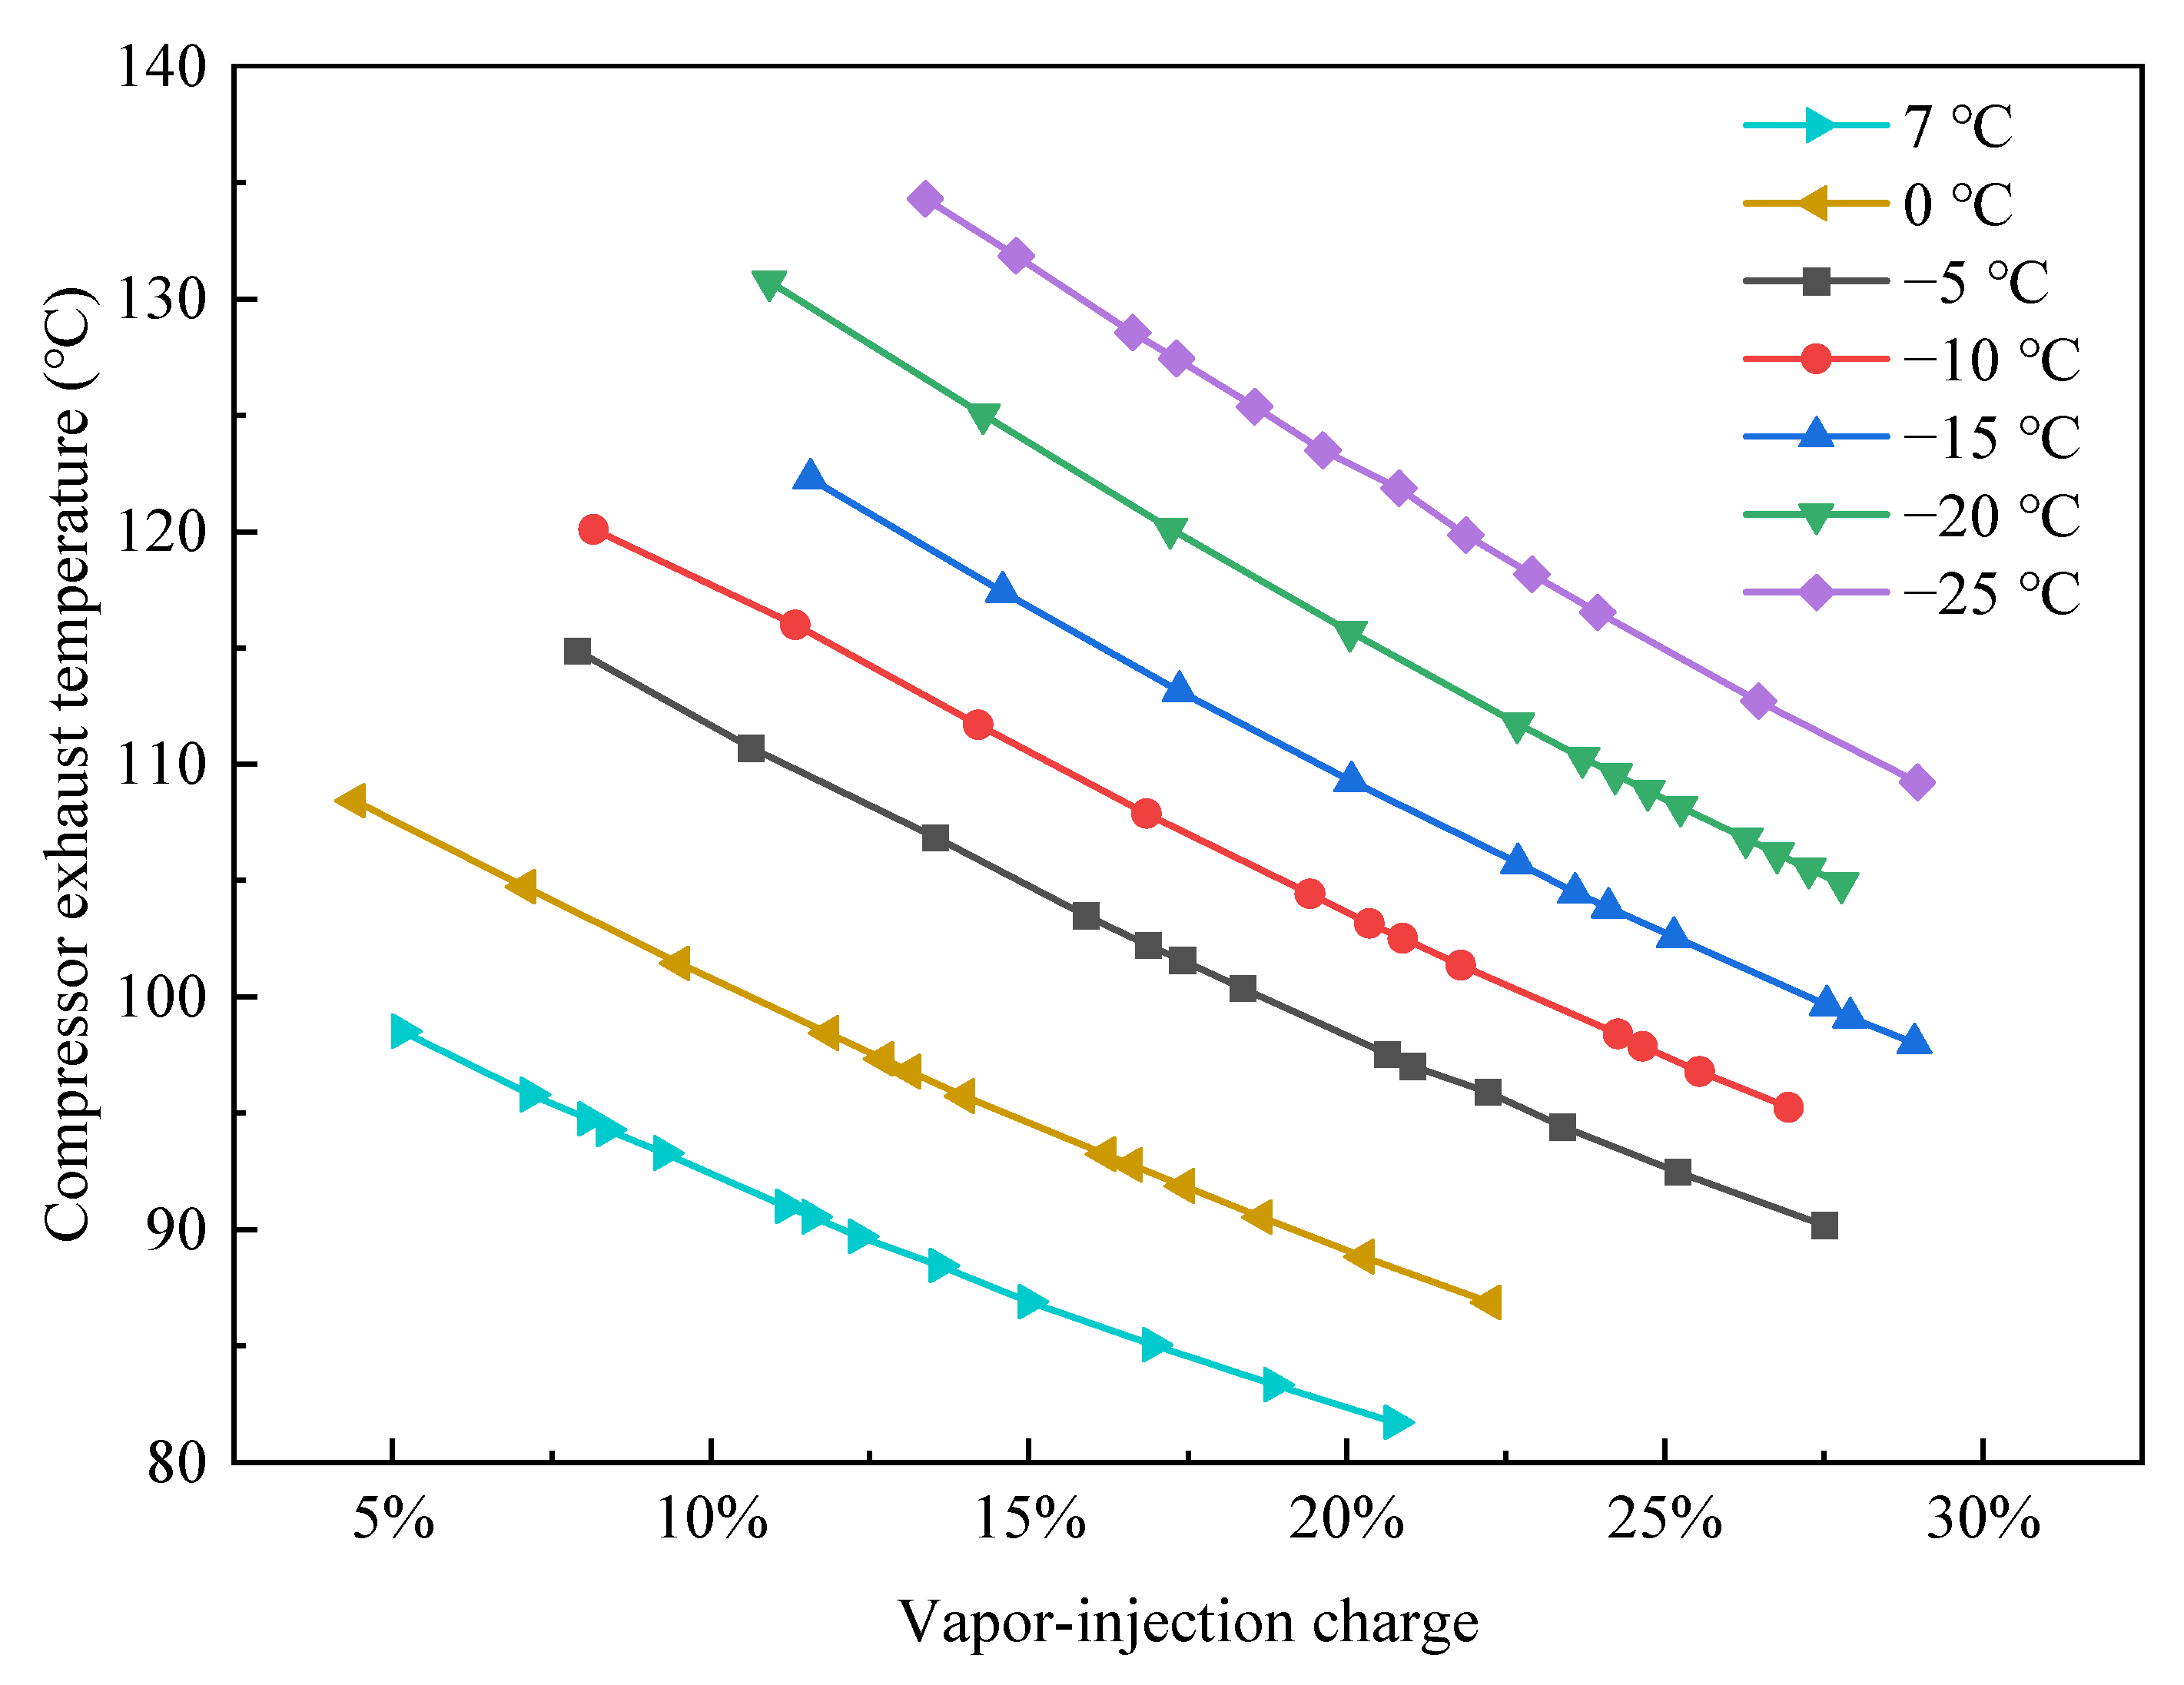
3.1. Variation of System Performance with the Vapor-Injection Charge at Different Evaporation Temperatures

The impact of vapor-injection charge on the heating capacity of the HHE–ASHPD system is depicted in Figure 6 under the conditions that the condensation temperature is 60 °C and the evaporation temperature fluctuates. The heating capacity of the system will progressively rise along with an increase in the vapor-injection charge. If the condensation temperature remains constant, an increase in the vapor-injection charge will cause the refrigerant flow at the compressor’s output to rise, which will boost the condenser to transfer heat, but no matter how much the evaporation temperature rises, the heating capacity with the rising trend of vapor-injection charge is basically the same. When the evaporation temperature is 7 °C, the vapor-injection charge increases by 15.6%, and the heating capacity of the system increases by 11.5%. When the evaporation temperature is 0 °C, the vapor-injection charge increases by 17.85%, and the heating capacity of the system increases by 9.62%. When the evaporation temperature is −5 °C, the vapor-injection charge increases by 19.6%, and the heating capacity of the system increases by 9.5%. When the evaporation temperature is −10 °C, the vapor-injection charge increases by 18.8%, and the heating capacity of the system increases by 8.59%. When the evaporation temperature is −15 °C, the vapor-injection charge increases by 16.3%, and the heating capacity of the system increases by 6.9%. When the evaporation temperature is −20 °C, the vapor-injection charge increases by 20.7% and the heating capacity of the system increases by 8.8%. When the evaporation temperature is −25 °C, the vapor-injection charge increases by 19.9%, and the heating capacity of the system increases by 7.6%. It can be seen that enhanced vapor injection can effectively improve the heating capacity of the system.
The variation trend of compressor power consumption with the vapor-injection charge is shown in Figure 7. The compressor power consumption rises gradually as the vapor-injection charge increases when the condensation temperature is determined and the evaporation temperature is the same. The major cause is an increase in the quantity of refrigerant flowing through the compressor and the amount of vapor supplied, which causes an increase in compressor function. When the evaporation temperature is 7 °C, the vapor-injection charge increases by 15.6% and the compressor power consumption increases by 2.8%. When the evaporation temperature is −5 °C, the vapor-injection charge increases by 19.6%, and the compressor power consumption increases by 2.8%. When the evaporation temperature is −25 °C, the vapor-injection charge increases by 19.96% and the compressor power consumption increases by 1.7%. It can be seen that the vapor-injection charge has little effect on the compressor power consumption.
The variation trend of the COP with the vapor-injection charge is shown in Figure 8. The system performs better when the vapor-injection charge is low and the evaporation temperature is high; however, when the ambient temperature is low, a higher vapor-injection charge is needed to ensure improved system performance; so, for different evaporation temperatures, the COP of the system has an optimal value. The diagram indicates that the ideal vapor-injection charge for the system is 12.3 to 13.9% when the evaporation temperature is greater than 0 °C, 13 to 20% when the evaporation temperature is between −15 and 0 °C, and 20 to 24% when the evaporation temperature is lower than −15 °C. This can infer that when the evaporation temperature increases, the optimum vapor-injection charge of the heat-pump system drops and the COP increases. The cause of this is that as the evaporation temperature rises, the density of the refrigerant at the compressor suction port also rises, increasing the mass flow rate of the system, and, as a result, also increasing the rate at which heating capacity is produced, which also raises the COP of the system.
The enhanced vapor injection is used to increase system efficiency and lower compressor exhaust temperature since the conventional heat-pump system has a problem with high compressor exhaust temperature and low efficiency while operating at low evaporation temperature. The compressor exhaust temperature with the vapor-injection charge is shown in Figure 9. The compressor exhaust temperature decreases obviously as the vapor-injection charge increases. This is because the refrigerant’s entropy will decrease during mixing as a result of the increased vapor-injection charge. The drop in entropy will result in a decrease in the compressor exhaust temperature when the isentropic efficiency of the compressor and condensation pressure is fixed. The compressor exhaust temperature reaches 134.3 °C when the evaporation temperature is −25 °C and the vapor-injection charge is 13.4%, but when the vapor-injection charge is 28.9%, the compressor exhaust temperature is lowered to 109.2 °C. The compressor exhaust temperature reaches 120.1 °C when the evaporation temperature is −10 °C and the vapor-injection charge is 8.2%, but when the vapor-injection charge is 26.9%, the exhaust temperature is lowered to 95.25 °C. The compressor exhaust temperature can reach 108.4 °C when the evaporation temperature is 0 °C and the vapor-injection charge is 4.4%; however, the compressor exhaust temperature drops to 86.9 °C when the vapor-injection charge is 22.3%. As can be observed, the compressor is efficiently protected at low temperatures by the enhanced vapor-injection technology, which also greatly lowers the compressor exhaust temperature.

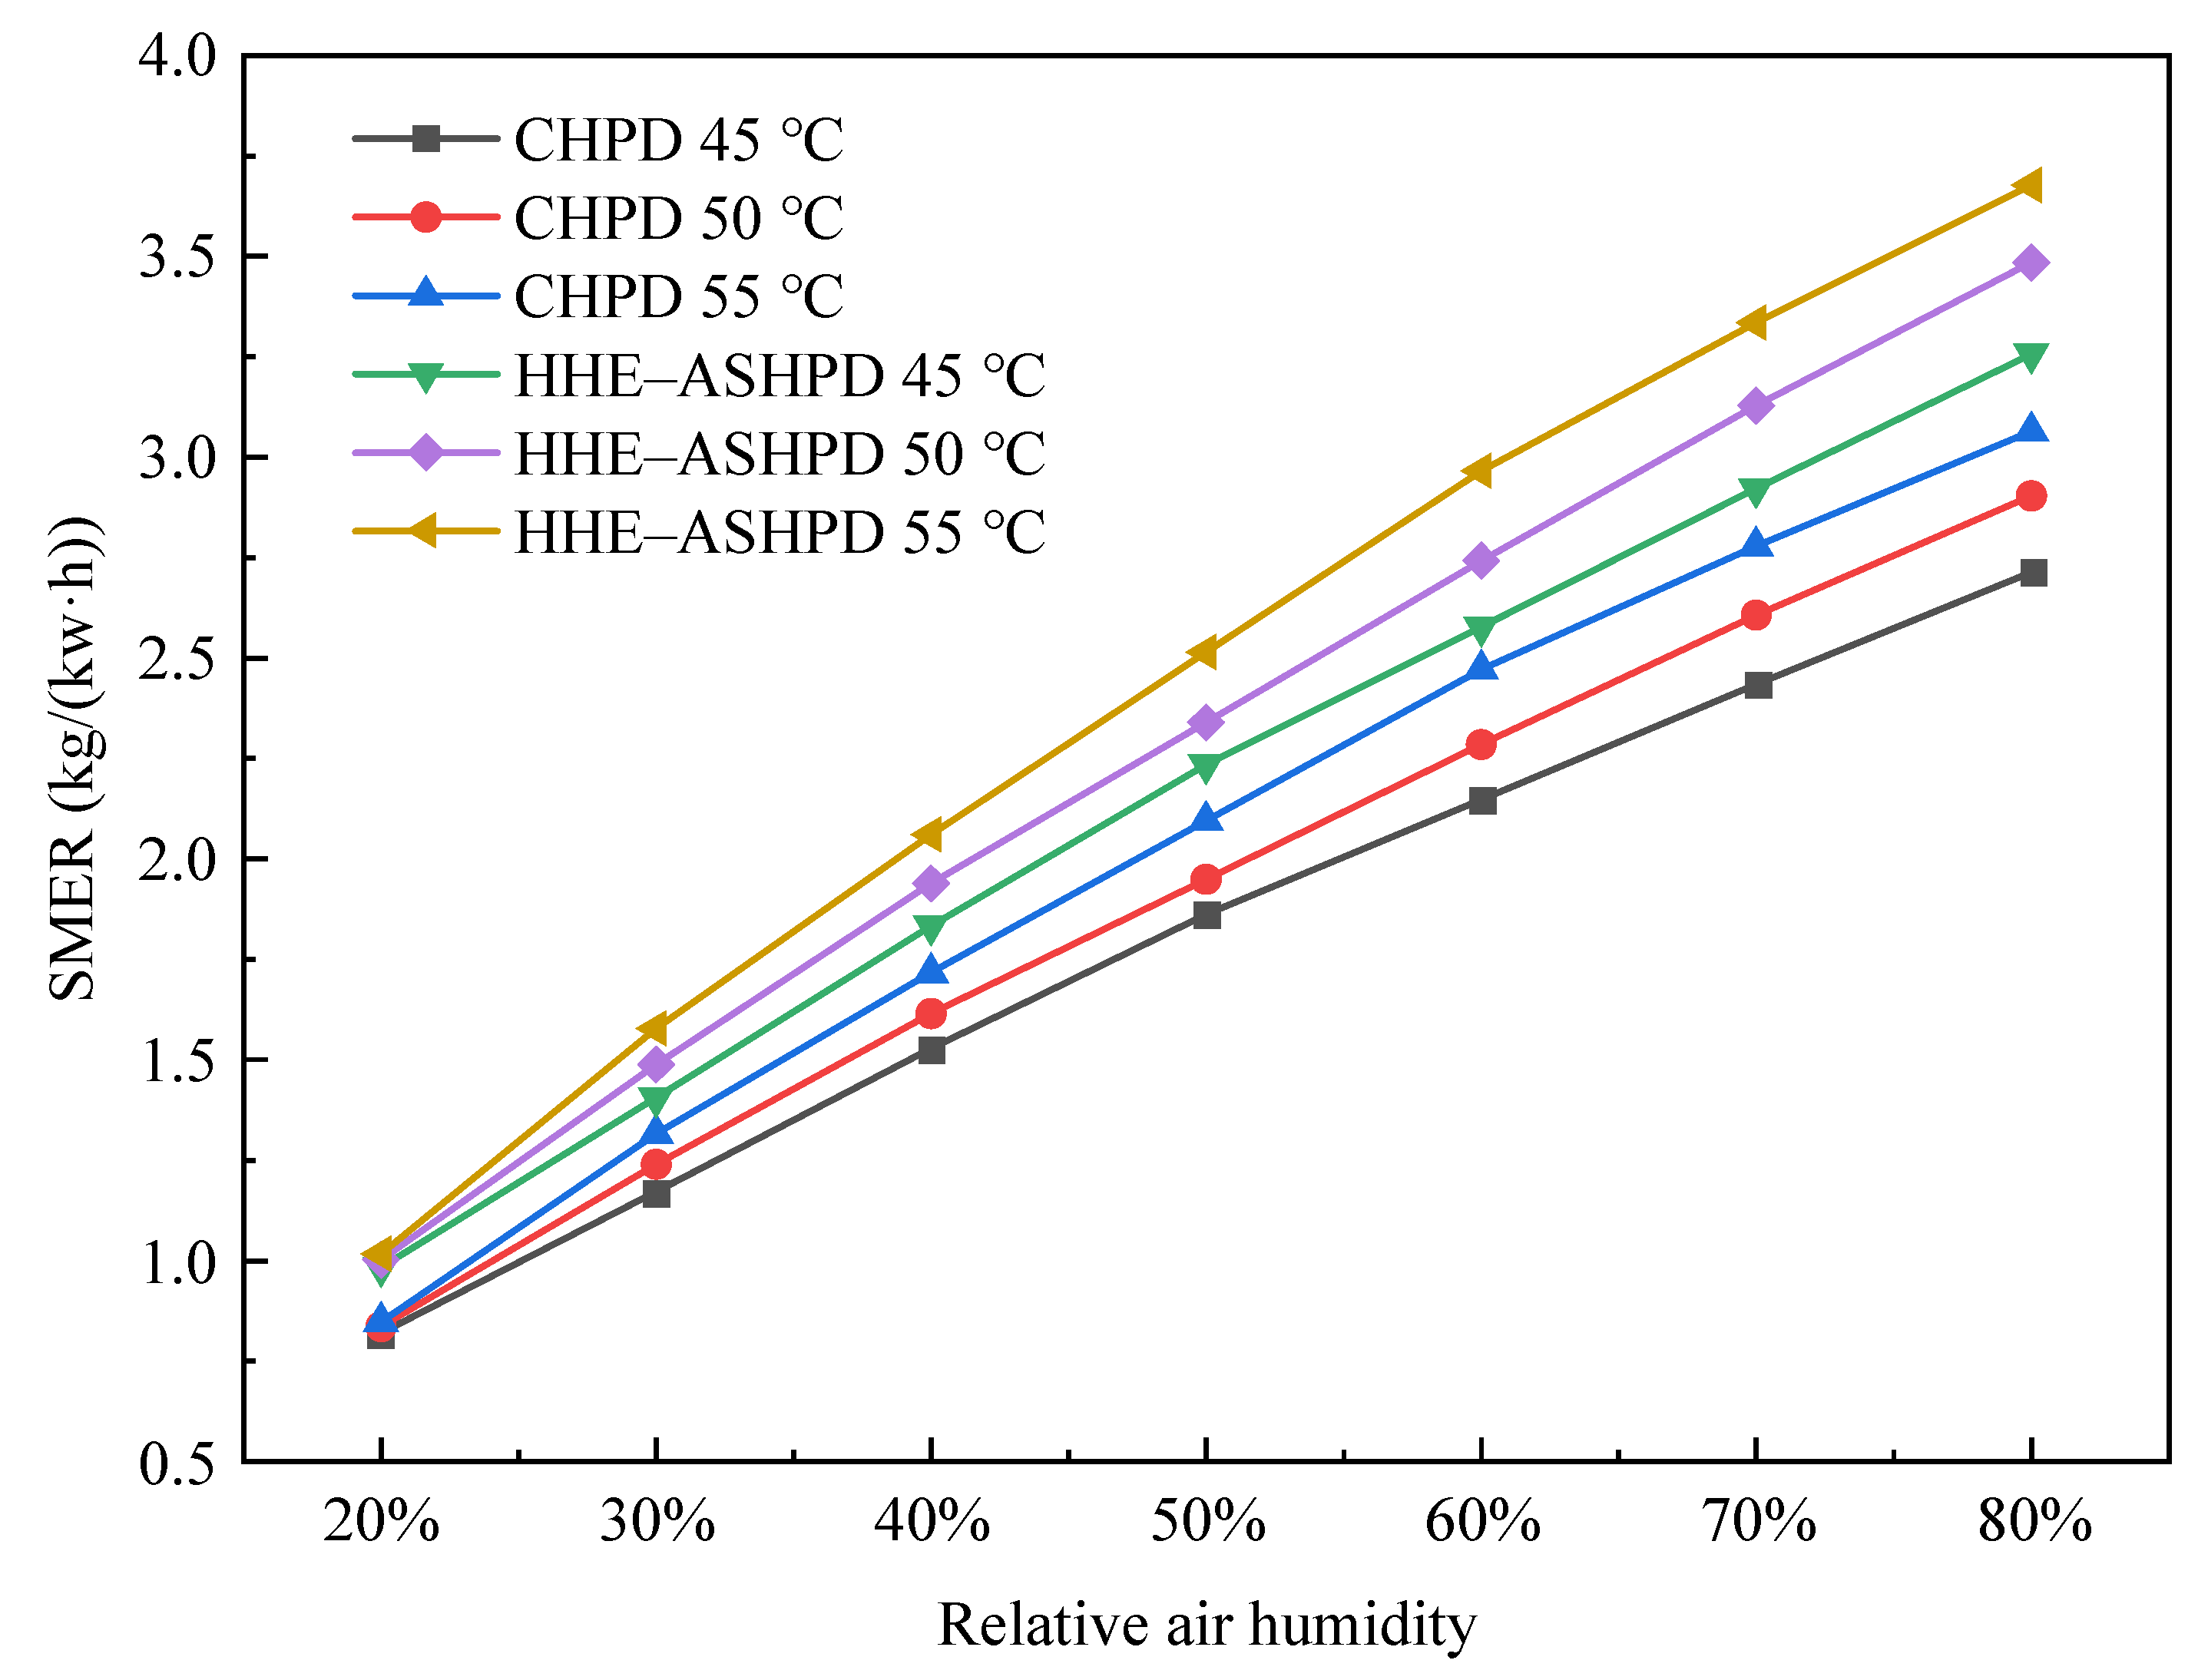
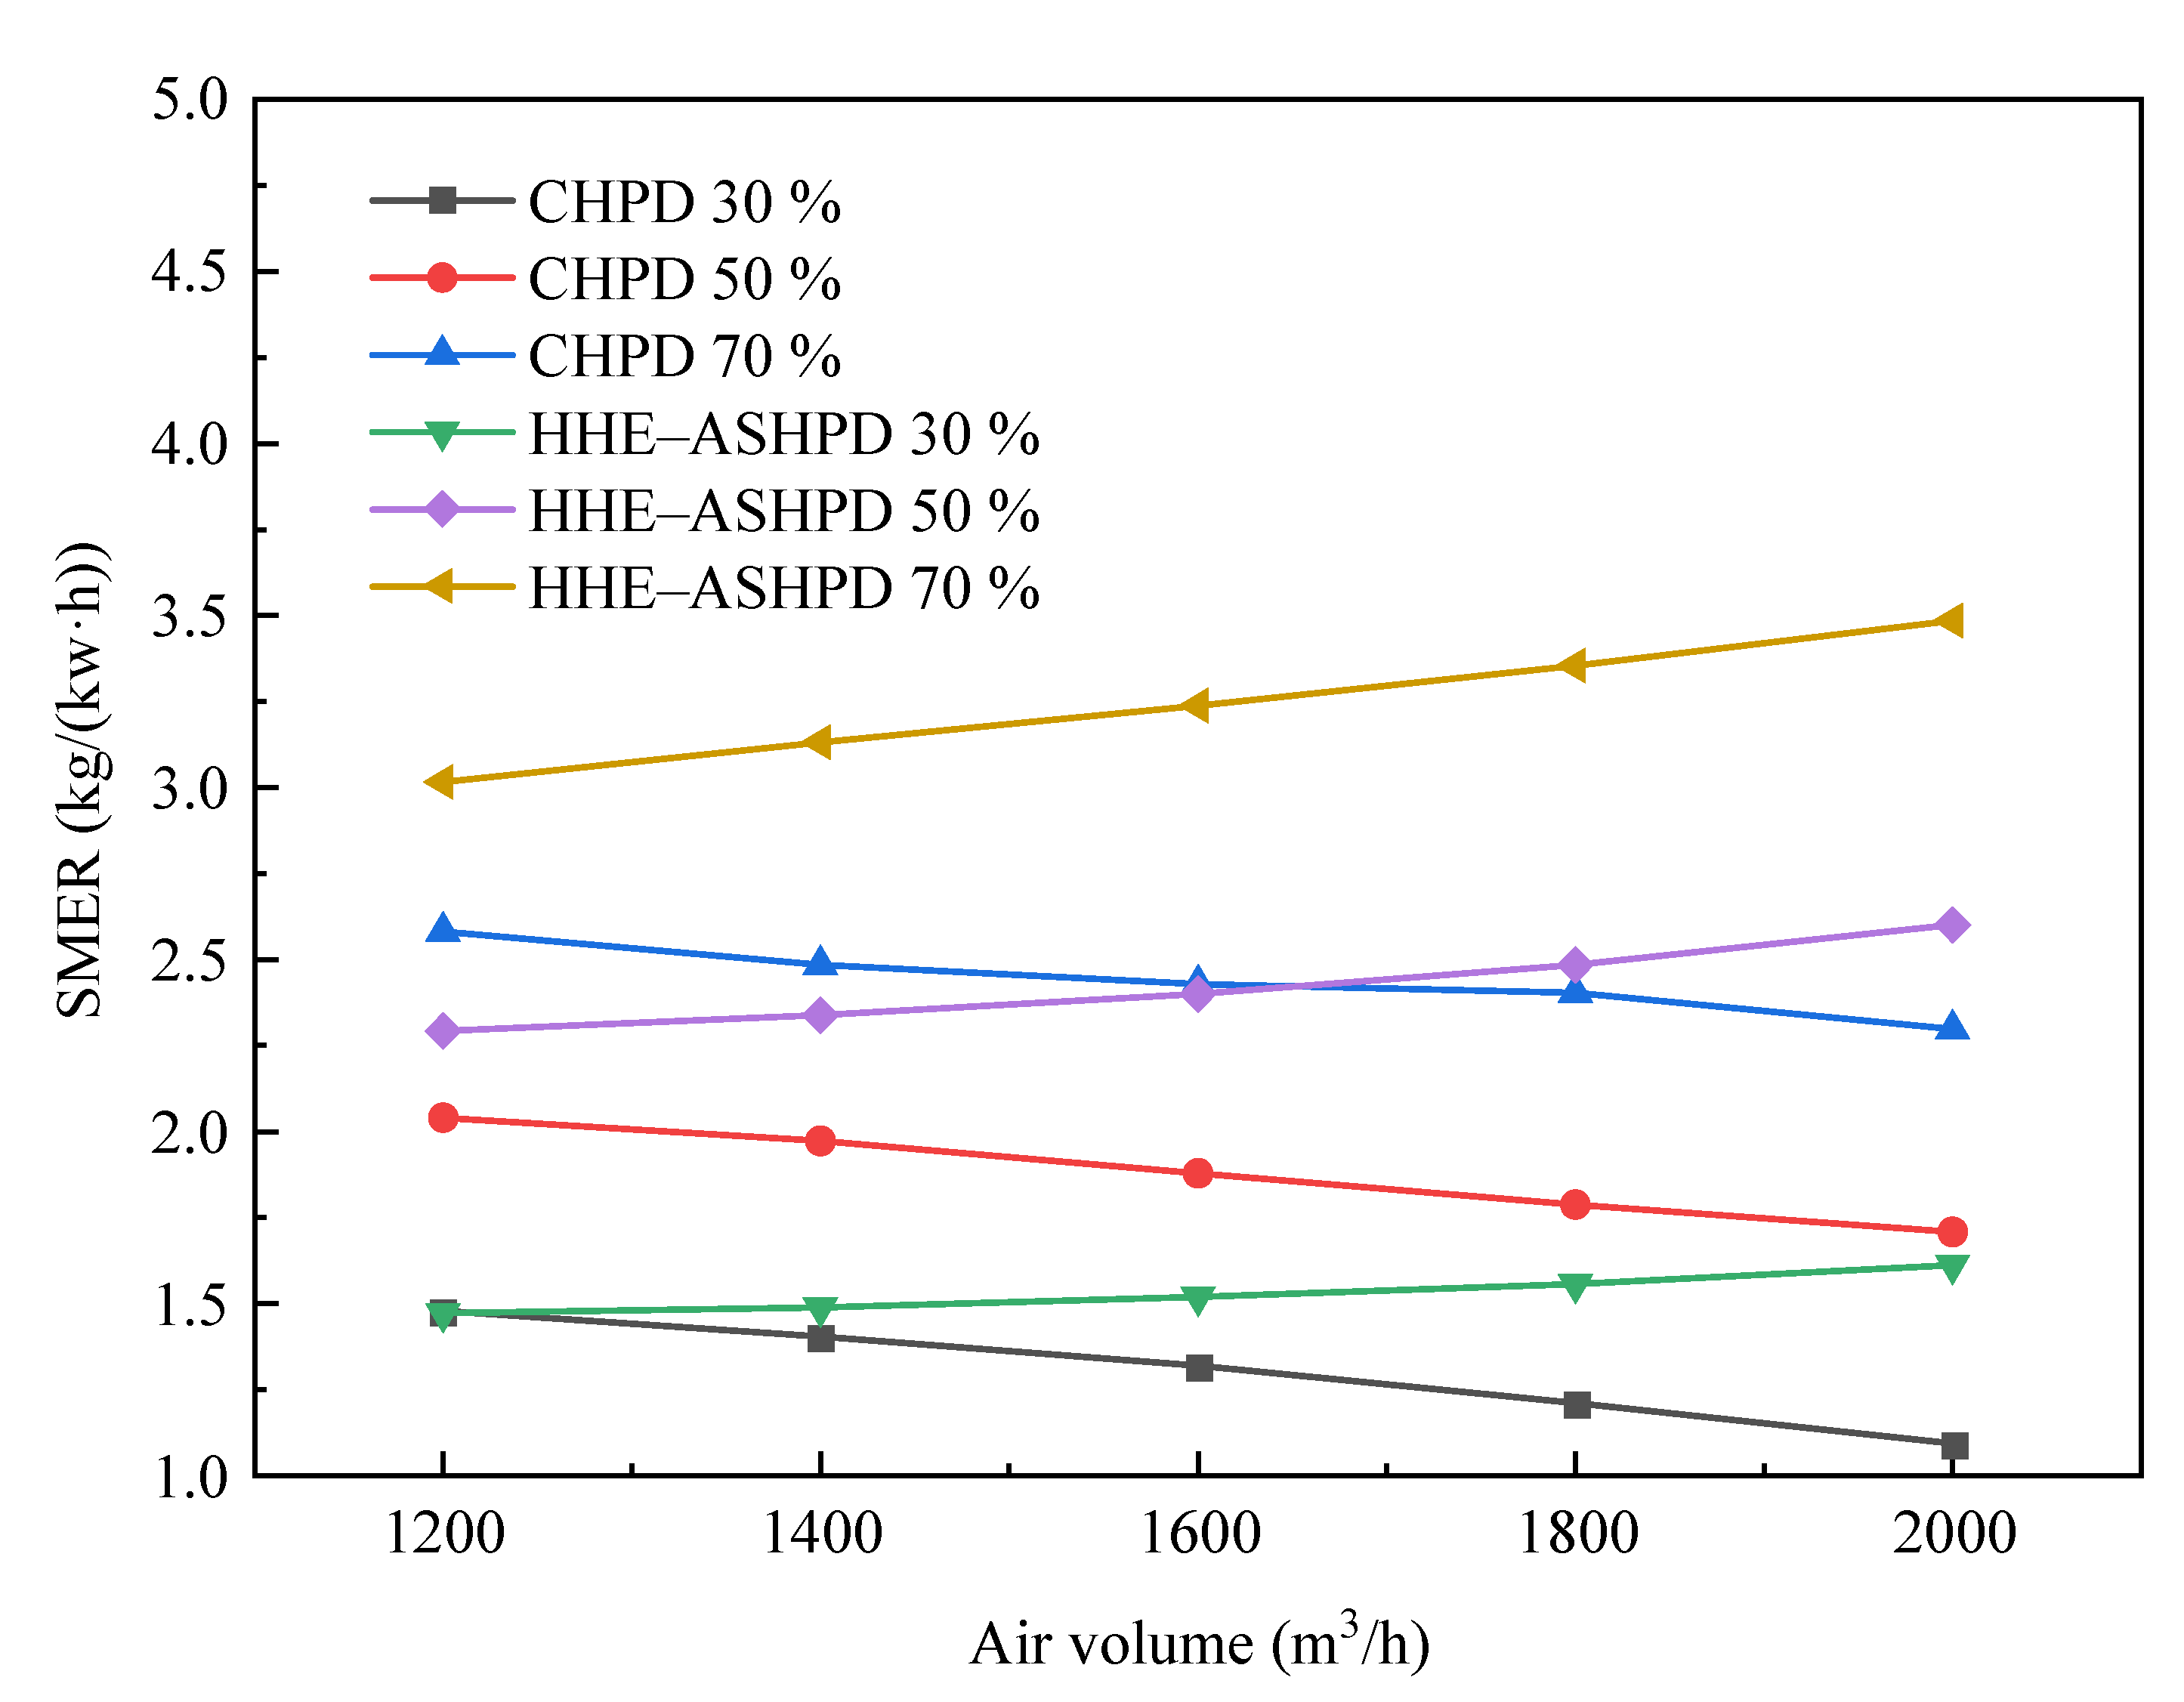
3.2. Effects of Various Air Circulation Modes on the Effectiveness of the System’s Dehumidification

System simulation was used to compare the dehumidification effectiveness of the CHPD system and HHE–ASHPD system at various drying temperatures and humidity levels and airflow of 1400 m3/h. The influence is shown in Figure 10. From the graph, the drying temperature at 50 °C and the relative humidity of the air increased from 20 to 80%, and the SMER of the CHPD system increased by 247.3%. While the SMER of the HHE–ASHPD system increased by 248.0%. When the humidity is 50% and the air temperature rises from 45 °C to 50 °C, the SMER of the CHPD system increases by 4.67%. When the air temperature is 45 °C, the air relative humidity increases from 20% to 25%, and the SMER of the CHPD system increases by 21.5%. while the SMER of the HHE–ASHPD system increases by 21.5%. When the air temperature and humidity are 50 °C and 50%, the SMER of the HHE–ASHPD system is 20% higher than that of the CHPD system. Under different air temperature conditions, as the relative humidity of the air increases, the SMER of the heat-pump drying system gradually increases, and the influence of the relative humidity of the air on the dehumidification capacity is greater than the influence of the air temperature. Under the same temperature and humidity conditions, the SMER of the HHE–ASHPD system is greater than that of the CHPD system.
The dehumidification efficiency of the CHPD and HHE–ASHPD systems under different air volumes and drying temperature of 50 °C is shown in Figure 11. When the relative air humidity is 30%, 50%, and 70%, respectively, the SMER of the CHPD system steadily declines with the air volume, falling by 26%, 16%, and 11%. The primary cause is that the dehumidification evaporator has a constant heat-exchange capacity, and moisture condensation necessitates that the air temperature is lowered to the dew-point temperature. The sensible heat generated by the air rises as the airflow through the dehumidifier evaporator increases, making it more difficult to condense water. When the relative humidity reaches 30%, 50%, and 70%, respectively, the SMER of the HHE–ASHPD system steadily rises with the air volume, rising by 9.5%, 13.4%, and 15.6%. Because this cycle of dehumidification depends on the external discharge of high-humidity air, the dehumidification efficiency increases with air volume and wet air released per unit of time.

4. Summary

The performance variations of the HHE–ASHPD system under various evaporation temperatures, vapor-injection charges, and intermediate pressures were evaluated by developing a mathematical model of each major component. To achieve the greatest system performance at this temperature, the vapor-injection charge and intermediate pressure were optimised at various evaporation temperatures; additionally, the dehumidification effectiveness of two drying modes under identical drying circumstances is contrasted. The conclusions are that:
(1)
The HHE–ASHPD system increased vapor-injection technology lowers the compressor discharge temperature while raising heating capacity and COP. The intermediate pressure of the system is positively correlated with the vapor-injection charge, and as the evaporation temperature drops, so does the intermediate pressure;
(2)
For different evaporation temperatures, the HHE–ASHPD system has a suitable vapor-injection charge to cause the system to perform at its best. When the evaporation temperature is higher than 0 °C, the optimal vapor-injection charge of the system is 12.3~13.9%. When the evaporation temperature is −15~0 °C, the optimal vapor-injection charge of the system is 13~20%. When the evaporation temperature is lower than −15 °C, the optimal vapor-injection charge of the system is 20~24%;
(3)
Under the condition of the same air volume and different air temperatures, the SMER of the heat-pump system increases gradually with the increase in air relative humidity, and the influence of relative air humidity on dehumidification capacity is greater than that of air temperature. Under the same temperature and humidity conditions, the SMER of the HHE–ASHPD system is greater than that of the CHPD system. Under the condition of the same air temperature and different air volume, the dehumidification efficiency of the CHPD system decreases with the increase in humidity, while the dehumidification efficiency of the HHE–ASHPD system increases with the increase in humidity.

Author Contributions

Investigation, Y.L.; data curation, Z.M.; writing—original draft preparation, S.D.; writing—review and editing, S.Z.; visualization, K.H.; and project administration, F.Z. and D.Z. All authors have read and agreed to the published version of the manuscript.

Funding

This work is supported by the Major Science and Technology Projects in Henan Province in 2022 (221100320100), the Discipline Strength Improvement Plan of Zhongyuan University of Tech-nology (SD202240 and GG202216), the Young Backbone Teacher of Zhongyuan University of Technology (2020XQG05), the Science and Technology Guidance Program of HNCEAS (202120, 202123, and 202124), the Science and Technology Plan Project of Housing Urban and Rural Con-struction in Henan Province (K-2145), the Scientific Research Team Development Project of Zhongyuan University of Technology (K2022TD004), and the Science and Technology Plan Pro-ject of Ministry of Housing and Urban Rural Development (2020-K-031).

Conflicts of Interest

The authors declare no conflict of interest.

Abbreviations

CHPDClosed heat-pump drying
COPCoefficient of Performance
HHE–ASHPDHeat and humidity exhausted air source heat-pump drying
SAHPDSolar-assisted heat-pump desiccators
SDSolar desiccators
SMERSpecific moisture-extraction rate (kg/(kW·h)
Symbols
aInjection ratio
AArea (m2)
BAmbient atmospheric pressure (MPa)
cConstant
CMass flow coefficient
hEnthalpy value (kJ/kg)
mMass flow rate (kg/s)
PPressure (MPa)
TTemperature (°C)
vSpecific volume (m3/kg)
WPower consumption (kW)
Greek Letters
ξMoisture-separation coefficient
ρDensity (kg/m3)
αHeat-transfer coefficient (W/(m2·°C))
Subscripts
aWet air
cCondensation
eEvaporation
hHeat-exchanger
inInlet
lWet air
outOutlet
wWall

References

  1. Minea, V. Drying heat pumps—Part II: Agro-food, biological and wood products. Int. J. Refrig. 2013, 36, 659–673. [Google Scholar] [CrossRef]
  2. Mujumdar, A.S.; Zhonghua, W. Thermal Drying Technologies—Cost-Effective Innovation Aided by Mathematical Modeling Approach. Dry. Technol. Int. J. 2008, 26, 145–153. [Google Scholar] [CrossRef]
  3. Chua, K.J.; Mujumdar, A.S.; Hawlader, M.N.; Chou, S.K.; Ho, J.C. Batch drying of banana pieces–effect of stepwise change in drying air temperature on drying kinetics and product colour. Food Res. Int. 2001, 34, 721–731. [Google Scholar] [CrossRef]
  4. Wen, X.; Li, W.; Li, W.; Chen, W.; Zhang, Z.; Wu, D.; Yang, Y. Quality characteristics and non-volatile taste formation mechanism of Lentinula edodes during hot air drying. Food Chem. 2022, 393, 133378. [Google Scholar] [CrossRef] [PubMed]
  5. Moreno, Á.H.; Aguirre, Á.J.; Maqueda, R.H.; Jiménez, G.J.; Miño, C.T. Effect of temperature on the microwave drying process and the viability of amaranth seeds. Biosyst. Eng. 2022, 215, 49–66. [Google Scholar] [CrossRef]
  6. Wu, X.; Zhang, M.; Li, Z. Influence of infrared drying on the drying kinetics, bioactive compounds and flavor of Cordyceps militaris. LWT 2019, 111, 790–798. [Google Scholar] [CrossRef]
  7. Xu, X.; Zhang, L.; Feng, Y.; Zhou, C.; Yagoub, A.E.A.; Wahia, H.; Ma, H.; Zhang, J.; Sun, Y. Ultrasound freeze-thawing style pretreatment to improve the efficiency of the vacuum freeze-drying of okra (Abelmoschus esculentus (L.) Moench) and the quality characteristics of the dried product. Ultrason. Sonochem. 2021, 70, 105300. [Google Scholar] [CrossRef]
  8. Gu, C.; Ma, H.; Tuly, J.A.; Guo, L.; Zhang, X.; Liu, D.; Ouyang, N.; Luo, X.; Shan, Y. Effects of catalytic infrared drying in combination with hot air drying and freeze drying on the drying characteristics and product quality of chives. LWT 2022, 161, 113363. [Google Scholar] [CrossRef]
  9. Zhang, M.; Tang, J.; Mujundar, A.S.; Wang, S. Trends in microwave-related drying of fruits and vegetables. Trends Food Sci. Technol. 2006, 17, 524–534. [Google Scholar] [CrossRef]
  10. Guo, Y.; Wu, B.; Guo, X.; Ding, F.; Pan, Z.; Ma, H. Effects of power ultrasound enhancement on infrared drying of carrot slices: Moisture migration and quality characterizations. LWT 2020, 126, 109312. [Google Scholar] [CrossRef]
  11. Ma, Y.; Wu, X.; Zhang, Q.; Giovanni, V.; Meng, X. Key composition optimization of meat processed protein source by vacuum freeze-drying technology. Saudi J. Biol. Sci. 2018, 25, 724–732. [Google Scholar] [CrossRef] [PubMed]
  12. Abhay, M.; Valentina, S.; Savvas, A.T. A systematic review on the recent advances of the energy efficiency improvements in non-conventional food drying technologies. Trends Food Sci. Tech. 2020, 100, 67–76. [Google Scholar]
  13. Colak, N.; Hepbasli, A. A review of heat pump drying: Part 1—Systems, models and studies. Energy Convers. Manag. 2009, 50, 2180–2186. [Google Scholar] [CrossRef]
  14. Zhu, M.; Wang, Z.; Zhang, H.; Sun, X.; Dou, B.; Wu, W.; Zhang, G.; Jiang, L. Experimental investigation of the comprehensive heat transfer performance of PCMs filled with CMF in a heat storage device. Int. J. Heat Mass. Tran. 2022, 188, 122582. [Google Scholar] [CrossRef]
  15. Wang, Z.; Zhang, H.; Dou, B.; Zhang, G.; Wu, W.; Zhou, X. Effect of copper metal foam proportion on heat transfer enhancement in the melting process of phase change materials. Appl. Therm. Eng. 2022, 201, 117778. [Google Scholar] [CrossRef]
  16. Ng, M.X.; Tham, T.C.; Gan, S.H.; Chua, L.S.; Aziz, R.; Baba, M.R.; Abdullah, L.C.; Chin, N.L.; Ong, S.P.; Law, C.L. Clinacanthus nutans Lindau: Effects of drying methods on the bioactive compounds, color characteristics, and water activity. Dry Technol. 2017, 36, 7372017–7373937. [Google Scholar] [CrossRef]
  17. Chua, K.J.; Chou, S.K.; Yang, W.M. Advances in heat pump systems: A review. Appl. Energy 2010, 87, 3611–3624. [Google Scholar] [CrossRef]
  18. Saha, B.; Bucknall, M.; Arcot, J.; Driscoll, R. Derivation of two layer drying model with shrinkage and analysis of volatile depletion during drying of banana. J. Food Eng. 2018, 226, 42–52. [Google Scholar] [CrossRef]
  19. Wang, D.; Cao, X.; Li, X.; Li, Y.; Wang, X. Experimental investigation of a part air dehumidification cascade-like heat pump drying system. Int. J. Refrig. 2021, 131, 235–243. [Google Scholar] [CrossRef]
  20. Perna, R.; Abela, M.; Mameli, M.; Mariotti, A.; Pietrasanta, L.; Marengo, M.; Filippeschi, S. Flow characterization of a pulsating heat pipe through the wavelet analysis of pressure signals. Appl. Therm. Eng. 2020, 171, 115128. [Google Scholar] [CrossRef]
  21. Yu, Q.; Ming, L.; Reda, H.E.H.; Wang, Y.; Luo, X.; Yu, Q. Performance and operation mode analysis of a heat recovery and thermal storage solar-assisted heat pump drying system. Sol. Energy 2016, 137, 225–235. [Google Scholar]
  22. Salih, C.; İbrahim, D.; Cüneyt, T.; Erdoğan, S. Investigation of drying kinetics of tomato slices dried by using a closed loop heat pump dryer. Heat Mass Transf. 2017, 53, 1863–1871. [Google Scholar]
  23. Jeyaprakash, S.; Frank, D.C.; Driscoll, R.H. Influence of heat pump drying on tomato flavor. Dry Technol. 2016, 34, 1709–1718. [Google Scholar] [CrossRef]
  24. Yahya, M.; Fudholi, A.; Hafizh, H.; Sopian, K. Comparison of solar dryer and solar-assisted heat pump dryer for cassava. Sol. Energy 2016, 136, 606–613. [Google Scholar] [CrossRef]
  25. Hao, W.; Zhang, H.; Liu, S.; Mi, B.; Lai, Y. Mathematical modeling and performance analysis of direct expansion heat pump assisted solar drying system. Renew. Energy 2021, 165, 77–87. [Google Scholar] [CrossRef]
  26. Chua, K.J.; Chou, S.K.; Ho, J.C.; Mi, B.; Lai, Y. Heat pump drying: Recent developments and future trends. Dry Technol. 2002, 20, 1579–1610. [Google Scholar] [CrossRef]
  27. Du, A.; Long, J. Heating performance of a novel two-stage evaporator air-source heat-pump for drying applications. Dry Technol. 2022, 40, 1356–1368. [Google Scholar] [CrossRef]
  28. Direk, M.; Tunckal, C.; Yuksel, F. Comparative performance analysis of experimental frigorific air conditioning system using R-134a and HFO-1234yf as a refrigerant. Therm. Sci. 2016, 20, 2065–2072. [Google Scholar] [CrossRef] [Green Version]
  29. Nhut, L.M.; Hien, H.T.T.; Park, Y.C. A Study on the Effect of the Weather Conditions on the Performance of the Solar Assisted Heat Pump Drying System for Red Chili. In Proceedings of the 2019 International Conference on System Science and Engineering (ICSSE), Dong Hoi, Vietnam, 19–21 July 2019. [Google Scholar]
  30. AHRI Standard 540; Performance Rating of Positive Displacement Refrigerant Compressors and Compressor Units. AHRI Standard: Arlington, TX, USA, 2015.
  31. Wil, D.D. The measurement of expansion valve capacity. Refrig. Eng. 1935, 8, 1–81. [Google Scholar]
  32. Turaga, M.; Guy, R.W. Refrigerant side heat transfer and pressure drop estimates for direct expansion coils. Int. J. Refrig. 1985, 8, 134–142. [Google Scholar] [CrossRef]
  33. Xu, S.; Ma, G.; Liu, Q.; Liu, Z. Experiment study of an enhanced vapor injection refrigeration/heat pump system using R32. Int. J. Therm. Sci. 2013, 68, 103–109. [Google Scholar]
  34. Gorbunova, A.; Korablev, V.A.; Zarichnyak, Y. Calculation of thermophysical properties of slab laser multi-component gas medium. J. Sci. Tech. Inf. Technol. Mech. Opt. 2020, 126, 277–282. [Google Scholar]
Figure 1. Schematic diagram of the heat-pump drying system with double evaporator.
Energies 15 09542 g001
Figure 2. Double evaporator heat-pump drying system refrigeration cycle: (a) P-h; (b) T-s.
Energies 15 09542 g002
Figure 3. One-dimensional flow heat-transfer model of heat-exchanger.
Energies 15 09542 g003
Figure 4. Algorithm flow chart of the influence of vapor-injection charge on the performance of heat-pump drying system.
Energies 15 09542 g004
Figure 5. Flow chart of wet air mode solution.
Energies 15 09542 g005
Figure 6. Influence of vapor-injection charge on the heating capacity of the HHE–ASHPD system.
Energies 15 09542 g006
Figure 7. Influence of vapor-injection charge on the compressor power consumption of the HHE–ASHPD system.
Energies 15 09542 g007
Figure 8. The effect of vapor-injection charge on the COP of the HHE–ASHPD system.
Energies 15 09542 g008
Figure 9. Effect of vapor-injection charge on exhaust temperature.
Energies 15 09542 g009
Figure 10. The influence on the SMER of two drying modes under different drying temperatures and humidity.
Energies 15 09542 g010
Figure 11. Effects of air volume and relative humidity on the two circulation modes.
Energies 15 09542 g011
Publisher’s Note: MDPI stays neutral with regard to jurisdictional claims in published maps and institutional affiliations.

