Article

Experimental and Numerical Investigation of the Non-Reacting Flow in a High-Fidelity Heavy-Duty Gas Turbine DLN Combustor

1
Key Laboratory for Thermal Science and Power Engineering of Ministry of Education, Department of Energy and Power Engineering, Tsinghua University, Beijing 100084, China
2
China United Gas Turbine Technology Co., Ltd., Beijing 100029, China
*
Author to whom correspondence should be addressed.
Energies 2022, 15(24), 9551; https://doi.org/10.3390/en15249551
Submission received: 4 November 2022 / Revised: 8 December 2022 / Accepted: 10 December 2022 / Published: 16 December 2022

Abstract

:
A dry, low-NOx (DLN) combustor for a heavy-duty gas turbine using lean premixed technology was studied. A high-fidelity test model was built for the experimental study using particle image velocimetry (PIV). The non-reacting flow in the DLN combustion chamber was investigated experimentally and numerically. The numerical results are in good agreement with the experimental data. The results show that recirculation zones were formed downstream of each swirl nozzle and that the flow pattern in each section was self-similar under different working conditions. For two adjacent swirl nozzles with opposite swirling directions, the entrainment phenomenon was present between their two flows. The two flows gradually mixed with each other and obtained a higher speed. If the two adjacent swirl nozzles had the same swirling direction, then the mixing of the two flows out of the nozzles was not present, resulting in two separate downstream recirculation zones. The interaction of swirling flows out of different nozzles can enhance the turbulent fluctuation inside the combustion chamber. Based on the analysis of the recirculation zones and turbulent kinetic energy (TKE) distribution downstream of each nozzle, it can be found that nozzle coupling results in stronger recirculation and turbulent mixing downstream counterclockwise surrounding nozzles.

Highlights

A dry low NOx combustor for a heavy-duty gas turbine using lean premixed technology was studied, and a high-fidelity test model was built.
PIV technology was applied to measure the cold flow field in the high-fidelity test model.
Multi-nozzle coupling phenomena inside the DLN combustor chamber were analyzed based on the experimental and numerical results.

1. Introduction

Pressure from strict regulations on pollutant emissions has pushed the designers and manufacturers of gas turbine combustors to develop environmentally friendly and efficient combustors. NOx emissions are considered as one of the main pollutants, and the advent of dry low NOx (DLN) technology has provided a viable means for reducing NOx emissions [1]. The principle of the DLN approach is to burn a substantial portion of the injected fuel at a lean premixed condition to prevent high-temperature zones from forming [2], since the production of NOx emissions rates scale exponentially with the combustion temperature [3].
However, premixing the reactants before combustion results in fluctuations in the flow field, which, in turn, interact with the pressure field, resulting in various kinds of combustion instabilities [2,4]. Swirl-stabilized flame technology is one of the most effective techniques for the lean premixed combustion, especially for gas turbine combustors. The breakdown of the vortex formed from the swirling flow exiting the premixer tube, along with the sudden expansion in the liner resulting in the required recirculation zones, are mechanisms for flame stabilization [2,5]. The flow in the recirculation zones transports the burned gas to the flame root, resulting in the mixing of hot burned gas and radicals with the fresh gas and leading to continuous ignition and flame stabilization [6,7].
Therefore, the swirling flow in the combustor directly affects the stability and emission characteristics of gas turbine combustors. In the past few decades, many researchers have invested large amounts of effort into understanding swirling flow. Although experiments under real working conditions would show more accurate data, such experiments are much too difficult and costly due to the high-temperature and high-pressure conditions. Thus, non-reacting cold flow tests are commonly used that can possibly characterize the real reaction conditions [8]. Non-intrusive laser measurement techniques, such as particle image velocimetry (PIV), can acquire planar velocity or stereo information without influencing the flow field and have thus been widely used in swirling flow investigation. In addition, the computational fluid dynamics (CFD) method is also commonly used in this area to bridge the gaps in experiments, and the experimental data acquired can be used to verify and validate the results from the CFD method.
Two main principles gas turbine combustor concepts have evolved over time: the annular can combustor and the annular combustor [9]. Although the annular combustor requires much less cooling air due to its smaller surface area than that required by the annular can combustor, the development of an annular combustor for industrial heavy-duty gas turbines is quite difficult and costly due to its large size. For annular can combustors, many cylindrical cans are located circumferentially. Each can is relatively independent from the others, allowing for modular designs. Thus, annular can combustors re commonly adopted for the large-size industrial heavy-duty gas turbines. An annular can DLN combustor has a set of multi-premixer modules located on the headend of each can, and each premixer module contains a nozzle with a swirler and a premixer tube [2,5]. The premixer tubes are part of the cap assembly [5]. The number of modules and the swirling direction for each module can vary, making the flow structures in the liner complex and worthy of exploration.
Many researchers have focused on the cold flow inside a single-premixer module. For example, the impact of confinement [8,10,11], fuel spray [10], outlet contraction [12] and swirl number [13] on the flow have been discussed based on the experimental data. Strakey and Yip [14] carried out a two-dimensional (2D) PIV experiment under the cold flow condition for a swirl-stabilized, land-based gas turbine combustor; a numerical study using large-eddy simulation (LES) and Reynolds-averaged Navier–Stokes (RANS) methods was conducted, and the results compared with the experimental data. Reichling et al. [15] calculated the three-dimensional (3D) non-reacting turbulent flow of a swirled gas turbine combustor model; the numerical results were compared with the measurement data, and a comparison between the non-reacting and reacting flow fields was conducted. Gomez-Ramirez et al. [16] performed flow-field measurements at both isothermal and reacting conditions; the representative results suggest that the flame location follows the location of the maximum isothermal turbulent kinetic energy. Park et al. [17] measured the flow fields with the planar PIV for non-reacting and reacting flows in a lean, premixed and swirl-stabilized can combustor, and the results of non-reacting and reacting flows were compared.
More recently, Jhon Pareja et al. [18] studied the non-reacting turbulent flow field characteristics of a piloted premixed Bunsen burner designed for operational at elevated pressure conditions using high-speed PIV. The findings show that similar levels of turbulence intensities and turbulent length scales were obtained at varied pressures and bulk velocities with turbulent Reynolds numbers up to 5300. Fujun Sun et al. [19] presented laser diagnostic experiments and numerical simulations of the flow fields and fuel/air premixing uniformities of S30 (injector with swirler-vanes angle of 30°) and S40. The results show that the axial size and the radial size of main recirculation zone (MRZ) of S30 are both smaller than those of S40, which can decrease residence time and is beneficial to NOx reduction for S30. Kyle Twarog et al. [20] presented the method by which a high-quality Time-Resolved Particle Image Velocimetry (TR-PIV) two-dimensional velocity dataset was established for a counter-turning multi-swirlers (CTS) mixer. Proper Orthogonal Deconvolution structure analysis was also presented for the dominant modes. Dmitriy K. Sharaborin et al. [21] investigated the turbulent transport and fuel mixing under nonreacting conditions for a model gas-turbine swirl burner based on a design by Turbomeca. The data were processed using the POD method to extract coherent flow structures and quantify large-scale variations in the concentration produced by them.
Although research on single-module design is important, it cannot reflect the complex interaction phenomena between the modules inside each can. Thus, multi-module coupling effects should be studied.
Based on our survey, multi-nozzle coupling effects in the annular combustor, which are mainly used in aircraft derivatives, have been discussed in the literature. The numerical/experimental study by Cordier et al. [22] discussed the effect of nozzle spacing on ignition characteristics. Worth and Dawson [23] reported on the effect of nozzle spacing on azimuthal thermoacoustic instabilities. Kao et al. [24] conducted a study of non-reacting flow in which the nozzle spacing was changed in a linear array of five nozzles. The study, conducted using Laser Doppler Velocimetry (LDV), showed averaged velocity fields for the mid-plane with five different spacings. The study noted that the size of the central recirculation zone alternated between small and large along the swirler array. A numerical study on swirler interactions by Cho et al. [25] focused on NOx formation as a function of distance between two industrial swirl-stabilized nozzles. Other past studies have used experiments [26] or numerical simulations [23] to study combustion oscillations in annular combustors with multiple nozzles. It is evident that nozzle interaction strongly affects the performance of a combustion nozzle, potentially modifying the performance that can be expected based on single-nozzle tests [27].
However, there are few studies focusing on the multi-module coupling effect inside the cans of annular can DLN combustors. In this paper, an annular can DLN combustor for a 300 MW F-class heavy-duty gas turbine using the lean premixed technology was developed. The cold flow field of a can with a sectorial external shell was measured using a high-fidelity test model and PIV technology, and the interaction between the swirling flows inside the can was studied. To the authors’ knowledge, the swirl coupling effect inside cans of a real annular can DLN combustor has not been discussed before, and this is also the first application of a 2D PIV system performing velocity measurements on a high-fidelity industrial test model in China. PIV measurements of fully featured industrial annular can combustors are not commonly reported in the literature due to the high level of measurement complexity. Demonstrating the application of this experiment is therefore one of the aims of this work. To supplement the experiment data, numerical simulation was performed, and the numerical results agree with the experimental data well. The characteristics of the swirling flow inside the can are discussed in detail.
This paper is organized as follows. Section 2 describes the experimental and numerical methods. Section 3 shows the results and discussion. Finally, Section 4 draws the conclusions.

2. Materials and Methods

2.1. The High-Fidelity DLN Combustor Test Model for a Heavy-Duty Gas Turbine

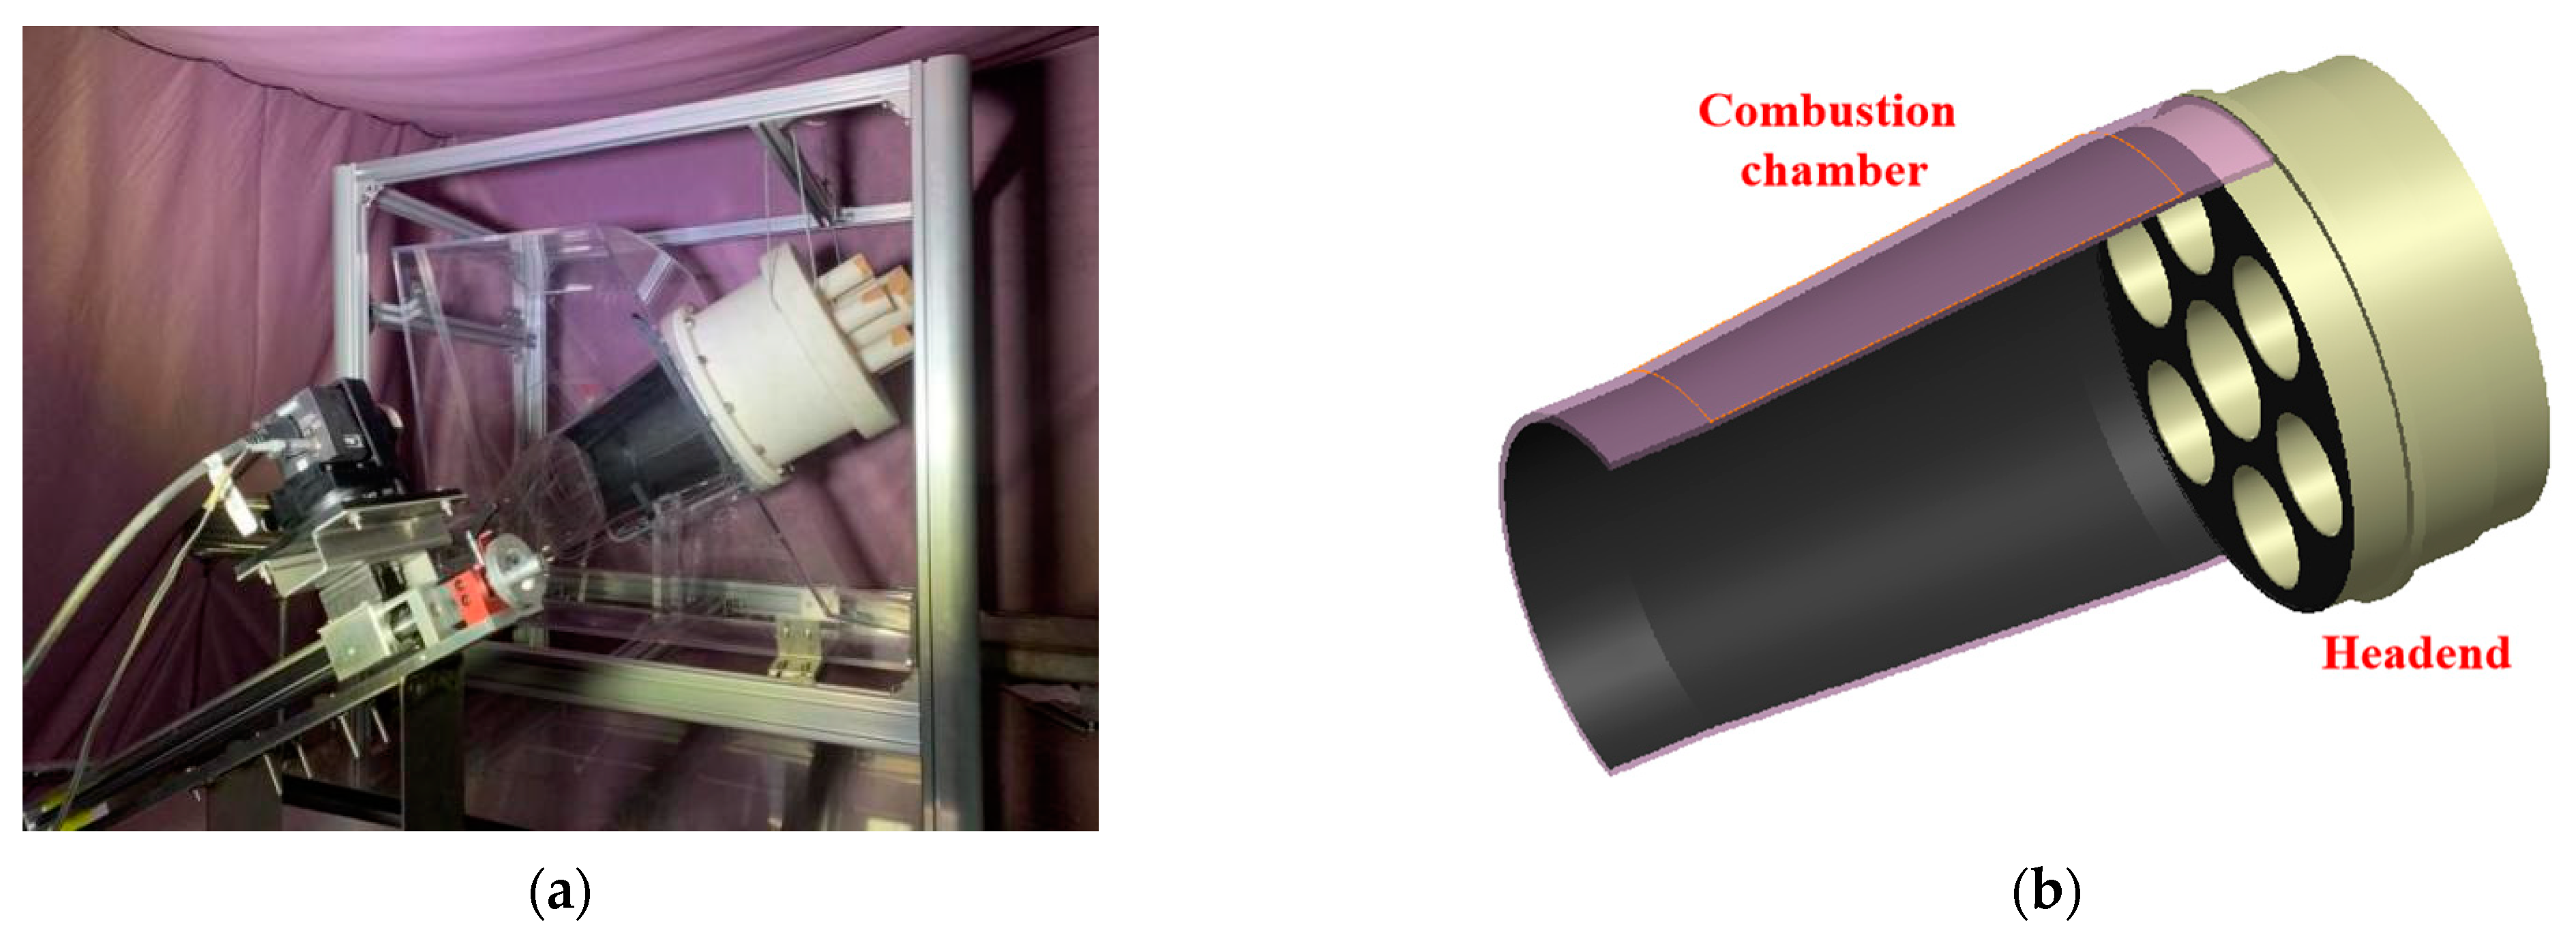
An annular can DLN combustor for a 300 MW F-class heavy-duty gas turbine using lean premixed technology was studied. In order to investigate the non-reacting cold flow dynamics in the liner, a high-fidelity single-can test model was proposed here for PIV measurement, as shown in Figure 1. The test model mainly consisted of the external shell, headend, swirl nozzles, can (combustion chamber) and transition piece. Except for the headend and swirl nozzles, other parts were made of transparent material. The external shell was made of polymethyl methacrylate (blue in the Figure 1c) with a side window made of quartz glass (purple in the Figure 1c), and the combustion chamber and tail window were also made of quartz glass (purple in the Figure 1c) due to the requirement of ultraviolet light transmission, which is important for the subsequent fuel/air mixing field measurement experiment. There were 7 swirl nozzles assembled on the headend; nozzles 2 and 5 swirled clockwise and the rest swirled counterclockwise, as shown in Figure 1b. All parts were manufactured by 3D printing and manually assembled. One should note that the can casing with impingement cooling holes was removed, since the test was in the ambient temperature condition and cooling was not needed. A slightly modified sectorial external shell was used to reduce the manufacturing effort and the workload of modifying the test rig. Based on the CFD analysis, these modifications had little influence on the flow characteristics, and the experiment based on this model can reflect the real flow phenomenon inside the real can.
The combustor uses a reverse-flow design. The air from the wind tunnel first enters the external shell and enters the headend through the annular inlet. The swirler assembled in the premixing tube generates swirling flows with different directions. The seven streams of swirling flows couple with each other in the combustion chamber, then travel through the transition piece and leave the combustor.
The side door of the external shell can be opened, and the headend with the swirl nozzles can be removed. The design of these two components is vital for successful PIV investigation. On the one hand, TiO2 was used as tracer particles in this experiment; the windows, headend and chamber were contaminated after measuring each section. The side door and removable combustor headend design enables the cleaning of the windows, headend and chamber. On the other hand, the design of the two parts makes it possible to spray black matte paint on the headend and the chamber’s inner face to eliminate flare and blooming; further discussion of this design can be found in Section 2.3.
The tail window on the transition piece was designed according to the light path. The tail window was located on the axis of the combustor, perpendicular to the axial direction, and its position was carefully chosen to achieve the maximum measuring area. This design is innovative because it partially solves the problem of transition piece blockage. The geometric relationship between the tail window and the combustion chamber is shown in Figure 2.

2.2. PIV Measurement Scheme

Due to the complex structure of the test model, it was difficult to carry out the stereo PIV experiment. The 2D-PIV method was selected in this study to obtain the velocity of the cross-sections and longitudinal sections in the combustion chamber.
When measuring cross-sections, the laser penetrated the combustion chamber from the side window, and the camera was placed behind the tail window. The laser plane is perpendicular to the camera, as shown in Figure 3a. The laser passed through three layers of glass to reach the camera, which recorded the particle signal. The cross-section measuring scene is shown in Figure 3b.
When measuring longitudinal sections, the laser enters the combustion chamber through the tail window, and the camera captures images from the side window. The laser needs to penetrate the tail window, and the particle scatter on the longitudinal sections needs to pass through the combustion chamber and side window to enter the camera. Therefore, the laser also needs to pass through three layers of glass. The longitudinal section measuring scene is shown in Figure 3c.
In this paper, 8 cross-sections and 9 longitudinal sections were measured. The cross-section positions H1–H8 are shown in Figure 4a, and longitudinal sections Z1–Z9 are shown in Figure 4b. The cross-sections were parallel to the xy plane, while the longitudinal sections were parallel to the xz plane. The longitudinal section crossed each nozzle’s center to prove the generation of recirculation zones.

2.3. Auxiliary Systems

The air was supplied by two fans in this experiment, as shown in Figure 5a. Fan 1 blows the air into the system and fan 2 draws the air out of the system. Only fan 2 is used when the air flow required for the experiment is less than 1 kg/s, and all fans are used when the air flow required is larger. The air drawn out of the system produces less vibration than the air blown in. Moreover, when only the suction fan works, the internal and external pressure of the model’s external shell is basically the same, which reduces the strength requirements of the shell and lowers the risk of damage. Between the pressure-stabilizing chamber and the contraction segment, there is a honeycomb which serves to stabilize the flow, as shown in Figure 5b.
Seeding of tracer particles was achieved using an air compressor and a fluidized-bed-type solid particle seeder. TiO2 particles with diameters of 0.3 μum were selected for tracing. For the measurement data, Rep ≤ 0.65 was found; thus, the slip velocity could be calculated based on the assumption of Stokes flow [28]. The results show the uncertainty due to slip to be negligible. In the early stage of the experiment, liquid particles, such as olive oil and glycerin hydrate, were tested as tracer particles, but the measurement was not successful. This is because the laser needs to pass through 3 layers of glass to record the particle scatter, and multiple reflections on the glass surface will reduce the energy of the laser and scatter, causing a lower signal-to-noise ratio. The reflectivity of solid particles is higher than that of liquid particles, so the scatter obtained is much stronger, offering much better data quality. However, the use of solid particles also has disadvantages. During the experiment, TiO2 particles can quickly contaminate the windows of the experiment model and whiten the measuring background. Therefore, the experiment model needs to be cleaned after each section measurement to ensure the quality of the data.
In the PIV measurement system, a NEWWAVE Nd: YAG laser pulse system was selected to provide the laser beam, the maximum output energy of which was 200 mJ/Pulse. The resolution of the camera was 2048*2048. A Nikon 28 mm F/2.8D lens was used. The time interval between two frames was 10 μs, and the shooting frequency was 3 Hz. Because of the use of solid particles, the number of photos obtained per shot was limited by the contamination of the experiment model. The average results of 50, 80 and 100 transient velocity field results were very close, as shown in Figure 6. This indicates that average of 100 transient results was sufficient for mean velocity field acquisition.
Shading measures were established to control the ambient light and background scatter. Because the light path penetrates multiple layers of glass, and the experiment model is transparent except for the headend, PIV measurement needs to be carried out in a shading tent; otherwise, the ambient light will be scattered inside the experiment model, resulting in saturation. The inside of the shading tent is shown in Figure 7. In addition to setting the shading tent on the periphery of the experiment model, the background of the experiment model also needs to be blacked-out for PIV measurement. Black matte paint was sprayed on the background to absorb the excess laser energy, preventing it from influencing the quality of the data. Brend et al. [29] used the polarization control of background scatter in another PIV experiment for combustor. Although the shading measures provided in this paper are simpler, the assembly of the model parts should be carefully designed to provide the operational space needed for spraying.
The difficulties encountered in the experiment were multifaceted. All the model components were carefully designed for 3D printing because the inner structure of the combustor is very complex. The difficulty of implementing the optical measurement scheme is greatly increased because the laser needs to pass through multiple layers of glass, and the area of the sections to be measured is large. The addition of seeding particles to the flow has a contamination effect on the windows. The saturation and blooming phenomena used to be a huge problem before implementing shading measures. Despite all these challenges, the researchers in this study managed to overcome all the difficulties and successfully conducted a PIV measurement experiment of a high-fidelity, multi-nozzle DLN combustor for the first time. The velocity data obtained in this study provide validation for the development of CFD tools, and the experiment experience gained in this study can offer guidance for other similar experiments in the field.
As for the uncertainty, the laser could have a time uncertainty of 500 ps between frames. Because the time interval between frames was 10 μs, this error reached 500 ps/10 μs = 0.005%; for the 2048*2048 camera we used, the 1–2 pixels on the edge could bring an error of 4/2048 = 0.2%; the error caused by the following behaviors of particles was less than 1% after analyzing the forces exerted on the particles in the flow; the error caused by the software calculation was less than 1% as the particles were evenly distributed in the flow. The SRSS (Square Root of Summation of Squares) of these errors was 1.43%, which could be regarded as the PIV uncertainty.

2.4. Numerical Method

Numerical investigation was performed in this study in order to acquire a deeper understanding of the flow inside the combustion chamber. STARCCM + was used as the mesh generator and FLUENT as the solver. The realizable k-ε turbulence model was adopted.
Two geometry models were studied in this study, namely the overall model and the partial model. In the overall model, the computational domain was perfectly consistent with the experimental model, with 58.25 million tetrahedron cells. In the partial model, the complex structure of plenum and headend was removed to simplify the computational domain, and the premixing tube was prolonged to ensure a completely developed turbulence upstream the swirler. The cell number in the partial model dropped to 51.86 million. The two selected models are shown in Figure 8.
The partial model was built because, in the overall model’s calculation, the plenum and headend can distribute the air flow evenly to the surrounding nozzles. The surrounding nozzle mass ratio fluctuated within −3.1%~2.94% of the average, and the central nozzle mass ratio was 9.99% larger than the average value of surrounding nozzles, as shown in Table 1.
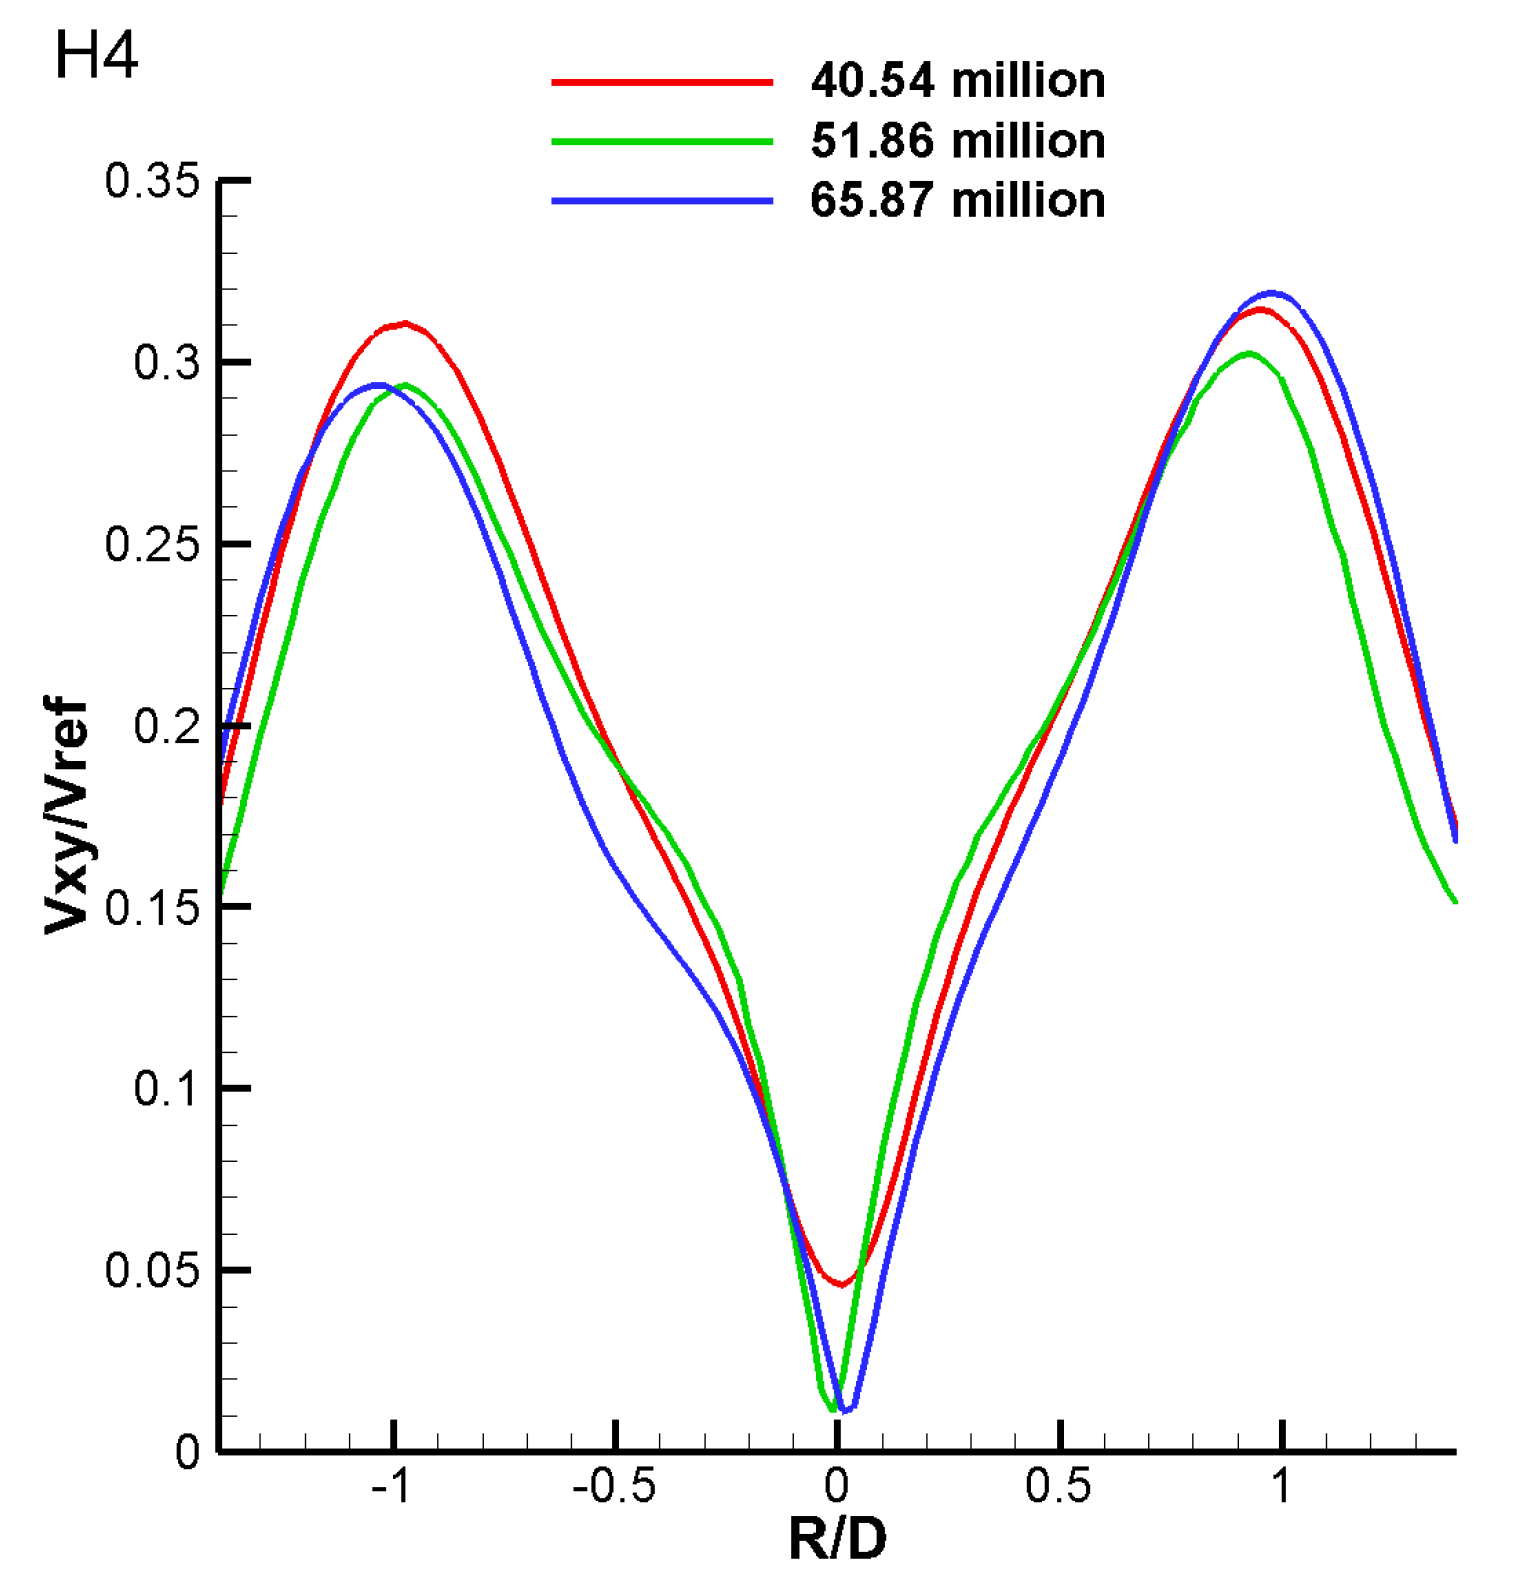
In order to testify the grid independence, 3 different meshes were built for the partial model under the separate cell base sizes 0.22 mm, 0.2 mm and 0.18 mm. The total cell numbers for these meshes are 40.54 million, 51.86 million (mentioned above) and 65.87 million. In addition, 2-D velocity distributions on a selected diameter on H4 were used to compared with each other, as shown in Figure 9. The mesh with 51.86 million cells was sufficient for the simulation since the compared results were close to each other. (Vxy stands for velocity on the xy plane, Vref stands for the velocity magnitude in the premixing rube and D stands for the diameter of the central nozzle).
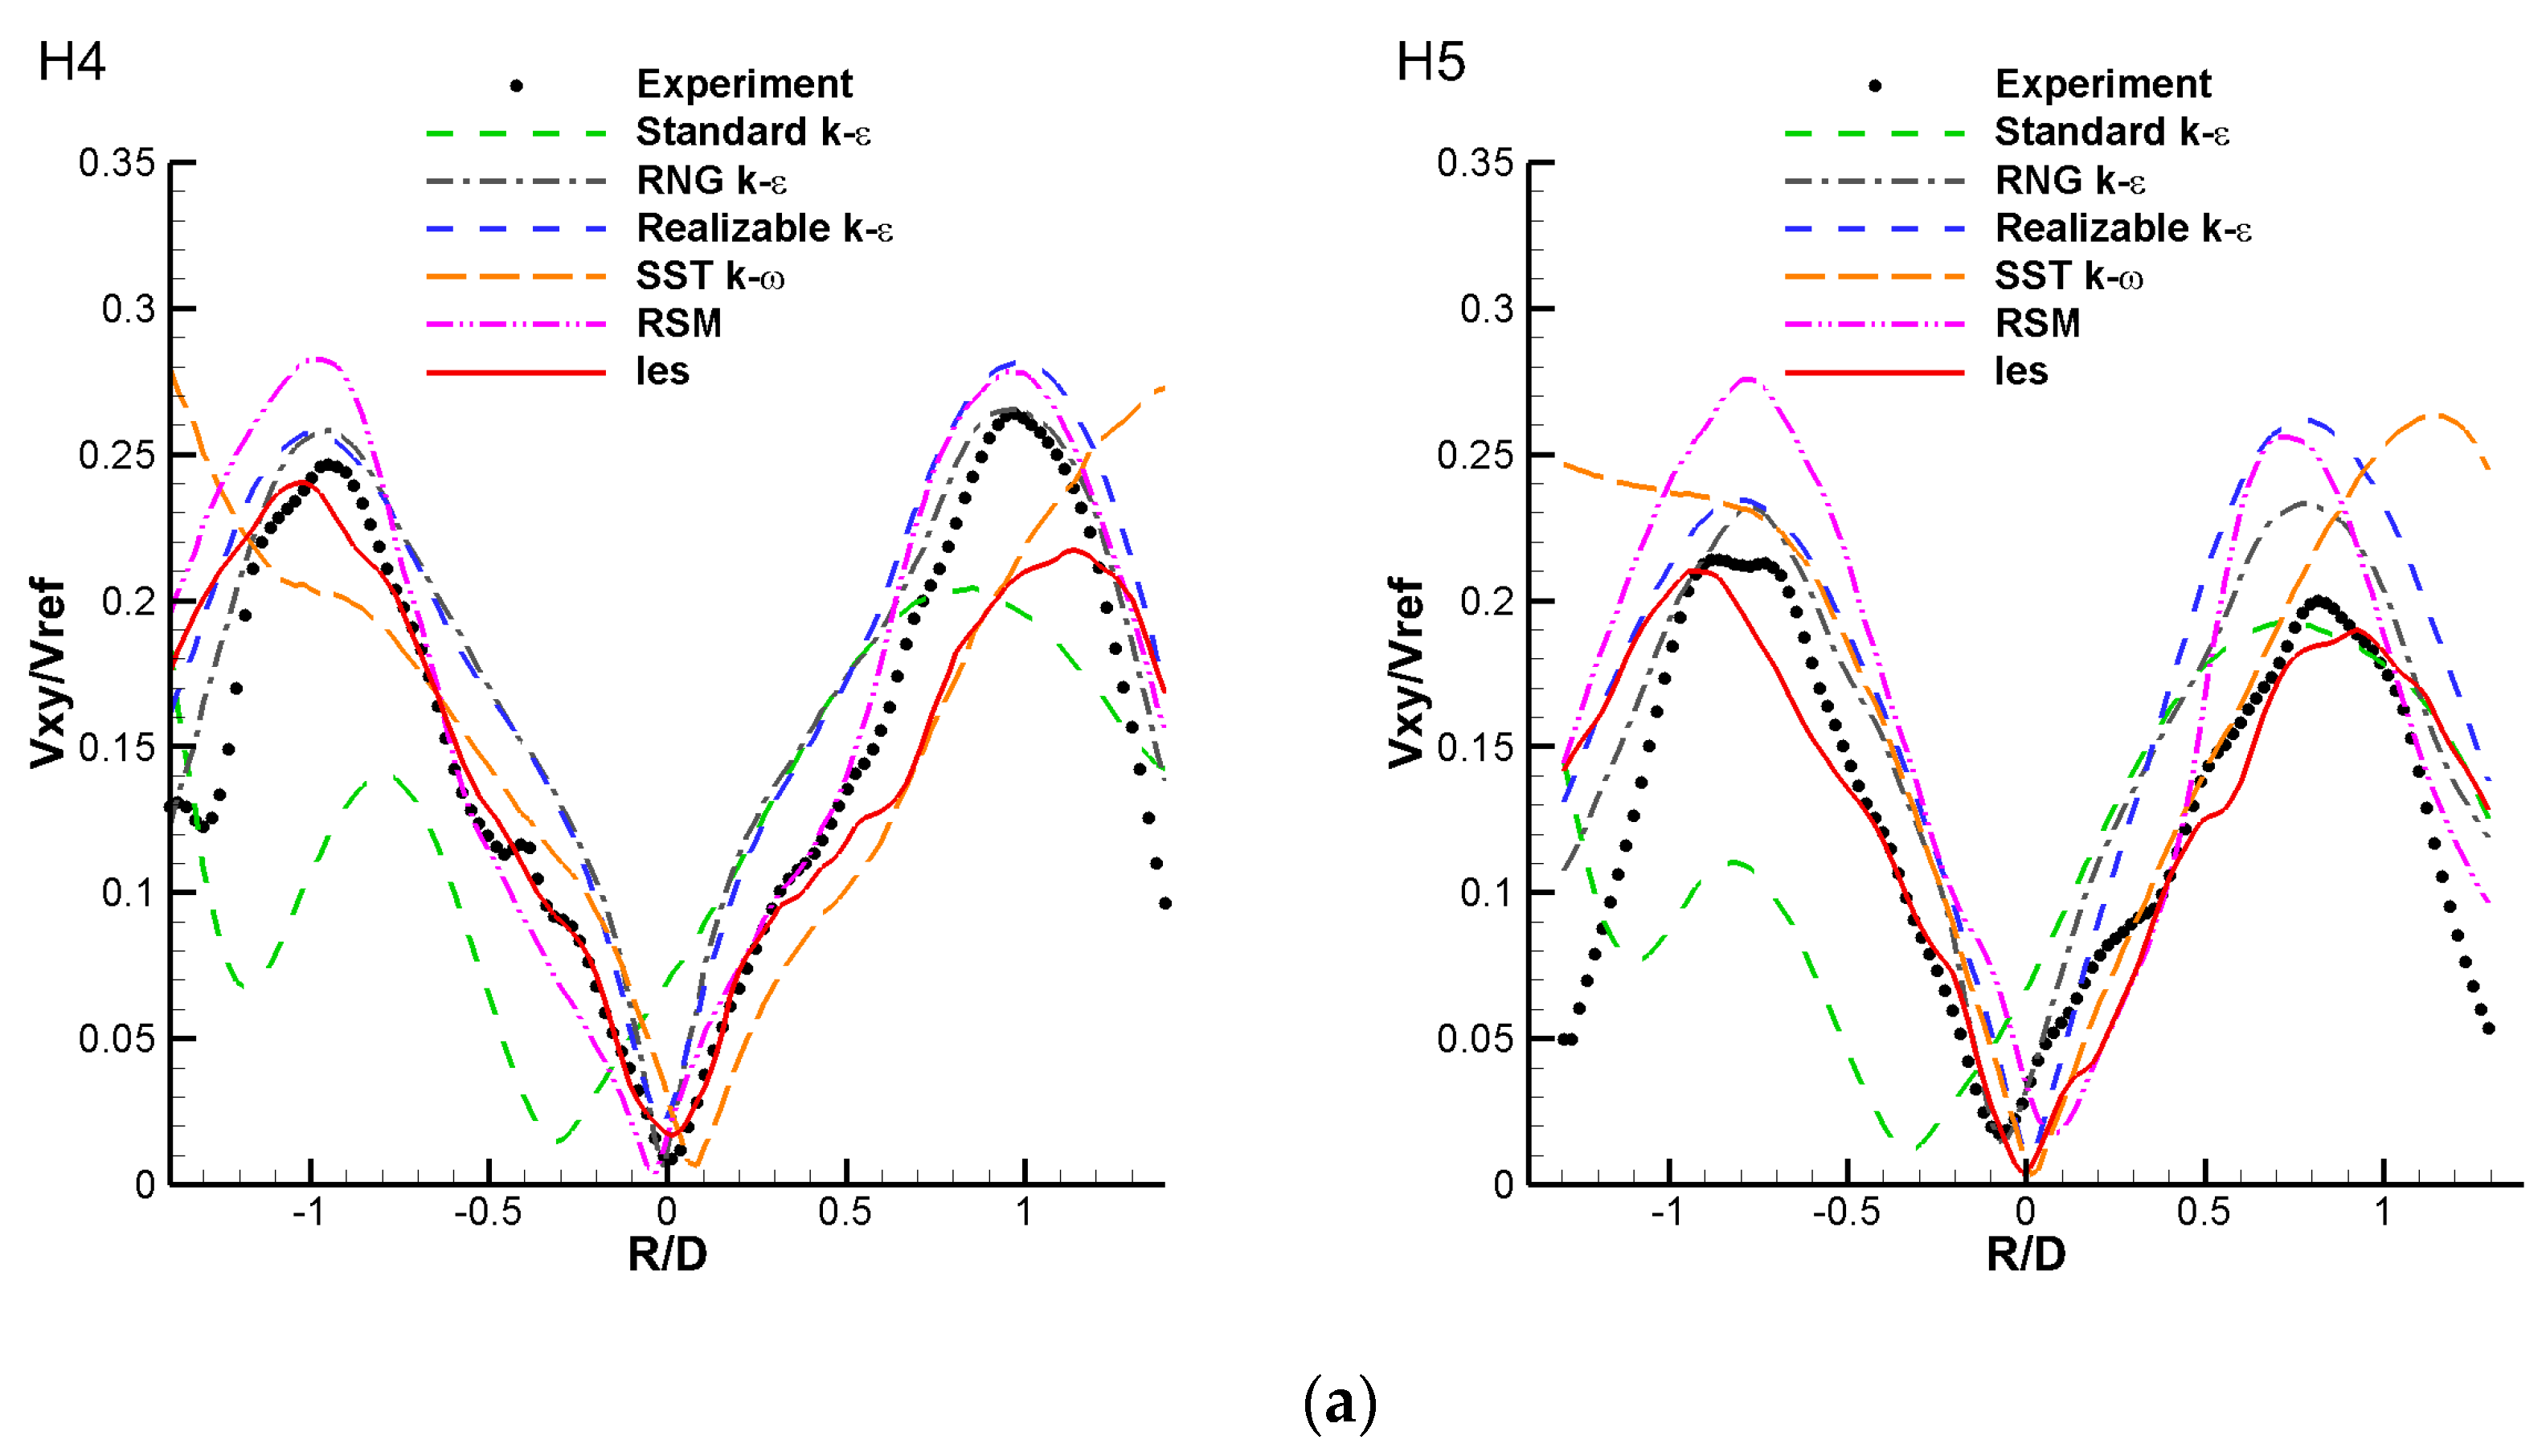
With appropriate strategies for domain reduction, simulations were carried out with various turbulence models to find the most appropriate model for capturing the flow characteristics. The various turbulence models tried were namely the standard k-ε, RNG k-ε, Realizable k-ε, SST k-ω, RSM Stress-BSL and LES. Comparisons of Vxy and the surrounding nozzle recirculation zone size are shown in Figure 10. Although the LES model provides generally better results compared to RANS models, the realizable k-ε model was chosen for further simulation after balancing accuracy and cost.
The simulation results obtained under both overall model and partial model using realizable k-ε model are in good agreement with the experiment data. The flow pattern is similar, and the absolute value on the selected diameter of the calculation is very close to that of the experiment results. The comparison is shown in Figure 11. This suggests that the design of partial model is successful, and the results obtained in the partial model are persuasive. In the partial model, the surrounding nozzle mass flow can be adjusted independently, and different cases can be designed to further study the coupling effect of the nozzle flow.

3. Results and Discussion

3.1. Cross-Section Measurement Results and Analysis

The velocities for five working conditions and eight cross-sections were obtained in this experiment; some of the velocity contours are shown in Figure 12. There were four main characteristics within the combustion chamber:
(1)
The two clockwise flows merged with the respective surrounding counterclockwise flows, forming a structure of two central symmetrical flows.
(2)
The flow pattern of each cross-section in the combustion chamber was self-similar under different working conditions, which means the increase in air mass flow only resulted in the increase in the absolute velocity without changing the flow trend in each section.
(3)
The flow inside the combustion chamber was constantly rotating counterclockwise.
(4)
The swirling velocity was gradually dissipating.
Section H1 was the most upstream section of the combustion chamber and was closest to the headend. As a result, the background scatter affected the receiving of the particle scatter, and part of the velocity information was therefore missing. Nevertheless, it can still be seen that seven streams of swirling flow formed downstream of the seven premixing tubes, with a high Vxy. The central area Vxy of each swirl was low, indicating the existence of recirculation zones.
Velocity data from section H3 reveal the interactions between the rotating flows. On the left side of the section, counterclockwise swirls generated by nozzles 1 and 3 and the central nozzle surrounded the clockwise swirl generated by nozzle 2. The clockwise flow merged with the surrounding counterclockwise flows, forming a large continuous flow structure. The right side of the section had the same phenomenon. The low Vxy area remained downstream of counterclockwise nozzles 1, 3, 4 and 6 and the central nozzle, while the Vxy values downstream of clockwise nozzles 2 and 5 were larger, indicating the early disappearance of the recirculation zone. The coupling phenomenon on plane H3 is shown in Figure 13.
The flow in the combustion chamber was constantly rotating counterclockwise because there were five counterclockwise nozzles and only two clockwise ones; thus, the momentum of the counterclockwise flow was greater. The xy plane velocity in the combustion chamber was constantly decreasing, which suggests the dissipation of the swirling flow.
To quantify the self-similarity of the cross-sections, the velocity data of cross-sections H5–H8 were taken for analysis. Data on a selected diameter moving through the high-velocity area were selected in different working conditions, as shown in Figure 14a, where the red line represents the position of the data sampled. The comparison shows that the Vxy trend of the cross-section H5–H8 sampling points was consistent under different working conditions. The average Vxy on the plane against the inlet mass flow rate was plotted, as shown in Figure 14b. The average velocity on the extracted line from each cross-section was basically linear with the mass flow rate. These comparisons suggest that, in the experimental model, the flow pattern remained constant, and the increase in mass flow only changed the magnitude of the absolute velocity, suggesting the stability of the flow.

3.2. Longitudinal Section Measurement Results and Analysis

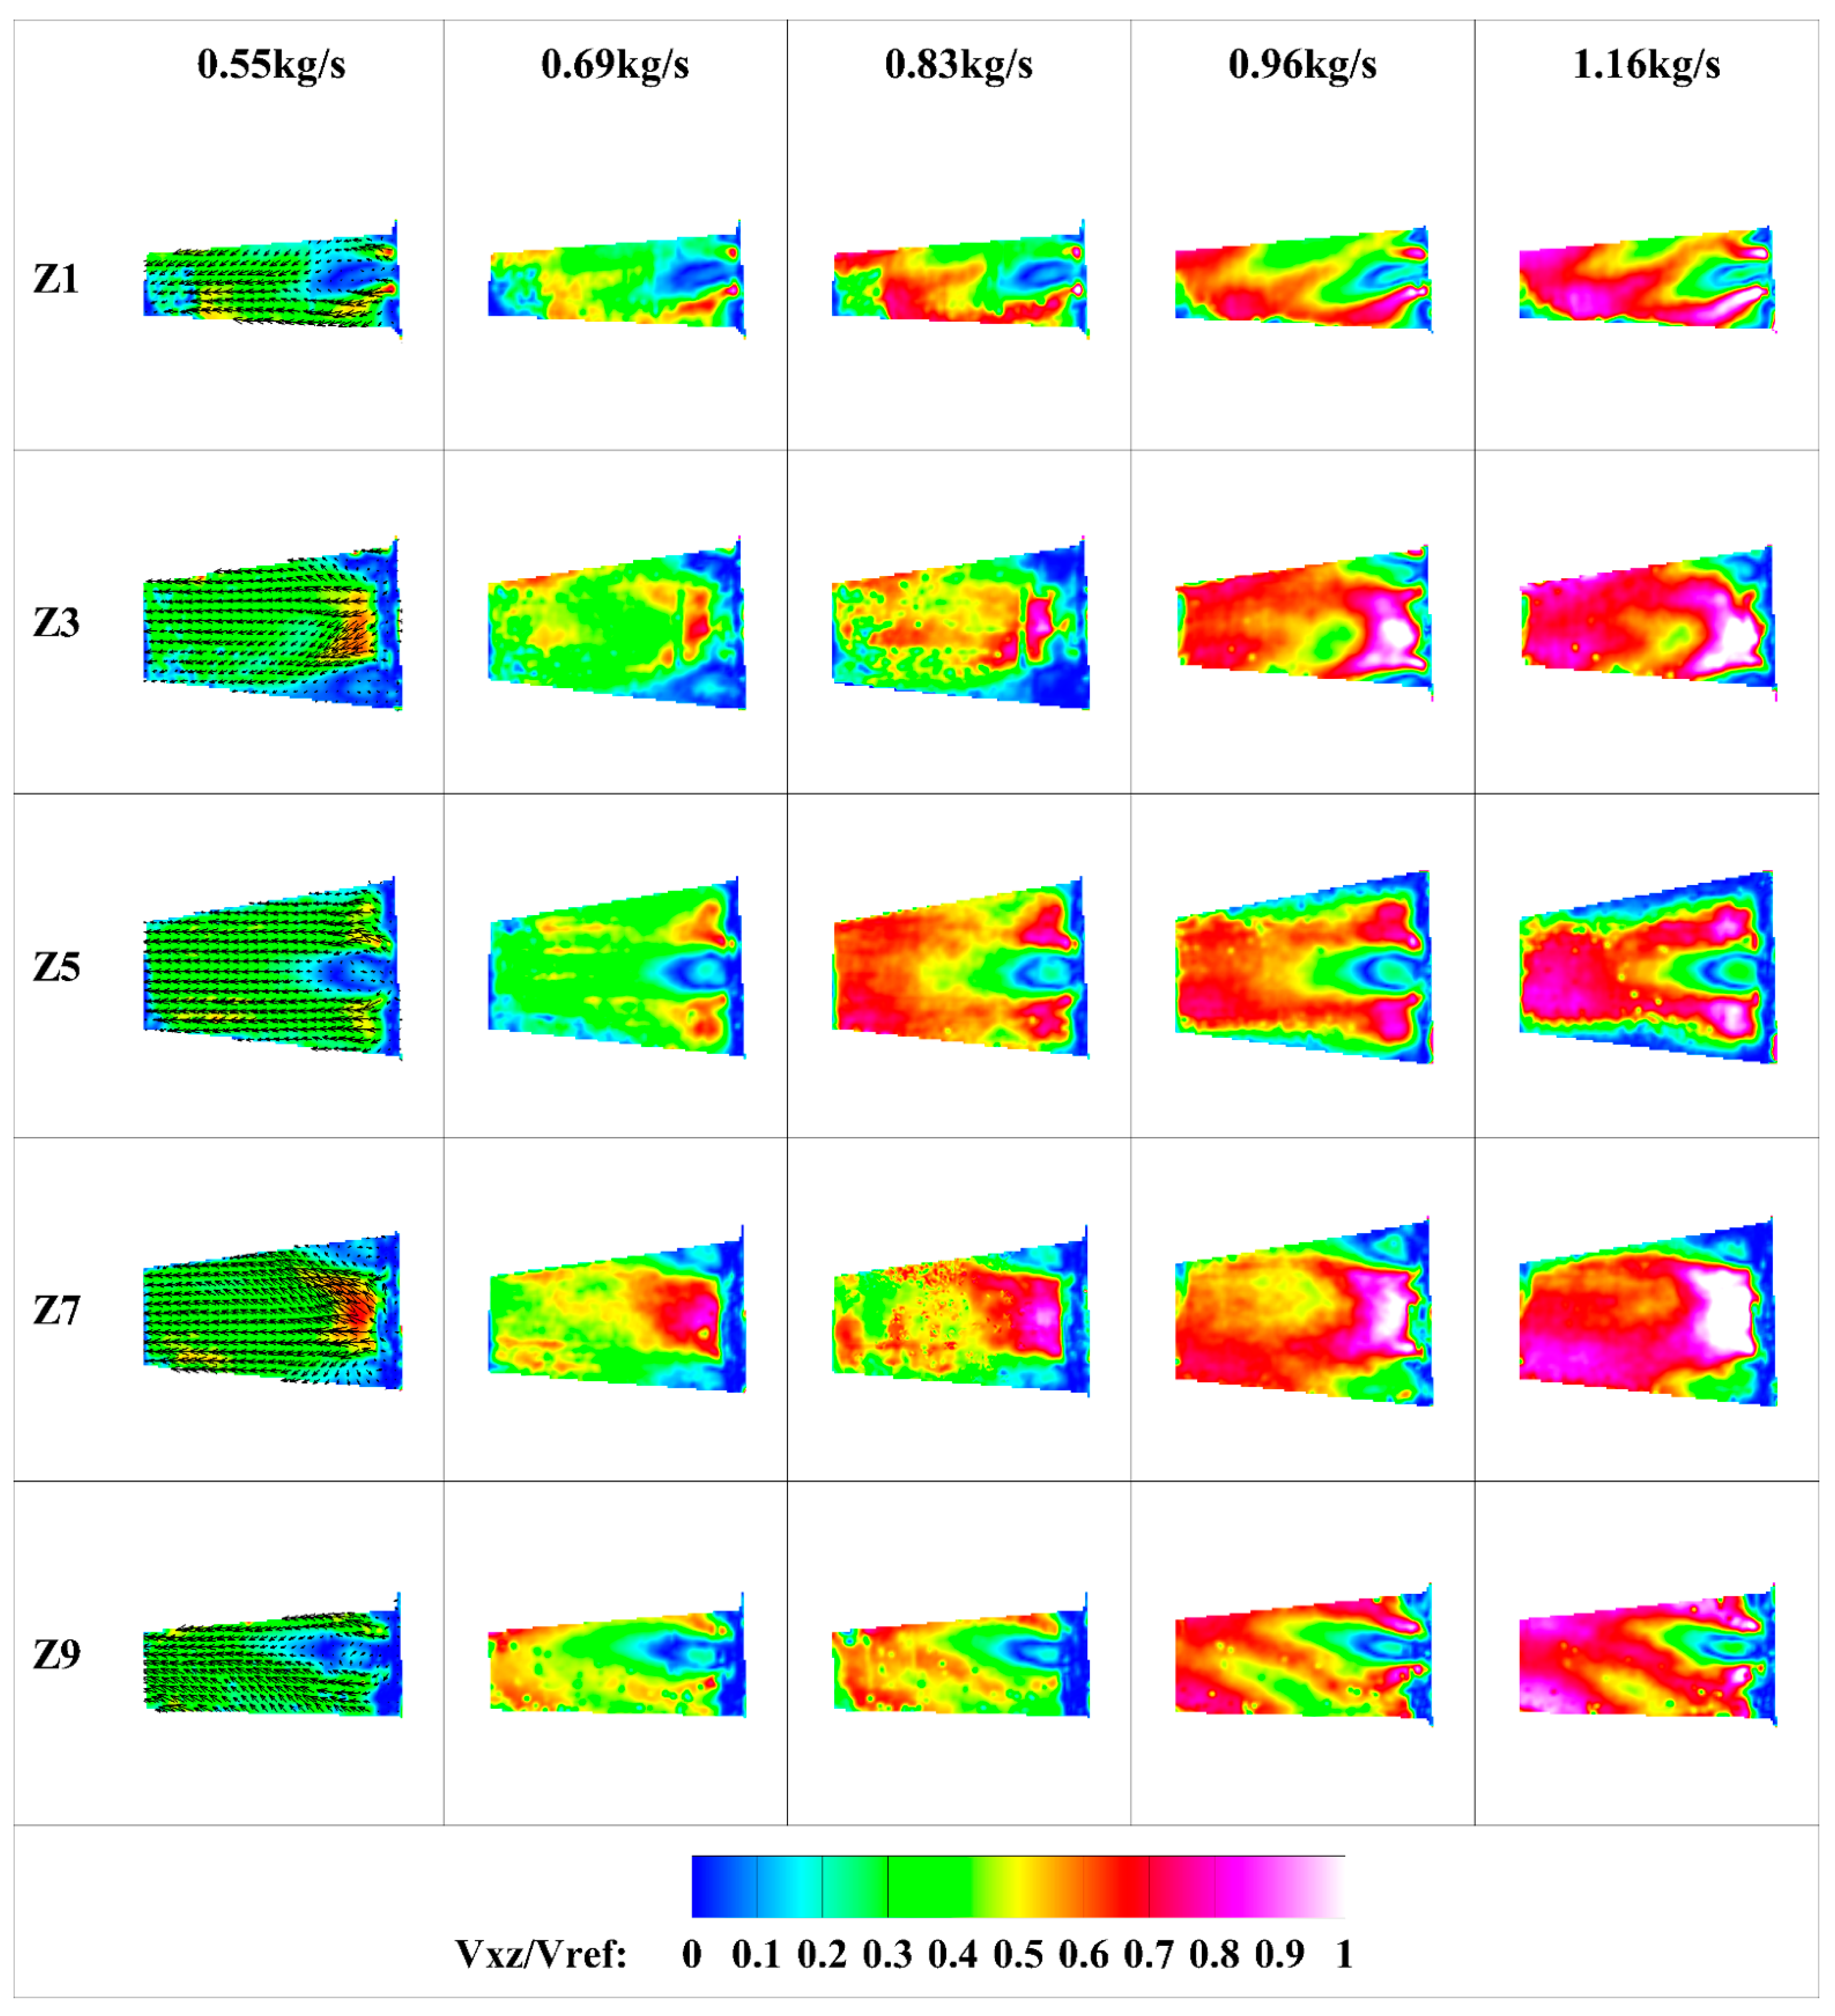
Velocity data for five working conditions and nine longitudinal sections were taken in this experiment; some of the velocity contours are shown in Figure 15. The longitudinal section measurement results also show the self-similarity in xz velocity distribution in the combustion chamber. Another phenomenon of flow in the combustion chamber is shown: the swirling flows form recirculation zones downstream of each nozzle.
The recirculation zones of sections Z1, Z5 and Z9 were obvious where the nozzle was located in the middle of the measuring section. The recirculation zones formed in Z3 and Z7 emerged at the top right and bottom right corners of the cloud map. Though not complete, they were still sufficient to prove the existence of the recirculation zones downstream each nozzle, which play a key role in flame stabilization.

3.3. CFD Results and Analysis

To better contrast the results of the single-nozzle and multiple-nozzle flow, different cases were set under the partial model, as shown in Table 2. Four single-nozzle cases were calculated, in which the mass flow of the surrounding nozzles chose the average of the surrounding nozzles, and the flow of the central nozzle was 10% higher than the average of the surrounding nozzles. The comparison of the single-nozzle calculation results and multiple-nozzle calculation results can reflect the influence of the flow coupling.
The CFD results of the four planes were focused on, as shown in Figure 16. Planes C14, C25 and C36 crossed the axes of two surrounding nozzles and the central nozzle. For example, plane C14 indicated that the plane went through the axes of nozzles C, 1 and 4. Iso-surface R/D = 1.6 crossed the axes of six surrounding nozzles. Because the flows of surrounding nozzles 2 and 5 were clockwise (looking from the back) and the other nozzles flowed counterclockwise, the coupling effect between the surrounding nozzles with different directions and the central nozzle can be obtained by comparing variables on plane C14, C25 and C36. Iso-surface R/D = 1.6 passed through the surrounding nozzle axes, and the information on the curved surface reflected the interaction between surrounding nozzles with different directions. The curved surface was expanded into a 2D plane for easier expression. Three variables are discussed. Vxy (velocity on the xy plane) is used to reflect the swirl velocity, Vz (velocity on z direction) gives velocity information about recirculation and TKE (turbulent kinetic energy) is analyzed to reveal the turbulent mixing between the recirculation zone and the mainstream area.
As can be seen from Figure 17a, when the two adjacent nozzles had the opposite direction, the swirling flow between nozzles reached a higher speed and gradually fuses; when the two adjacent nozzles had the same direction, there was no fusion between the separate flows, and the swirl was relatively independent. Taking nozzles 2, 3 and 4 as examples, nozzles 2 and 3 flowed in opposite directions while nozzles 3 and 4 flowed in the same direction. When Z/D = 1.5, there was only one high-velocity peak between nozzle 2 and 3 after coupling (Case 7), as shown in Figure 17b, while two low-speed peaks remained between nozzle 3 and 4 after coupling, as shown in Figure 17c. The coupling of nozzle flows of different directions generated a swirl whose speed was much higher the original, while the coupling of the nozzle flow with the same direction generated a swirl whose speed was at the same level as the original swirl. This phenomenon did not appear at the entrance of the combustion chamber. At Z/D = 0.5, the nozzle flow was quite similar before and after coupling. The coupling effect manifested when the flow further developed. The same phenomenon can be observed between the central nozzle and the surrounding nozzle.
The central symmetry of the flow in the combustion chamber was further proven. In Figure 17a, the flow downstream of nozzles 1, 2 and 3 was similar to that downstream of nozzles 4, 5 and 6. In Figure 17b,c, the Vxy deviated from the nozzle’s center. This suggests that the flow in the combustion chamber was constantly rotating counterclockwise because the total momentum of the counterclockwise rotation was greater than that of the clockwise rotation.
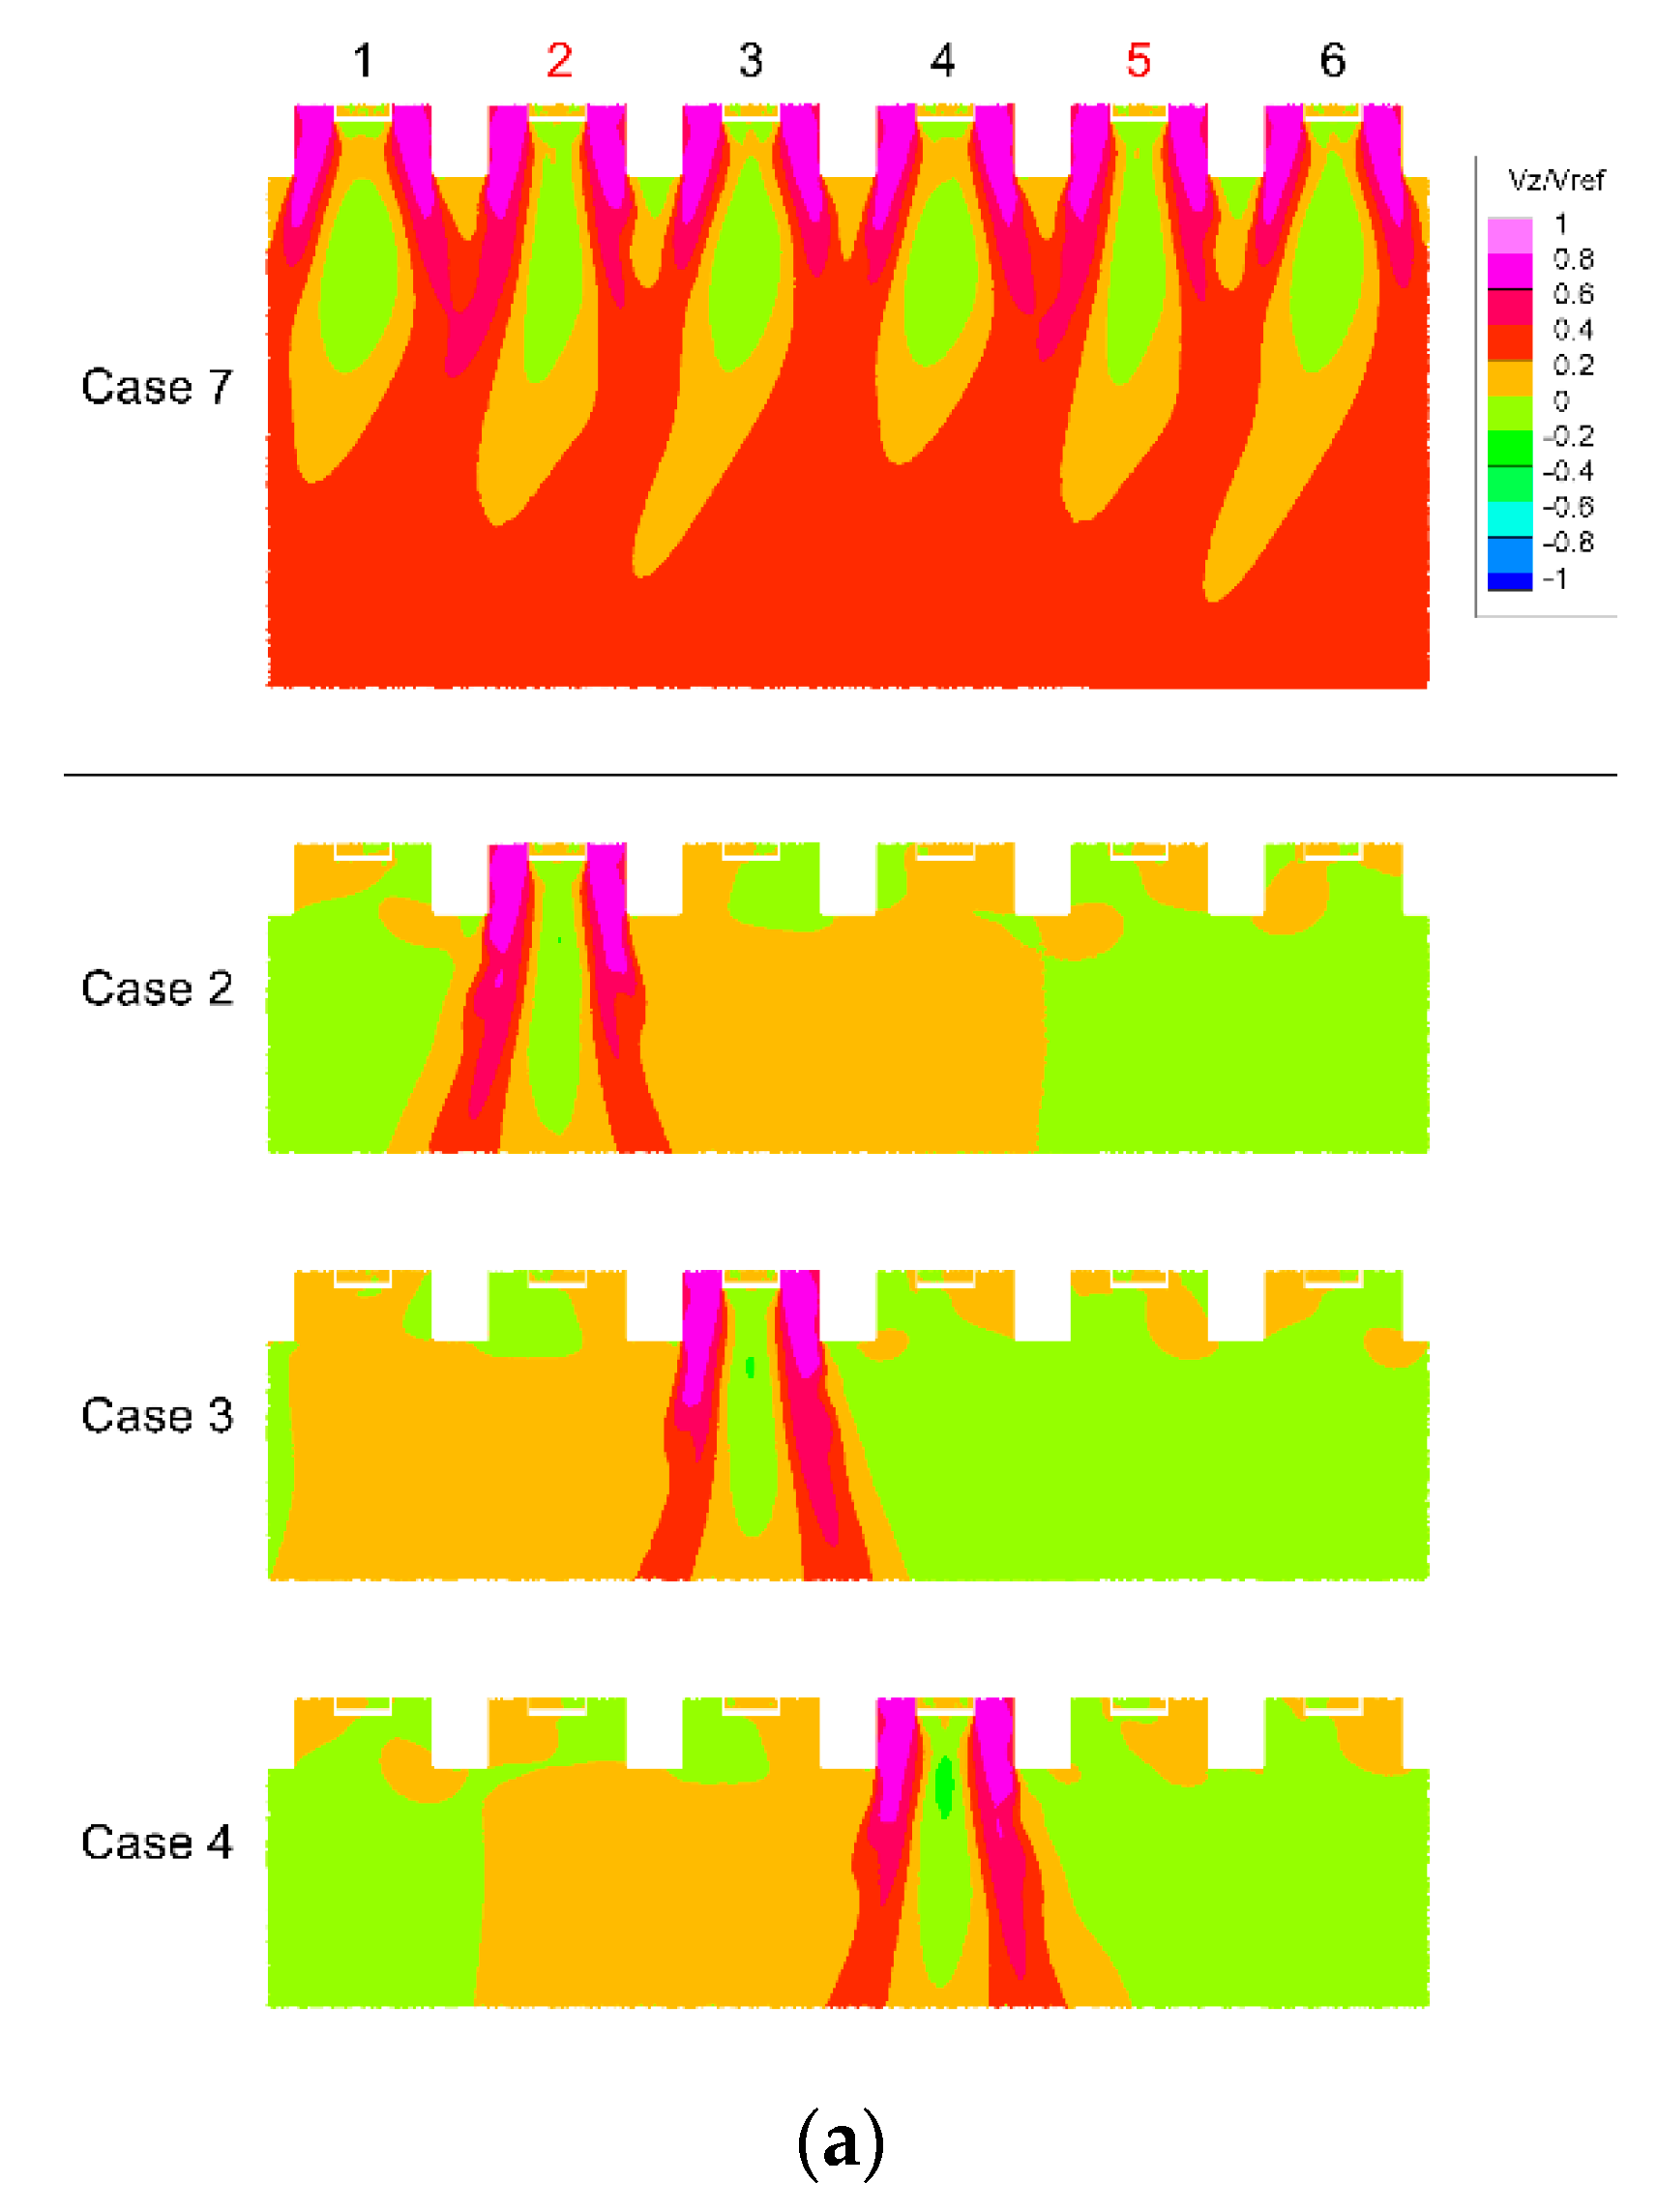
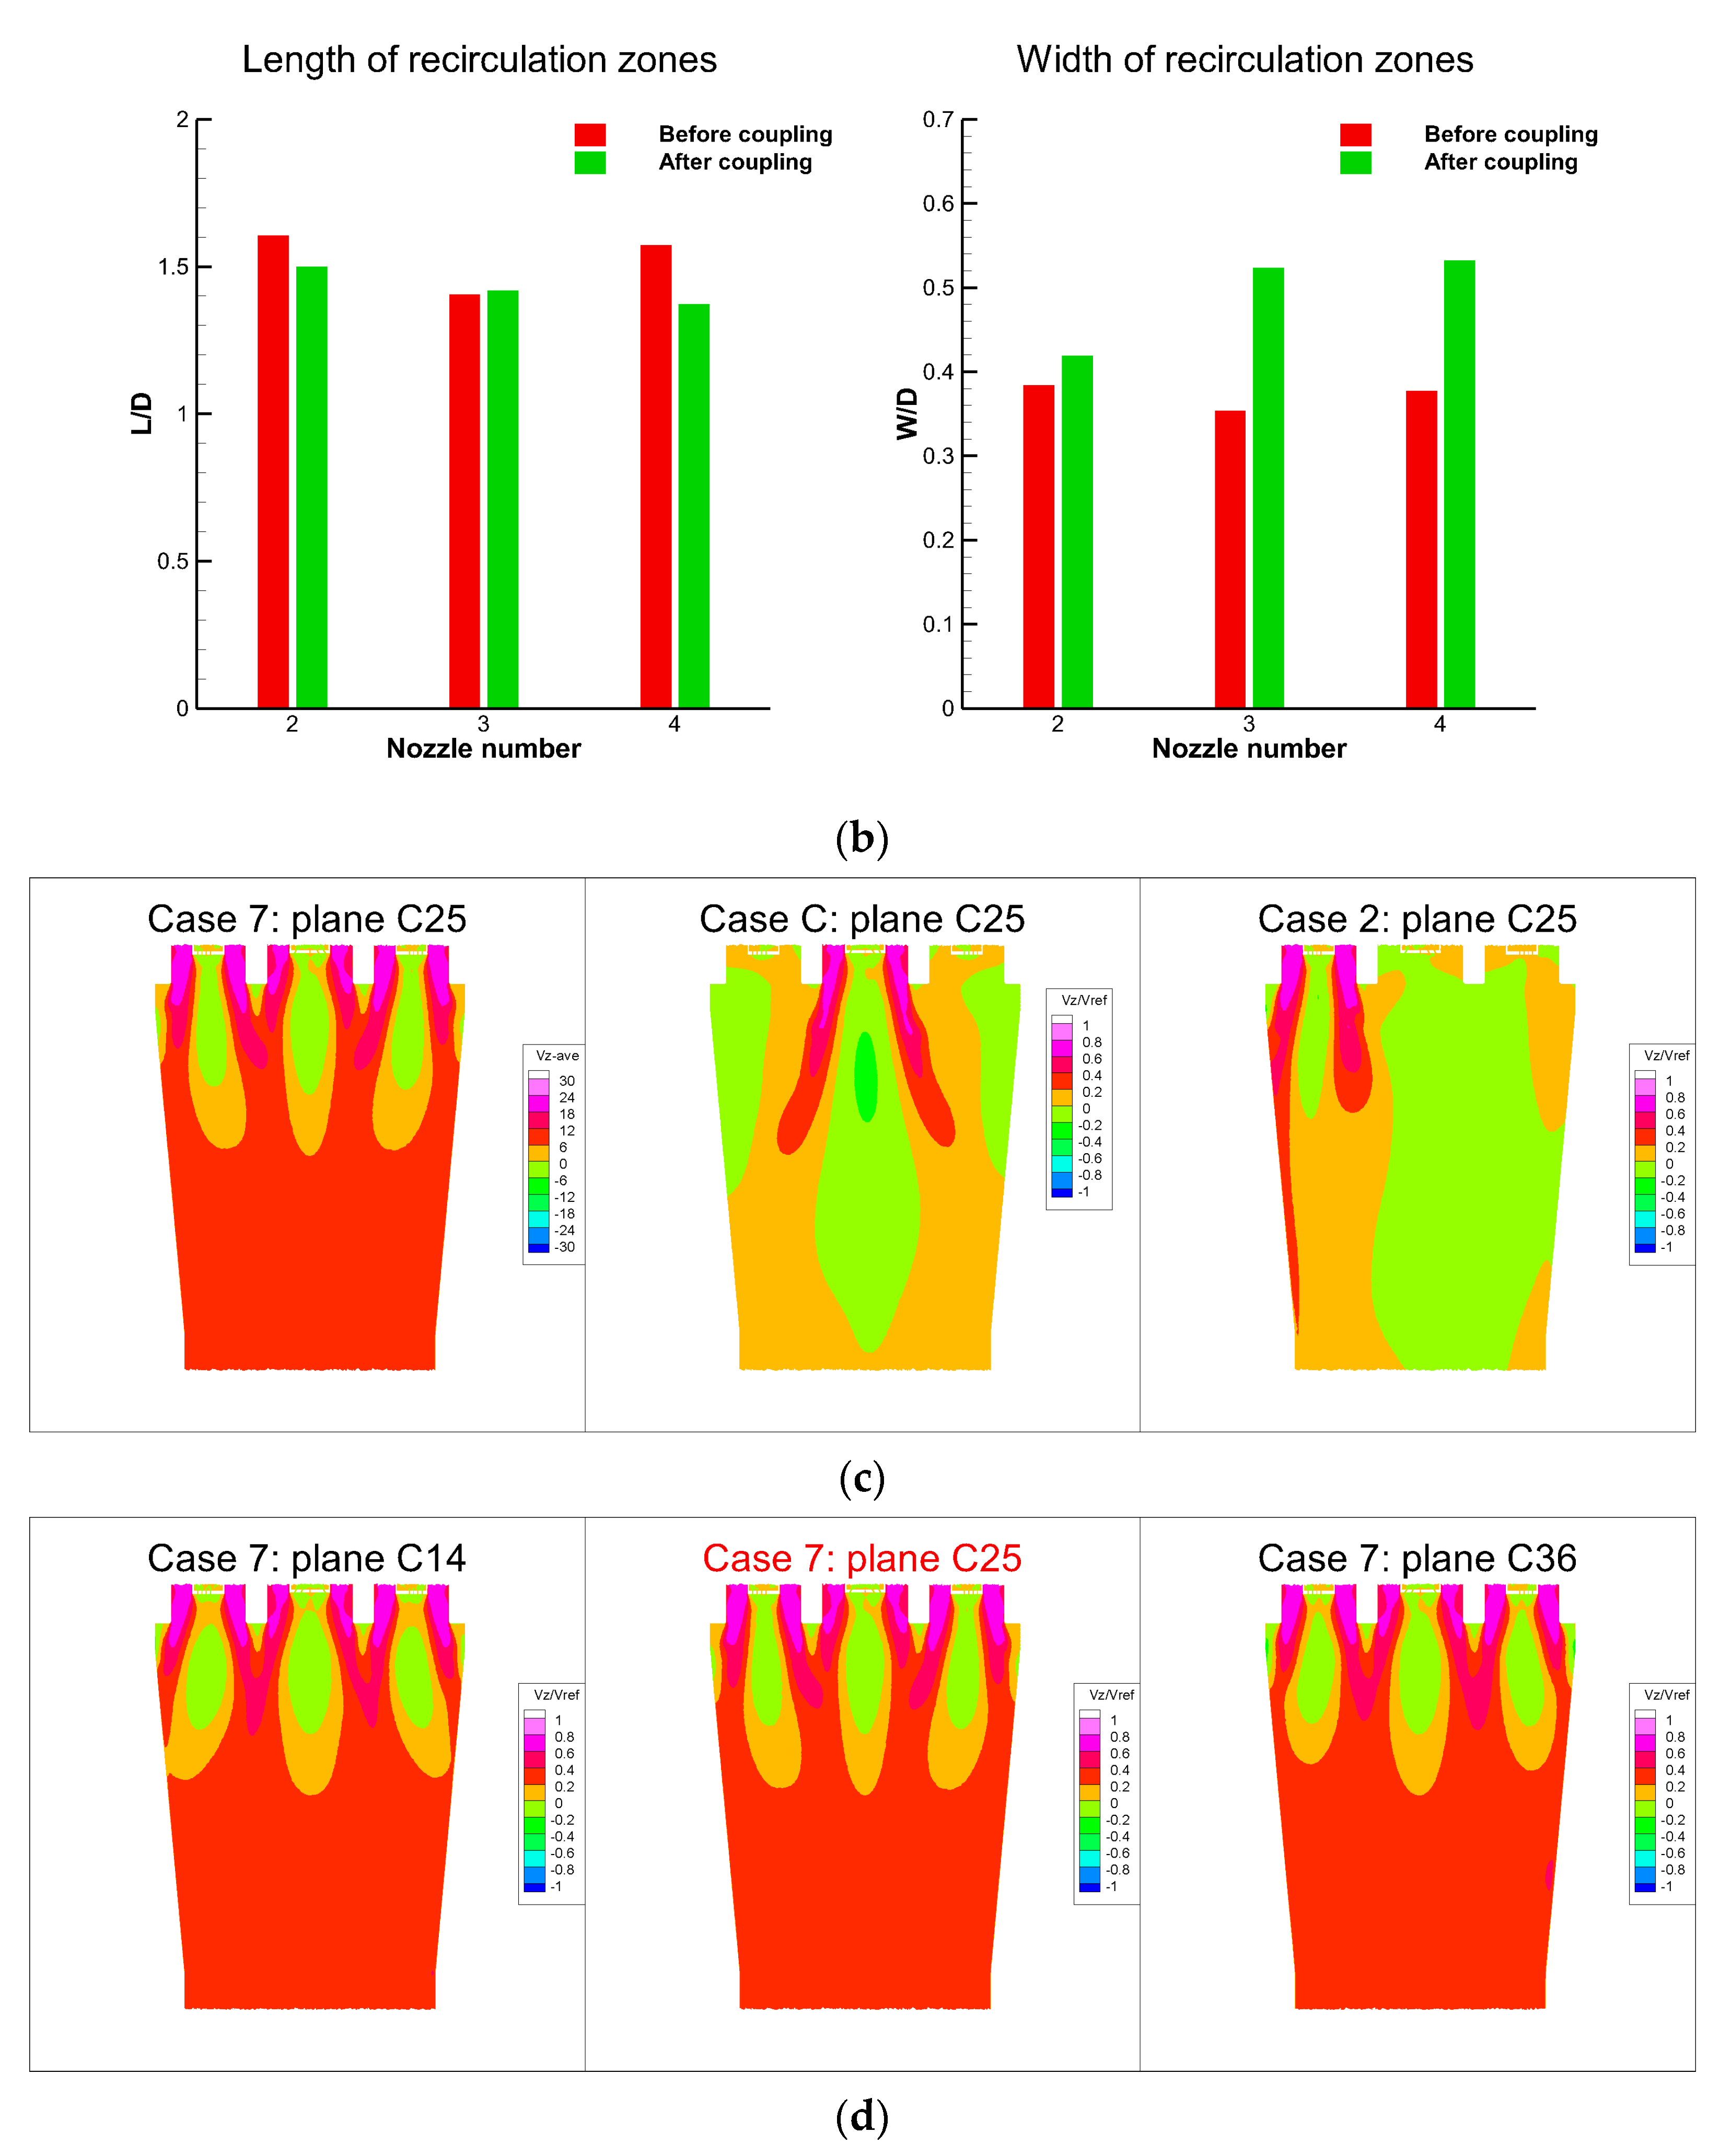
The generation of the recirculation zone is one of the main phenomena inside the combustion chamber, which is important for stabilizing the flame. Figure 18a,c,d shows the z-velocity on each plane, and Figure 18b shows the length and width of the recirculation zones downstream of nozzles 2, 3 and 4 before and after coupling.
The recirculation zone of clockwise nozzle 2 was narrower than those of other nozzles after coupling, whereas the coupling enlarged the recirculation zones of counterclockwise nozzles 3 and 4, as shown in Figure 18a,b. This indicates that the swirl strength around the clockwise nozzles was smaller, with less recirculation. Given that the flow rate of each surrounding nozzle was the same, and the only difference in the geometry of the surrounding nozzles was the rotation direction, the difference in the strength of recirculation was the only result of flow coupling. In the coupling process, the clockwise swirl generated by nozzles 2 and 5 strengthened the surrounding counterclockwise flow, and its own intensity was weakened. In this DLN combustor, stronger recirculation was formed downstream of the surrounding counterclockwise nozzles compared to the surrounding clockwise nozzles.
On planes C14 and C36, the recirculation zone of the surrounding nozzles expanded outward from the central nozzle, while on plane C25, the surrounding recirculation zones deviated inward, as shown in Figure 18d. This indicates that adjacent nozzles with the same direction repelled each other, while swirls from nozzles with different directions attracted each other.
The length and width of the central nozzle recirculation zone were greatly limited after coupling, as shown in Figure 18c. This further proves that the results obtained in the single-nozzle model were no longer persuasive in the multi-nozzle case. Moreover, a region of low axial velocity appeared downstream of each recirculation zone, as shown in Figure 18a. This low-velocity region was beneficial to the stabilization of the flame. The low-velocity regions downstream of counterclockwise nozzles 3 and 6 were longer.
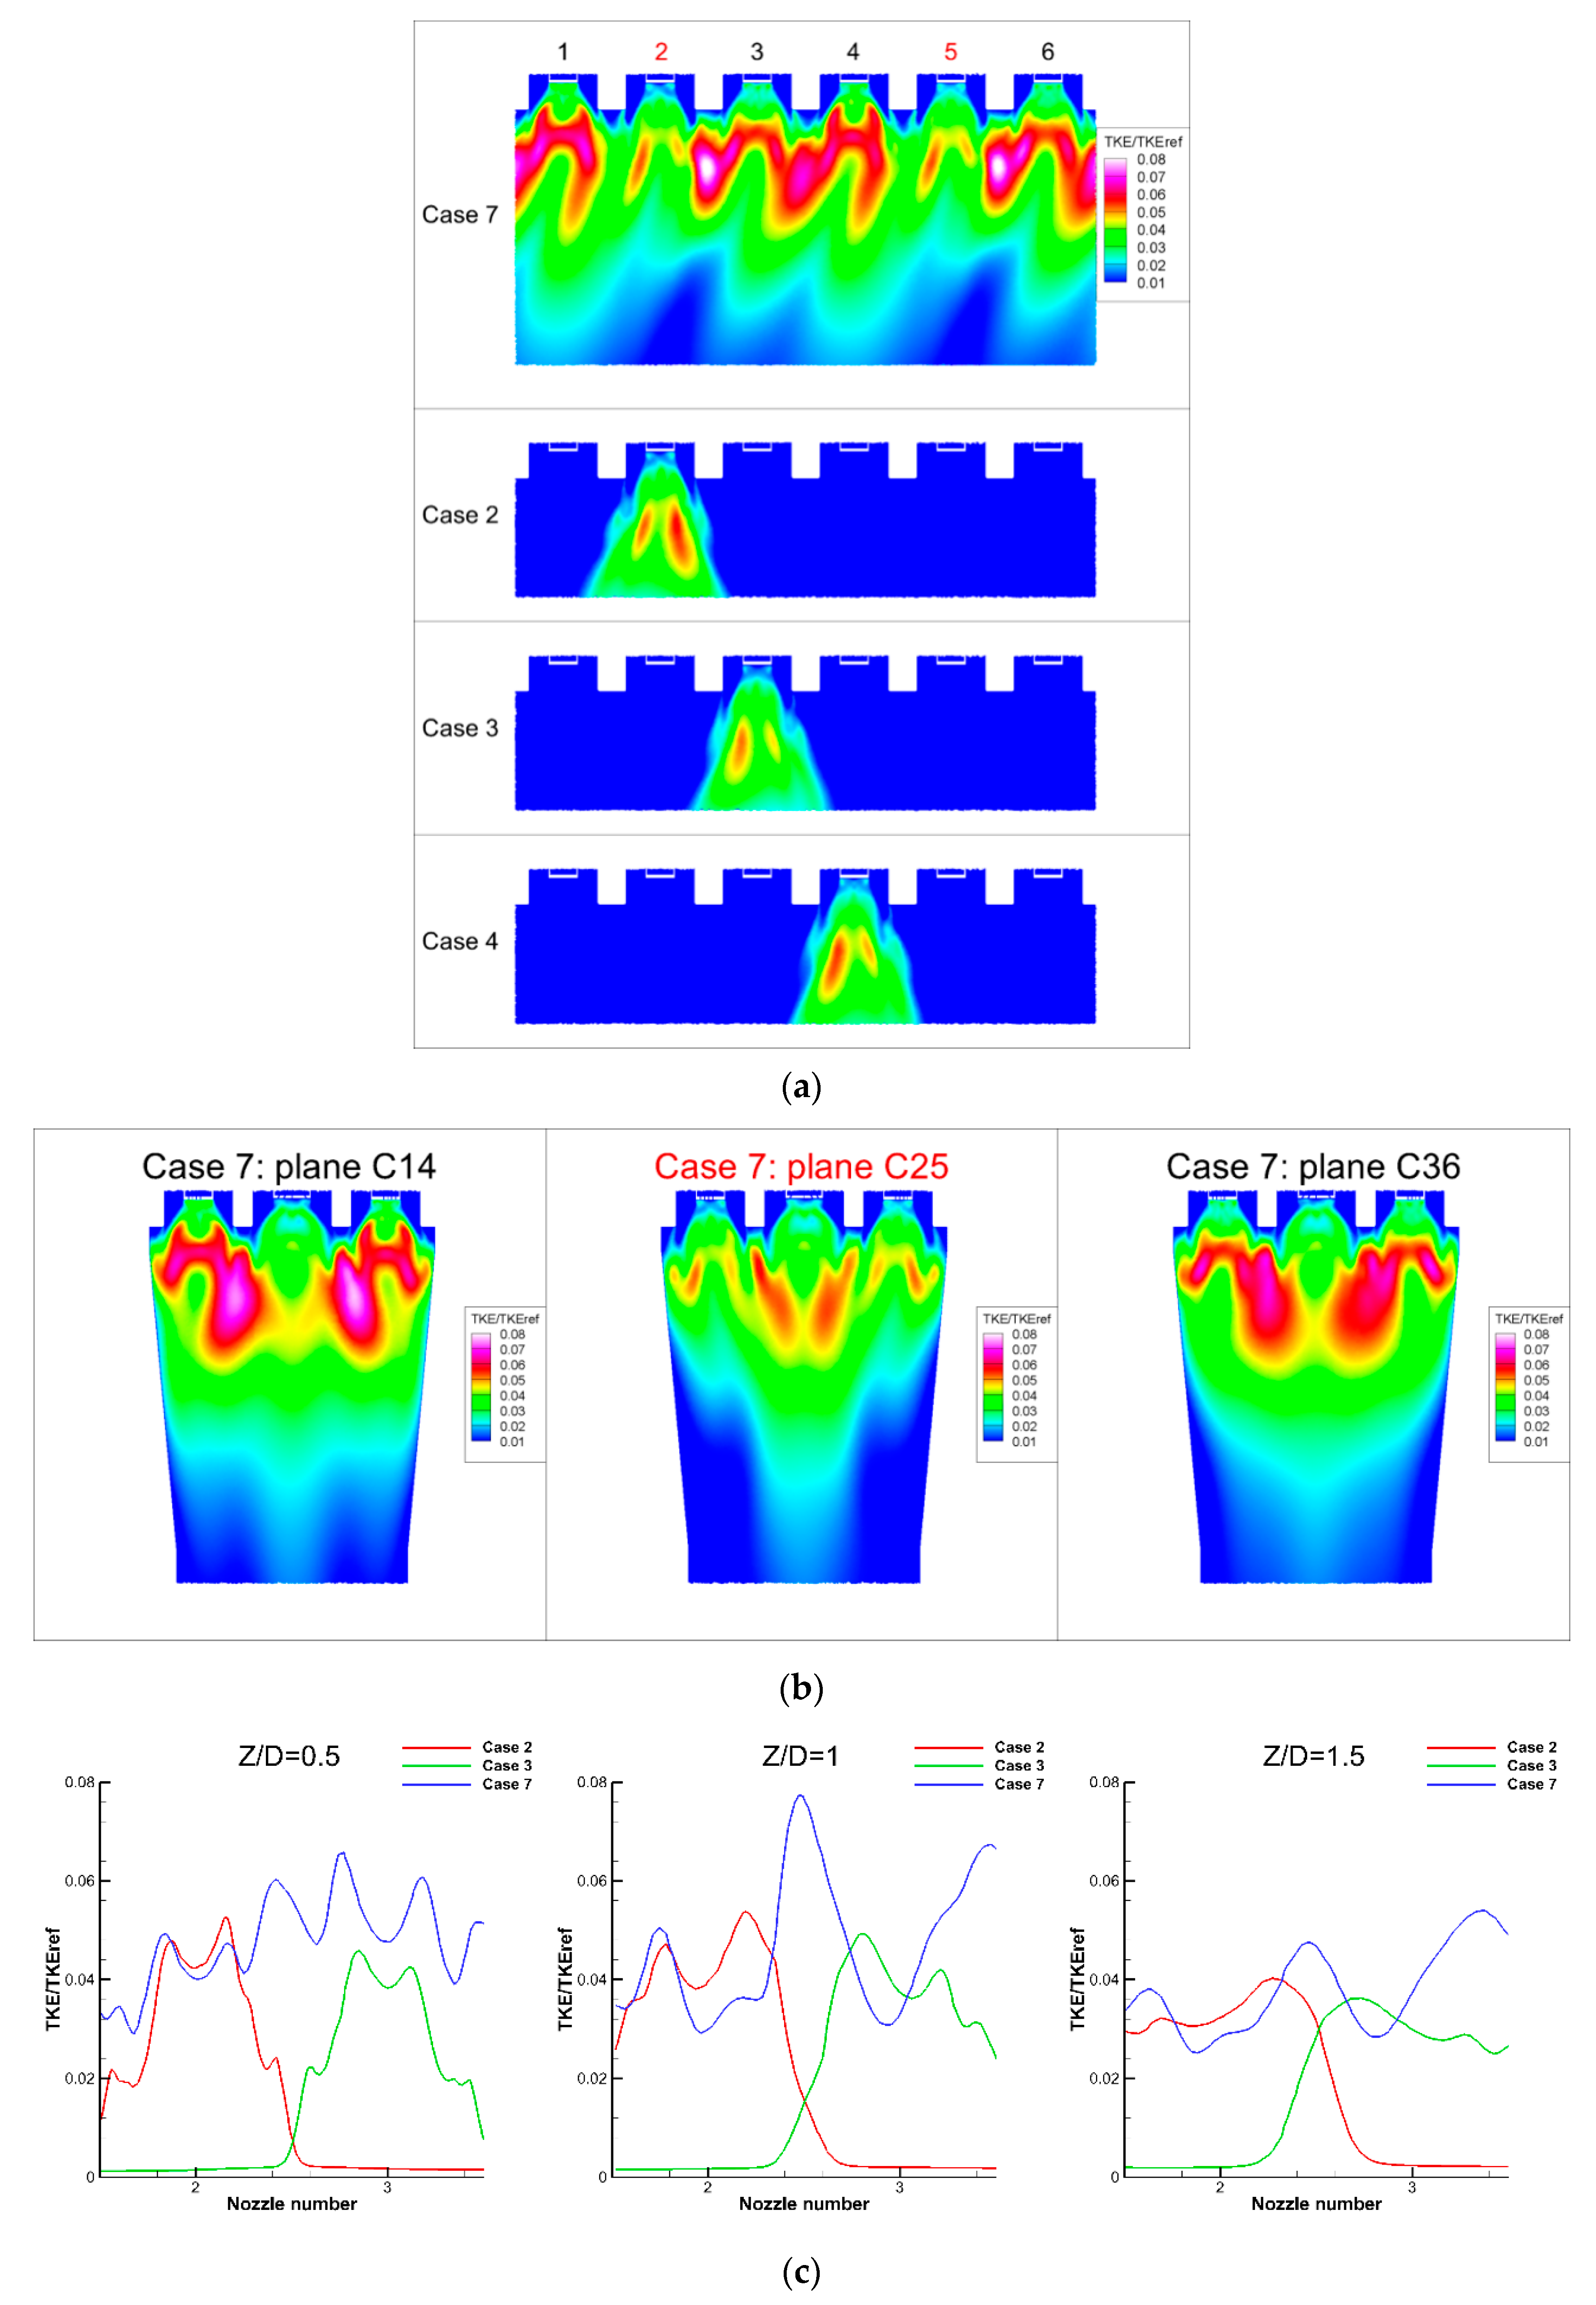
The velocity gradient between the recirculation area and the mainstream area was considerable, which could promote turbulence exchange between burned and unburned gas. At the boundary of recirculation zone and mainstream area, the velocity gradient and turbulence disturbance were the strongest, resulting in the highest turbulent kinetic energy (TKE). The TKE under isothermal conditions is related to the flame position under reacting conditions. Gomez-Ramirez et al. performed a PIV investigation for an optical combustor under isothermal and reacting conditions, where the flame location followed the turbulent kinetic energy contours for the isothermal measurement. High TKE is indicative of strong mixing, the location where the hot recirculated gases mix with the fresh incoming mixture is where ignition will occur and where the flame front will be established [16].
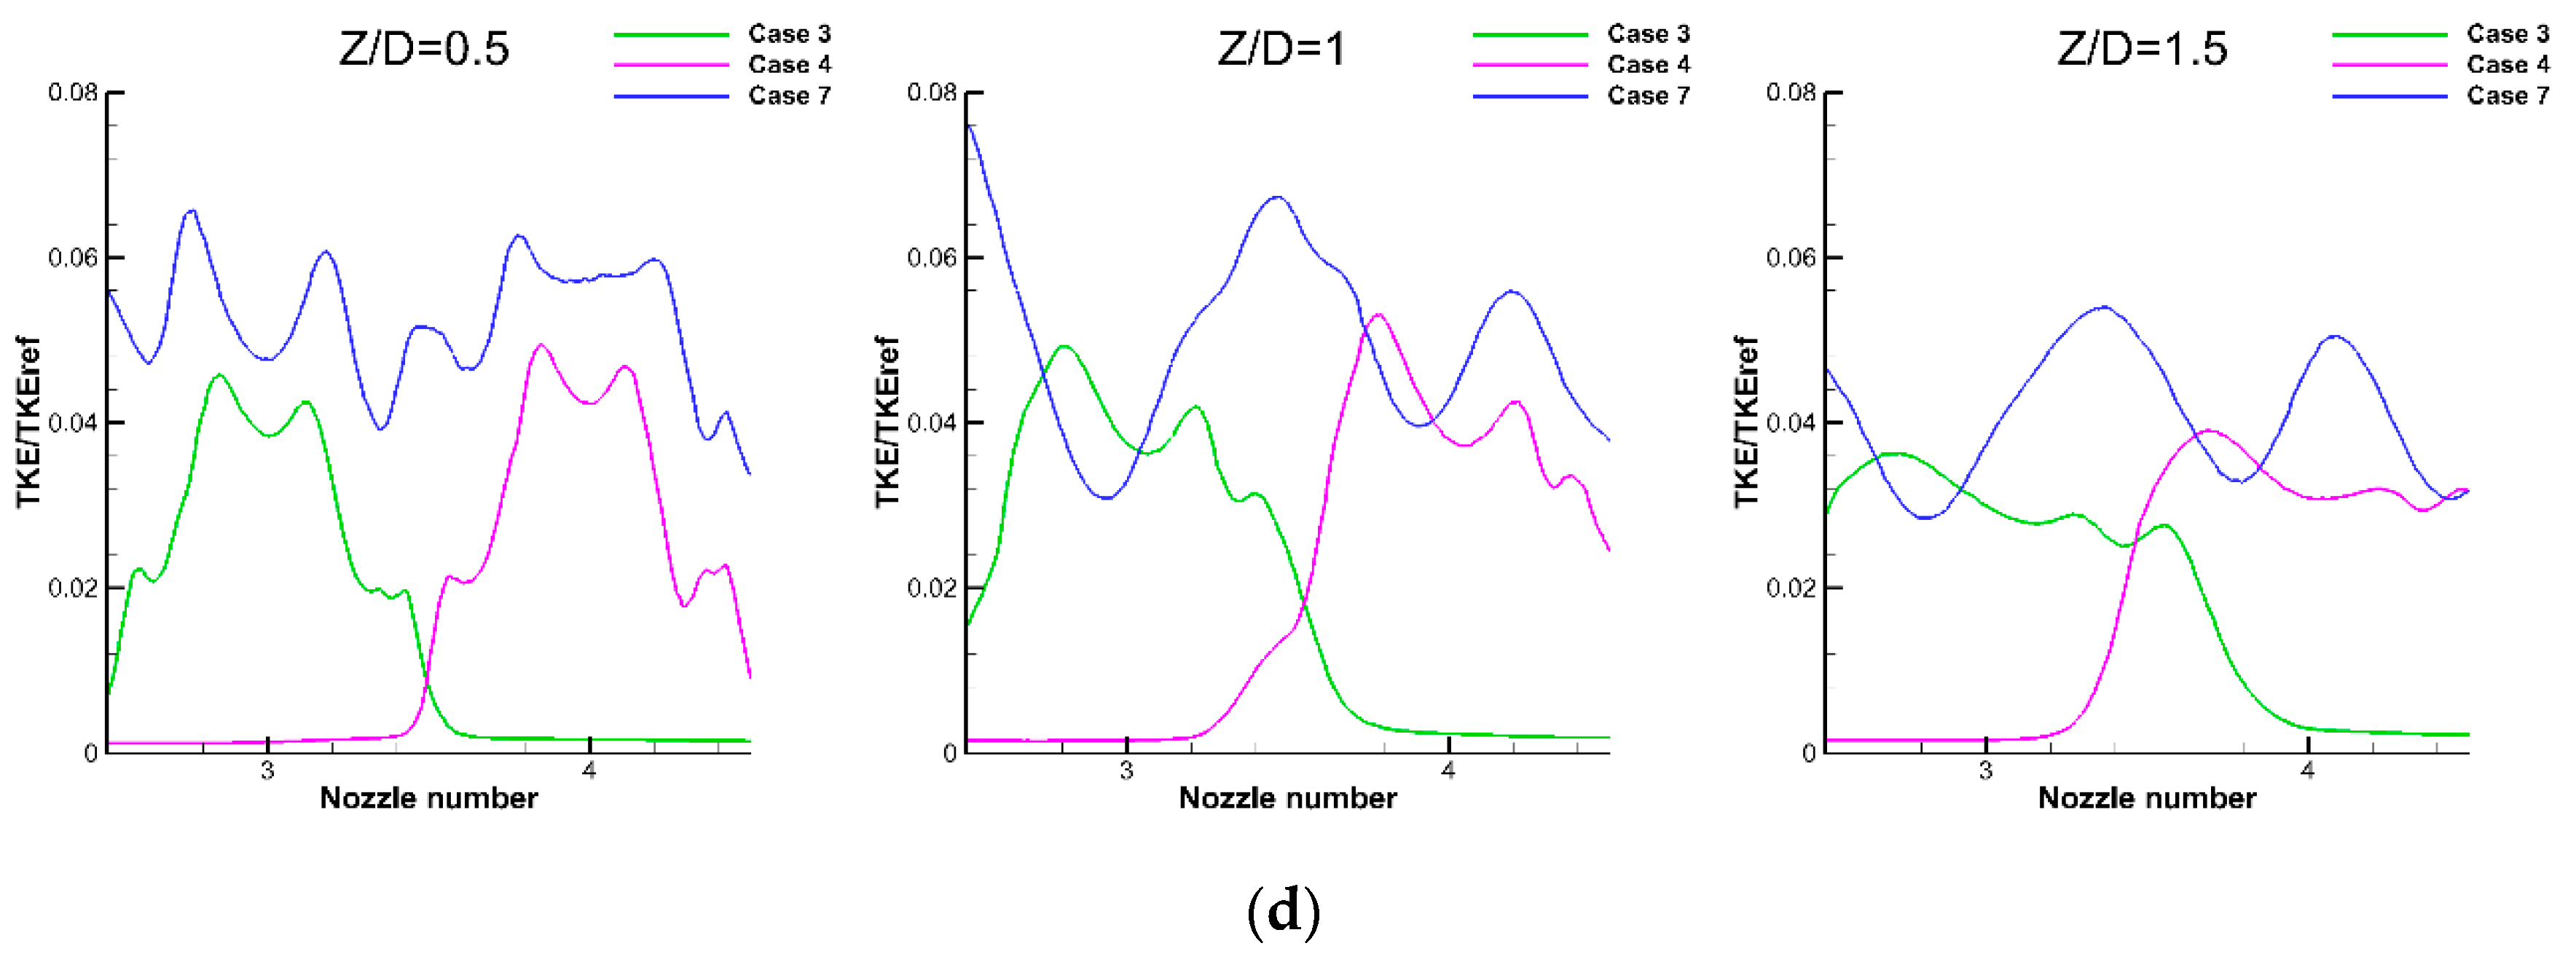
In the present study, the high-TKE area distributed downstream of counterclockwise nozzles 1, 3, 4 and 6, as shown in Figure 19a,b. This further proves that the recirculation downstream of the surrounding counterclockwise nozzles was stronger and that, in the coupling process, the counterclockwise swirl was enhanced, and the clockwise swirl was weakened. The coupling of nozzle flow resulted in higher TKE values, as shown in Figure 19c,d. In particular, the TKE between nozzles with the same direction was higher than that between nozzles of different directions. Nozzle flow coupling enhanced the turbulent fluctuation in the combustion chamber, particularly downstream of counterclockwise nozzles.
Because the TKE distribution under isothermal conditions was correlated with the flame position, in the actual working process of the combustor, the flame may be mainly distributed downstream of the counterclockwise surrounding nozzles, where the recirculation zone is wider and the low z-velocity area is larger. The high TKE area was located outside the premixing tube, which suggests that flame front will not be established inside the premixing tube, reducing the risk of flashback.

4. Conclusions

In this paper, a dry, low-NOx (DLN) combustor for a heavy-duty gas turbine using lean premixed technology was developed, and a high-fidelity test model was proposed for experimental analysis using particle image velocimetry (PIV). The combustor had one central nozzle and six surrounding nozzles, in which two nozzles flowed clockwise and four nozzles flowed counterclockwise. Eight cross-sections and nine longitudinal sections were measured to obtain the cold flow information inside the combustion chamber. The biggest problems encountered during the experiment were saturation and background scatter, which were solved by implementing shading measures. The experience gained in this study could be helpful for other similar experiments in the field.
The velocity data acquired through PIV investigation revealed several characteristics within the combustion chamber. The clockwise swirls generated by the clockwise nozzles merged with the respective surrounding counterclockwise swirls, forming two large continuous flow structures. Because there were more counterclockwise nozzles in the combustor, the flow inside the combustion chamber constantly rotated counterclockwise. The swirls formed recirculation zones downstream of each nozzle and gradually dissipated as the flow develops. The flow pattern of each section in the combustion chamber was self-similar under different working conditions, suggesting the stability of the flow.
Numerical simulation was carried out to supplement the flow information and enable a more comprehensive and detailed analysis about the swirl coupling. The simulation results were very close to the experiment both in the flow pattern and absolute velocity. According to the CFD results, when the two adjacent nozzles had the opposite direction, the swirling flows between nozzles reached a higher speed and gradually fused, and the recirculation zones attracted each other. However, when the two adjacent nozzles had the same direction, there was no fusion between the separate flow, and the recirculation zones repelled each other. After analyzing the recirculation zones and TKE distributions downstream of each nozzle, the general result of nozzle coupling was that recirculation and turbulent mixing downstream of the counterclockwise surrounding nozzles was stronger.
Nozzle flow coupling enhanced the turbulent fluctuation in the combustion chamber, and the TKE distribution suggests that the flame should be located downstream of the counterclockwise nozzles under actual working conditions. Future studies will focus on the relationship between the cold flow and reacting flow to further prove this conclusion.

Author Contributions

Conceptualization, X.R.; Methodology, Y.F. and X.R.; Validation, Y.F., C.G., S.L. and Z.W.; Formal analysis, Y.F.; Data curation, Y.F.; Writing–original draft, Y.F.; Writing–review & editing, X.L. (Xuesong Li) and X.R.; Supervision, X.L. (Xuesong Li), X.R. and C.G.; Project administration, C.G., X.L. (Xuan Lv), S.L. and Z.W.; Funding acquisition, X.L. (Xuan Lv) and S.L. All authors have read and agreed to the published version of the manuscript.

Funding

This research was funded by the National Science and Technology Major Project (J2019-II-0017-0038, 2017-II-0007-0021) and the National Natural Science Foundation of China (No. 52176039).

Conflicts of Interest

The authors declare no conflict of interest.

References

  1. Venkataraman, K.; Lewis, S.E.; Natarajan, J.; Thomas, S.R.; Citeno, J.V. F-Class DLN technology advancements: DLN2.6+. Proc. ASME Turbo Expo 2011, 2012, GT2011-45373. [Google Scholar]
  2. Nemitallah, M.A.; Rashwan, S.S.; Mansir, I.B.; Abdelhafez, A.A.; Habib, M.A.M. Review of novel combustion techniques for clean power production in gas turbine. Energy Fuels 2018, 32, 979–1004. [Google Scholar] [CrossRef]
  3. Lefebvre, A.H.; Ballal, D.R. Gas Turbine Combustion: Alternative Fuels and Emissions, 3rd ed.; CRC Press: Boca Raton, FL, USA, 2010. [Google Scholar]
  4. Altay, H.M.; Hudgins, D.E.; Speth, R.; Annaswamy, A.M.; Ghoniem, A.F. Mitigation of thermoacoustic instability utilizing steady aisr injection near the flame anchoring zone. Combust. Flame 2010, 157, 686–700. [Google Scholar] [CrossRef]
  5. Davis, L.B.; Black, S.H. Dry low NOx combustion systems for GE heavy-duty gas turbines. In Proceedings of the Power-Gen America 95: Power Generation Conference, Anaheim, CA, USA, 5–7 December 1995. [Google Scholar]
  6. Weber, R.; Dugul, J. Combustion accelerated swirling flows in high confinements. Prog. Energy Combust. Sci. 1992, 18, 349–367. [Google Scholar] [CrossRef]
  7. Lucca-Negro, O.; O’Doherty, T. Vortex breakdown: A review. Prog. Energy Combust. Sci. 2001, 27, 431–481. [Google Scholar] [CrossRef]
  8. Berrino, M.; Lengani, D.; Satta, F.; Ubaldi, M.; Zunino, P.; Colantuoni, S.; Di Martino, P. Investigation of the dynamics of an ultra low NOx injection system by pod data post-processing. In Proceedings of the ASME Turbo Expo 2015, Montreal, QC, Canada, 15–19 June 2015. [Google Scholar]
  9. Boyce, M.P. Advanced industrial gas turbine for power generation. In Combined Cycle Systems for Near-Zero Emission Power Generation, 1st ed.; Rao, A.D., Ed.; Woodhead Publishing: Sawston, UK, 2012. [Google Scholar]
  10. Chong, C.T.; Hochgreb, S. Measurements of non-reacting and reacting flow fields of a liquid swirl flame burner. Chin. J. Mech. Eng. 2015, 28, 394–401. (In Chinese) [Google Scholar] [CrossRef]
  11. Khalil, A.E.; Brooks, J.M.; Gupta, A.K. Impact of confinement on flowfield of swirl flow burners. Fuel 2016, 184, 1–9. [Google Scholar] [CrossRef] [Green Version]
  12. Orbay, R.C.; Nogenmyr, K.J.; Klingmann, J.; Bai, X.S. Swirling turbulent flows in a combustion chamber with and without heat release. Fuel 2013, 104, 133–146. [Google Scholar] [CrossRef]
  13. Johnson, M.; Littlejohn, D.; Nazeer, W.; Smith, K.; Cheng, R. A comparison of the flowfields and emissions of high-swirl injectors and low-swirl injectors for lean premixed gas turbines. Proc. Combust. Inst. 2005, 30, 2867–2874. [Google Scholar] [CrossRef]
  14. Strakey, P.A.; Yip, M.J. Experimental and numerical investigation of a swirl stabilized premixed combustor under cold-flow conditions. J. Fluids Eng. 2007, 129, 942–953. [Google Scholar] [CrossRef]
  15. Reichling, G.; Noll, B.; Aigner, M. Numerical simulation of the non-reactive and reactive flow in a swirled model gas turbine combustor. In Proceedings of the 21st AIAA Computational Fluid Dynamics Conference, American Institute of Aeronautics and Astronautics, San Diego, CA, USA, 24–27 June 2013. [Google Scholar]
  16. Gomez-Ramirez, D.; Kedukodi, S.; Gadiraju, S.; Ekkad, S.V.; Moon, H.-K.; Kim, Y.; Srinivasan, R. Gas turbine combustor rig development and initial observations at cold and reacting flow conditions. In Proceedings of the ASME Turbo Expo 2016: Turbomachinery Technical Conference and Exposition, American Society of Mechanical Engineers, Seoul, Republic of Korea, 13–17 June 2016. [Google Scholar]
  17. Park, S.; Gomez-Ramirez, D.; Gadiraju, S.; Kedukodi, S.; Ekkad, S.V.; Moon, H.K.; Kim, Y.; Srinivasan, R. Flow field and wall temperature measurements for reacting flow in a lean premixed swirl stabilized can combustor. J. Eng. Gas Turbines Power 2018, 140, 091503. [Google Scholar] [CrossRef]
  18. Pareja, J.; Lipkowicz, T.; Inanc, E.; Carter, C.D.; Kempf, A.; Boxx, I. An experimental/numerical investigation of non-reacting turbulent flow in a piloted premixed Bunsen burner. Exp. Fluids 2022, 63, 33. [Google Scholar] [CrossRef] [PubMed]
  19. Sun, F.; Suo, J.; Liu, Z. Effect of the swirl intensity on the non-reacting flowfields and fuel-air premixing characteristics for lean premixed combustors. J. Mech. Sci. Technol. 2022, 36, 433–444. [Google Scholar] [CrossRef]
  20. Twarog, K.; Mannaa, O.; Sung, C.J.; Mongia, H.C. On integrated experimentation and simulation of a counter-turning swirling mixer, part I: Experimentation. Aerosp. Sci. Technol. 2021, 119, 107186. [Google Scholar] [CrossRef]
  21. Sharaborin, D.K.; Savitskii, A.G.; Bakharev, G.Y.; Lobasov, A.S.; Chikishev, L.M.; Dulin, V.M. PIV/PLIF investigation of unsteady turbulent flow and mixing behind a model gas turbine combustor. Exp. Fluids 2021, 62, 96. [Google Scholar] [CrossRef]
  22. Cordier, M.; Vandel, A.; Renou, B.; Cabot, G.; Boukhalfa, M.A.; Esclapez, L.; Barré, D.; Riber, E.; Cuenot, B.; Gicquel, L. Experimental and numerical analysis of an ignition sequence in a multiple-injectors burner. In Proceedings of the ASME Turbo Expo 2013: Turbine Technical Conference and Exposition, San Antonio, TX, USA, 3–7 June 2013. [Google Scholar]
  23. Worth, N.A.; Dawson, J.R. Modal dynamics of self-excited azimuthal instabilities in an annular combustion chamber. Combust. Flame 2013, 160, 2476–2489. [Google Scholar] [CrossRef]
  24. Kao, Y.H.; Tambe, S.B.; Jeng, S.M. Aerodynamics study of a linearly-arranged 5-Swirler array. ASME Turbo Expo 2014: Turbine Technical Conference and Exposition. Am. Soc. Mech. Eng. 2014, 45684, GT2014-25094. [Google Scholar]
  25. Cho, C.H.; Sohn, C.H.; Cho, J.H.; Kim, H.S. Effects of burner interaction on NOx Emission from swirl premix burner in a gas turbine combustor. ASME Turbo Expo 2014: Turbine Technical Conference and Exposition. Am. Soc. Mech. Eng. 2014, 45691, GT2014-26174. [Google Scholar]
  26. Staffelbach, G.; Gicquel, L.; Boudier, G.; Poinsot, T. Large eddy simulation of self-excited azimuthal modes in annular combustors. Proc. Combust. Inst. 2009, 32, 2909–2916. [Google Scholar] [CrossRef] [Green Version]
  27. Dolan, B.J.; Villalva Gomez, R.; Nawroth, H.; Pack, S.; Gutmark, E.J. Study on the isothermal flowfields of interacting swirl-stabilized nozzles. In Proceedings of the 53rd AIAA Aerospace Sciences Meeting, Kissimmee, FL, USA, 5–9 January 2015. [Google Scholar]
  28. Grant, I. Particle image velocimetry: A review. Proceedings of the Institution of Mechanical Engineers, Part C. J. Mech. Eng. Sci. 1997, 211, 55–76. [Google Scholar] [CrossRef]
  29. Brend, M.A.; Denman, P.A.; Carrotte, J.F. Volumetric PIV measurement for capturing the port flow characteristics within annular gas turbine combustors. Exp. Fluids 2020, 61, 106. [Google Scholar] [CrossRef]
Figure 1. The high-fidelity test model. (a) Lateral view of the model; (b) Nozzle direction; (c) 3-D schematic diagram.
Energies 15 09551 g001
Figure 2. Light path inside the model.
Energies 15 09551 g002
Figure 3. Optical scheme. (a) Location of camera and laser; (b) Cross section; (c) Longitudinal section.
Energies 15 09551 g003
Figure 4. Section positions. (a) Cross sections; (b) longitudinal sections.
Energies 15 09551 g004
Figure 5. Air supply system. (a) 3-D schematic diagram; (b) Honeycomb.
Energies 15 09551 g005
Figure 6. Comparison of different average choices.
Energies 15 09551 g006
Figure 7. Shading system. (a) Shading tent; (b) Blackened surfaces inside the model.
Energies 15 09551 g007
Figure 8. Geometry and mesh of the two models. (a) Overall model geometry and mesh; (b) Partial model geometry.
Energies 15 09551 g008
Figure 9. Grid independence.
Energies 15 09551 g009
Figure 10. Comparison of different turbulence models. (a) Vxy on selected diameter of H4 and H5; (b) Surrounding nozzle recirculation zone size.
Energies 15 09551 g010aEnergies 15 09551 g010b
Figure 11. Comparison of the numerical simulation and experiment results.
Energies 15 09551 g011
Figure 12. Experiment results: Cross-section contour.
Energies 15 09551 g012
Figure 13. Flow coupling in section H3.
Energies 15 09551 g013
Figure 14. Self-similarity of cross-sections. (a) Velocity on a selected diameter for each working condition. (b) Average velocity-Mass Flow Rate.
Energies 15 09551 g014
Figure 15. Experiment results: Longitudinal section contour.
Energies 15 09551 g015
Figure 16. Relation between nozzles and selected planes.
Energies 15 09551 g016
Figure 17. Vxy on planes. (a) Vxy on Iso-surface R/D = 1.6 in different cases; (b) Vxy between nozzle 2 and 3 in Case 2, Case 3 and Case 7; (c) Vxy between nozzle 3 and 4 in Case 3, Case 4 and Case 7.
Energies 15 09551 g017aEnergies 15 09551 g017b
Figure 18. Recirculation zone information. (a) Vz on Iso-surface R/D = 1.6 in different cases; (b) Length and width of nozzle 2, 3 and 4; (c) Vz on plane C25 for different cases; (d) Vz on different planes in Case 7.
Energies 15 09551 g018aEnergies 15 09551 g018b
Figure 19. TKE information. (a) TKE on Iso-surface R/D = 1.6 in different cases; (b) TKE on different planes in Case 7; (c) TKE between nozzle 2 and 3 in Case 2, Case 3 and Case 7; (d) TKE between nozzle 3 and 4 in Case 3, Case 4 and Case 7.
Energies 15 09551 g019aEnergies 15 09551 g019b
Table 1. Mass ratio of surrounding nozzles in the overall model’s calculation.
Nozzle Number123456C
Mass ratio(%)13.8214.4113.5614.2813.7414.1815.40
Deviation from the surrounding nozzle average(%)−1.252.94−3.101.98−1.861.299.99
Table 2. Different cases under the partial model.
Case NameDescription
Case 2Only nozzle 2 is opened
Case 3Only nozzle 3 is opened
Case 4Only nozzle 4 is opened
Case COnly the central nozzle is opened
Case 7All nozzles are opened
Publisher’s Note: MDPI stays neutral with regard to jurisdictional claims in published maps and institutional affiliations.