Article

Optimal Design of Three-Dimensional Circular-to-Rectangular Transition Nozzle Based on Data Dimensionality Reduction

1
School of Power and Energy, Northwestern Polytechnical University, Xi’an 710129, China
2
Science and Technology on Scramjet Laboratory, CARDC, Mianyang 621000, China
*
Author to whom correspondence should be addressed.
Energies 2022, 15(24), 9316; https://doi.org/10.3390/en15249316
Submission received: 14 October 2022 / Revised: 28 November 2022 / Accepted: 5 December 2022 / Published: 8 December 2022

Abstract

:
The parametric representation and aerodynamic shape optimization of a three-dimensional circular-to-rectangular transition nozzle designed and built using control lines distributed along the circumferential direction were investigated in this study. A surrogate model based on class/shape transformation, principal component analysis and radial basis neural network was proposed with fewer design parameters for parametric representation and performance parameter prediction of the three-dimensional circular-to-rectangular transition nozzle. The surrogate model was combined with Non-dominated Sorting Genetic Algorithm-II to optimize the aerodynamic shape of the nozzle. The results showed that the surrogate model effectively achieved the parametric representation and aerodynamic shape optimization of the three-dimensional circular-to-rectangular transition nozzle. The geometric dimensions and performance parameters of the parametric reconstructed model were comparable to that of the initial model, implying that they can meet the needs of optimal design. The axial thrust coefficient and lift of the optimized nozzle were increased by approximately 0.742% and 15.707%, respectively.

1. Introduction

In recent years, several hypersonic vehicles with rectangular shapes have been designed using scramjet engines with circular or elliptical combustion chambers as power systems due to the improvement of computational and analytical capabilities. Using circular isolators and burners can significantly reduce the weight and component thermal load while guaranteeing performance comparable to that achieved using a two-dimensional (2D) system [1]. The HyCAUSE demonstrator [2] and the T/RBCC exhaust system [3] both utilize round flow paths. The transonic acceleration performance of the T/RBCC exhaust system is better than that of TBCC. For a vehicle with a rectangular shape, matching the combustion chamber to the vehicle shape should be considered. Three-dimensional (3D) asymmetric expansion nozzles with different inlet and outlet shapes can achieve an integrated design with the hypersonic vehicle and satisfy the power requirements of the vehicle.
Several studies have been conducted to explore the design methods and flow characteristics of 3D asymmetric expansion nozzles. Ridway et al. [4] reported that the expansion ramp shape, angle, exit area and cowl shape have a significant effect on the thrust of a single expansion ramp nozzle (SERN). Shenkin et al. [5] conducted calculations and experiments to investigate the effect of different schemes of SERN and its main geometric parameters on performance. The results showed that SERN exhibited good engine thrust characteristics at the maximum continuous supersonic cruise flight regimes. Zhang et al. [6] observed that inlet non-uniform Mach number, shock wave and expansion wave coupling significantly decreased the performance of SERNs. Lv et al. [7] proposed a new method for 3D nozzle design considering lateral expansion and geometric constraints. However, the nozzle inlets and outlets obtained using this method design were rectangular. The two commonly used design methods for the 3D asymmetric expansion nozzle with different inlet and outlet shapes are (1) the osculating thought-based design method used by You et al. [8] for cross-sectional controllable inlet design and introduced by Lu et al. [9] and applied to cross-sectional controllable nozzle design; and (2) the bi-directional streamline tracking method that can be used for design of 3D scramjet nozzles with shape transformation, proposed by Lv et al. [10]. The essence of both methods is to construct the nozzle using a set of shape control lines distributed along the circumference. The length of the nozzle should be shortened to meet the length limits for practical use. However, this inevitably reduces the nozzle performance [11,12]. Therefore, several studies have been conducted to improve the performance of these nozzles through parameterization and optimization techniques. Damira [13] and Gao [14] used cubic spline curves to achieve a parametric representation of a 3D rectangular asymmetric expansion nozzle ramp, and used MATLAB and sequential quadratic programming algorithms to improve nozzle performance, respectively. Zhu et al. [15] used the streamline tracing method to build a 3D asymmetric expansion nozzle and improved the performance of the 3D nozzle by optimizing the shape of the reference nozzle. The above studies, however, did not directly parametrically represent a 3D asymmetric expansion nozzle designed based on the osculating method or the streamline tracing method.
The Class/Shape Transformation (CST) method proposed by Kulfan et al. [16] is characterized by few design parameters and high applicability. Various common 2D and 3D shapes can be parametrically expressed using this method. Many scholars have recently used this method to implement parametric representations of geometry [17,18,19] and have developed several improvements [20,21,22]. Notably, the existing 3D CST methods are described in Cartesian coordinates and cannot directly parametrically represent the 3D asymmetric expansion nozzle with the control line distributed along the circumferential direction. Using the 2D CST method to parametrically each control line leads to too many design parameters.
Although the parametric representation of the 3D asymmetric nozzle can be achieved using the 3D CST method, there are generally too many design parameters obtained. The use of principal component analysis (PCA) methods can effectively reduce the number of original design variables, while retaining their flexibility [23]. Berguin and Mavris [24] applied the PCA method to optimize the aerodynamic performance of an on-wing nacelle. Qiu et al. [25] successfully reduced the design variables using PCA to optimize the transonic airfoil shape. Tao et al. [26] combined PCA with Deep Belief Network to successfully optimize the shapes of a natural laminar flow airfoil and a transonic airfoil using an improved particle swarm algorithm. The findings from the above studies show that PCA can be used to effectively reduce design variables and improve optimization efficiency.
The research object in the present study is a 3D asymmetric expansion nozzle designed using shape control lines distributed along the circumferential direction. It is referred to as a 3D circular-to-rectangular transition nozzle in this study owing to its circular inlet and rectangular outlet. This study is organized as follows: in Section 2, the method used to construct the 3D circular-to-rectangular transition nozzle, the nozzle shape and geometric constraints are described. The validation of the Computational Fluid Dynamics (CFD) numerical method and mesh used in the study is presented in Section 3. In Section 4, the CST method used to parametrically represent a 3D circular-to-rectangular transition nozzle constructed using control lines distributed along the circumference is first presented. The PCA method is then described. In Section 5, the initial model of the 3D circular-to-rectangular transition nozzle is parametrically represented using the proposed CST method. Then, the accuracy of the method is verified by CFD calculations. PCA is subsequently used to reduce the number of design variables and applied to create the Radial Basis Function Neural Network (RBFNN). The aerodynamic performance of the 3D circular-to-rectangular transition nozzle is optimized by combining the CST-PCA-RBFNN-based surrogate model with the Non-dominated Sorting Genetic Algorithm-II (NSGA-II) [27]. Finally, in Section 6, some conclusions are presented based on the results and analysis. In this study, a parameterized representation of a 3D asymmetric expansion nozzle with shape control lines distributed along the circumferential direction was innovatively implemented using the CST method. The design variables were successfully reduced using the data dimensionality reduction technique and the aerodynamic performance was successfully improved by an optimization algorithm.

2. Model Description and Performance Parameter Definition

2.1. Geometric Shape of 3D Circular-to-Rectangular Transition Nozzle

In this study, a 3D circular-to-rectangular transition nozzle was designed under strict geometric constraints. The main constraints are presented in Table 1. Each parameter was dimensionless using the inlet radius. The l, w and r inlet in Table 1 represent the length, width and inlet radius of the nozzle, respectively. The restrictions on the nozzle length and width were chosen to satisfy the geometric constraints when designing to achieve an integration with the aircraft. The bottom edge of the outlet should be straight so that it can mount a rotating cowl. In addition, the outlet section should have a certain inclination. A nozzle obtained directly using the osculating method or the streamline tracing technique does not simultaneously meet the constraint parameters. A 3D circular-to-rectangular transition nozzle was also built using multiple control lines distributed along the circumferential direction. Each control line was separately shortened using the nonlinear shortening method proposed by Quan [11] to satisfy the constraint. Therefore, the method of designing the nozzle in this study was an approximate design method based on the implementation process of the osculating method and streamline tracing technique.
Figure 1a shows the relative positions of the inlet and outlet of the nozzle and the distribution of the circumferential cross-section in this study. Using a centered layout for the nozzle inlet and outlet requires making a bevel cut to the nozzle or a nonlinear shortening of the lower expansion surface for the nozzle to satisfy the constraint. However, this results in a nozzle exit bottom edge that cannot be fitted with a rotatable fairing (because the bottom edge is not straight) or reduces the performance of the lower expansion surface. Therefore, the inlet and outlet layout shown in Figure 1a was used in this study. Therefore, the inlet and outlet layout shown in Figure 1a was used in this study. Figure 1b illustrates the process of designing the initial model of the 3D circular-to-rectangular transition nozzle. A total of 16 circumferential sections were used, and the axisymmetric reference flow fields were located within each section. The inlet radius of the reference flow field was denoted OA, whereas the outlet heights were denoted OA’, OB’, OC’, etc. The set of control lines used in building the initial model was obtained by determining the reference flow field within each circumferential section. Subsequently, each axisymmetric reference profile was nonlinearly shortened to achieve the geometric constraints. The 3D circular-to-rectangular transition nozzle designed in this study was obtained after boundary layer correction.
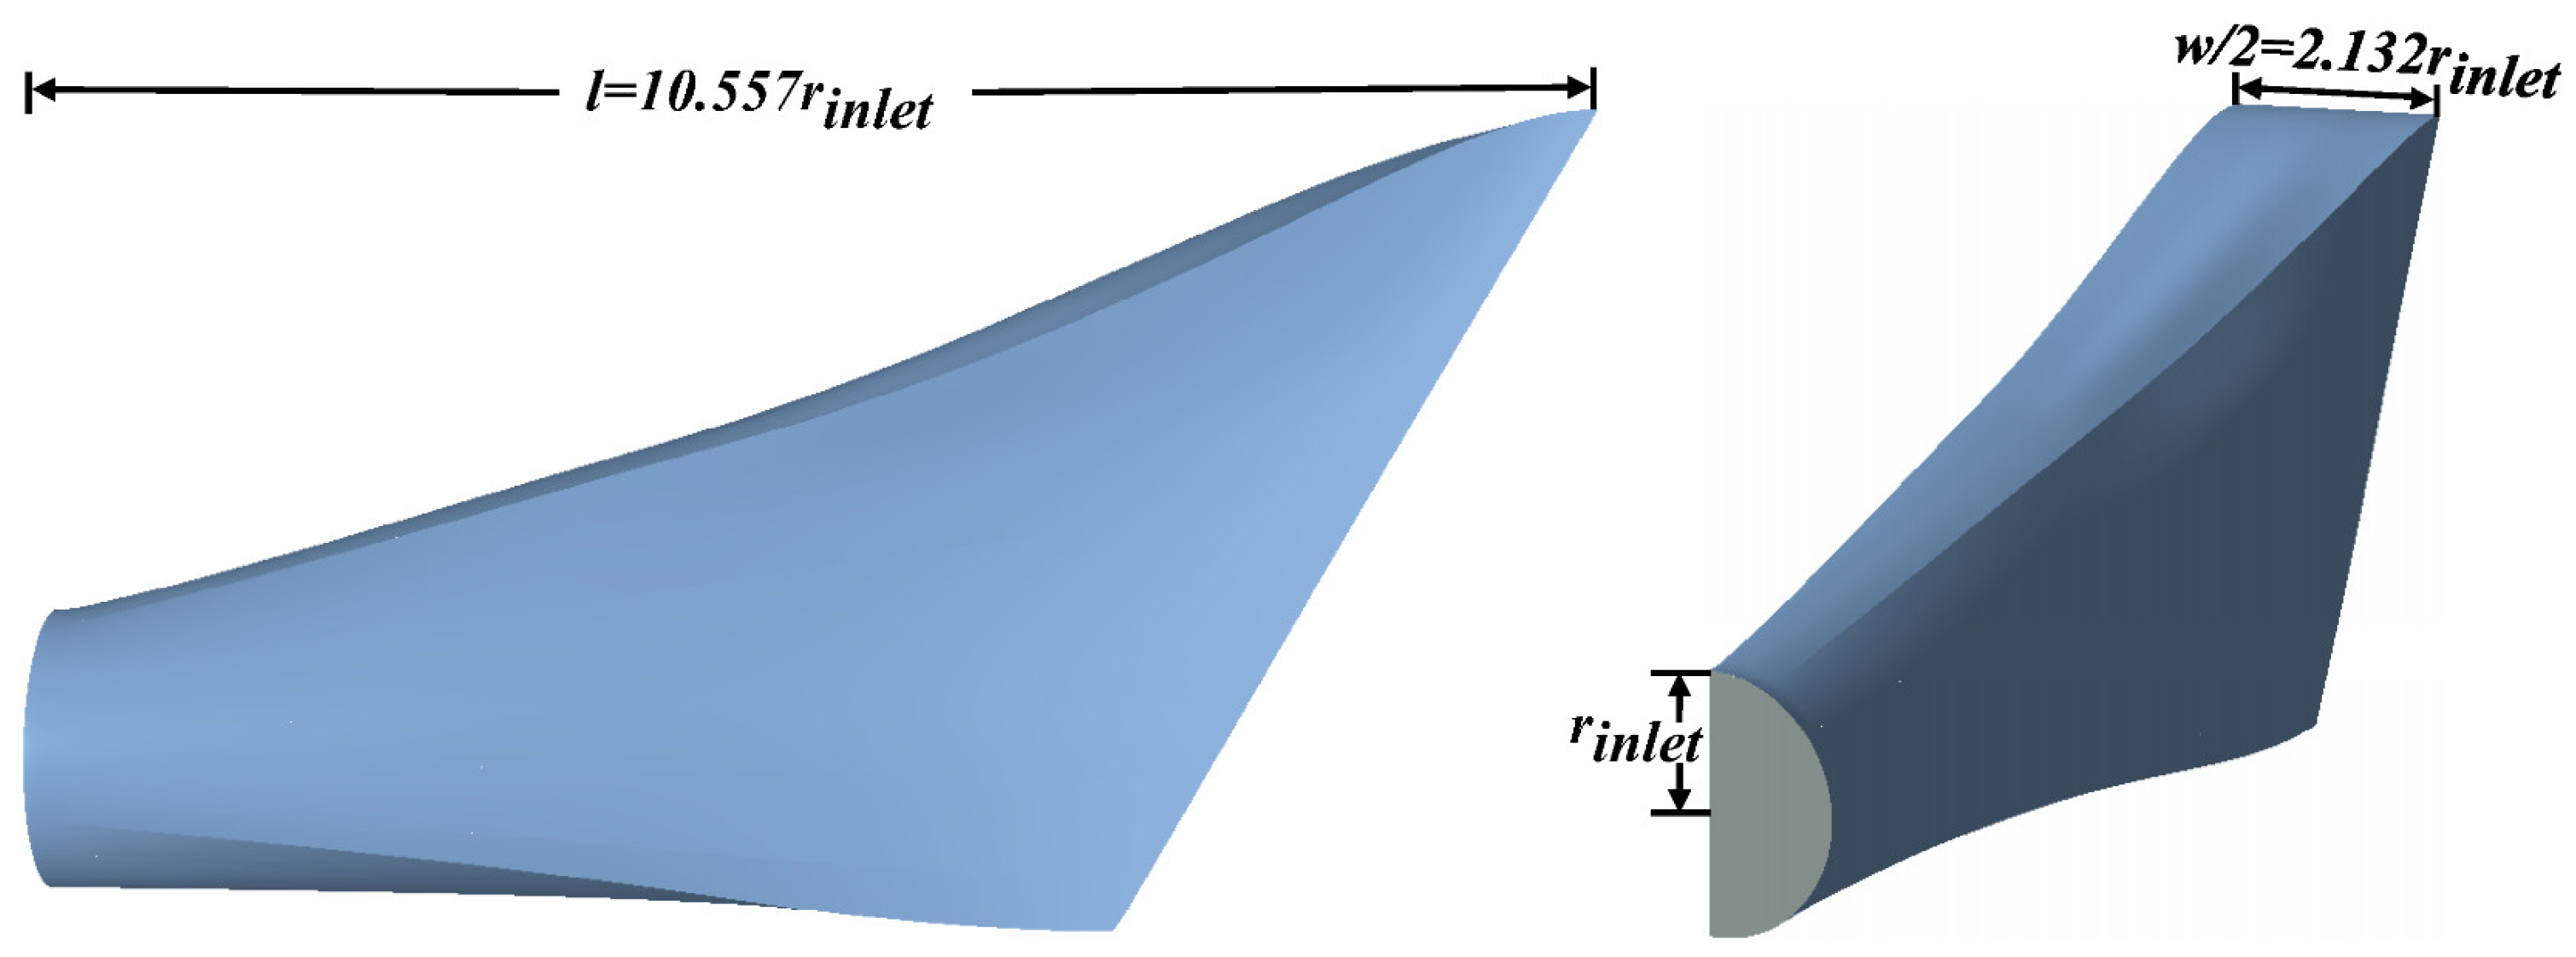
Figure 2 illustrates the 1/2 model and dimensions of the nozzle designed in this study. The nozzle inlet radius was rinlet, whereas the l and w of the nozzle were 10.557rinlet and 4.264rinlet, respectively. This was the initial model used to perform aerodynamic shape optimization in this study.

2.2. Definition of Performance Parameters

In this study, axial thrust coefficient and lift were used for the evaluation of the nozzle performance. The axial thrust coefficient was defined as the ratio of the axial component of the excess impulse at the outlet cross-section of the exhaust system to the ideal isentropic thrust and was determined using the equation below:
C fx = I ex F s
where Cfx denotes the axial thrust coefficient, Iex represents the nozzle outlet excess impulse, and Fs indicates the ideal isentropic thrust of the nozzle.
The entire nozzle inner flow channel was considered the control body for illustration. The law of conservation of fluid momentum in the open system states that the x-directional component of the outlet impulse can be expressed as the difference between the x-directional impulse of the inlet and the x-directional component of the force acting on the inner surface of the flow channel [28], as shown in the following equation:
I ex = m ˙ inlet V inlet , x + ( p inlet p amb ) A inlet , x R x
where m ˙ inlet represent the mass flow rate of the nozzle inlet and Vinlet,x denotes the x-directional component of the mainstream velocity at the nozzle inlet. pinlet and pamb represent the static pressure at the nozzle inlet and the ambient pressure, respectively. Ainlet,x indicates the projected area of the nozzle inlet in the x-direction. Rx denotes the x-directional component of the relative pressure and viscous force integral on the inner wall surface of the nozzle. The surface of the integral is represented as the blue surface in Figure 2.
The ideal isentropic thrust of the nozzle was denoted as Fs and was expressed as follows:
F s = m ˙ 2 γ γ 1 R T t [ 1 ( p amb p t ) γ 1 γ ]
where m ˙ denotes the theoretical mass flow rate, γ represents the specific heat ratio, and R denotes the gas constant. Tt and pt denote the total temperature and total pressure, respectively.
The lift of the nozzle was expressed as the y-directional component of the relative pressure and viscous force integral on the inner wall of the nozzle, denoted as L.

3. Numerical Simulation and Validation of the Method

3.1. Governing Equations

Fluent is a commercial software with high stability and reliability in flow field simulation. Thus, it was used in this study to obtain detailed flow fields for all nozzles. A density-based solver was used because the nozzles operated at high flight Mach numbers and the plume Mach numbers exceeded the speed of sound. The nozzle with the transition from circular to rectangular shape could not be reduced to a 2D shape and was thus evaluated in 3D space. The use of a steady-state solver was reliable for the analysis of the nozzle since the unsteady effects of the plume were not the focus of this study. The assumption was that the working fluid was ideal and compressible, and its specific heat and thermal conductivity were temperature-independent constants. The specific heat of the nozzle designed in this study was calculated from the known R and γ for different operating conditions. The flow field was solved using an implicit solver. A Green–Gaussian cell-based scheme was used for the gradient term, and a second-order upwind scheme was used for the convection term. Simulations were performed using a standard k-ε two-equation turbulence model with a standard wall function to deal with the flow field near the wall. The flow was governed by the continuity, momentum, and energy equations. Steady-state calculations were used in this study. Thus, the continuity equation can be expressed as follows:
· ( ρ V ) = 0
where ρ represents the density and V denotes the velocity.
The momentum equation was expressed as follows:
· ( ρ VV ) = p + · τ ij
where τij represents the viscous stress tensor and p denotes the static pressure. The energy equation can be expressed as shown below:
p ( · V ) = · ( λ T ) + · ( V · τ ij ) + ρ q
where λ denotes the thermal conductivity. The viscosity μ was expressed as shown below:
μ = μ l + μ t
The laminar viscosity μ l was calculated according to Sutherland’s law with three coefficients as follow:
μ l = μ 0 ( T T 0 ) 3 / 2 T 0 + S T + S
where μ 0 = 1.716   ×   10 5   Pa · s , T 0 = 273.11   K , and S = 110.56   K represent the reference viscosity, reference temperature, and effective temperature, respectively. T denotes the static temperature.
The turbulent viscosity μ t was obtained from the standard k–ε two-equation model, and the definition of turbulent viscosity of the model was expressed as follows:
μ t = ρ C μ k 2 ε
where k and ε denote the turbulent kinetic energy and rate of dissipation of the turbulent kinetic energy, respectively. C μ is a constant at 0.0845.

3.2. Validation of the Numerical Simulation Method

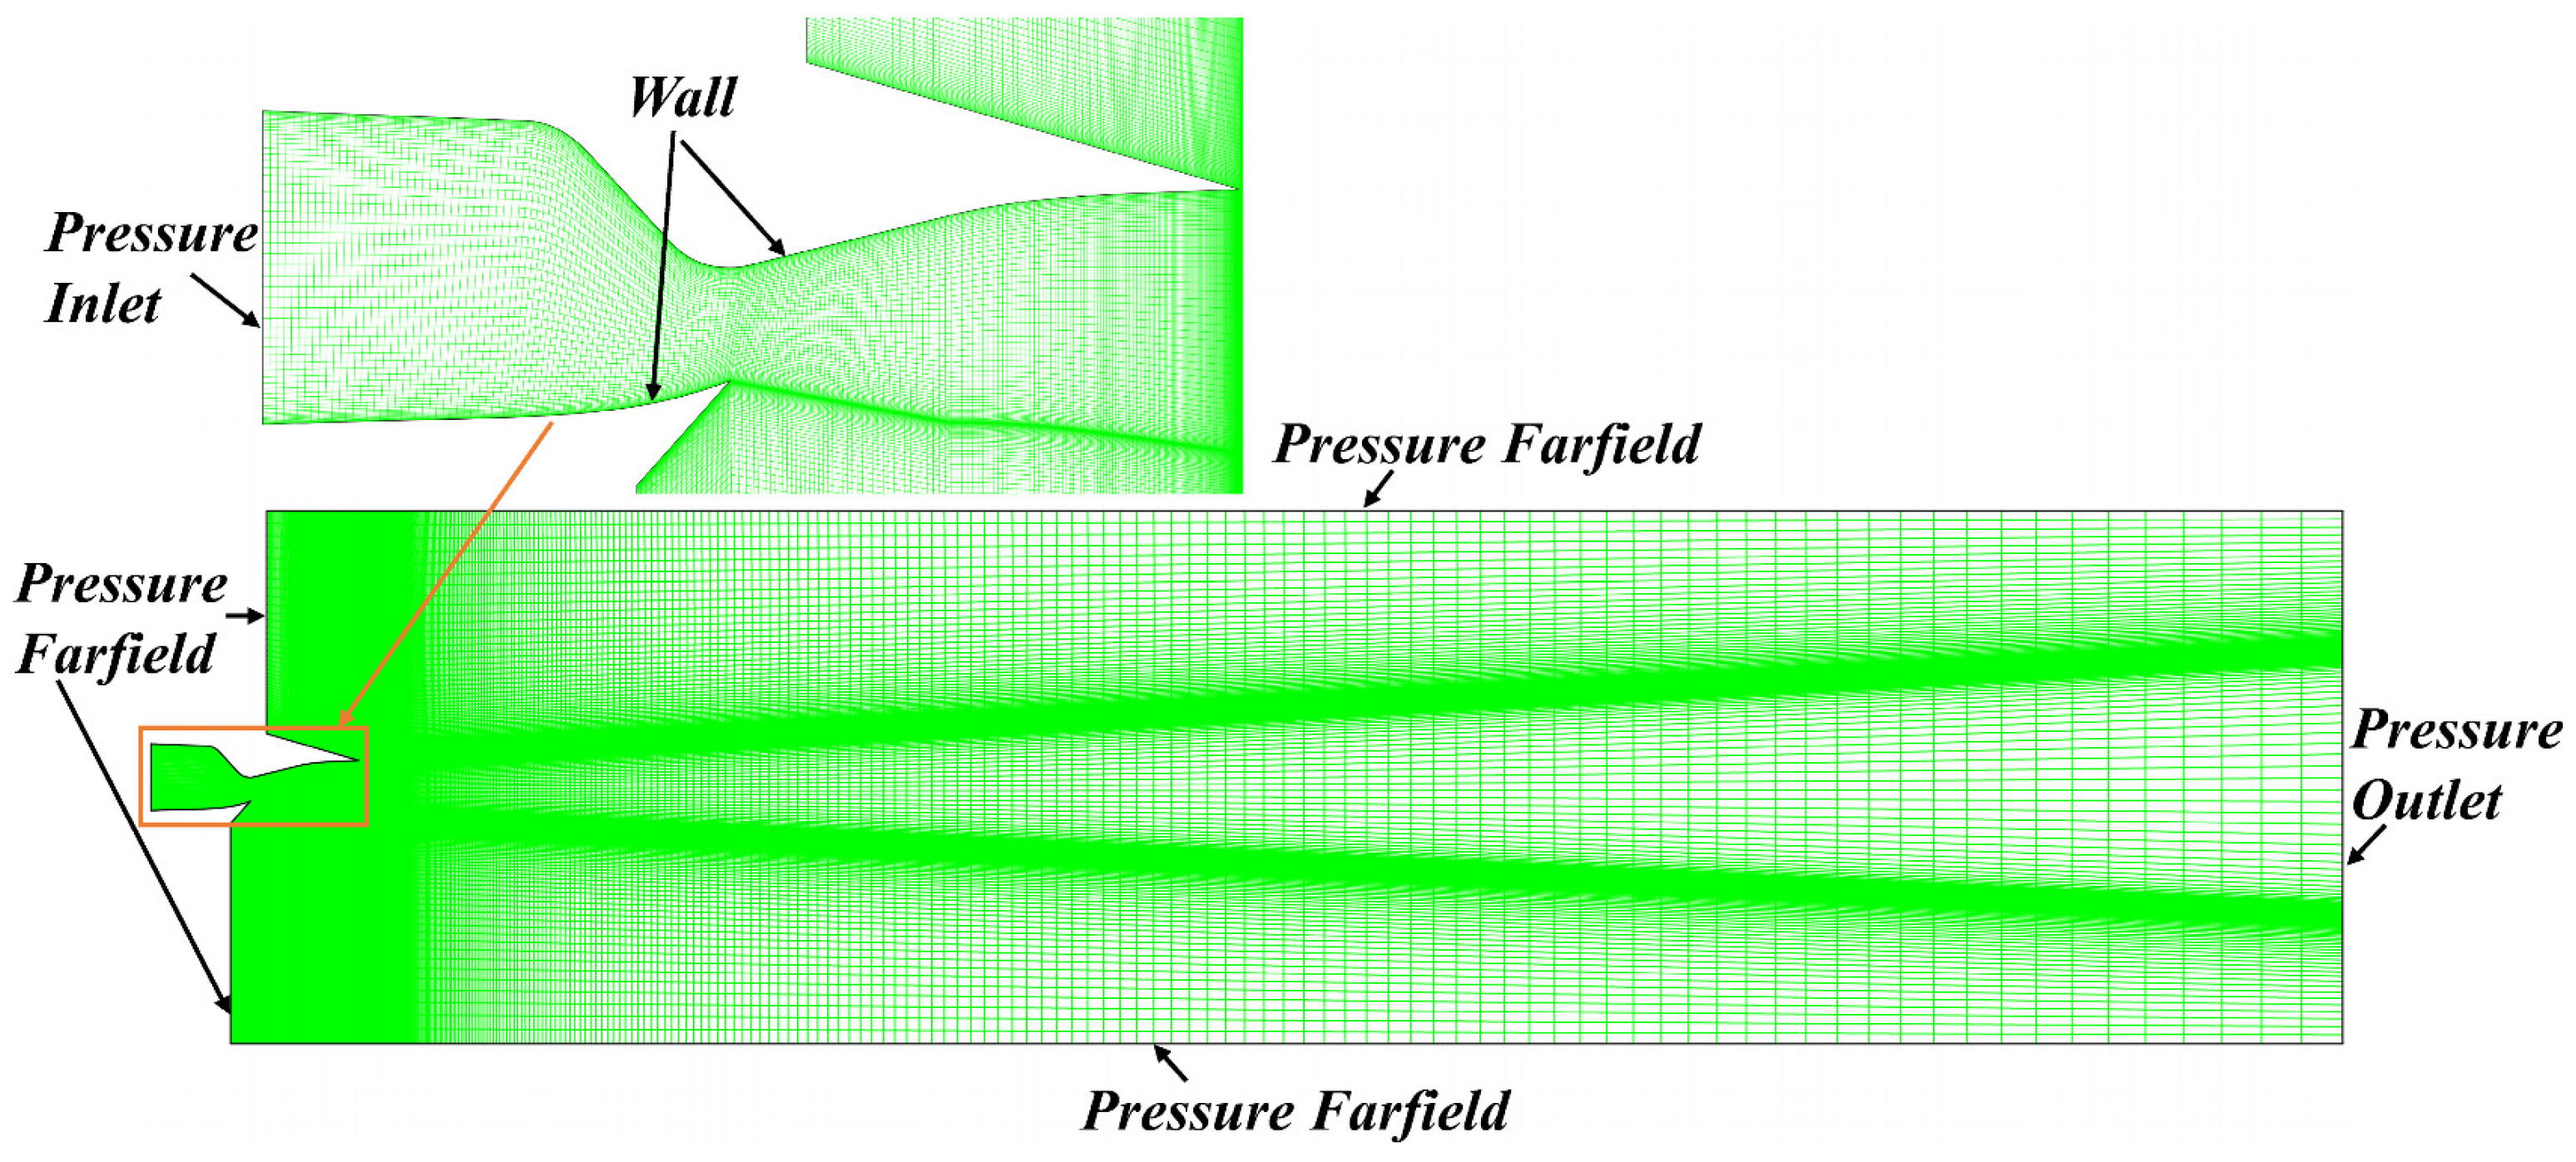
The ability of the standard k-ε model to predict the nozzle flow field structure was first verified. The single ramp expansion nozzle used by the Langley Center in their study on the effect of different geometric parameters on nozzle performance was used as a calibration example [29]. Figure 3 shows the geometry, the mesh and the boundary conditions used for verification. The design nozzle pressure ratio (NPR) of the nozzle was 7.9. The operating conditions of NPR = 2.502 and 10.009 were selected based on the experiment data to represent the possible over- and under-expansion states of the nozzle. A structural mesh was used to divide the flow field computational domain. The mesh near the walls was refined to meet the requirements of the standard k-ε turbulence model with standard wall functions.
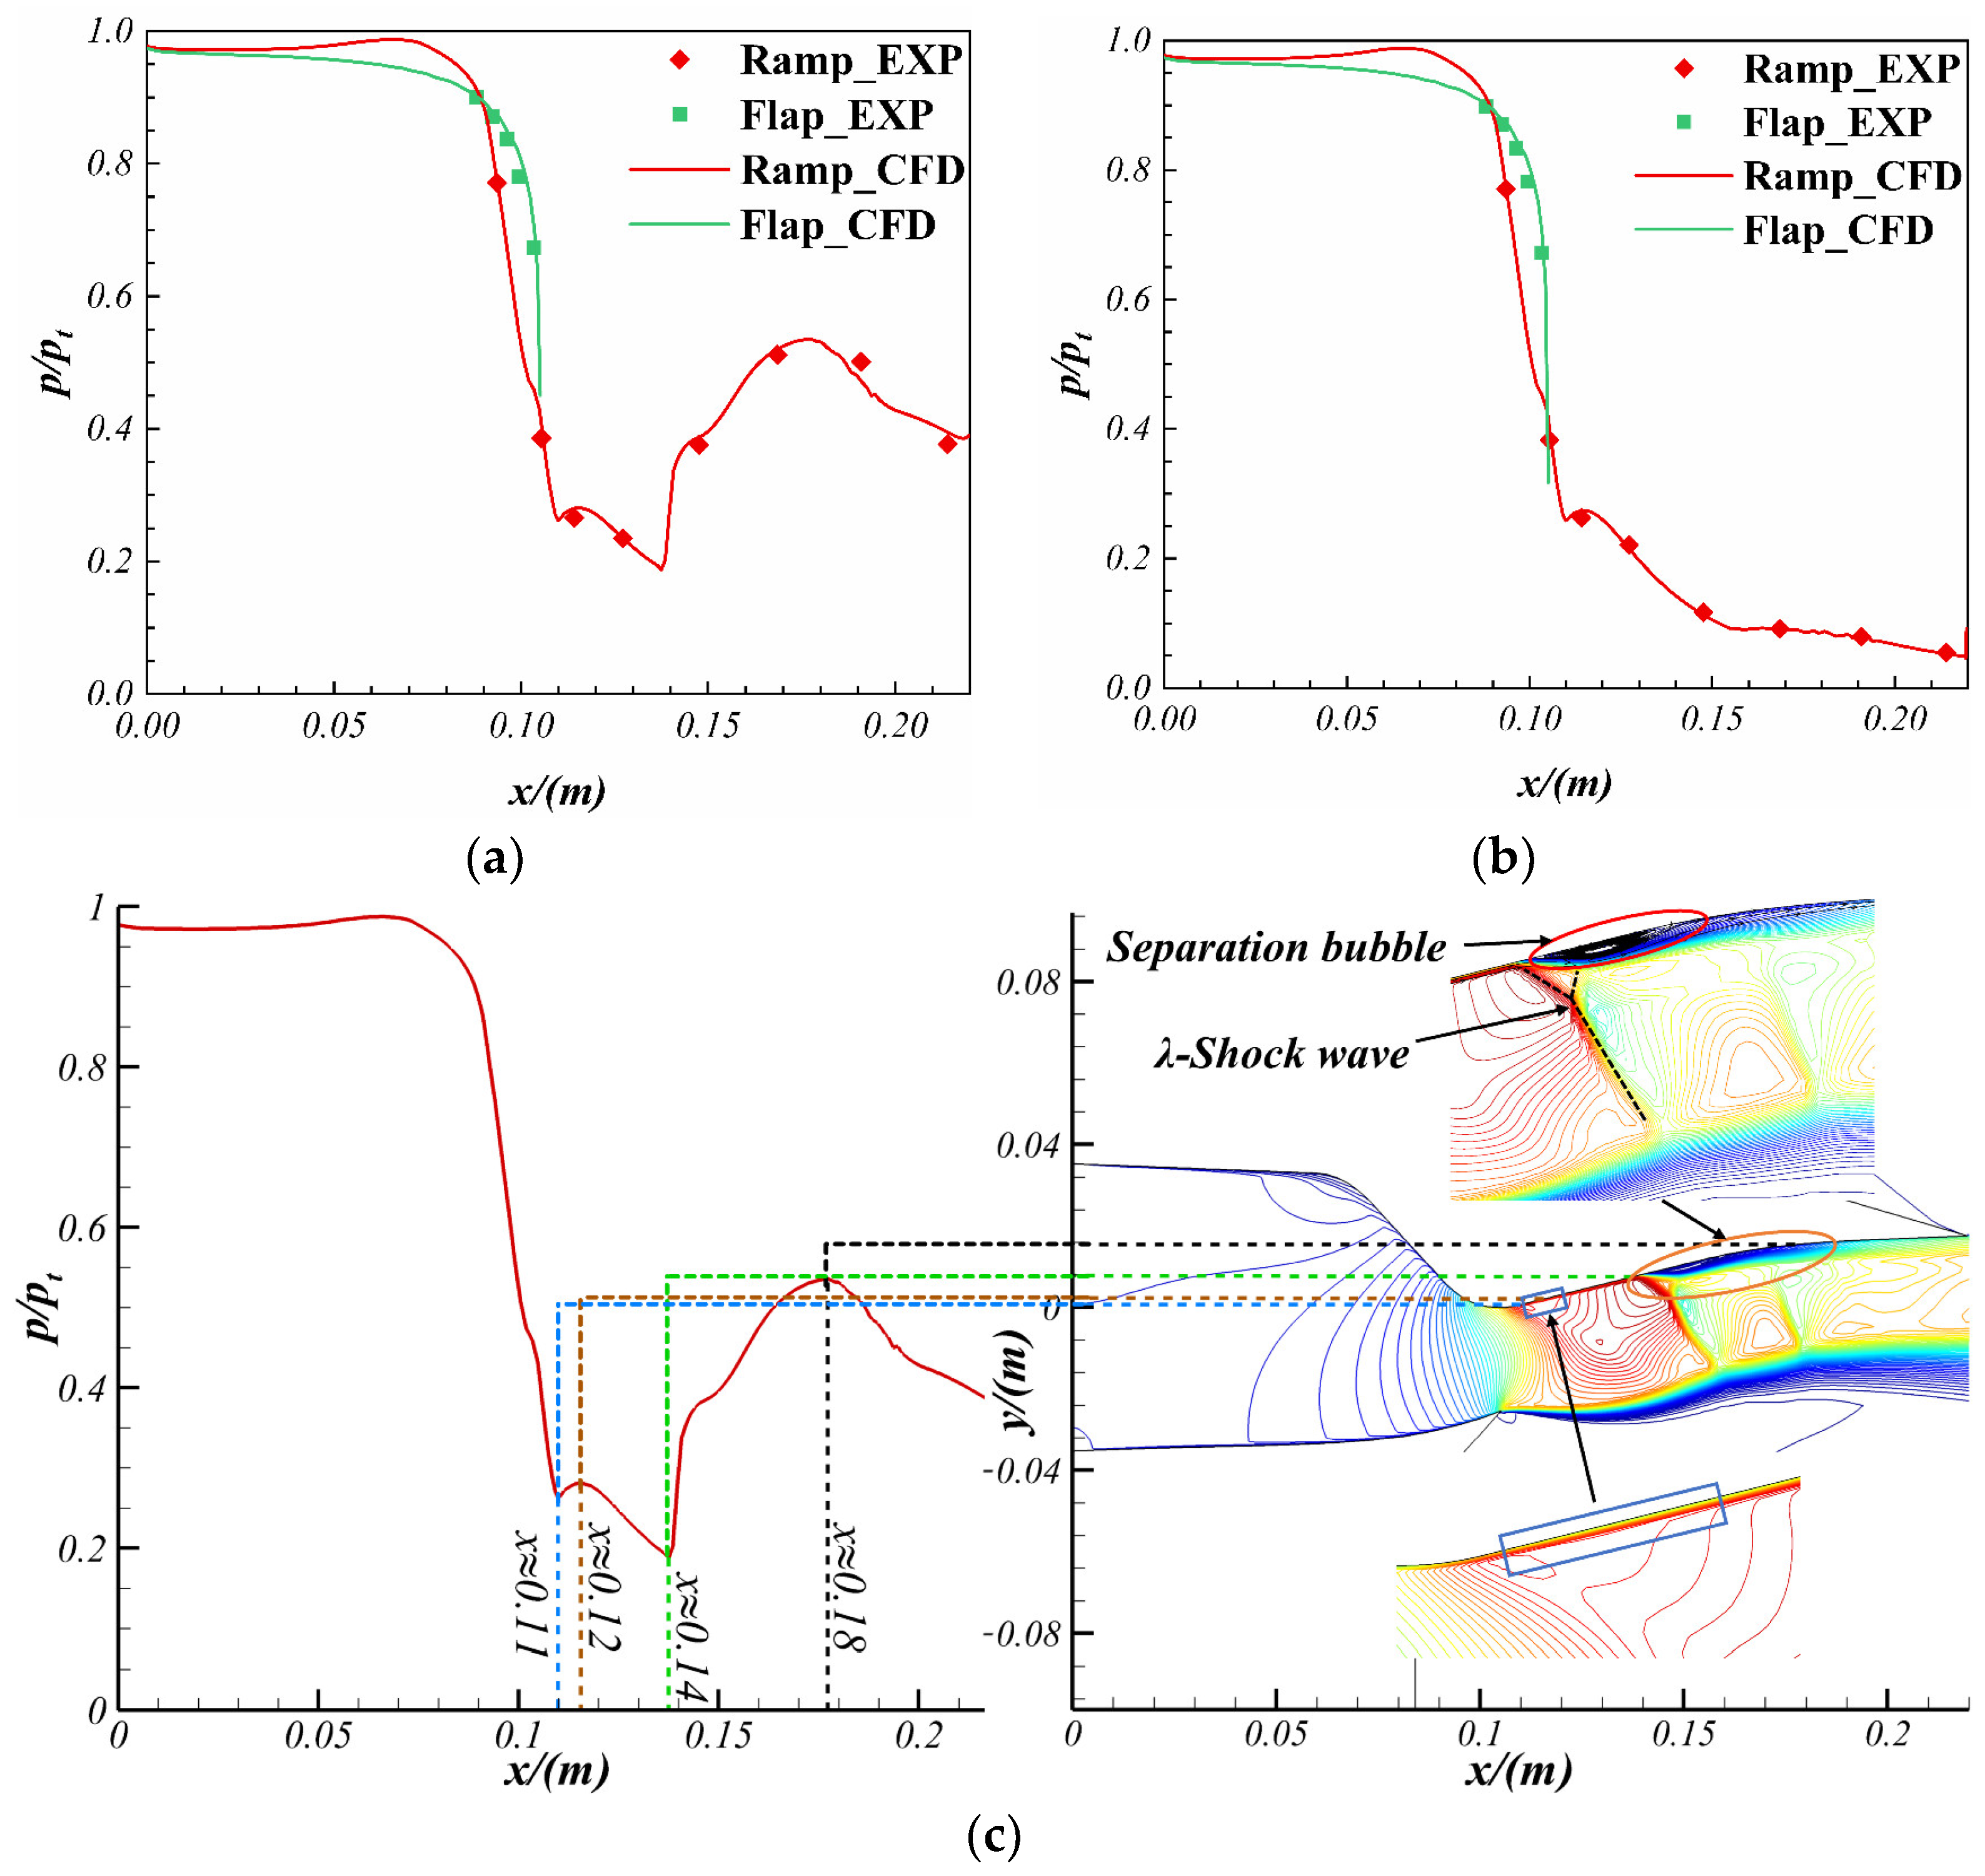
A detailed comparison of the wall pressure between the calculated and experimental results at different operating conditions is shown in Figure 4a,b. The horizontal axis indicated the absolute coordinate of the axial position and the vertical axis represented the pressure using the inlet stagnation pressure dimensionless. Figure 4c represents the Mach number contour of the flow field when NPR = 2.502, showing the structural features of the flow field, such as the shock wave boundary layer interference phenomenon and the separated shock waves. Although the use of the wall function has some limitations (such as limiting the accuracy of the model in resolving near-wall flow and possible delays in predicting separation due to large pressure gradients), the validation results showed that the calculated values were consistent with the experimental data. The nozzle used in this study works under the design conditions, and any separation that occurred in the flow was only caused by geometry changes. Therefore, the use of the wall function had no significant effect on the results. Consequently, the standard k-ε turbulence model with standard wall functions was used in this study.

3.3. Mesh Validation

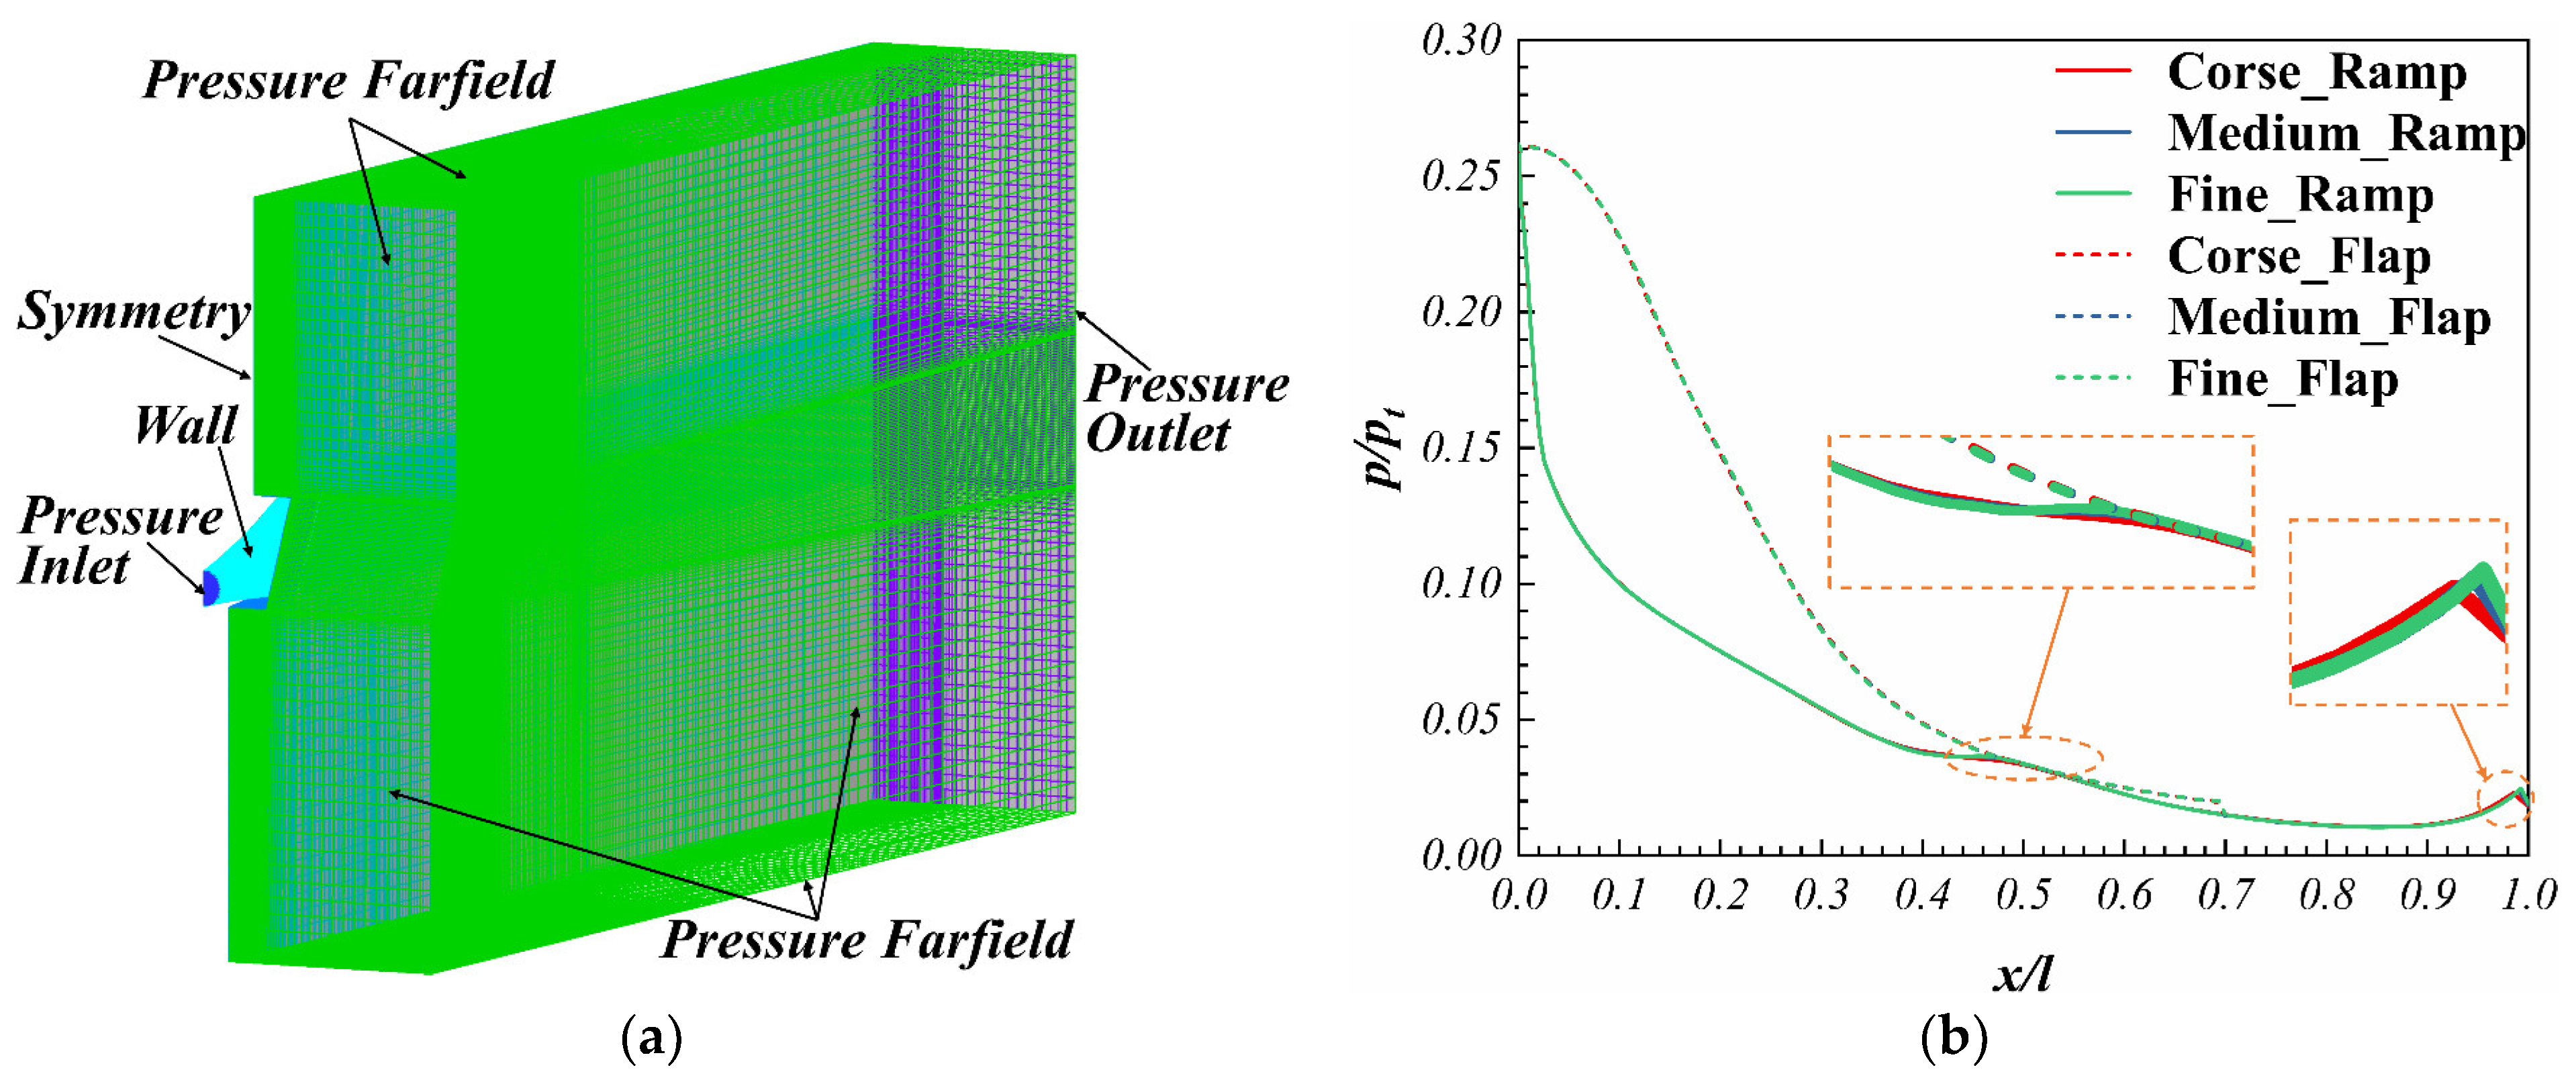
The 3D structural mesh was divided using ICEM and boundary conditions were used for the calculation, as shown in Figure 5a. The walls of the nozzle were set to be adiabatic and non-slip. The computational domain size was approximately 8.8 l × 4.4 l × 6 w to minimize the effect of the far field on the results. The height of the first layer of the mesh was set to 0.05 mm to ensure that the y+ of the nozzle wall satisfied the wall function. The calculations were performed at the design condition of the nozzle with the aerodynamic parameters shown in Table 2.
Figure 5b and Table 3 illustrate the results of an independent mesh study conducted using three different meshes. The maximum relative error of the nozzle wall pressure for the three meshes was 2.698%. An error of less than 0.375% between the medium and fine meshes indicates the high accuracy of the solution for medium and finer meshes. Therefore, a mesh with approximately 177,061 cells was used for all subsequent analyses, and it revealed the real flow field at a reasonable computational cost. For descriptive purposes, nozzles mentioned below were used to refer to 3D circular-to-rectangular transition nozzles when not specifically stated.

4. CST-PCA-RBFNN-Based Surrogate Model

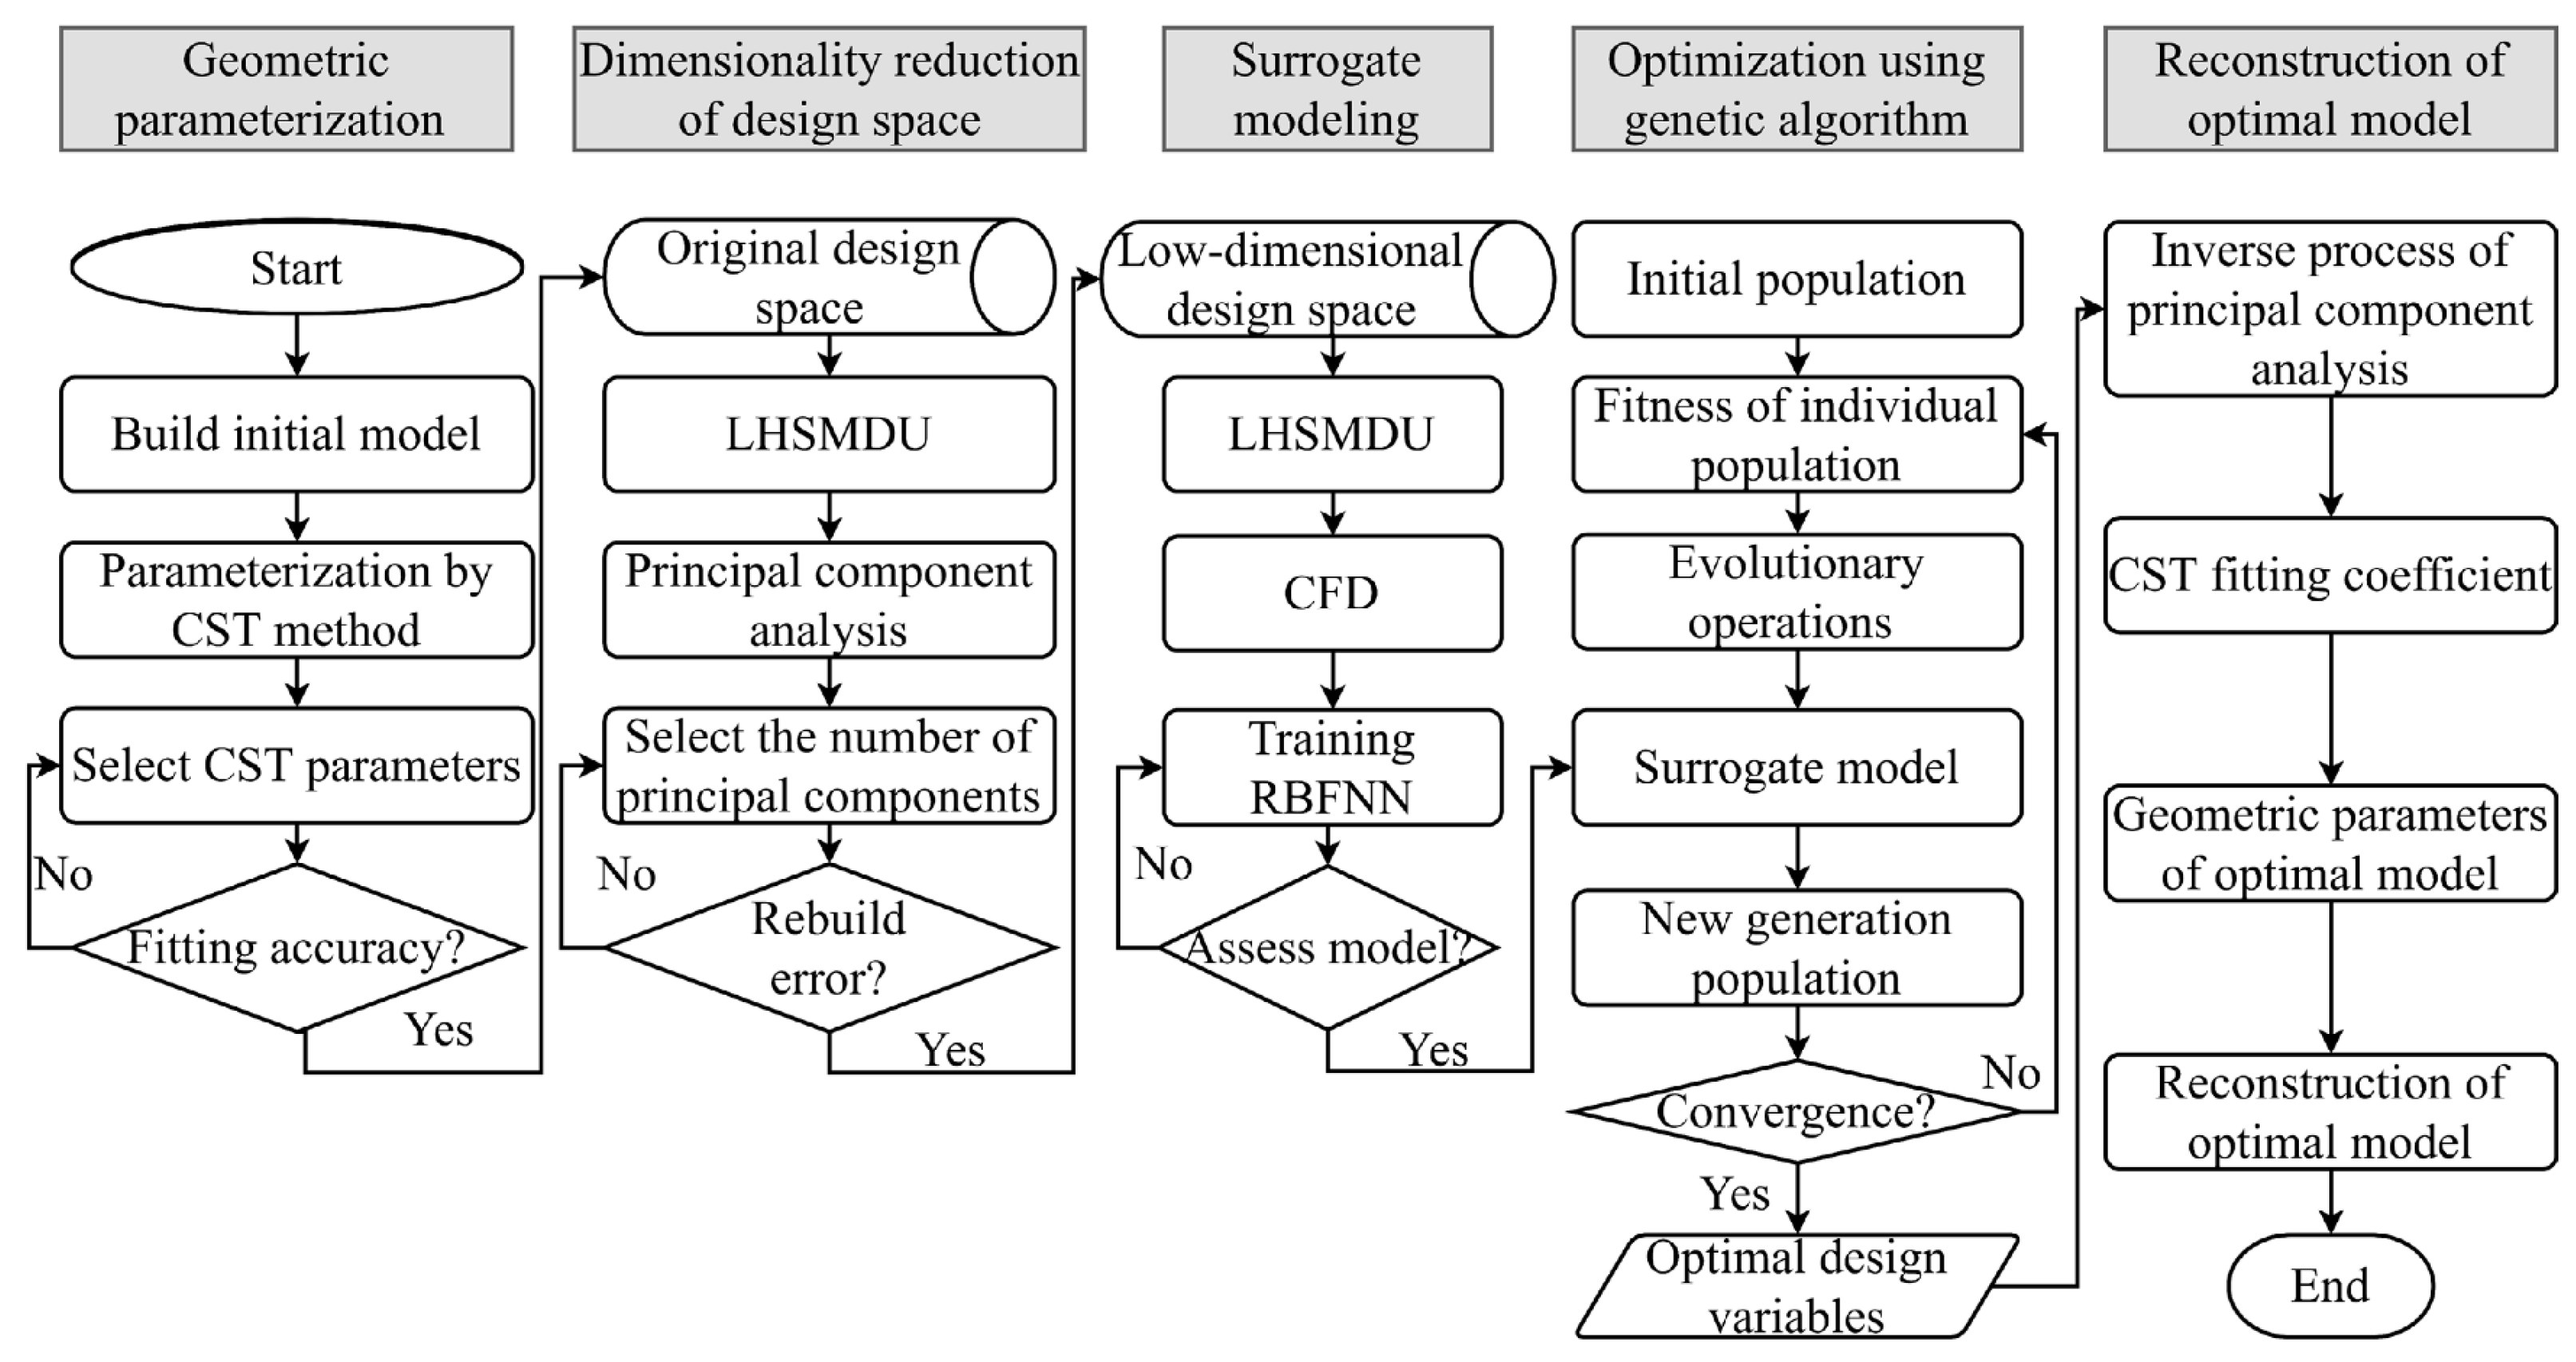
In this study, the CST method was used to parametrically express the geometry of the nozzle. The CST parameters obtained from the solution were the parameters used to design the shape of the nozzle. The PCA technique was used to reduce the number of design parameters, decrease the training complexity of RBFNN, and accelerate the convergence of the optimization. The specific parameterization and optimization strategy are shown in Figure 6.

4.1. CST Method for 3D Circular-to-Rectangular Transition Nozzle

In this study, the expression of the 3D CST method was converted from a Cartesian to a cylindrical coordinate system inspired by a study conducted by Feng Zhu [30]. The nozzle used in this study was parametrically represented using the transformed expression. The obtained equation was as shown below:
r U ( ψ , ϑ ) = C N 2 N I ( ψ ) i = 0 n j = 0 m B i , j S j ( ϑ ) S i ( ψ ) + ψ r T ( ϑ ) + r N ( ϑ )
x = ψ C local
y = r U ( ψ , ϑ ) C local cos α
z = r U ( ψ , ϑ ) C local sin α
where ψ = x / C local , ϑ = α / π . r U ( ψ , ϑ ) denotes the radius of the point on the control line. Clocal denotes the chord length of the local control line and α represents the angle between the plane where the control line is located and the symmetry plane. r T ( ϑ ) and r N ( ϑ ) represent the tail height of the control line and the radial offset of the control line, respectively. Si(ψ) and Sj(ϑ) denote Bernstein polynomials and Bij denotes the coefficient of Bernstein polynomial. x, y and z denote the Cartesian coordinates of the points on the control line. The class function C N 2 N 1 ( ψ ) was expressed as follows:
C N 2 N 1 ( ψ ) = ψ N 1 · ( 1 ψ N 2 )
where the exponents N1 and N2 were referred as class parameters.
In this study, the parameterized representation of the nozzle was achieved by setting both N1 and N2 to 1. The values of the CST parameters (Bi,j) were obtained by fitting them to the initial model. Different nozzle models were rebuilt by changing the values of Bi,j. Specifically, the Cartesian coordinate values of the nozzle circumferential control lines were obtained by coordinate transformation after obtaining r U ( ψ , ϑ ) using Bi,j. The 3D model of the nozzle was then built from the coordinate values. The 3D CST method uses a set of equations to represent the entire surface instead of describing the control lines in each control section separately. This method was used to model the nozzle to eliminate the non-smoothness caused by interpolation between control sections and reduce the number of design variables. The CST method ensures that the generated surfaces are continuously curved when the shapes of adjacent control lines differ significantly.

4.2. Principal Component Analysis Method

PCA is a linear dimensionality reduction method commonly used for flow field analysis and data dimensionality reduction. The number of samples in a set of training data { P i ( u ) : 1 i m , u Ω } can be denoted as m, whereas the design variable dimension can be represented as n. The matrix form of this example will then be expressed as follows:
P = ( P 1 ( u ) P 2 ( u ) P m ( u ) ) = ( u 11 u 12 u 1 m u 21 u 22 u 2 m u 31 u 32 u 3 m u n 1 u n 2 u nm )
Each sample data can be expressed as the sum of the sample mean and fluctuation values:
P i ( u ) = P ¯ ( u ) + P i ( u )
P ¯ ( u ) = 1 m i = 1 m P i ( u )
PCA transforms these fluctuations onto a hyperplane such that the projections of the sample points on this hyperplane are as separated as possible. The new coordinate system obtained after projective transformation is expressed as { q 1 , q 2 , , q n } , where q k represents the standard orthonormal basis. The matrix form can be expressed as Q * = ( q 1 , q 2 , , q n ) . The projection of the sample P i ( u ) on the hyperplane in the new space is denoted as Q T P i ( u ) . Maximizing the variance ensures that the projections of all sample points are as separated as possible. The projection points should satisfy the following equation:
C q k = λ k q k
where C = P P T represents the covariance matrix of P . Eigenvalue decomposition of the covariance matrix is conducted to obtain the eigenvector q k and eigenvalue λ k . The eigenvalues are arranged in descending order as follows: λ 1 λ 2 λ 3 λ n . Principal components are then obtained by adjusting the order of the eigenvectors corresponding to each eigenvalue.
The explained variance rate for each eigenvalue can be calculated as shown below:
λ i j = 1 n λ j × 100 %
The cumulative explained variance rate is then obtained by summing the explained variance rate of each eigenvalue. The explained variance rate and cumulative explained variance rate of the eigenvalues are also known as the contribution rate and cumulative contribution rate of the principal components. The eigenvectors corresponding to the first n′ (n′ < n) eigenvalues are selected to form Q * = ( q 1 , q 2 , , q n ) . The expression of the sample fluctuation value in the new low-dimensional space was obtained using the following equation:
Z = Q * T P = ( z 11 z 12 z 1 m z 21 z 22 z 2 m z 31 z 32 z 3 m z n 1 z n 2 z n m )
where Z′ represents the sample matrix after dimensionality reduction and z′ denotes the low-dimensional design variable of the sample. The reconstruction threshold t was generally set to 95%. Enough eigenvalues were selected to make the cumulative explained variance ratio larger than t to determine the minimum spatial dimension n′. The original sample data was reconstructed from the dimensionally reduced new variable Z′ using the following formula:
P i ( u ) = P ¯ ( u ) + Q * z i
After dimensionality reduction, the design space was changed from n-dimensional to n′-dimensional. The new variable Z′ after dimension reduction was called PCA coefficient for the convenience of description.

5. Performance Analysis and Optimization of 3D Circular-to-Rectangular Transition Nozzle

5.1. Flow Field Characteristics and Performance Analysis of Initial Model

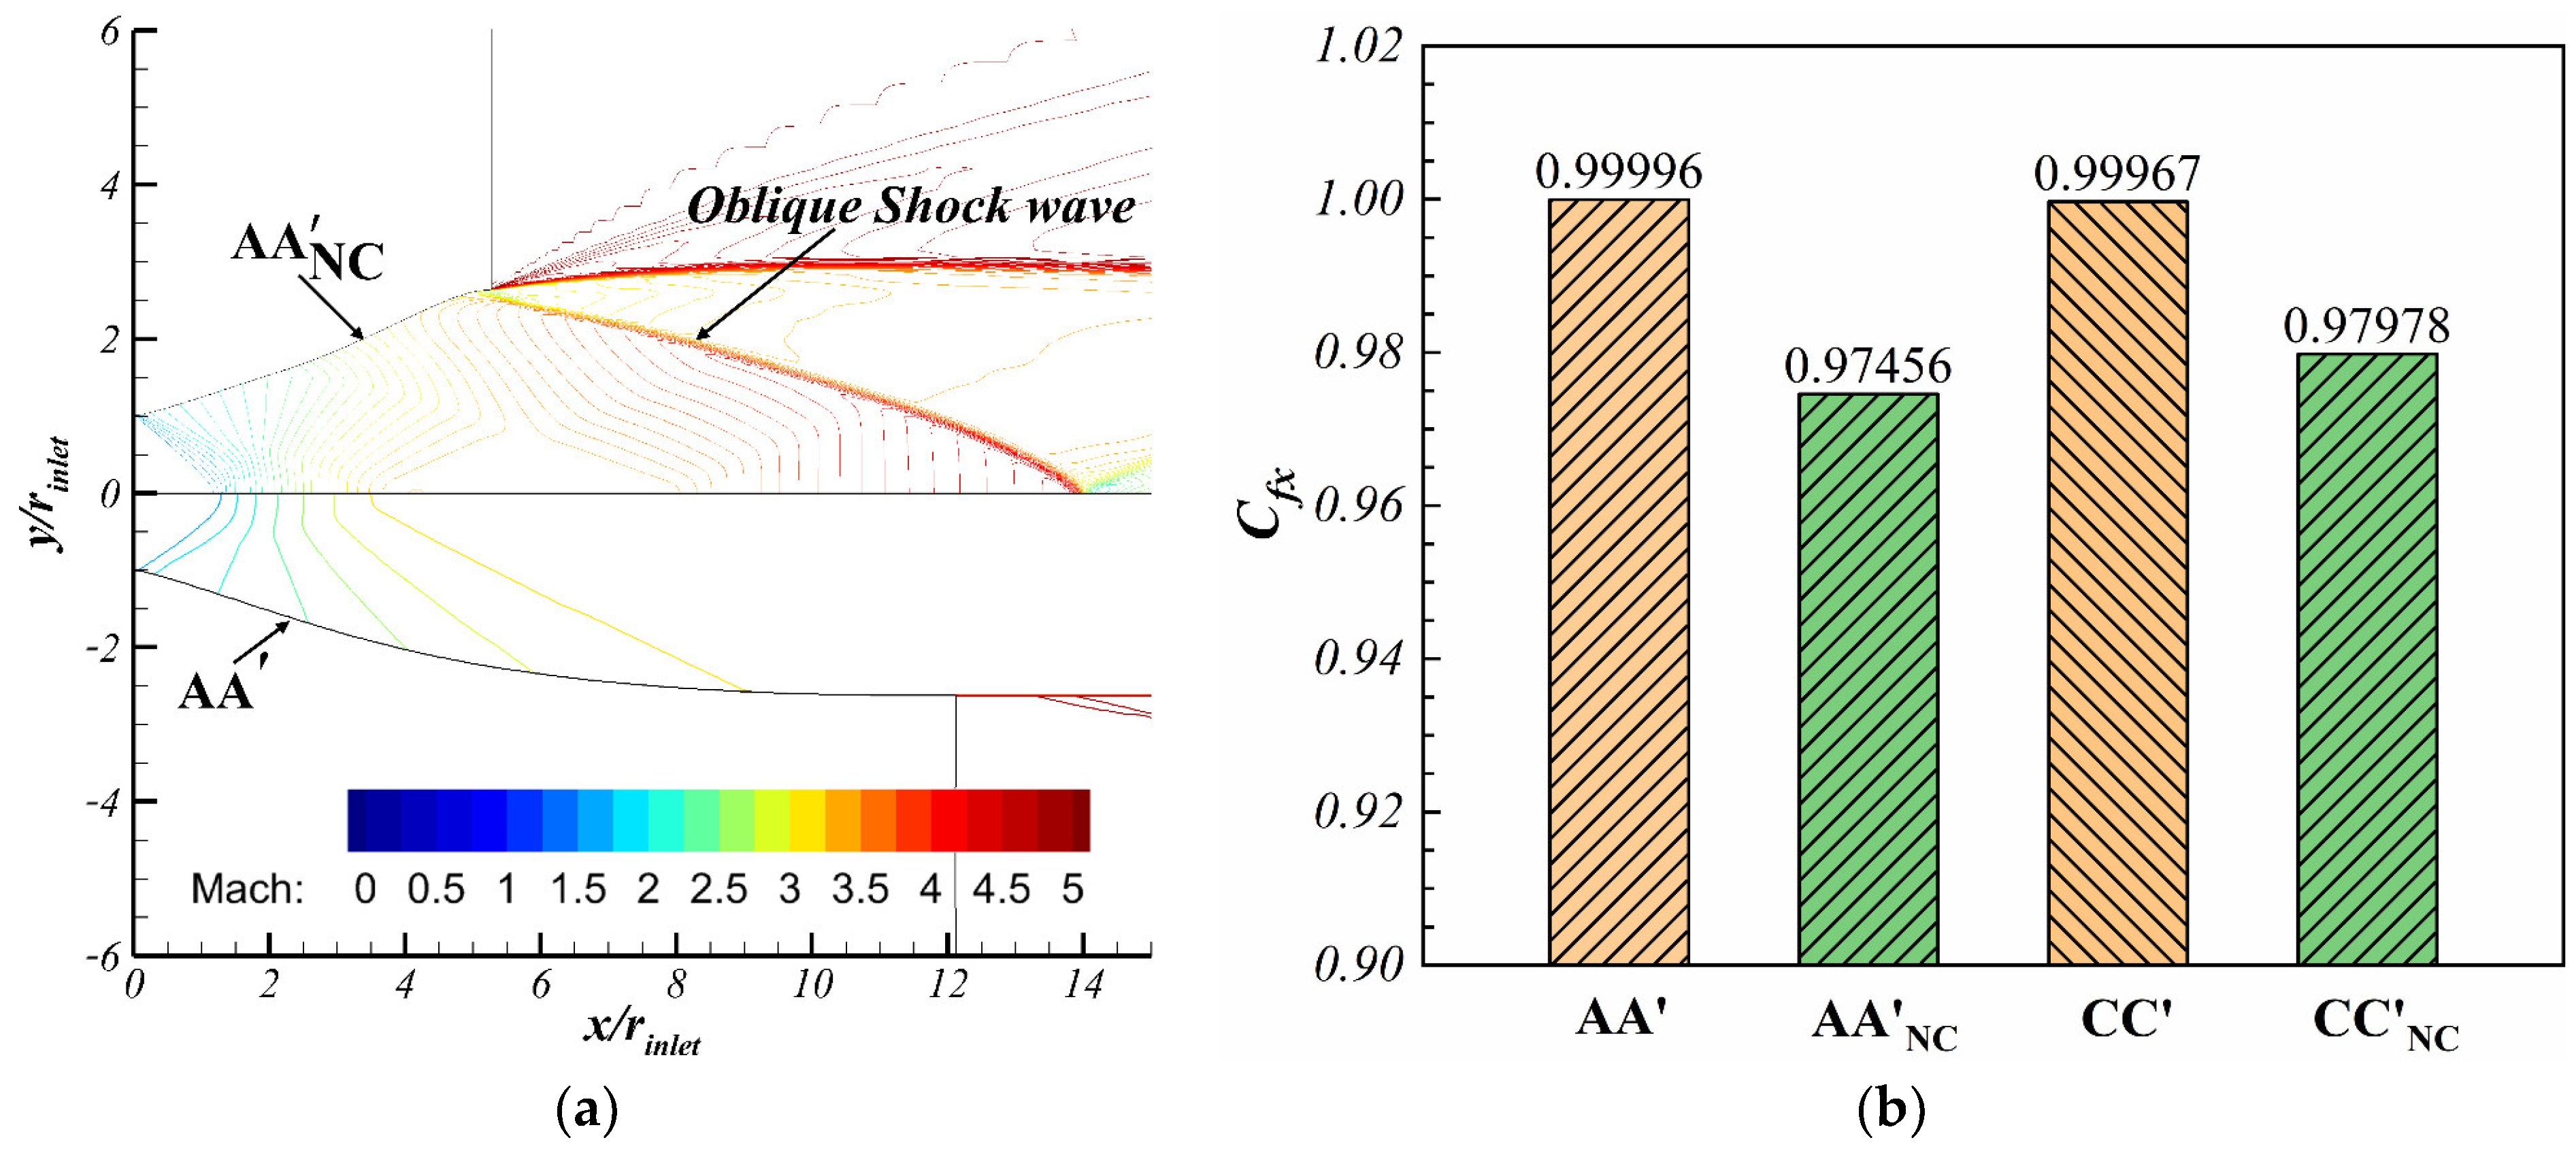
The effect of nonlinear shortening on the reference flow field was analyzed before performance analysis. The calculation parameters were set to Ma = 5, pamb = 2602.727 Pa, NPR = 77.995, where Ma denotes the Mach number of the freestream. Figure 7 shows the differences in flow field structure and performance before and after nonlinear shortening. The boundary layer correction was performed after the nonlinear shortening. Thus, only the inviscid flow field was compared and analyzed here. AA’ and CC’ were the control lines within the circumferential sections AA’ and CC’ in Figure 1a, respectively. AA’NC and CC’NC were the control lines after nonlinear shortening, respectively. The results showed that the nonlinear shortening caused a change of the reference flow field from a full expansion state to an over-expansion state. The axial thrust coefficients of the reference flow fields AA’ and CC’ were reduced by 2.54% and 1.99%, respectively. Therefore, the aerodynamic shape of the nozzle must be optimized to improve its aerodynamic performance after nonlinear shortening.
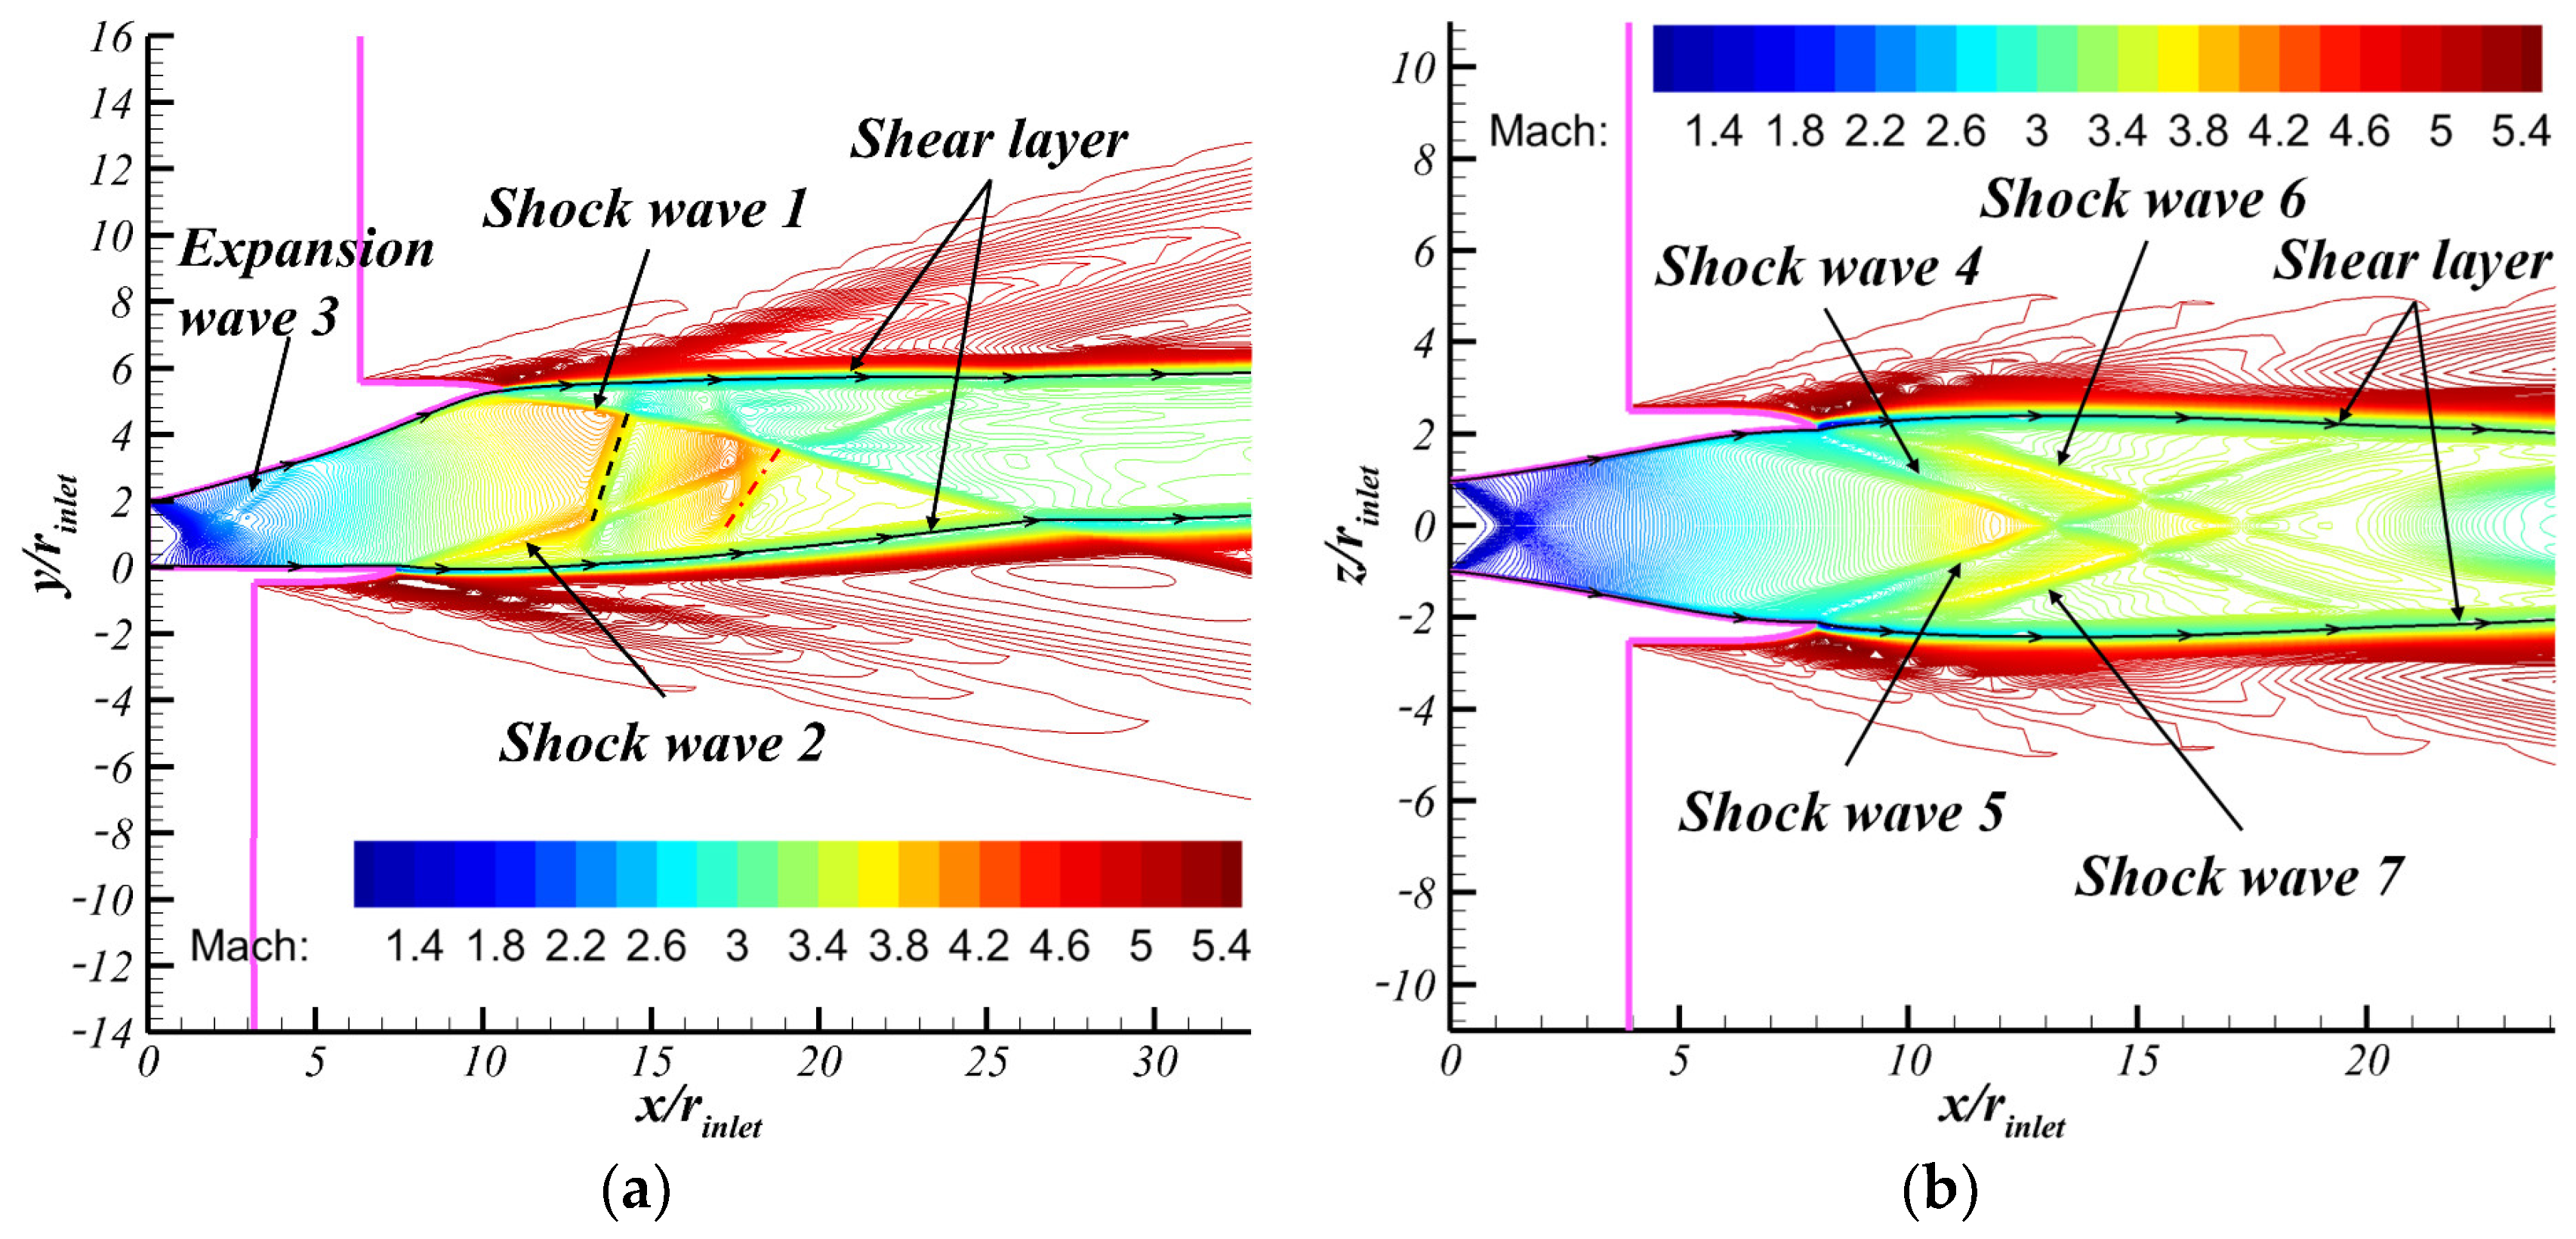
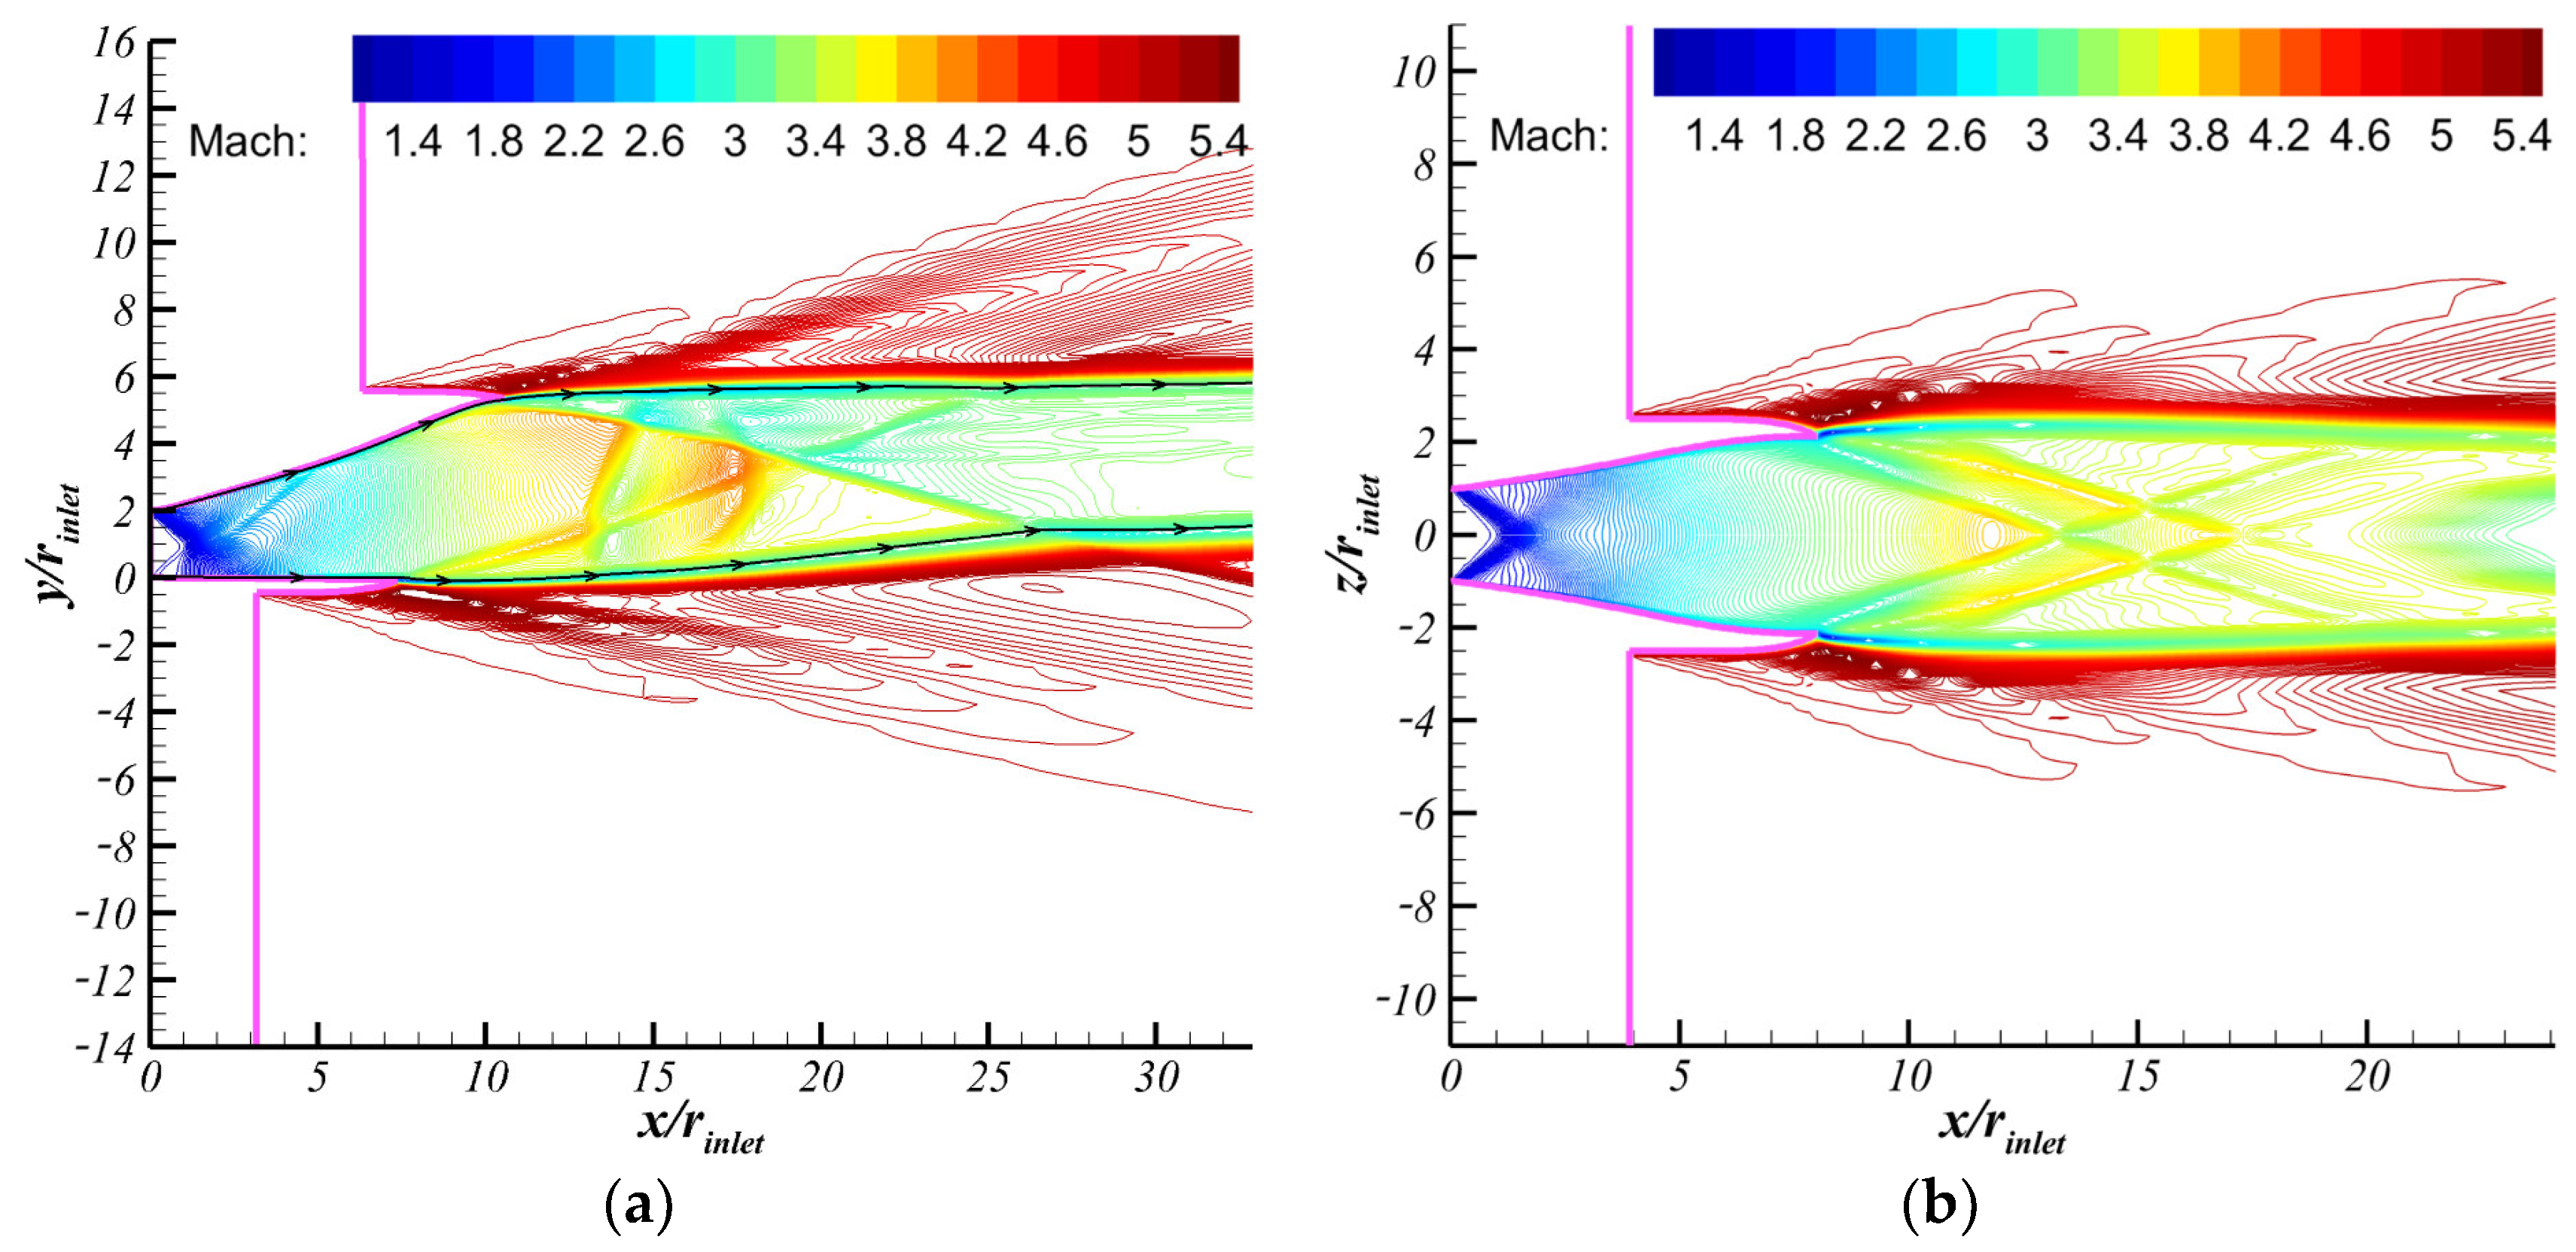
The flow field structure of the initial model in two sections within the x-y and x-z planes is shown in Figure 8. The findings showed that the flow field structure of the initial model was relatively complex. Shock waves were observed near the outlet of both the upper and lower walls of the nozzle in the symmetry plane. Shock wave 1 near the exit of the upper wall was caused by the rapid change of the wall shape, whereas the interaction of the plume with the external airflow generated another shock wave 2 near the exit of the lower wall. The wave systems indicated by the black dashed line and the red dash-dotted line in the figure are formed by the intersection of the shock waves from the side walls in the symmetry plane. Within the cross-section at y/rinlet = 1, the rapid change in wall curvature near the nozzle outlet generated shock waves 4 and 5. Shock waves 6 and 7 were generated by the interaction of the plume with the external airflow. In the symmetry plane, there was also an expansion wave from the lower wall at the front of the nozzle.
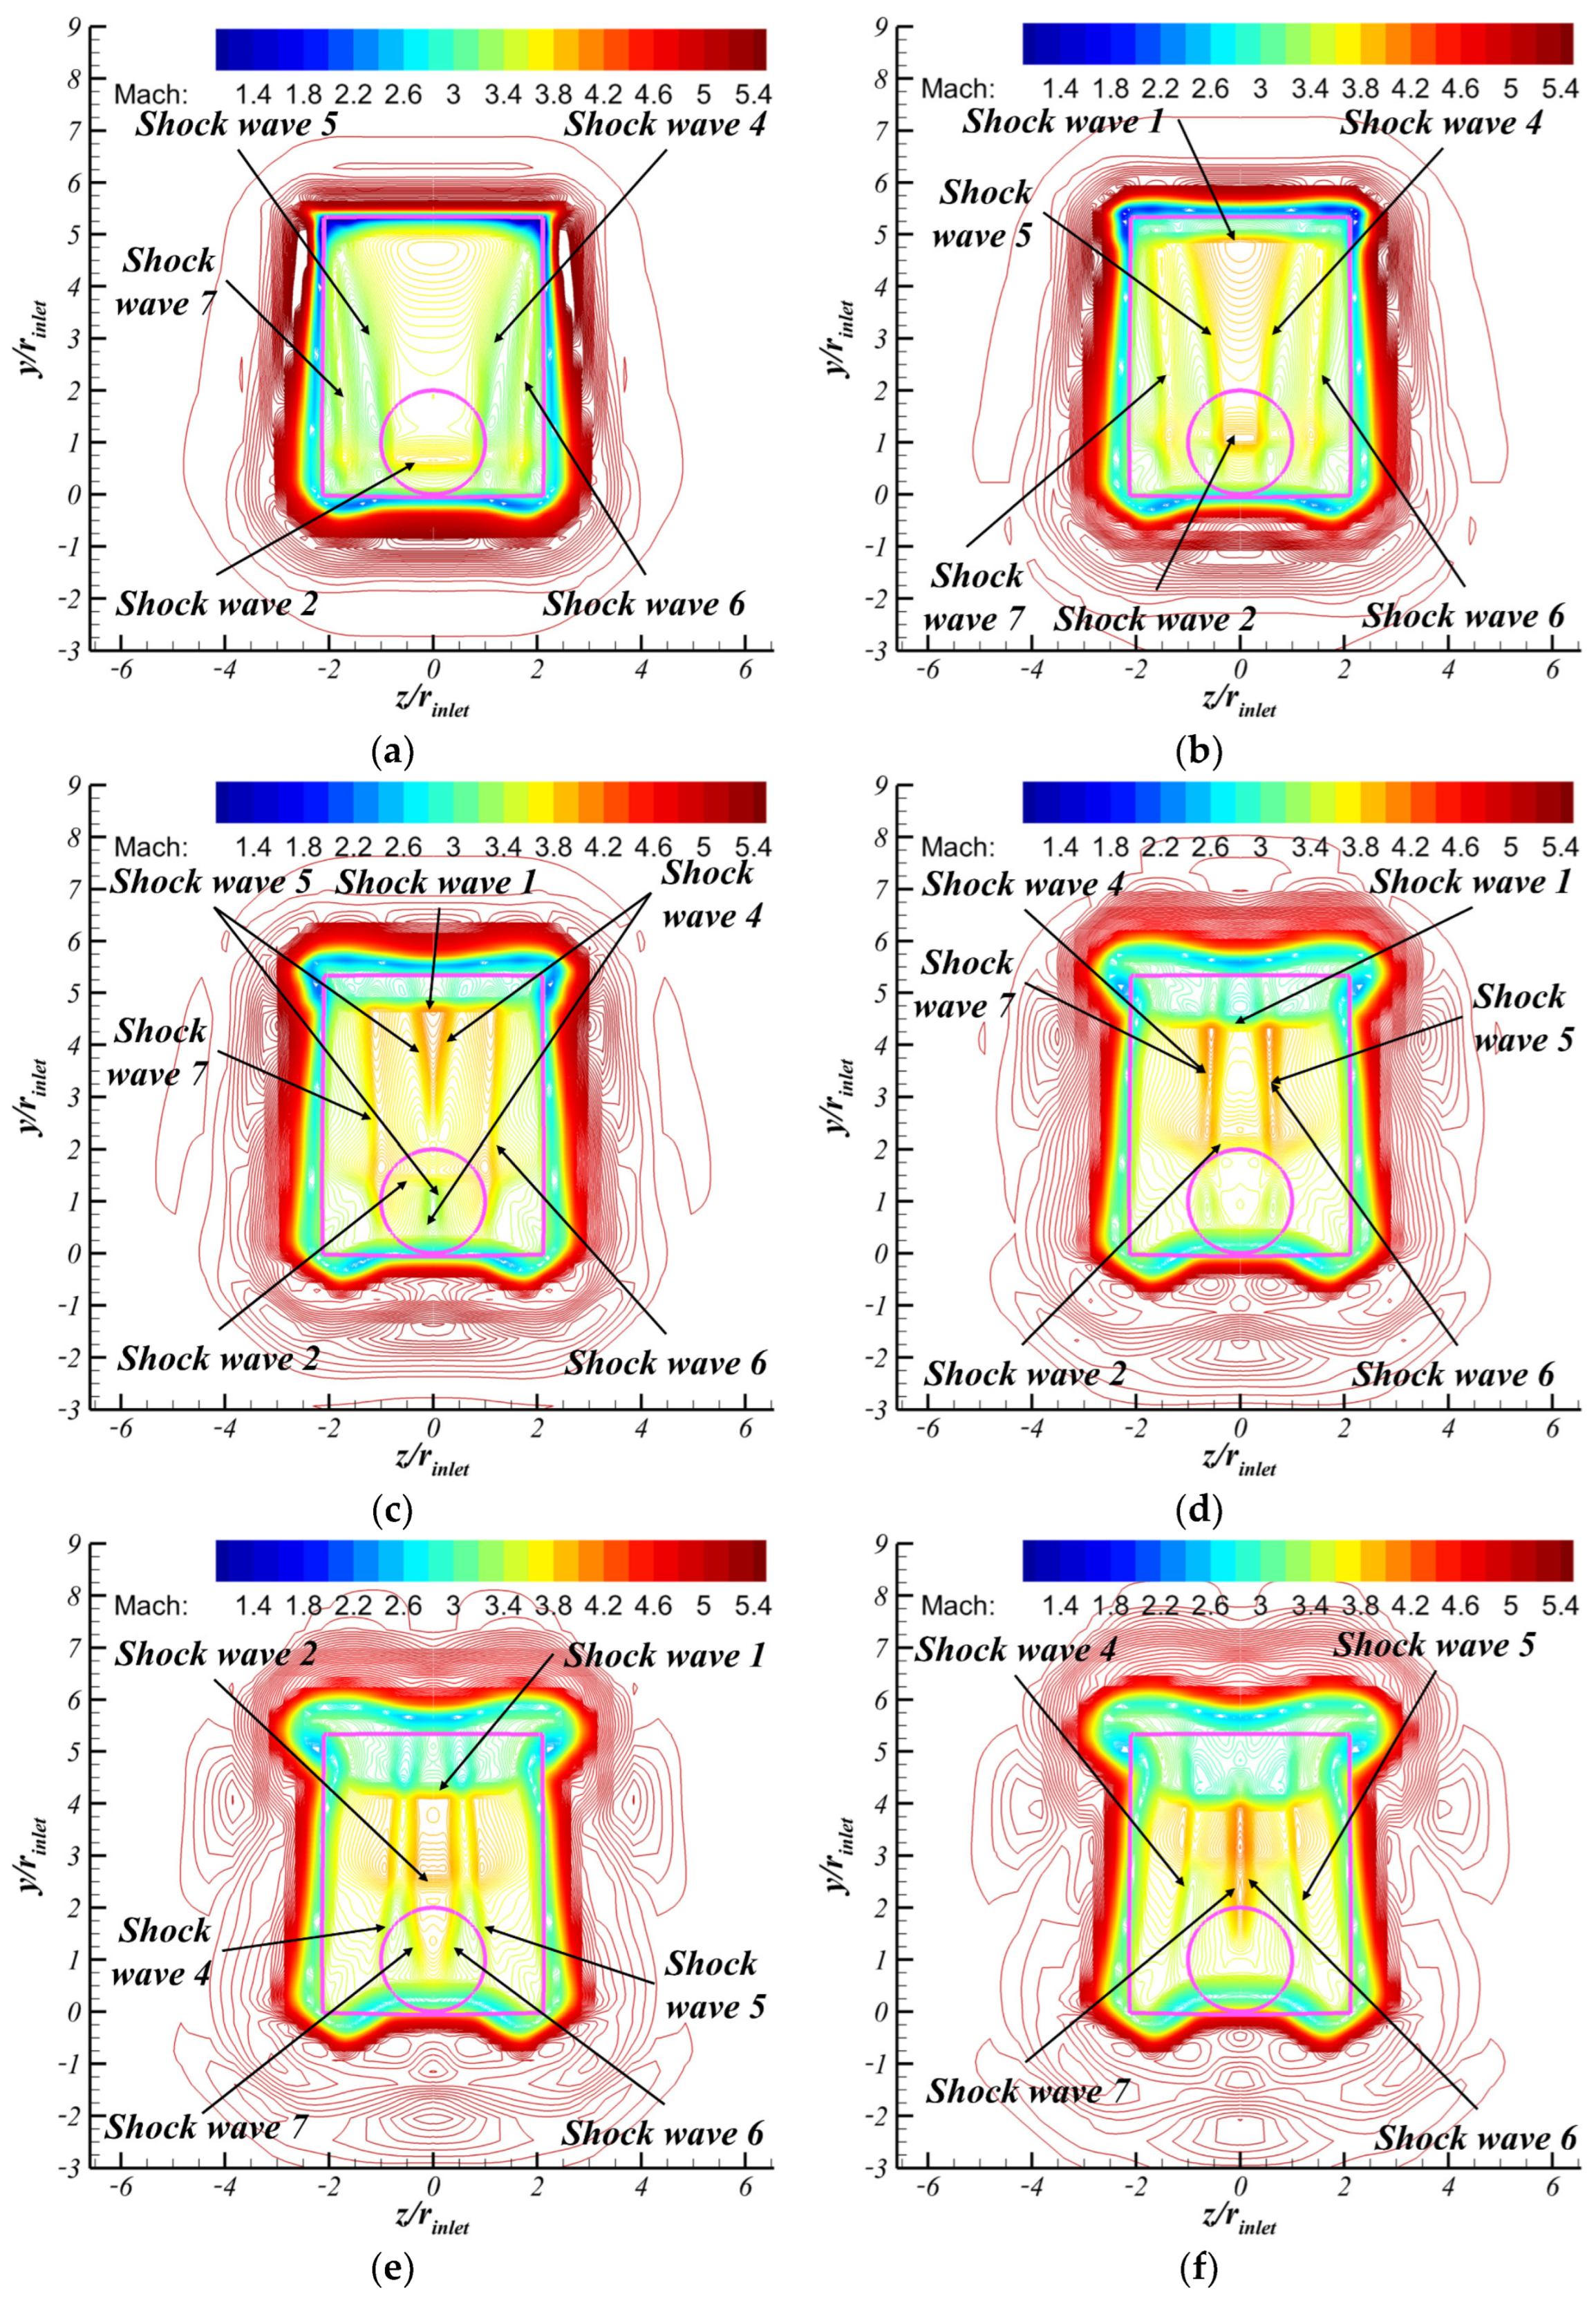
An illustration of the variation of the shock wave structures in the downstream flow field along the x-axis is presented in Figure 9. The section at x/rinlet = 10.557 shown in Figure 9a is located at the upper wall outlet of the nozzle. In this section, shock wave 1 in Figure 8a is not evident, but shock waves 2, 4, 5, 6 and 7 are clearly visible. The above six shock waves formed two quadrilateral closed structures in the section at x/rinlet = 11.996 with the development of the flow. The position of shock wave 2 was higher compared to the section at x/rinlet = 10.557, whereas shock waves 4, 5, 6 and 7 were closer to the symmetry plane.
When the plume flows to x/rinlet = 13.436, the movement of shock waves 4 and 5 transformed the smaller quadrilateral closed structure shown in Figure 8b into a triangular closed structure. The lower vertex of the structure is the intersection of shock waves 4 and 5, which is located on the shock wave shown by the black dashed line in Figure 8a. In the section located at x/rinlet = 15.355, only one quadrilateral closed structure surrounded by the shock waves persists in the flow field. Shock wave 4 extended from one side of the flow field (z/r > 0) to the other side (z/r < 0), and shock wave 5 was the opposite.
In the section at x/rinlet = 16.315, the parts of shock waves 4, 7 and shock waves 5, 6 below shock wave 2 moved away from each other. Shock waves 4 and 7 and shock waves 5 and 6 had not yet intersected at the position above shock wave 1. Shock waves 6 and 7 intersected at the bottom of the flow field, and the intersection point was located on the shock wave shown by the blue dotted line in Figure 8a. A quadrilateral closed structure was enclosed by shock waves 1, 2, 4, 5, 6 and 7 in the flow field. Shock waves 6 and 7 were very close to the symmetry plane when the plume flowed up to x/rinlet = 17.274, whereas shock waves 4 and 5 faced away from the symmetry plane.

5.2. Selection of Fitting Order of CST Method and Fitting Results

In this study, the initial model was fitted using the cylindrical coordinate system form of the CST equation to obtain the CST parameters as design variables. The orders of Bernstein polynomials controlling the axial and circumferential variation of the nozzle shape were denoted as BX and BR, respectively. The effect of different combinations of BX and BR on the fitting accuracy was first investigated. Table 4 and Table 5 show the geometric and performance fitting errors for different combinations of BX and BR. The Bernstein polynomial order should not be too high [31], thus the variation of BX and BR in this study was limited to between 4 and 8. The total number of CST parameters was (BX + 1) × (BR + 1).
The results in Table 4 indicate that the total L2 norm error was more sensitive to changes in BR. An increase in BR significantly reduced the geometric error even when BX assumed a small value. This implies that a higher order of BR should be used for the fitting of the initial model. Table 5 illustrates that the effects of both BX and BR on Cfx and L were nonlinear. The findings showed that the performance fitting errors were small for all combinations of BX and BR. Few fitting parameters should be used while ensuring optimal fitting accuracy and flexibility of geometric deformation. Therefore, the approximation model in this study was constructed using a combination of BX = 4 and BR = 6. The initial design variables were then expressed as ( 4 + 1 )   ×   ( 6 + 1 ) = 35  Bi,j.
The model built using the combination of BX = 4 and BR = 6 in this study was referred as the BX4-BR6 approximation model. Figure 10 shows the flow field at the design condition for the BX4-BR6 approximation model. A comparison with the findings in Figure 8 showed that the BX4-BR6 approximation model effectively restored the wave system present in the initial model flow field. Therefore, it is reasonable and accurate to use the CST parameters used for the BX4-BR6 approximation model as the design parameters of the initial model.

5.3. Optimal Design Based on Data Dimensionality Reduction

5.3.1. Optimization Task Description

The purpose of this study to optimize the nozzle aerodynamic shape was improve the axial thrust coefficient and lift of the nozzle at the design operating condition. The mathematical description of the optimization problem can be expressed as follows:
Max     C fx , L S . t . u i , LB u i u i , UB , i = 1 , 2 , 3 , , n
where u i , UB and u i , LB denote the upper and lower limits of the values of the original design variables, respectively.
In this study, n was equal to 35. The solver, turbulence model, grid size and boundary conditions used for CFD calculations of the sample model during optimization were the same as those used for configuration of the initial model.

5.3.2. Design Space Dimension Reduction

The boundaries of the original design space were limited to move 50% from the value of Bi,j negatively and positively to ensure significant flexibility. Sampling three times in the original design space using the Latin hypercube sampling method with multidimensional uniformity (LHSMDU) [32,33] resulted in sample sets consisting of 150, 300, and 450 sets of CST parameters: sample set 150 (SS150), sample set 300 (SS300), and sample set 450 (SS450), respectively. The corresponding principal components and PCA coefficients were obtained by implementing the PCA method on each of these sample sets. Figure 11a,b show the cumulative contribution rate of principal components and PCA coefficient bounds for different sample sets affected by the change in the number of principal components (PCN). The cumulative contribution of principal components increased slightly faster when the sample size was smaller. The cumulative contribution of the first 18 principal components for SS150 was 99.04%. SS300 and SS450 required the first 19 principal components to achieve more than 99% cumulative contribution. The bounds of PCA coefficients can be gradually expanded with an increase in sample number, especially the lower bounds of the first few principal components. The larger design space of SS300 and SS450 provided more options for optimization, although the implementation of PCA on SS150 reduced the number of principal components to 18. Notably, the sample set suitable for implementing PCA could not yet be selected based on the above analysis. Figure 11c shows the contribution of each principal component using SS300 as an example.
In this study, 10 sets of CST parameters were sampled from the original design space using the LHSMDU method, and validation models independent of the above three sample sets were established to further determine the sample sets for implementing PCA. Figure 12a shows a comparison of the mean values of the geometric fitting errors when reconstructing the validation models using the principal components of different sample sets. The findings indicated that the use of high number of principal components to reconstruct the model results in a smaller mean value of the fitting error. The geometric fitting error of SS300 decreased relatively smoothly with increase in number of principal components. The mean value significantly decreased when the model was reconstructed using 19 principal components, after which the error variation exhibited a plateau. The geometric fitting error of SS150 also rapidly decreased, but the error still fluctuated significantly after using more than 19 principal components. This finding indicated that the lower-ranked principal components can still have a significant effect on the fitting. The fitting error of SS450 exhibited a plateau when the model was reconstructed using the first 19 principal components, but its error values were larger than the other sets. The above analysis shows that (1) the principal components and PCA coefficients obtained by implementing PCA on SS300 can be used to reconstruct a highly accurate geometric model; and (2) the PCA coefficients of SS300 can provide more space for exploration in subsequent optimization studies. Therefore, 300 samples were used to perform PCA in this study.
Then, the dimensionality of the design space after dimensionality reduction should be determined. Figure 12b,c show the geometric and performance parameter fitting errors of the validation models reconstructed using the principal components of SS300. The results showed that the fluctuations of geometric errors can only be eliminated by reconstructing the nozzle model using 19 or more principal components. The maximum error of L when reconstructing the model using the first 19 principal components was less than 2%, and that of Cfx was less than 0.1%. Performance fitting errors for models reconstructed using less than 19 principal components are unacceptable. Therefore, the first 19 principal components can be considered to have the same ability to describe the potential nozzle geometry and performance as the 35 CST parameters. The PCA coefficients corresponding to the first 19 principal components were used as the new design variables of the nozzle model.
The control patterns of different principal components on nozzle geometry were evaluated in this study. The first four principal components were used to reconstruct the nozzle models separately. Figure 13 shows the deformation patterns represented by each principal component. The red part indicates that the radial dimension of the reconstructed model was larger than that of the BX4-BR6 approximate model, and the blue part indicates that it was smaller. The findings showed that the first principal component dominates the axial extrusion pattern of the nozzle sidewall. The second and third principal components dominate the scaling pattern of the nozzle sidewall in the radial direction. The fourth principal component dominates the extrusion pattern of the upper and side walls of the nozzle in the circumferential direction.

5.3.3. Optimization Based on the Surrogate Model

After dimensionality reduction, the optimal design parameters were evaluated in a new design space composed of PCA coefficients. With the reduction of the design parameters to 19, the optimization problem described by Equation (22) can be transformed into the following:
  Max C fx , L S . t . z j , LB z j z j , UB , j = 1 ,   2 ,   3 ,   L ,   19 r T ( ϑ ) = r T , initial ( ϑ ) r N ( ϑ ) = r N , initial ( ϑ )
where z j , UB and z j , LB denote the upper and lower bounds of the values of the design variables after dimensionality reduction, respectively. r T , initial and r N , initial denote the tail height and radial offset of the control line of the initial model, respectively.
A study by Cinquegrana and Iuliano [34] reported that the number of samples required to perform CFD evaluation should be 10 n . Therefore, the LHSMDU method was used in the present study to establish the training and test sets for training RBFNN using 190- and 50-times uniform sampling in the new design space. The geometric model of the samples was reconstructed automatically using Python scripts. The performance parameters of all samples were obtained after meshing and CFD evaluation. The constructed RBFNN model had 19 nodes representing design variables in the input layer, two nodes representing performance parameters in the output layer, and 40 nodes in the hidden layer.
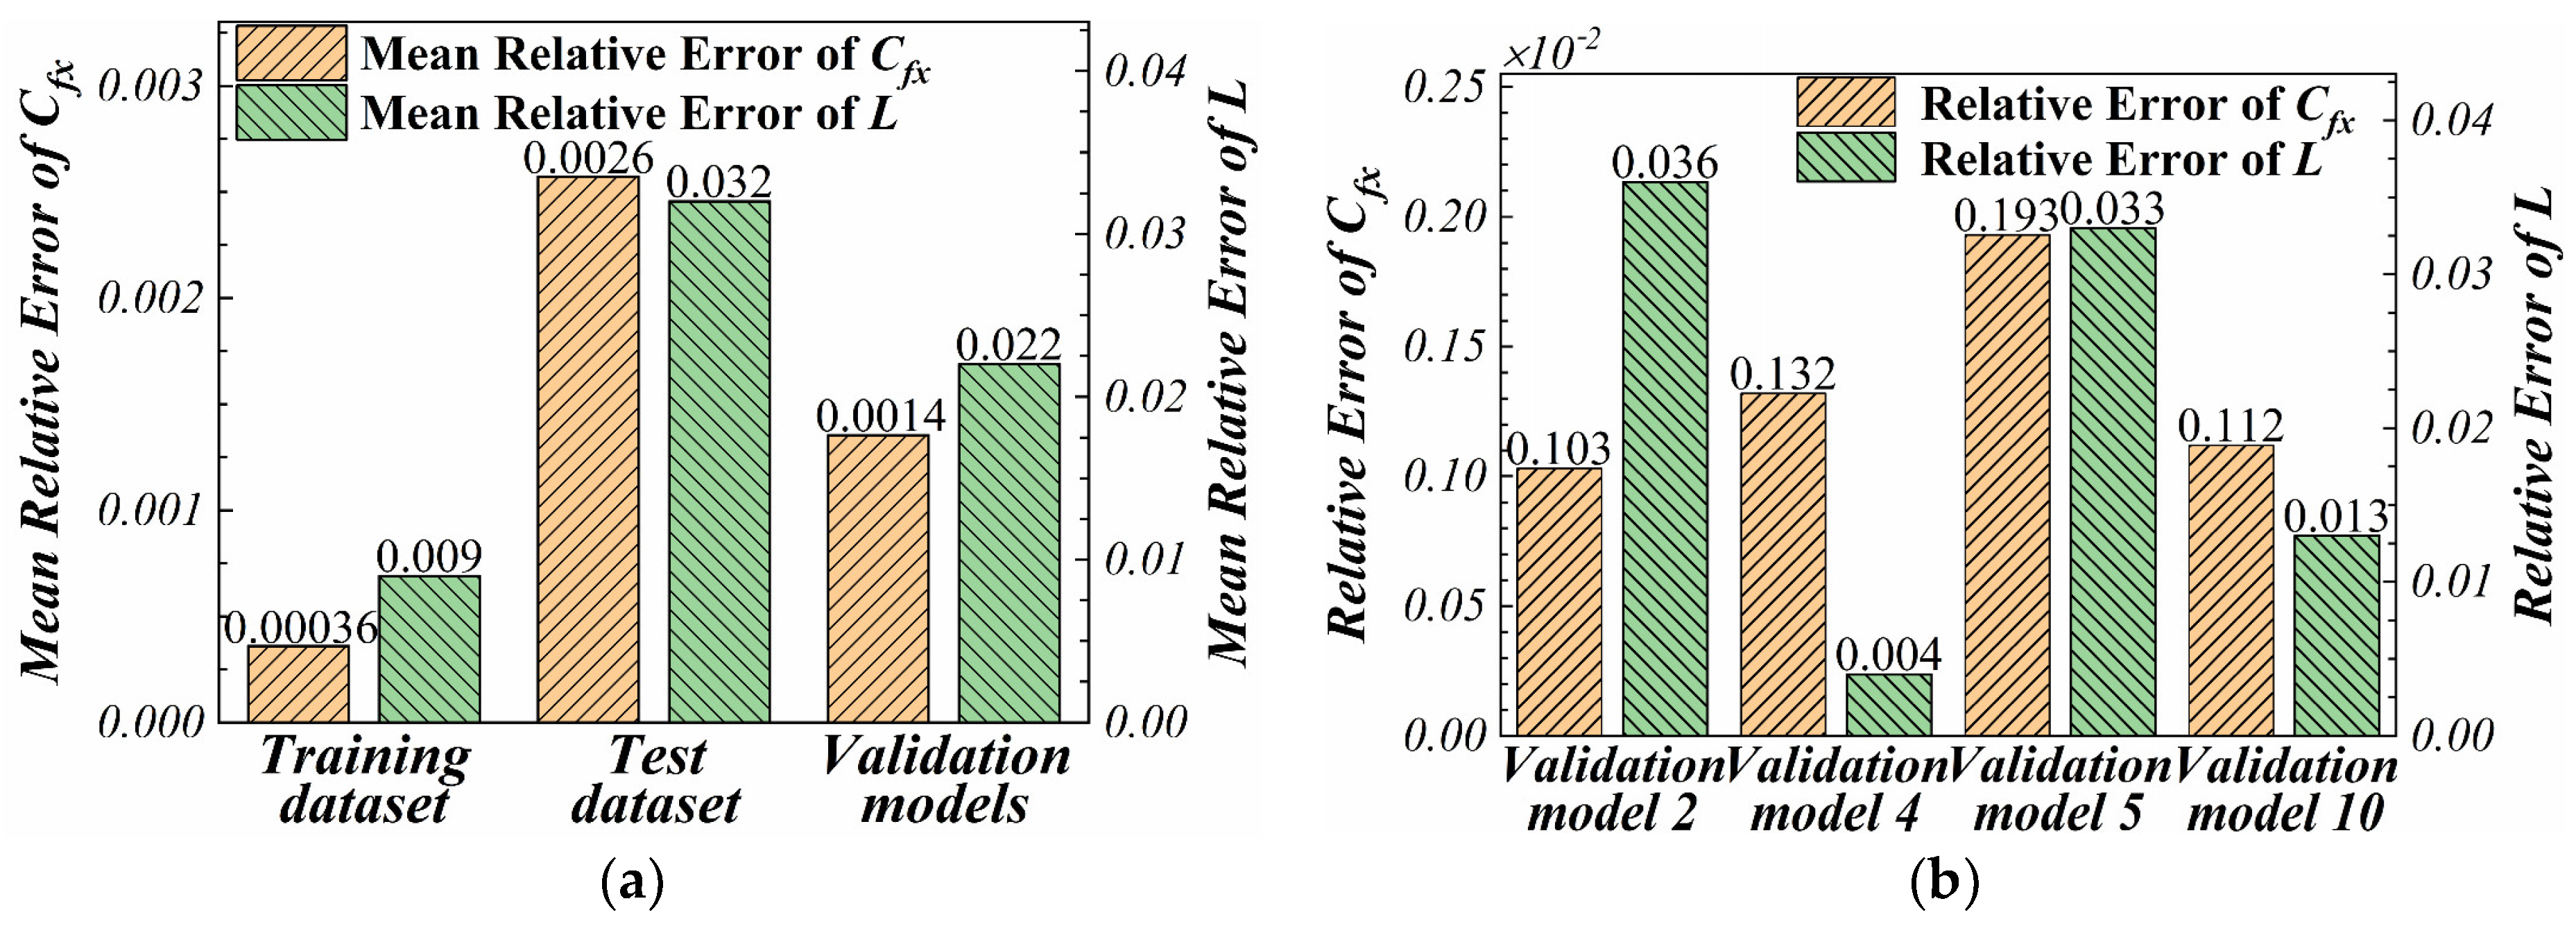
The predictive ability of RBFNN was verified using test set models and four validation models. As shown in Figure 14, the prediction error of the trained RBFNN was less than 0.257% for Cfx and 3.647% for L for both the test set models and the validation models. This indicates that the trained RBFNN had high prediction accuracy and great generalization ability, which can provide reliable prediction results for subsequent optimization work.
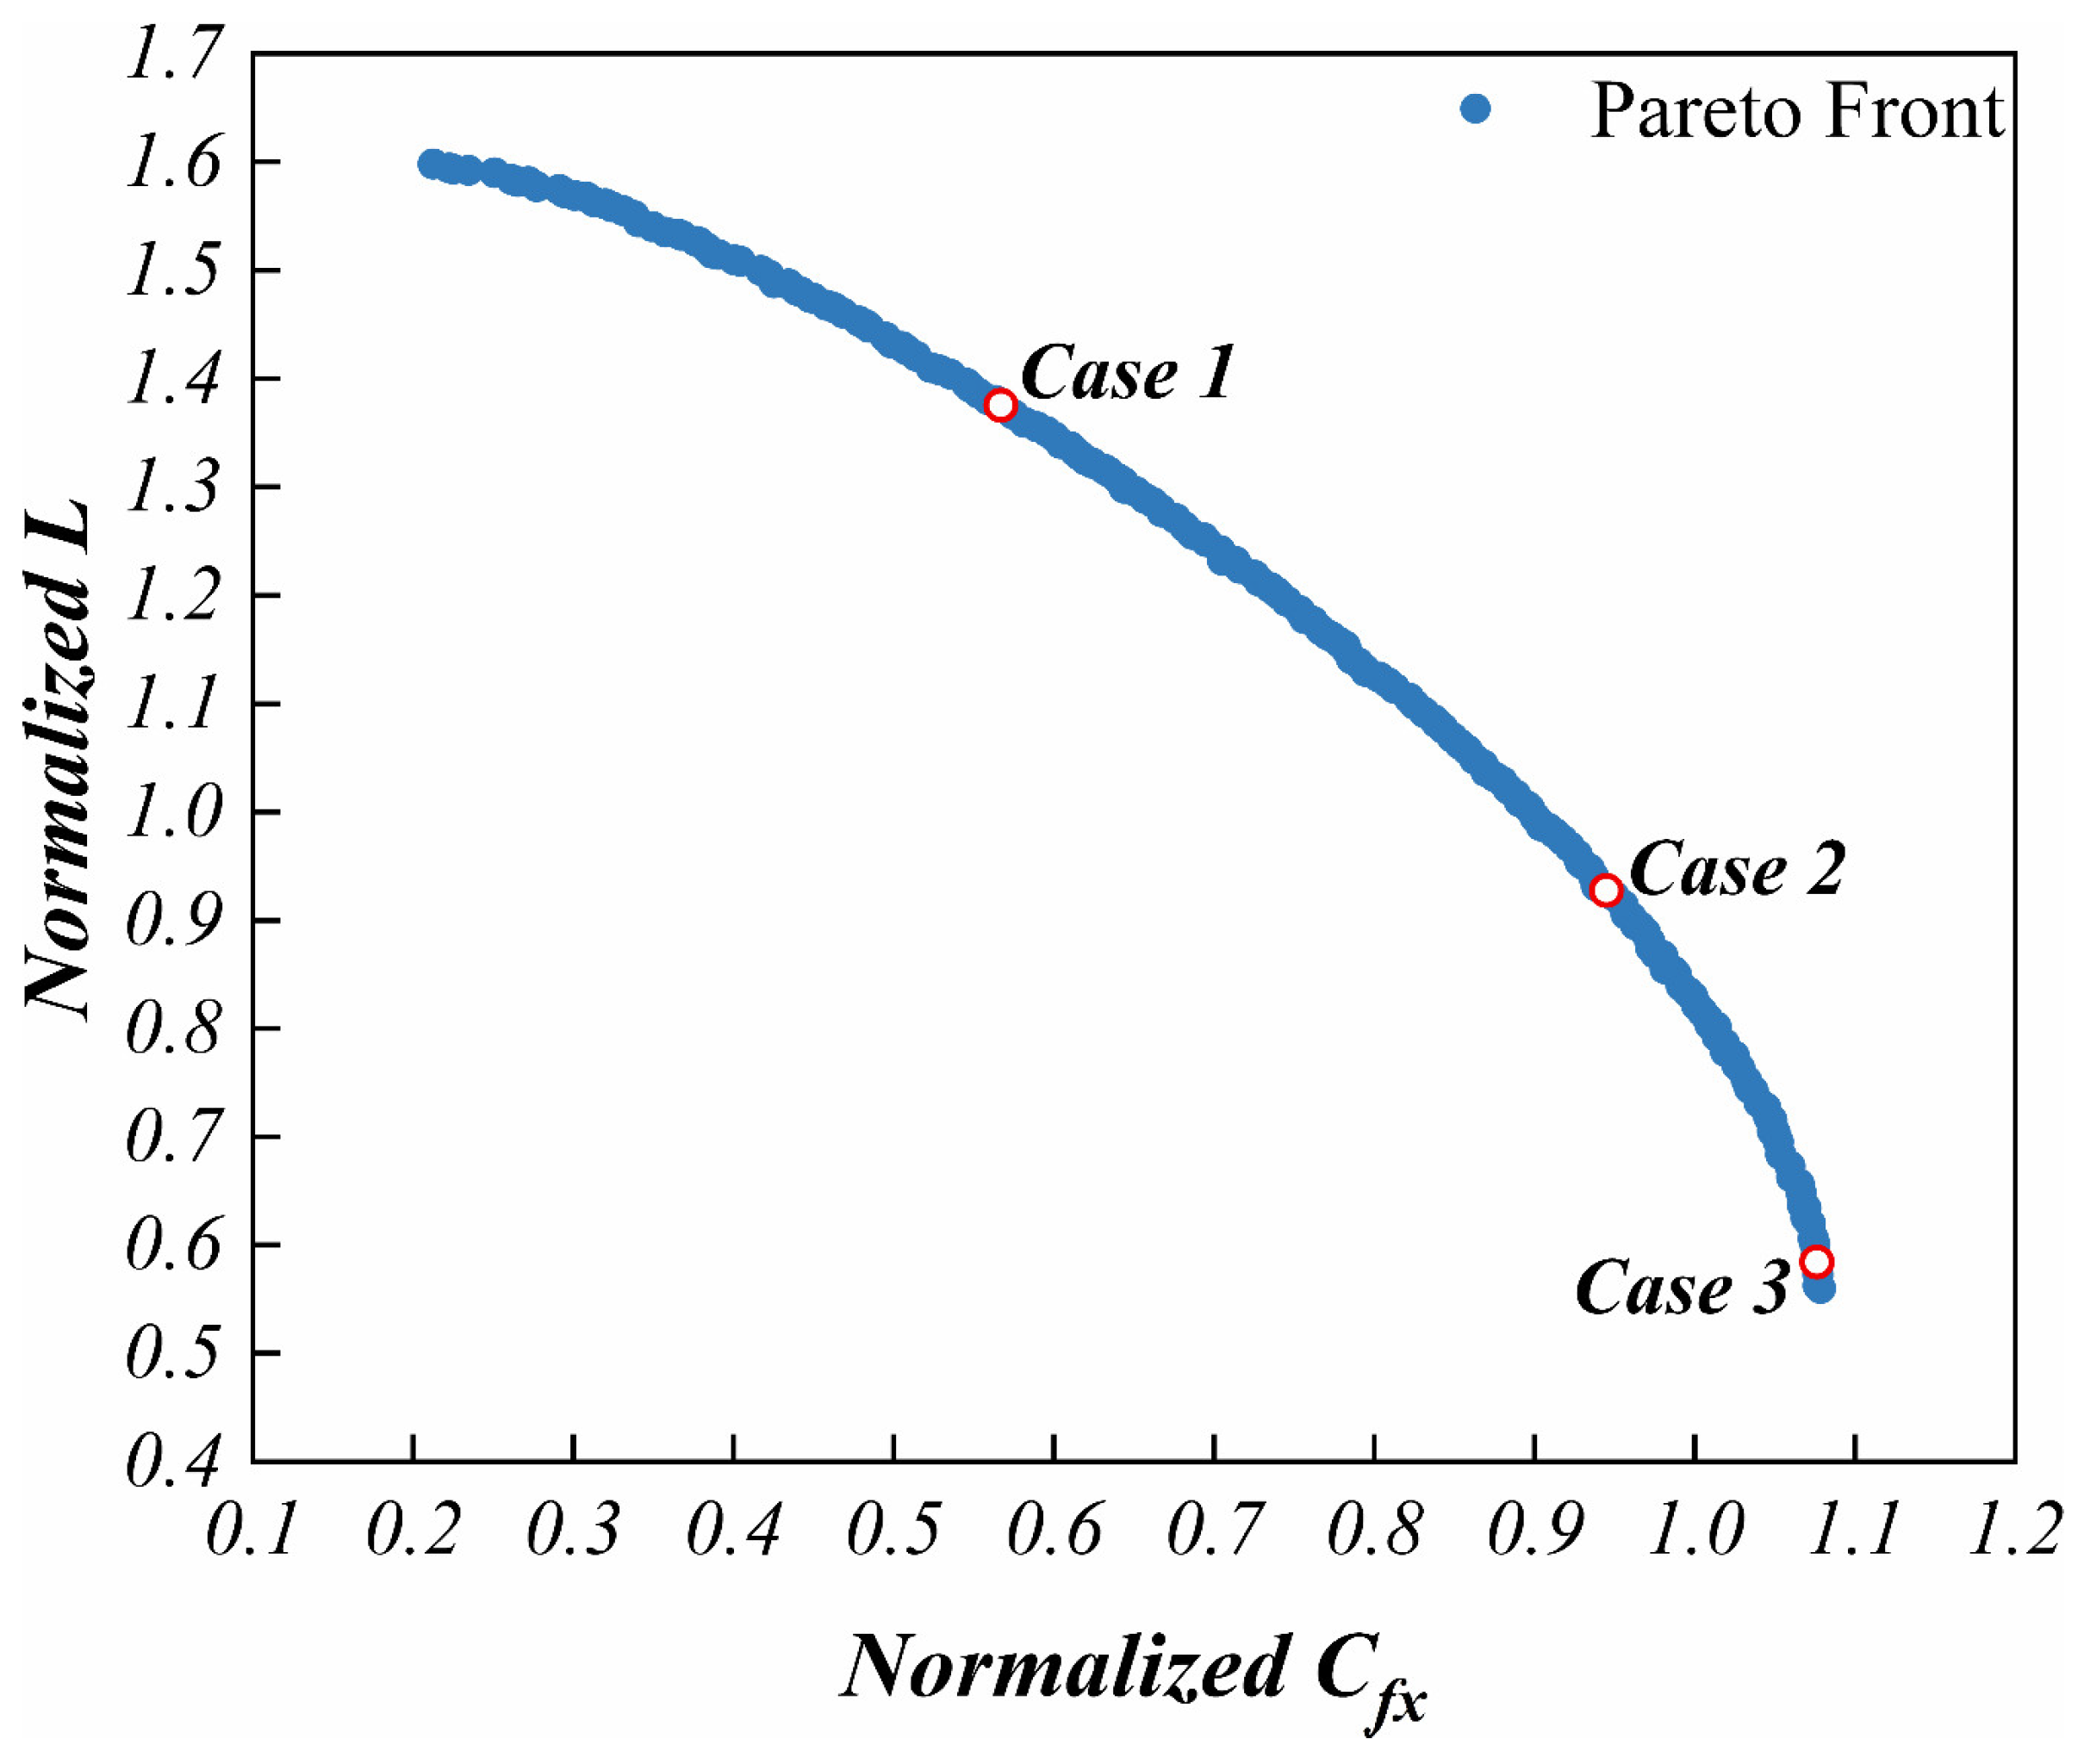
Subsequently, the trained CST-PCA-RBFNN-based surrogate model was embedded into the NSGA-II framework to maximize the Cfx and L of the nozzle. Multi-objective optimization was performed with a population size of 200 and an evolutionary generation of 1500. The Pareto front obtained after optimization is shown in Figure 15. Three cases on the Pareto front were selected to further investigate the aerodynamic performance of different non-dominated solutions. These cases are referred to as Case 1, Case 2 and Case 3 for the convenience of description.
Figure 16 shows the geometric shapes of the three cases and the initial model. The findings showed that the upper walls of Case 1, Case 2 and Case 3 had depressions that were not present in the initial models. A gradual decrease in the depression of the upper wall was observed from Case 1 to Case 3. The two control lines, Ca and Cb, were chosen to facilitate the description of the change in nozzle shape. The Cb of all three cases shows a pattern of expansion, contraction, and re-expansion, but the Cb of Case 3 had insignificant contraction at the middle section. The expansion pattern of the sidewall of Case 3 was more reasonable and the overall expansion was greater than that of the initial model. The slope of each control line near the nozzle outlet for the three case models was significantly different from the initial model.
The comparison of the different model performance parameters is presented in Table 6. Case 3 showed an increase in Cfx and L of 0.742% and 15.707%, respectively, compared with the initial model. The increase in L for Case 2 was 38.706%, but the Cfx improvement was only 0.241%. The increase in L for Case 1 was 74.963%, whereas its Cfx decreased by 1.258%. The shape of the nozzle should be as close as possible to Case 3 to obtain a satisfactory improvement in Cfx and L.
The flow fields of the three cases were analyzed in detail to investigate the mechanisms underlying the differences in the performance of the different models. The flow fields in the symmetry plane of different cases are shown in Figure 17a,c,e. The results showed that the flow field structure after the outlet of Case 1, Case 2 and Case 3 nozzles was simpler than the initial model. The depression of the upper wall results in a weak shock wave instead of an expansion wave in the front section of these three nozzles. The reflection of shock wave 1 on the upper wall produced shock wave 2. Shock wave 3 occurred before the reflection point of shock wave 1 due to the more pronounced depression of the upper wall in Case 1 and Case 2. Shock wave 3 basically disappeared in Case 3. The reflection point of shock wave 1 was the closest to the nozzle inlet in Case 1, whereas the reflection point of shock wave 1 was closest to the nozzle outlet in Case 3. The reflection of shock wave 1 did not cause boundary layer separation, but only increased the boundary layer thickness and wall pressure. This implies that the different locations of the local high-pressure area distribution may have caused the differences in performance of these three case models.
The flow fields within the section located at y/rinlet = 1 in different cases are shown in Figure 17b,d,f. The flow field structure of Case 1 was comparable to the initial model. However, the distance between the two shock waves was smaller because the expansion of the sidewall occurred closer to the outlet. The expansion of the sidewalls of Case 2 and Case 3 was more uniform, and only the shock waves generated by the interaction with the external airflow were present in the flow field. The different expansion patterns of the sidewalls may have also caused differences in the performance of these three Pareto front sample models.
Figure 18 shows the contours of the wall pressure distribution for the initial model and the three case models. The wall pressure of the initial model exhibited a uniform decrease along the axial direction, but the profile of the contours does not perfectly match the geometric shape. The wall pressure in the front section of Case 1 was high and there was a local high-pressure zone caused by the shock wave in the upper wall. Moreover, it had a significantly slower wall expansion in the front and middle sections than the other three models, which caused the wall pressure to act mainly in the normal direction. As a result, the L of Case 1 significantly increased, whereas Cfx decreased. Reduction of the wall depression on Case 2 reduced the magnitude of the local pressure increase. This change promoted the wall pressure to act more in the axial direction. In addition, the area of the region where Case 2 was equal to the pressure at the wall of Case 1 was significantly larger. These geometrical features made the Cfx of Case 2 slightly higher than that of the initial model, and a significant increase in L was observed.
The expansion of the middle section of the upper wall of Case 3 was close to that of the rear section, and the mainstream expanded more slowly in the middle and rear sections of the nozzle. This feature caused the wall pressure in the middle and rear sections to decrease more slowly. The wall pressure near the outlet was significantly higher than in the other two cases. The range of the region with higher pressure was significantly larger compared to the initial model. Therefore, the Cfx increase in Case 3 was more than that in Case 2. Although the increase in L was not as high as Case 2, it was still significant compared with the initial model.
This analysis shows that a slower expansion in the upper and side walls of the nozzle markedly increased the area of the higher-pressure region, resulting in a significant increase in Cfx and L. The change in the shape of the lower wall did not significantly affect the nozzle performance parameters, but it improved the wall pressure distribution. Notably, the reflected shock wave in the flow field of Case 3 was not eliminated. This can be attributed to the low contribution of the principal component controlling the upper wall deformation near the symmetry plane resulting in a weak geometric control of this part. Nevertheless, the CST-PCA-RBFNN-based surrogate model markedly controlled the geometry of the 3D circular-to-rectangular transition nozzle. The nozzle’s aerodynamic performance can also be effectively improved using the NSGA-II algorithm.

6. Conclusions

A method based on CST-PCA-RBFNN surrogate model that enables nozzle shape parametric representation and performance prediction is proposed in this study. The surrogate model was combined with NSGA-II to improve the aerodynamic performance of the 3D circular-to-rectangular transition nozzle. Validation results of the parameterization accuracy of the CST method, the accuracy of the reconstructed model geometry and performance fitting, and the accuracy of the RBFNN performance parameter prediction indicate the accuracy and reliability of the method in achieving nozzle geometry parameterization representation and performance prediction. The method can also be used for 3D asymmetric expansion nozzles with different inlet and outlet shapes designed based on the streamline tracing technique or osculating method. The findings of this study can be summarized as follows:
(1)
The validation of the CST-PCA-RBFNN-based surrogate model showed that it is feasible to parametrically represent the shape of a 3D circular-to-rectangular transition nozzle with circumferential control lines using the CST method with cylindrical coordinate form. The shape and aerodynamic performance of the approximate model can be comparable to the original model even if the fitting order of the CST method is low;
(2)
PCA is an effective and robust method for reducing data dimensions. The number of design variables was successfully reduced from 35 to 19 using PCA technique without affecting the prediction accuracy of RBFNN;
(3)
Analysis of three cases on the Pareto front showed that the shape of the control line of the upper wall near the symmetry plane of the nozzle used in this study was crucial for the elimination of the reflected shock wave. The upper and side walls of the nozzle with fast expansion in the forepart and slow expansion in the afterpart can improve both Cfx and L;
(4)
Although the CST-PCA-RBFNN-based surrogate model proposed in this paper has limited control over the local surface deformation of the upper wall of the nozzle, it can significantly improve the Cfx and L of the nozzle, while satisfying the geometric constraints.

Author Contributions

Conceptualization, H.Y., Q.Y. and Z.M.; data curation, H.Y.; formal analysis, H.Y.; funding acquisition, Z.M.; investigation, H.Y.; methodology, H.Y.; software, H.Y. and X.D.; validation, X.D.; visualization, L.C.; writing—original draft, H.Y. and L.C.; writing—review and editing, H.Y. All authors have read and agreed to the published version of the manuscript.

Funding

This work was supported by the Science and Technology on Scramjet Laboratory (Grant No. STSMY-KFKT-2020002).

Data Availability Statement

Not applicable.

Conflicts of Interest

The authors declare no conflict of interest.

References

  1. Bulman, M.; Siebenhaar, A. The Rebirth of Round Hypersonic Propulsion. In Proceedings of the 42nd AIAA/ASME/SAE/ASEE Joint Propulsion Conference & Exhibit, Sacramento, CA, USA, 9–12 July 2006. [Google Scholar]
  2. Walker, S.; Rodgers, F.; Paull, A.; Van Wie, D. HyCAUSE Flight Test Program. In Proceedings of the 15th AIAA International Space Planes and Hypersonic Systems and Technologies Conference, Dayton, OH, USA, 28 April–1 May 2008. [Google Scholar]
  3. Bulman, M.; Siebenhaar, A. Combined Cycle Propulsion: Aerojet Innovations for Practical Hypersonic Vehicles. In Proceedings of the 17th AIAA International Space Planes and Hypersonic Systems and Technologies Conference, San Francisco, CA, USA, 11–14 April 2011. [Google Scholar]
  4. Ridgway, A.; Sam, A.A.; Pesyridis, A. Modelling a Hypersonic Single Expansion Ramp Nozzle of a Hypersonic Aircraft through Parametric Studies. Energies 2018, 11, 3449. [Google Scholar] [CrossRef] [Green Version]
  5. Shenkin, A.V.; Mazurov, A.P.; Bykov, A.P. Aerodynamic Design of Single-Expansion-Ramp Nozzle for Aircraft with Supersonic Cruise Speed of Flight. In Proceedings of the 29th Congress of the International Council for Aeronautical Science, St. Petersburg, Russia, 7–12 September 2014. [Google Scholar]
  6. Zhang, P.; Xu, J.; Quan, Z.; Mo, J. Effects of Nonuniform Mach-Number Entrance on Scramjet Nozzle Flowfield and Performance. Acta Astronaut. 2016, 129, 201–210. [Google Scholar] [CrossRef]
  7. Lv, Z.; Xu, J.; Mo, J. Design of a Three-Dimensional Scramjet Nozzle Considering Lateral Expansion and Geometric Constraints. Acta Astronaut. 2017, 141, 172–182. [Google Scholar] [CrossRef]
  8. You, Y.; Liang, D. Design Concept of Three-Dimensional Section Controllable Internal Waverider Hypersonic Inlet. Sci. China Ser. E-Technol. Sci. 2009, 52, 2017–2028. [Google Scholar] [CrossRef]
  9. Lu, X.; Yue, L.; Xiao, Y.; Zhang, X. Design of three-dimensional section controllable scramjet nozzle. In Proceedings of the 2nd National Hypersonic Science and Technology Academic Conference, Wuxi, Jiangsu, 26 October 2010. (In Chinese). [Google Scholar]
  10. Lv, Z.; Xu, J.; Mo, J. Design and Analysis on Three-Dimensional Scramjet Nozzles with Shape Transition. Aerosp. Sci. Technol. 2017, 71, 189–200. [Google Scholar] [CrossRef]
  11. Quan, Z.; Xu, J.; Mo, J. Design of nonlinearly compressed SERN profile. J. Propuls. Technol. 2012, 33, 951–955. (In Chinese) [Google Scholar]
  12. Hoffman, J.D. Design of Compressed Truncated Perfect Nozzles. J. Propuls. Power 1987, 3, 150–156. [Google Scholar] [CrossRef]
  13. Damira, S.; Marathe, A.; Sudhakar, K.; Issacs, A. Parametric Optimization of Single Expansion Ramp Nozzle (SERN). In Proceedings of the 42nd AIAA/ASME/SAE/ASEE Joint Propulsion Conference & Exhibit, Sacramento, CA, USA, 9–12 July 2006. [Google Scholar]
  14. Gao, T.; Cui, K.; Wang, X.; Hu, S.; Yang, G.; Ren, L. Aerodynamic Optimization and Evaluation for the Three-Dimensional Afterbody/Nozzle Integrated Configuration of Hypersonic Vehicles. Chin. Sci. Bull. 2012, 57, 849–857. [Google Scholar] [CrossRef] [Green Version]
  15. Zhu, M.; Fu, L.; Zhang, S.; Zheng, Y. Design and Optimization of Three-Dimensional Supersonic Asymmetric Truncated Nozzle. Proc. Inst. Mech. Eng. Part G J. Aerosp. Eng. 2018, 232, 2923–2935. [Google Scholar] [CrossRef]
  16. Kulfan, B.M. The “CST” Universal Parametric Geometry Representation Method, Recent Extensions and Applications. In Proceedings of the Royal Aeronautical Society Conference, Hamilton, London, UK, 23–24 October 2007. [Google Scholar]
  17. Akram, M.T.; Man-Hoe, K. CFD Analysis and Shape Optimization of Airfoils Using Class Shape Transformation and Genetic Algorithm—Part I. Appl. Sci. 2021, 11, 3791. [Google Scholar] [CrossRef]
  18. Su, H.; Gu, L.; Gong, C. Research on Geometry Modeling Method Based on Three-Dimensional CST Parameterization Technology. In Proceedings of the 16th AIAA/ISSMO Multidisciplinary Analysis and Optimization Conference, Dallas, TX, USA, 22–26 June 2015. [Google Scholar]
  19. Wang, Q.; Zhao, Q.; Wu, Q. Aerodynamic Shape Optimization for Alleviating Dynamic Stall Characteristics of Helicopter Rotor Airfoil. Chin. J. Aeronaut. 2015, 28, 346–356. [Google Scholar] [CrossRef]
  20. Liu, C.; Duan, Y.; Cai, J.; Wang, J. Application of the 3D Multi-Block CST Method to Hypersonic Aircraft Optimization. Aerosp. Sci. Technol. 2016, 50, 295–303. [Google Scholar] [CrossRef]
  21. Christie, R.; Robinson, M.; Tejero, F.; MacManus, D.G. The Use of Hybrid Intuitive Class Shape Transformation Curves in Aerodynamic Design. Aerosp. Sci. Technol. 2019, 95, 105473. [Google Scholar] [CrossRef]
  22. Wang, J.; Cai, J.; Liu, C.; Duan, Y.; Yu, Y. Aerodynamic Configuration Integration Design of Hypersonic Cruise Aircraft with Inward-Turning Inlets. Chin. J. Aeronaut. 2017, 30, 1349–1362. [Google Scholar] [CrossRef]
  23. Berguin, S.H.; Mavris, D.N. Dimensionality Reduction in Aerodynamic Design Using Principal Component Analysis with Gradient Information. In Proceedings of the 10th AIAA Multidisciplinary Design Optimization Conference, National Harbor, MD, USA, 13–17 January 2014. [Google Scholar]
  24. Berguin, S.H.; Mavris, D.N. Dimensionality Reduction Using Principal Component Analysis Applied to the Gradient. AIAA J. 2015, 53, 1078–1090. [Google Scholar] [CrossRef]
  25. Qiu, Y.; Bai, J.; Liu, N.; Wang, C. Global Aerodynamic Design Optimization Based on Data Dimensionality Reduction. Chin. J. Aeronaut. 2018, 31, 643–659. [Google Scholar] [CrossRef]
  26. Tao, J.; Sun, G.; Guo, L.; Wang, X. Application of a PCA-DBN-Based Surrogate Model to Robust Aerodynamic Design Optimization. Chin. J. Aeronaut. 2020, 33, 1573–1588. [Google Scholar] [CrossRef]
  27. Deb, K.; Pratap, A.; Agarwal, S.; Meyarivan, T. A Fast and Elitist Multiobjective Genetic Algorithm: NSGA-II. IEEE Trans. Evol. Comput. 2002, 6, 182–197. [Google Scholar] [CrossRef] [Green Version]
  28. Wang, F.; Xu, J.; Wang, Y. Study of flow field characteristics of an over-under TBCC exhaust system during mode transition process. J. Exp. Fluid Mech. 2019, 33, 68–75. (In Chinese) [Google Scholar]
  29. Bare, E.A.; Capone, F.J. Static Internal Performance of Convergent Single-Expansion-Ramp Nozzles with Various Combinations of Internal Geometric Parameters; No. NAS 1.15:4112; NASA: Washington, DC, USA, 1989. [Google Scholar]
  30. Zhu, F.; Qin, N. Geometric Parameterisation and Aerodynamic Shape Optimisation. Ph.D. Thesis, University of Sheffield, Sheffield, South Yorkshire, UK, 2014. [Google Scholar]
  31. Ceze, M.; Hayashi, M.; Volpe, E. A Study of the CST Parameterization Characteristics. In Proceedings of the 27th AIAA Applied Aerodynamics Conference, San Antonio, TX, USA, 22–25 June 2009. [Google Scholar]
  32. Deutsch, J.L.; Deutsch, C.V. Latin Hypercube Sampling with Multidimensional Uniformity. J. Stat. Plan. Infer. 2012, 142, 763–772. [Google Scholar] [CrossRef]
  33. Sahilm89/Lhsmdu: Latin Hypercube Sampling with Multi-Dimensional Uniformity (LHSMDU): Speed Boost Minor Compatibility Fixes|Zenodo. Available online: https://zenodo.org/record/3929531#.YzvqlHZByUk (accessed on 4 October 2022).
  34. Cinquegrana, D.; Iuliano, E. Efficient Global Optimization of a Transonic Wing with Geometric Data Reduction. In Proceedings of the 35th AIAA Applied Aerodynamics Conference, Denver, CO, USA, 5–9 June 2017. [Google Scholar]
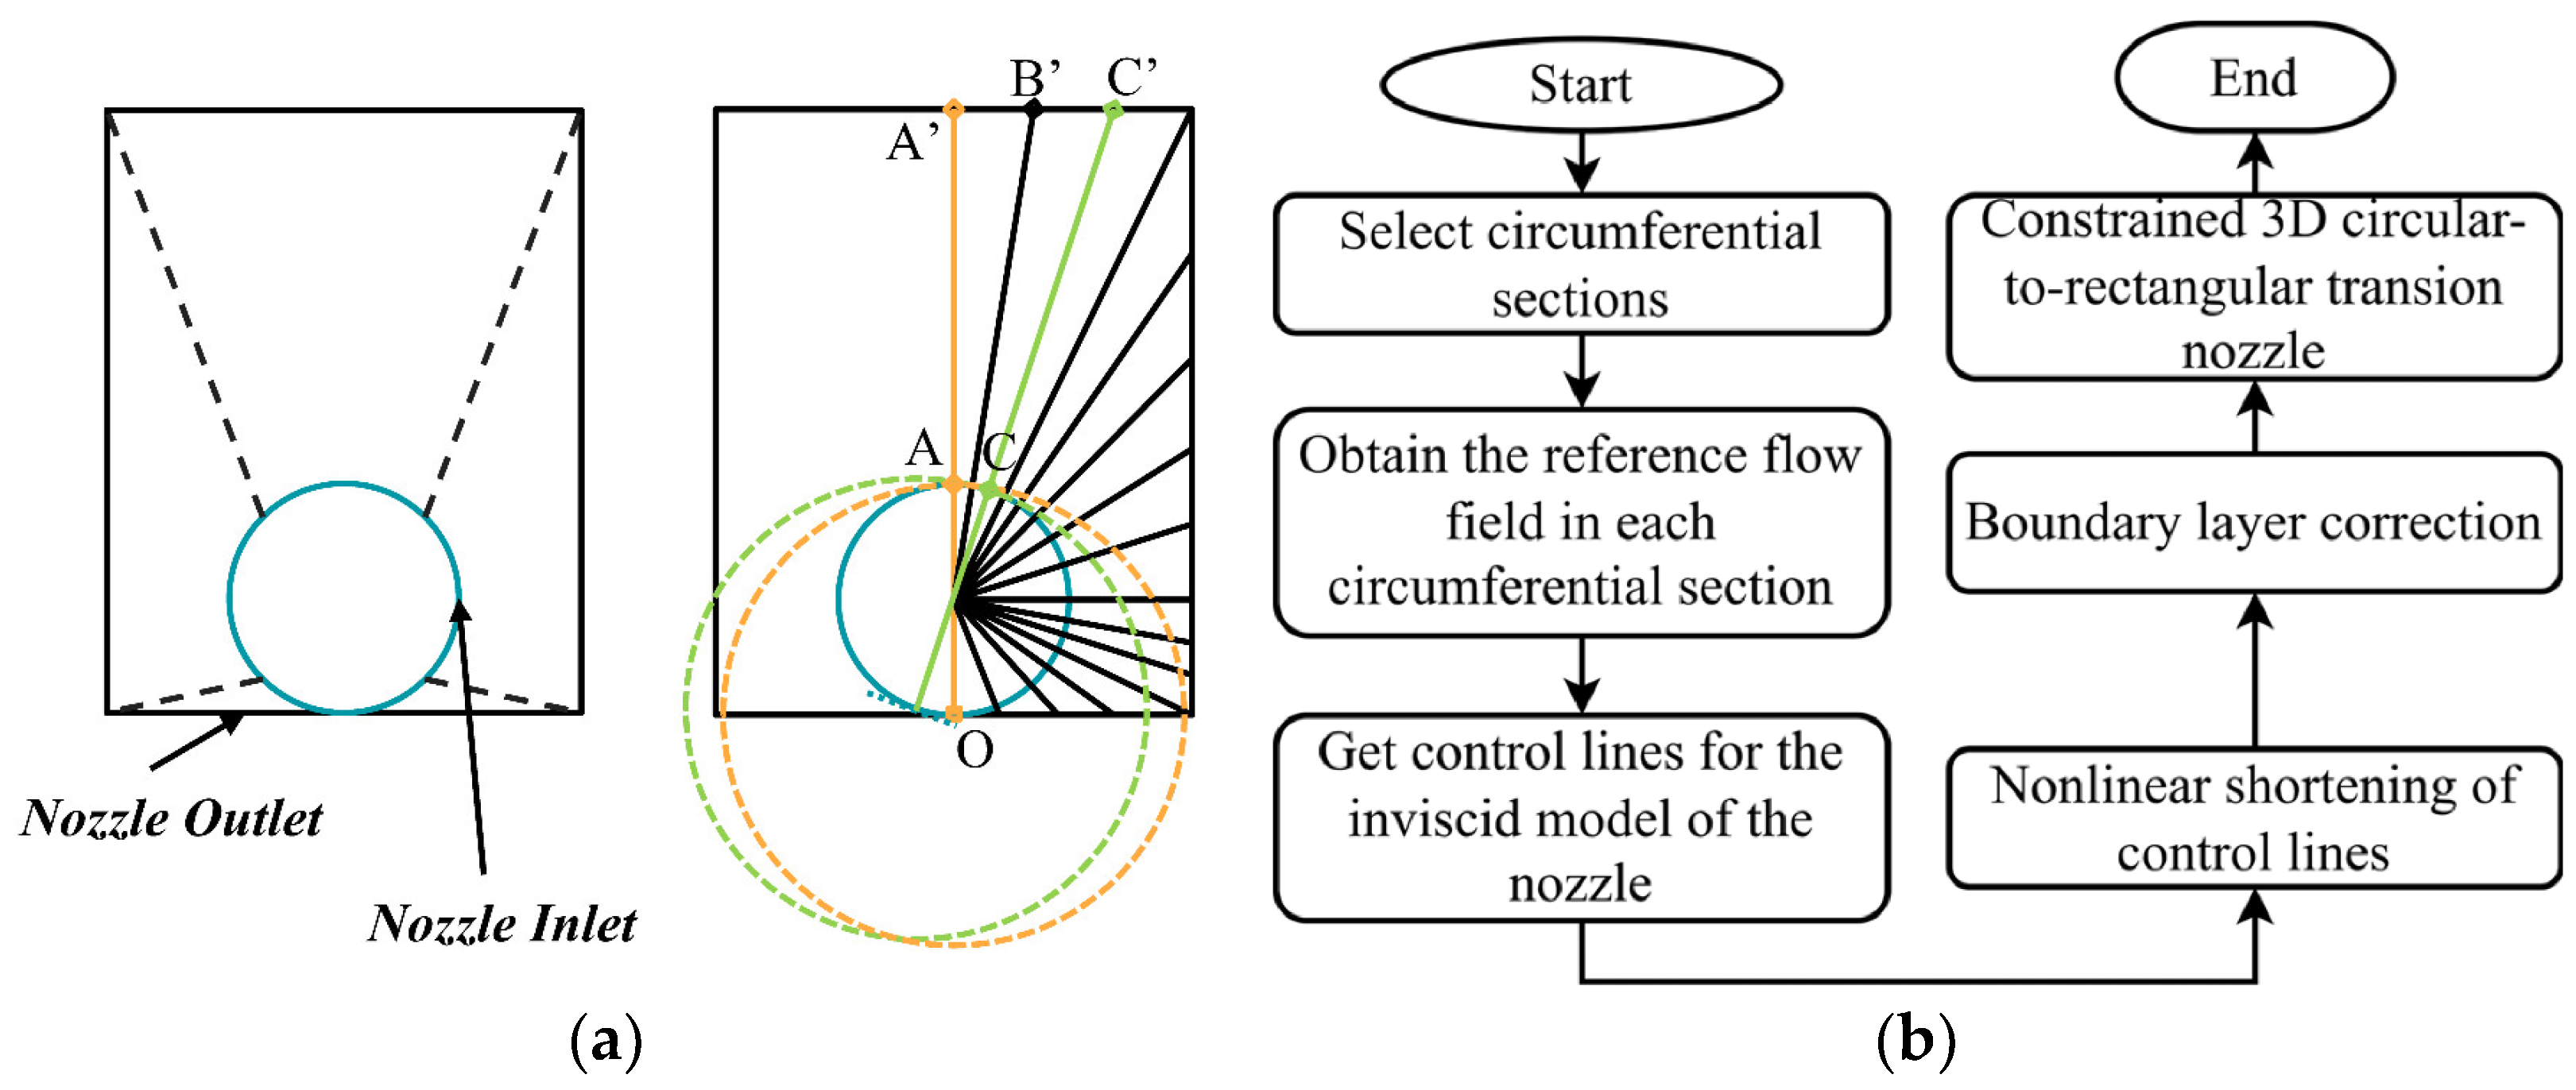
Figure 1. (a) Schematic diagram of the nozzle configuration and flow field segmentation; (b) Flow chart of the establishment of the initial nozzle model used in this study.
Energies 15 09316 g001
Figure 2. Schematic diagram of the 1/2 model of the 3D circular-to-rectangular transition nozzle designed in this study and its geometric dimensions.
Energies 15 09316 g002
Figure 3. The geometry, mesh, and boundary conditions used in validation of the numerical method.
Energies 15 09316 g003
Figure 4. Comparison of numerical calculation results and experimental data at (a) NPR = 2.502; (b) NPR = 10.009; (c) Mach number contour of flow field at NPR = 2.502 and the location of the ramp pressure variation.
Energies 15 09316 g004
Figure 5. Validation of mesh independence: (a) computational domain and boundary conditions, (b) pressure distribution at the centerline of the upper and lower walls as calculated using different meshes.
Energies 15 09316 g005
Figure 6. Flow chart showing the optimization system of the 3D circular-to-rectangular transition nozzle based on CST-PCA-RBFNN surrogate model.
Energies 15 09316 g006
Figure 7. Comparison of the structure and performance of the flow field corresponding to the nozzle control line before and after nonlinear shortening: (a) Mach number contour; (b) axial thrust coefficients.
Energies 15 09316 g007
Figure 8. Mach number contours of flow field section of the initial model: (a) symmetry plane; (b) cross section at y/rinlet = 1.
Energies 15 09316 g008
Figure 9. Mach number contours of flow field sections at different positions along the x-direction: (a) x/rinlet = 10.557; (b) x/rinlet = 11.996; (c) x/rinlet = 13.436; (d) x/rinlet = 15.355; (e) x/rinlet = 16.315; (f) x/rinlet = 17.274.
Energies 15 09316 g009
Figure 10. Mach number contours of flow field section of the BX4−BR6 approximate model: (a) symmetry plane; (b) cross section at y/rinlet = 1.
Energies 15 09316 g010
Figure 11. Effect of sample number on principal components and PCA coefficients: (a) cumulative contribution of principal components for different sample sets; (b) bounds on PCA coefficients for different sample sets; (c) contribution rate of each principal component of SS300.
Energies 15 09316 g011
Figure 12. Fitting errors of the reconstructed validation models: (a) mean values of geometric fitting errors for different sample sets; geometric fitting errors (b) and performance fitting errors (c) of the validation model reconstructed using principal components of SS300.
Energies 15 09316 g012
Figure 13. Models reconstructed using the first four principal components and their representative deformation modes.
Energies 15 09316 g013
Figure 14. Fitting error of RBFNN: (a) average relative error for the training set, test set and validation models; (b) relative error for the four validation models.
Energies 15 09316 g014
Figure 15. Pareto front with the three selected cases.
Energies 15 09316 g015
Figure 16. Initial model and models of the three cases on Pareto front.
Energies 15 09316 g016
Figure 17. Mach number contours of flow field sections of the three cases on Pareto front: (a) symmetry plane of Case 1; (b) cross-section at y/rinlet = 1 for Case 1; (c) symmetry plane of Case 2; (d) cross-section at y/rinlet = 1 for Case 2; (e) symmetry plane of Case 3; (f) cross-section at y/rinlet = 1 for Case 3.
Energies 15 09316 g017
Figure 18. Wall pressure contours of the initial model and the three case models on the Pareto front.
Energies 15 09316 g018
Table 1. Geometric constraints of the 3D circular-to-rectangular transition nozzle design.
Inlet RadiusNozzle LengthNozzle Width
r inlet = 100 mml ≤ 10.557 r inlet w ≤ 4.597 r inlet
Table 2. Design parameters of the nozzle.
MaNPRTt/K
Initial Model577.9952665
Table 3. Mesh independence analysis results.
MeshNumber of Mesh CellsMesh Density FactorMaximum Relative
Error
Coarse888,5710.5022.698%
Medium1,770,06110
Fine3,563,6152.0130.375%
Table 4. Total L2 norm error of fitting (×10−2 m).
BX468
BR
433.387733.385833.3852
626.276826.277326.2771
820.827120.824220.8238
Table 5. Relative error of performance parameters between approximate models and initial model.
BX-BR4–44–64–86–48–48–8
Cfx0.026%0.015%0.011%0.099%0.018%0.027%
L0.333%0.751%0.643%0.79%0.427%0.671%
Table 6. Performance parameters and comparison of different models.
ModelPerformance Parameter
CfxL
ValueImprovement Rate (%)Value/(N)Improvement Rate (%)
Initial model0.963997\−1204.228\
Case 10.951866−1.258−301.50274.963
Case 20.9663240.241−738.12238.706
Case 30.9711540.742−1015.07415.707
Publisher’s Note: MDPI stays neutral with regard to jurisdictional claims in published maps and institutional affiliations.