Article

Energy Losses Related to Ring Pack Wear in Gasoline Car Engine

by
Grzegorz Koszalka
1 and
Paweł Krzaczek
2,*
1
Faculty of Mechanical Engineering, Lublin University of Technology, 20-618 Lublin, Poland
2
Department of Power Engineering and Transportation, University of Life Sciences in Lublin, Gleboka 28, 20-612 Lublin, Poland
*
Author to whom correspondence should be addressed.
Energies 2022, 15(24), 9570; https://doi.org/10.3390/en15249570
Submission received: 1 December 2022 / Revised: 14 December 2022 / Accepted: 14 December 2022 / Published: 16 December 2022
(This article belongs to the Special Issue Internal Combustion Engine: Research and Application)

Abstract

:
Decreasing production and rising prices of cars, especially those with electric drive, lead to longer use of cars with internal combustion engines. It can be assumed that in the future, more and more cars powered by such engines with high mileage and therefore high wear will be used. Engine wear leads to reduced efficiency and increased emissions. This paper analyzes the impact of wear of the piston–rings–cylinder system components on energy losses associated with gas leakage from the combustion chamber and friction of the rings against the cylinder liner in a car spark-ignition engine. A ring pack model was used for the analyses. The input data for the simulation were gained in measurements made on the engine test stand and measurements of the wear of the engine components used in the car. The energy losses associated with blow-by in an unworn engine ranged from 1.5% of the indicated work at high load to almost 5% at low load. In the engine after 300,000 km, these losses increased to 2.5% and 7.5%, respectively. Ring friction losses in an unworn engine ranged from 1.5% at high load to 9% at low load. The effect of wear on these losses was smaller. They increased by only 0.1% at high load and 1% at low load.

1. Introduction

The development of the transport sector is associated, on the one hand, with the growing transport needs of people and goods, and, on the other hand, with changes in the technologies used in means of transport [1]. Big changes in this sector result from the significant impact of transport on the natural environment on a local and global scale [2]. It is estimated that the demand for primary energy in transport is at the level of 20% [3,4], and the emission of greenhouse gases amounts to 20–30% on a global scale [5,6]. This amount of emission is mainly a consequence of the use of internal combustion engines as the primary driver of means of transport [7,8]. The vast majority of energy used in transport still comes from fossil fuels, although attempts are being made to use alternative gaseous and liquid fuels from biomass, or various chemical synthesis processes [9,10,11,12]. In addition, many new concepts for fuels and propulsion systems are being developed [13]. At the same time, smart technologies and social trends are emerging that cause changes in the requirements for the transport process, and the use of traditional and alternative forms of travel [14,15,16].
Despite the expected ban on the sale of vehicles powered by an internal combustion engine in the EU countries in 2035 and the dynamic growth of sold and used electric vehicles [17], there is a huge number of vehicles powered by internal combustion engines in use [18]. Their replacement requires the reconstruction of the automotive industry, changing many supply chains of components used for their production [19]. The scale of barriers related to this has been highlighted by the COVID-19 pandemic [15,20]. The introduction of the lockdown caused long-term disturbances in supply chains, especially in semiconductors, and a large decrease in sales of motor vehicles [21,22]. The availability of various materials including rare earth elements, which are used in new vehicle technologies, is also being analyzed [19,23,24]. Their availability largely limits the possibility of replacing vehicles with internal combustion engines on a global scale. Changes in the construction of vehicles to be more and more environmentally friendly and limitations in the availability of components for their production result in an increase in the prices of all vehicles, including used ones [14,25].
The limited substitutability of vehicles with internal combustion engines with vehicles with other types of propulsion forces the need for their longer operation [26,27]. This means that cars with increasing mileage are used. It can be assumed that after the introduction of a ban on the sale of cars with internal combustion engines, among others in the EU [16,17], vehicles with such engines will be used even much longer.
It is estimated that friction consumes about one-fifth of all the energy used in the world [28]. One-third of all the energy contained in the fuel burned in motor vehicles, and thus CO2 emissions [2], is used to overcome friction in the engine,. Almost half of these losses are related to the cooperation of the piston and rings with the cylinder liner [5]. Therefore, a lot of attention is devoted to improving the design of this system.
Numerous studies have been conducted to determine the impact of various factors on the operation of the piston–rings–cylinder system, and in particular on the mechanical resistance and wear of components [29,30,31]. The impact of cylinder machining was studied by, among others, Baby et al. [32], Kang et al. [33], Chen et al. [34], and Grabon [35]. The influence of the material and coatings was studied by, among others, Zabala et al. [36], Wroblewski and Rogolski [37], and Tomanik [38]. The influence of oil properties was studied by, among others, Dubey et al. [39], Gamble et al. [40], Kunt et al. [41], Gołębiowski et al. [42], and Lenauer [43]. The impact of oil aging on cylinder and ring wear and friction was investigated by Fernandes et al. [44] and Nikolakopoulos et al. [45]. Fang et al. [46] and Rahmani et al. [47] determined friction losses during cold and warm starts of an engine. Friction losses at low speeds and low loads, which are typical for urban use and which are currently emphasized in approval tests, were studied by Tomanik et al. [48] and Tormos et al. [49]. Despite so much research and the introduction of new design solutions, materials, and processing technologies into production [33,50,51], it is estimated that there is still a possibility of reducing friction losses by 20% over the next decade and even by 60% in the long term [48].
In contrast to friction, very little work has been performed on the impact of gas leakage from the combustion chamber to the crankcase on energy losses. Fenske et al. [52] estimated that blow-by losses amount to 0.5% of the energy contained in the fuel, while mechanical losses of the piston group amount to 2.3%, whereas Turnbull et al. [53] stated that gas leak losses can be up to six times higher than frictional losses. However, there is not enough evidence for this statement in this article. The effect of blow-by on energy losses was also analyzed in [54]. There are also very few works devoted to the impact of component wear on the operation of the piston system [55,56].
This study aimed to determine the impact of the ring pack wear on energy losses and fuel consumption due to blow-by and ring friction. The problem was undertaken considering the lack of quantitative data on the impact of the wear of the piston, rings, and cylinder liner on the engine efficiency in the literature and the large and ever-increasing number of high-mileage used cars. Apart from the unique results on the effect of wear on fuel consumption, the novelty of the study is in utilizing the measured in-cylinder pressure and simulated gas flows in the ring pack to evaluate energy losses related to gas leakage.

2. Object and Methods

2.1. Tested Engine

The research was performed for an inline four-cylinder, naturally aspirated spark-ignition engine with direct injection, which is used to power middle-class, C and D-segment passenger cars. Specification of the engine is presented in Table 1. The engine featured an aluminum alloy cylinder block and an aluminum head with a dual overhead camshaft. The engine had a typical ring pack composed of an aluminum piston with two compression rings and one oil ring: a steel barrel-faced top ring, a Napier-type second ring, and a three-piece stainless steel oil ring. All the rings had straight ring end gaps. The main dimensions of the rings are presented in Table 2.

2.2. Determination of Wear

The wear of the ring-pack was determined using the engine mounted in a D-segment sedan. After a short use of the engine in the car (about 3000 km), the engine was partially dismantled and the dimensions of the cylinders, pistons, and rings were measured. After assembly, the engine continued to be used in the car. After a mileage of approx. 120,000 km, the engine was partially disassembled again and the same measurements were made. Average values of differences in measured dimensions at 120,000 km and 3000 km were assumed as component wear after 120,000 km.
The wear of components for long mileages, i.e., 300,000 km, was assumed by extrapolating the wear after 120,000 km, i.e., by multiplying the wear for 120,000 km by 2.5.

2.3. Dynamometer Tests

Bench tests were carried out on another example of the same type of engine that was used to determine wear. The purpose of the tests on the engine stand was to measure the pressure in the combustion chamber and the blow-by rate. The measured in-cylinder pressures were used as input data in simulations. The measured blow-by rates were used to validate the ring pack model.
Indicated pressure was measured in the first cylinder in the function of the crank angle with a resolution of 0.1 degrees. As a result of the measurement in given conditions, the average of one hundred consecutive cycles recorded under fixed engine operating conditions was adopted. The blow-by rate was measured with the use of an AVL 442 Blow-by Meter.
The analyses of the performance of the ring pack presented in the literature usually concern the operating conditions in which the engine reaches maximum power or maximum torque. However, under such conditions, the engine is rarely running during normal use in a passenger car.
Observations from the use of the engine in the car revealed that the vast majority of the time the engine worked at speeds in the range of 1500–2500 rpm. Therefore, it was decided that dynamometer tests and then simulations would be run at a rotational speed of 2000 rpm and loads corresponding to driving a car at speeds of 50, 70, 100, and 130 km/h. Taking this into account, the measurements were made at a constant rotational speed of 2000 rpm and torques of 20, 40, 86, and 168 Nm.

2.4. Model of the Ring-Pack

An integrated model of the ring pack was used in this research. The model couples the sub-model of the gas flow through the crevices of the piston–rings–cylinder assembly, the sub-model of the movements of the rings in the ring grooves, and the sub-model of the oil film between the ring faces and the cylinder liner. The model was developed earlier and described in detail in [56]. Below is a brief description of particular sub-models.

2.4.1. Model of Gas Flow

It was assumed that the seal consists of several chambers linked by throttling passages. Chambers correspond to inter-ring and behind-ring spaces and throttling passages correspond to ring end gaps and clearances between the side surfaces of the rings and the grooves (Figure 1). It was assumed that the rings, piston, and cylinder are axially symmetrical, and their dimensions do not change during the engine cycle, except for the diameter of the rings, which can expand and adjust to the cylinder diameter at a given height. However, wear and thermal deformations as well as the position of the rings in the grooves are used in the calculation of the instantaneous volumes of the chambers and cross-sectional areas of the throttling passages. It was also accepted that the gas flowing through the seal is a semi-perfect gas, for which internal energy and specific heat are dependent only on temperature.
The gas pressure in a given chamber is determined by applying the equation of energy balance, in which the change in internal energy of the gas results from the total enthalpy flowing in and out of the chamber with a stream of gas; heat exchange between gas in the chamber and the surrounding surfaces; and the work of volume change:
U ˙ = i h i n , i m ˙ i n , i j h o u t , j m ˙ o u t , j + Q ˙ p V   ˙
the equation of mass balance:
m ˙ = i m ˙ i n , i j m ˙ o u t , j  
and the equation of gas state in a differential form:
p ˙ p = m ˙ m + T ˙ T V ˙ V   .
The gas flow rate in a given throttling passage is treated as the isentropic flow. The cases of critical and subcritical flows are considered. The empirical discharge coefficient is used in calculations:
m ˙ i j = ψ i j A i j v i j ρ j   .
The heat exchange between the gas in a given chamber and the surrounding surfaces is calculated using the equation of convective heat transfer:
Q ˙ = i α i S i ( T i T g )   .
The heat exchange coefficient α between the gas in an inter-ring space and the surface of the cylinder is determined considering the Prandtl number and piston speed. The heat exchange coefficients between the gas and the surfaces of the rings and between the gas and the surface of the piston are constant.
The work of volume changes results from the changes in particular chamber volumes caused by the piston moving along the cylinder liner, the diameter of which is not constant, and by axial and radial displacements of the rings in the grooves.

2.4.2. Model of the Ring Movements

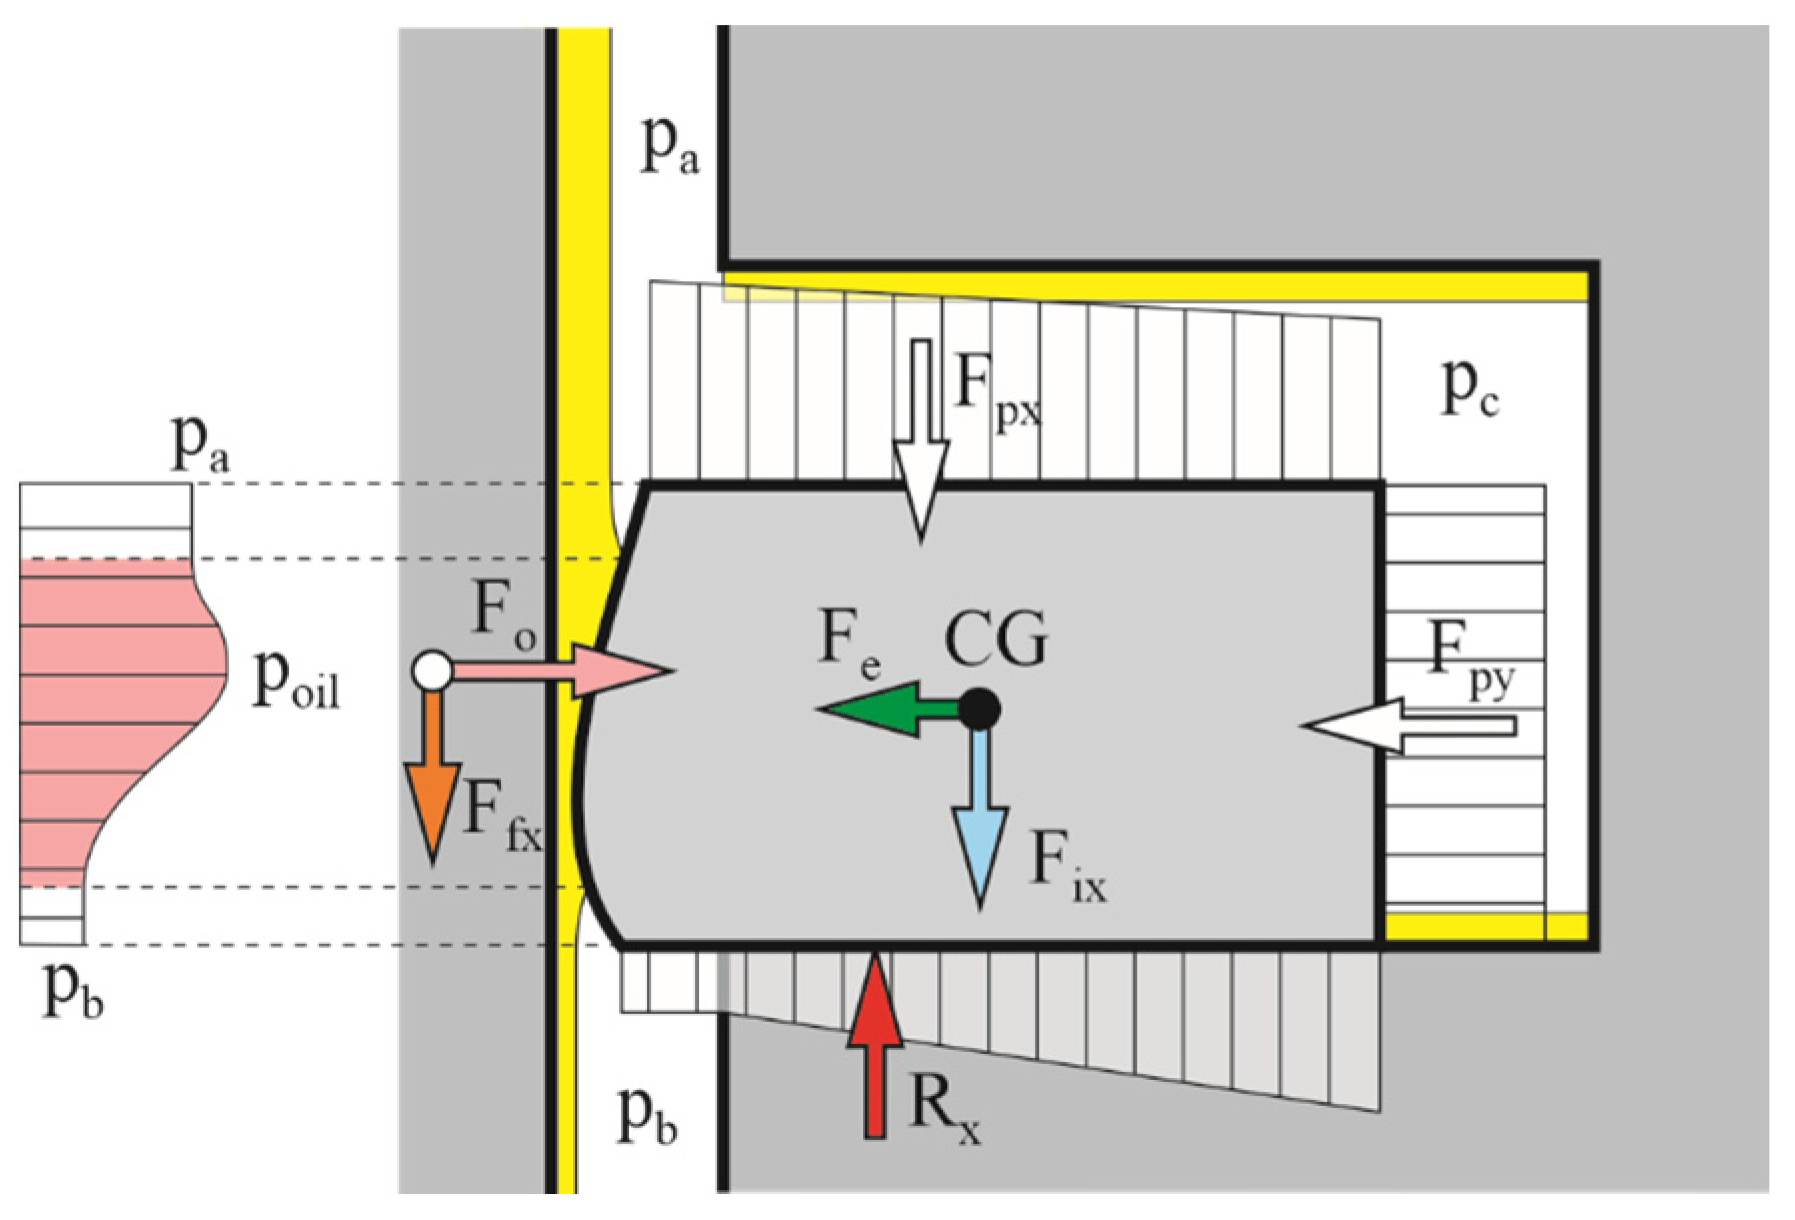
The axial position of a ring in the groove xr is predicted using the balance of forces acting on the ring in an axial direction:
m r d 2 x r d t 2 = F p x + F i x + F f x + F s + F a  
In the presented simulations the gas pressure force, inertia force, friction force, oil squeezing force, and adhesion force were considered (Figure 2).
The radial position of a ring in the groove (outer ring diameter) arises from the liner diameter at a given height and the minimum oil film thickness.

2.4.3. Model of Oil Film

In the presented simulations it was assumed that the surfaces of the rings and cylinder are smooth, and asperity contact between them was neglected. Therefore, only hydrodynamic lubrication occurs. Pressure distribution in oil film between a ring face and cylinder liner is derived from the reduced Reynolds equation for the one-directional flow of viscous liquid:
x ( h o i l 3 p o i l x ) = 6 μ o i l ν p h o i l x + 12 μ o i l h o i l t   ,
where hoil is lubricant film thickness, vp is the piston velocity, µoil is oil dynamic viscosity, x is a coordinate along the direction of the cylinder axis and t is time.
Reynolds cavitation conditions [57] were applied as boundary conditions to solve the equation. According to them, the oil pressure in the divergent part of the gap must not fall below the saturation pressure, and the oil pressures at the boundaries of the wetted area are equal to the pressure of the gas in the surrounding spaces (Figure 2).
The model considers starved lubrication, which means that the space between the ring and bore may be fully or only partially filled with oil. The wetted area is determined taking into account the balance of oil volume in the gap between the ring and liner.
The hydrodynamic force was calculated by integration of the hydrodynamic pressure distribution:
F o = π ( D c 2 h m ) x x a x x b p o i l ( x ) d x   .
The hydrodynamic friction force was calculated from the equation:
F f x = π ( D c 2 h m ) x x a x x b ( h ( x ) 2 p o i l x μ o i l ν p h ( x ) ) d x   .

2.5. Simulations

First, simulations of the ring pack operation were carried out for the input data corresponding to the operation of the unworn engine at the rotational speed of 2000 rpm and loads of 20, 40, 86, and 168 Nm.
The measured indicated pressure and geometrical dimensions determined based on engine specification and measurements were used as input data for the simulations. Thermal deformations of the piston group components were determined using the finite element method and added to dimensions determined for cold elements.
The model was calibrated by comparing the calculated blow-by rates with the measured ones. The calculated blow-by rate was obtained by integrating the instantaneous flow rates through the oil ring end gap and the clearance between this ring and the upper side of its groove achieved in simulations.
Then, a series of calculations were carried out for the engine after 120,000 km and 300,000 km. The input data for these mileages differed from the data for the unworn engine only in the dimensions of the cylinder liner and piston rings, as the wear of these elements was taken into account.

2.6. Evaluation of Energy Losses Due to Blow-by and Ring Friction

The effect of gas leakage on energy losses was assessed in the way presented in [54]. This method consists in determining the pressure that would be in the combustion chamber if there were no blow-by. This corrected pressure is a sum of measured in-cylinder pressure and the increase of pressure related to the mass of gas flowing out or flowing into the combustion chamber from the inter-ring space. The increase of pressure is determined from the gas state equation for each calculation step:
Δ p = R T V Δ m  
and the increase in mass Δm is calculated taking into account the flow rates simulated with the use of the ring pack model. Then, the indicated mean effective pressures and indicated work for the in-cylinder pressure measured and corrected for gas leaks were determined. The energy loss resulting from the blow-by is the difference between the indicated work for the corrected and measured in-cylinder pressures.
The energy losses related to the friction of the rings against the cylinder were the sum of the friction work in the individual computational steps of the simulation for the entire engine cycle. The friction forces of individual rings were calculated with the use of the ring pack model (Equation (9)).

3. Results and Discussion

3.1. Indicated Pressure and Wear

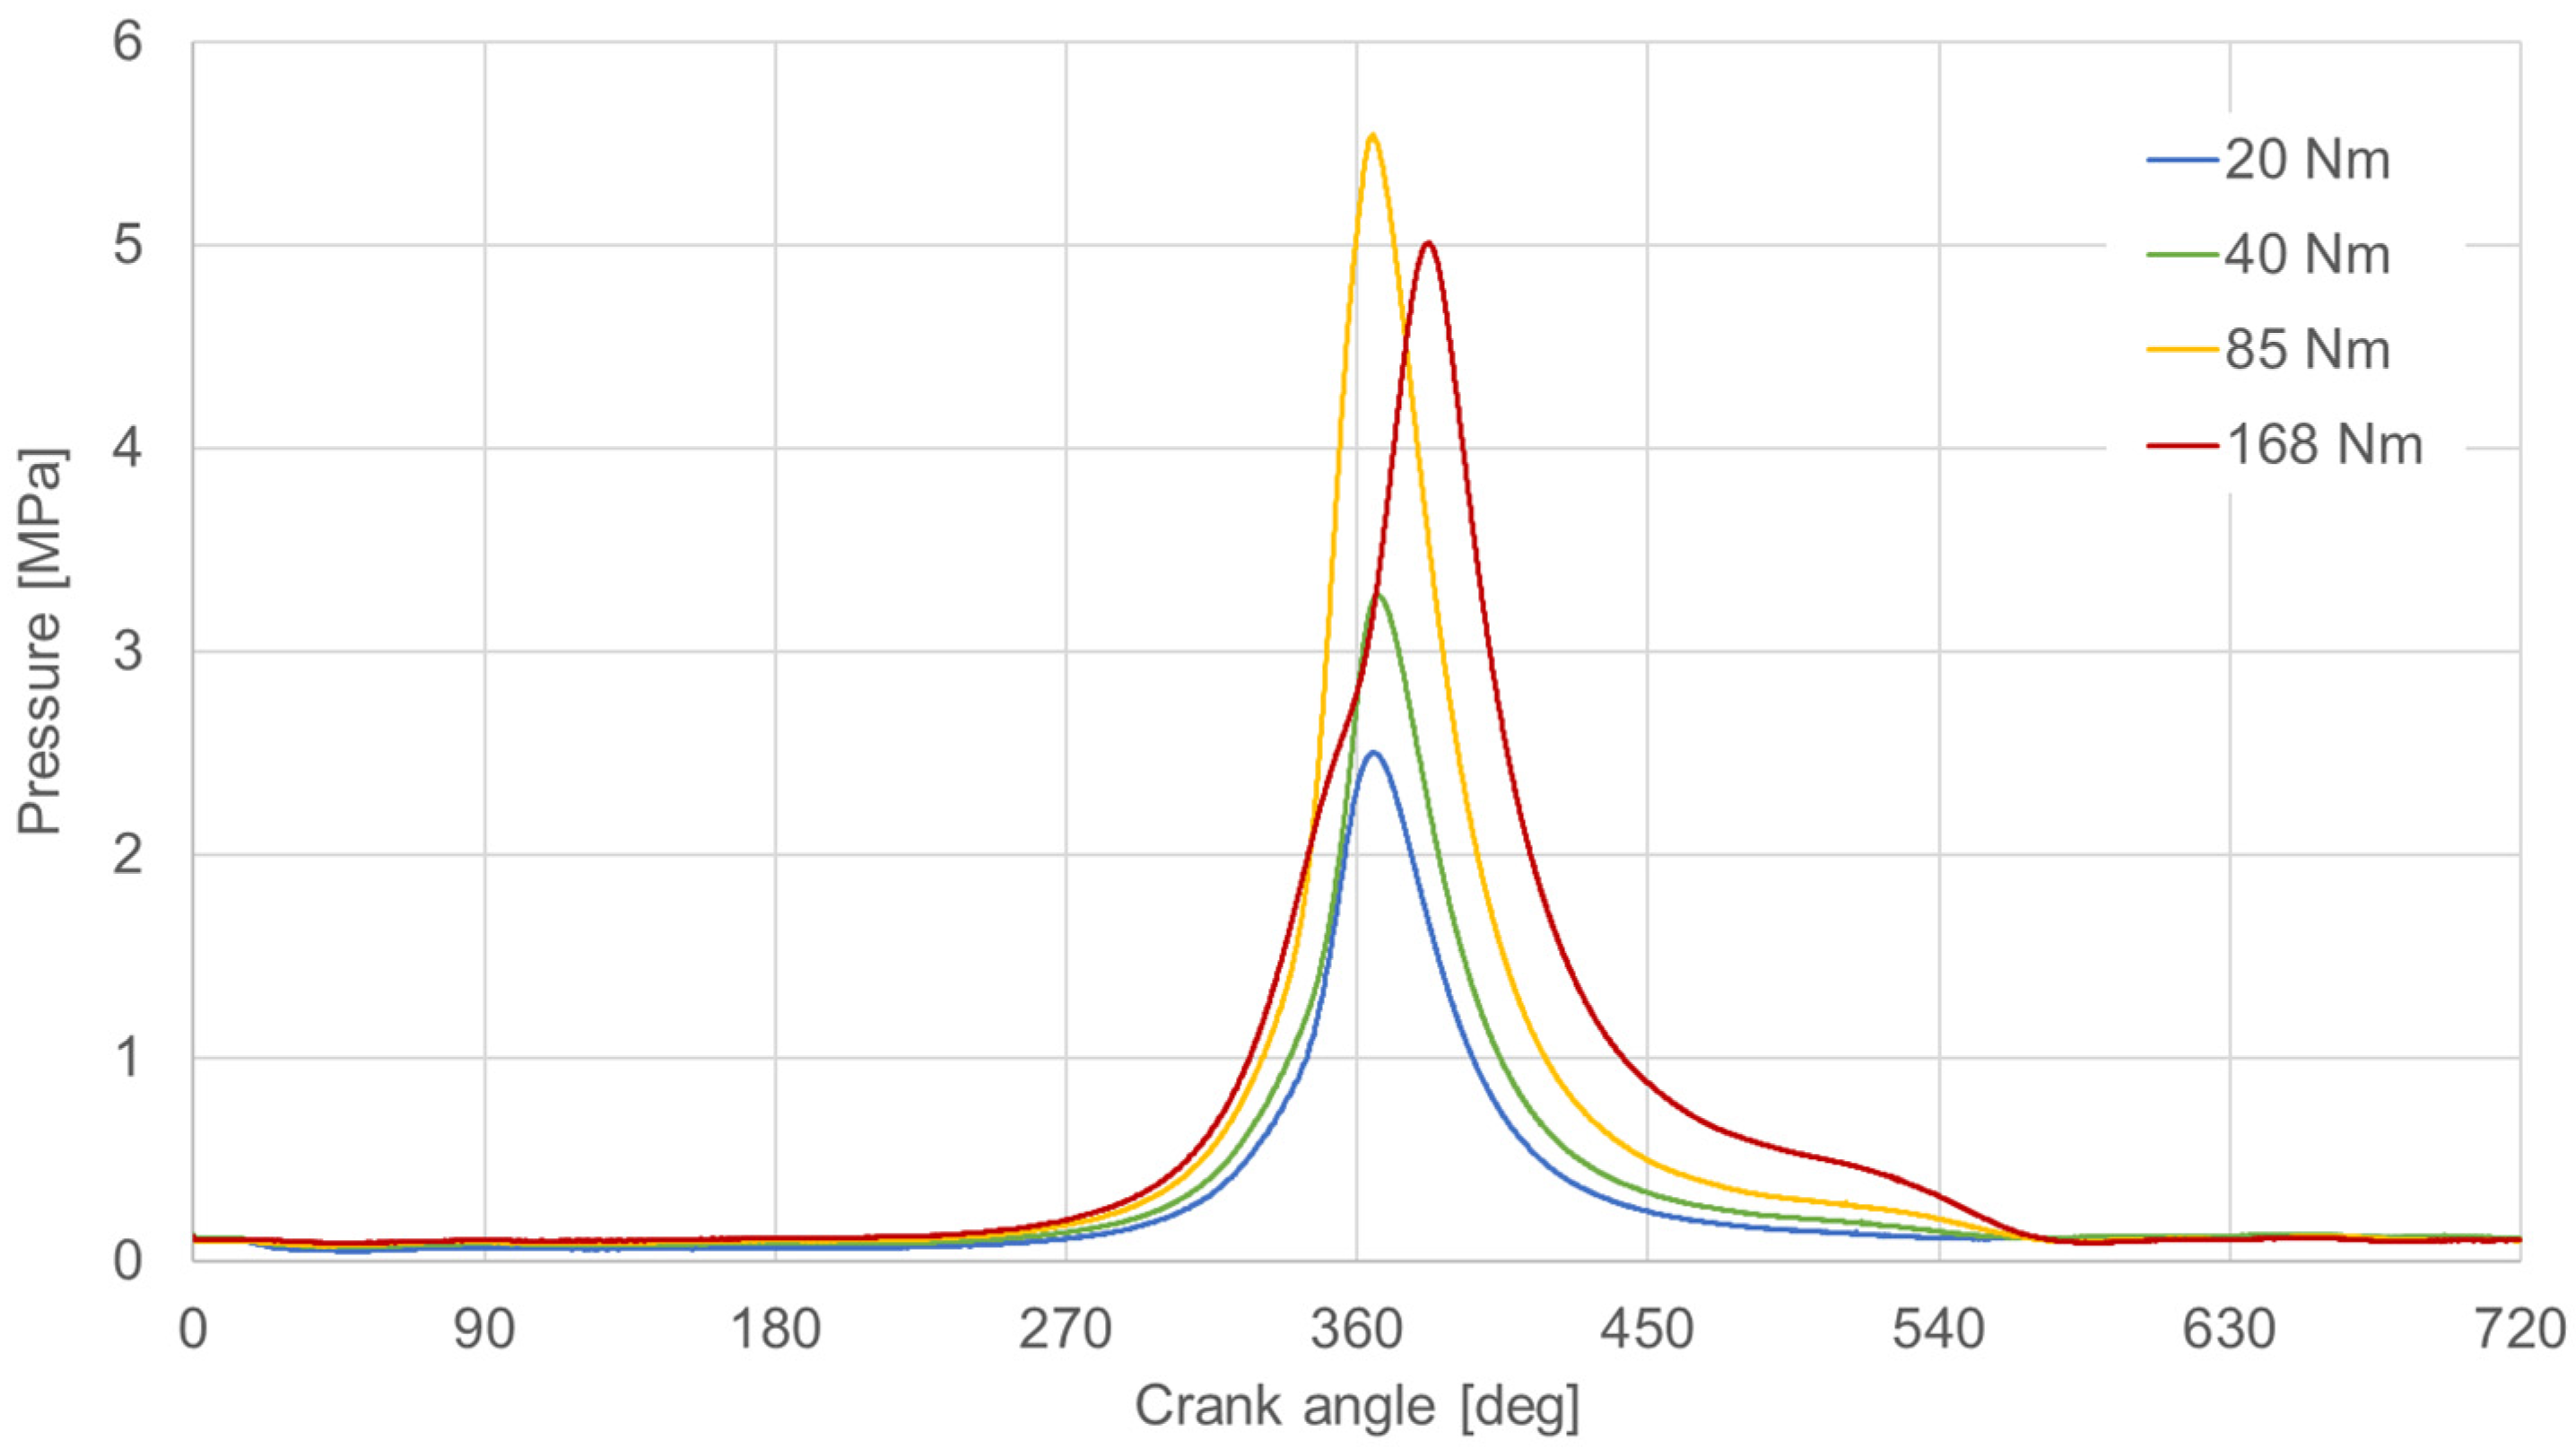
The results presented in this section were used as input data in simulation studies. The indicated pressure measured at the engine speed of 2000 rpm and four loads are shown in Figure 3. In the range of very small (20 Nm), small (40 Nm), and medium (85 Nm) loads, the increase in engine torque increases the maximum pressure in the combustion chamber, and the shapes of pressure curves are similar. However, at a very high load (168 Nm), the shape is slightly different. The maximum value of the pressure is lower and is reached later than at a load of 85 Nm. At this very high load, close to maximum, the engine was already working on a stoichiometric mixture, while this occurred at three smaller loads on a lean one. Based on these pressure curves, indicated mean effective pressures and indicated works were calculated and used in further analyses (see Section 3.4).
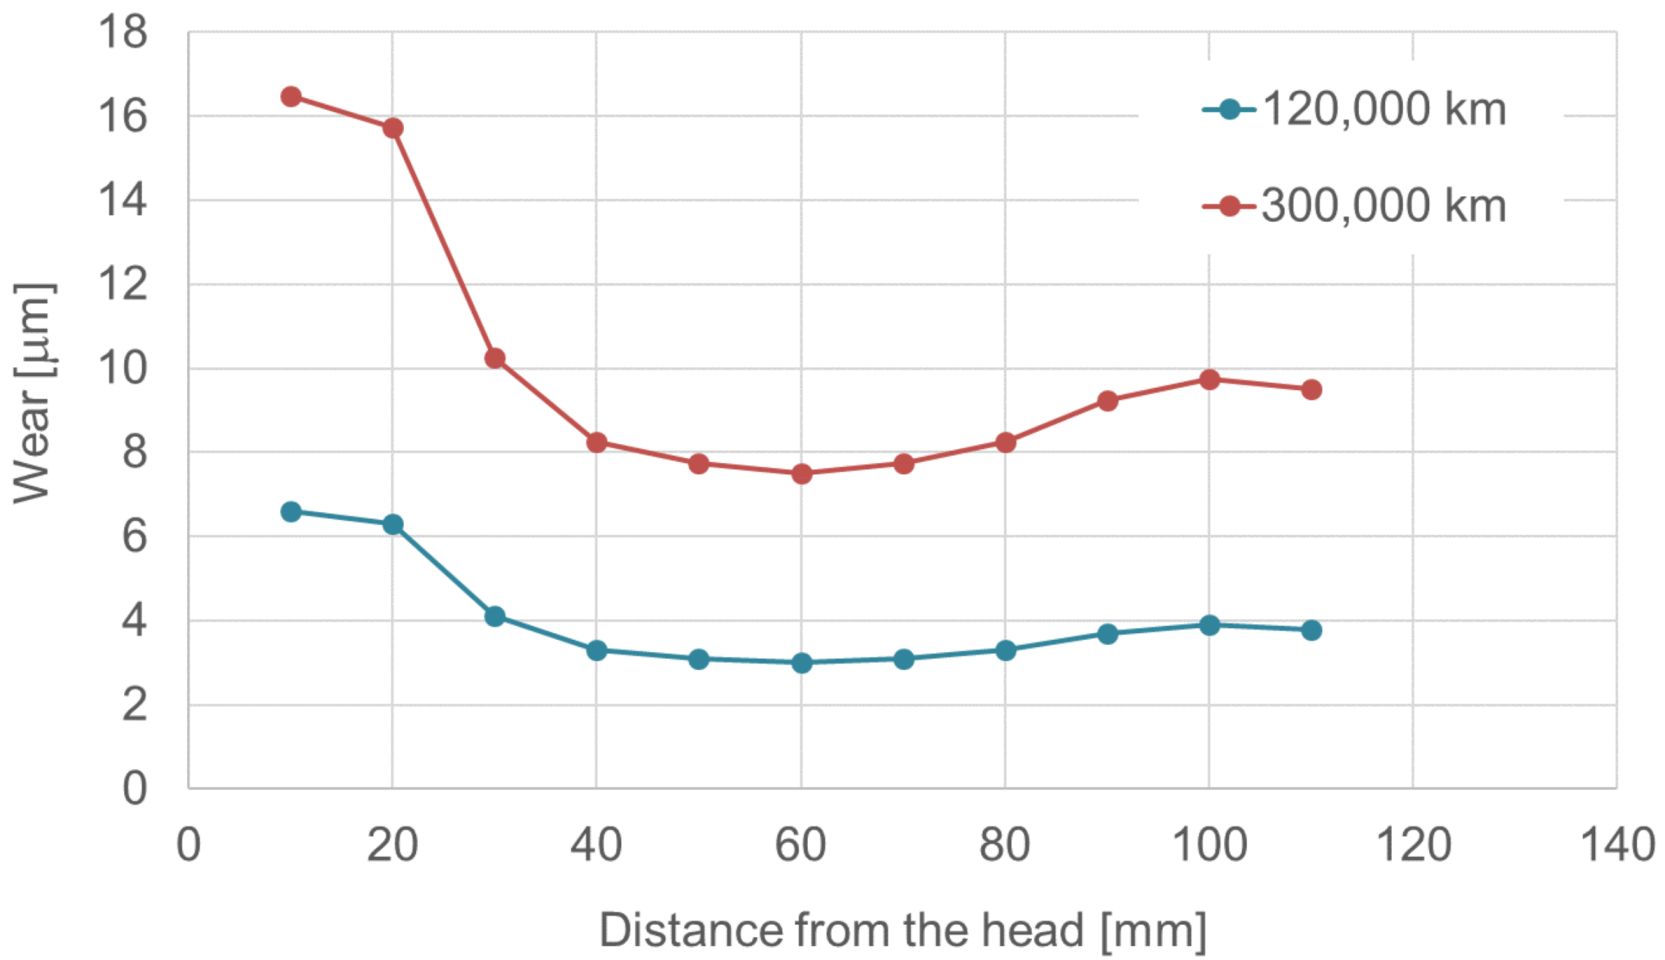
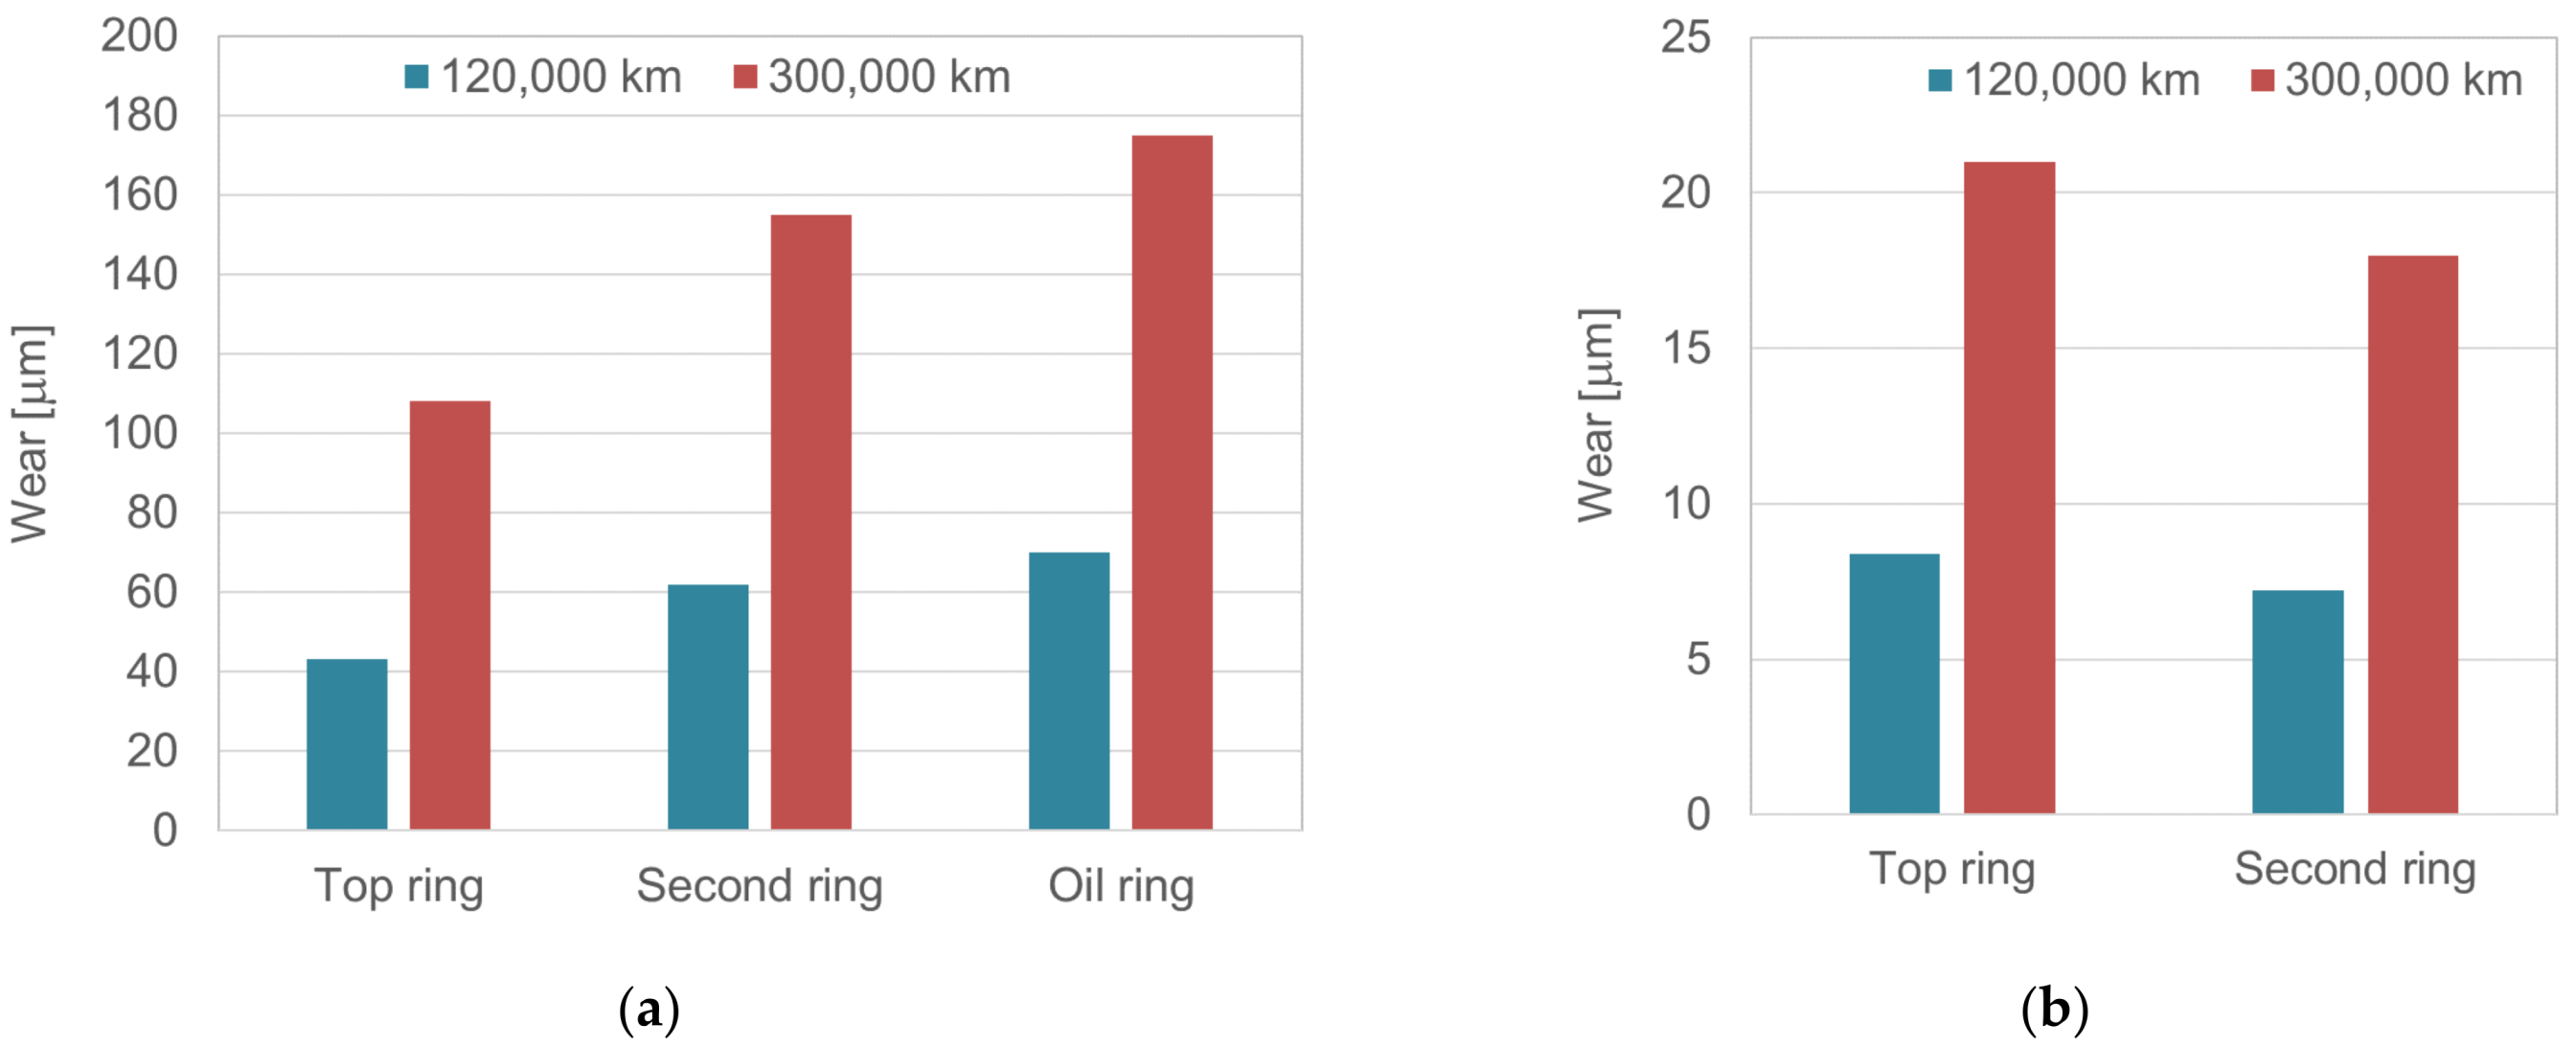
Figure 4 shows the results of measurements of the cylinder liner wear, and Figure 5 shows the wear of the rings after 120,000 km. The greatest wear of the liner occurred in the area of the top dead center of the rings. The wear in this area was more than double that at the mid-stroke of the rings. Such wear profile is in line with expectations. In the vicinity of the top dead center of the rings, the conditions of hydrodynamic lubrication are the worst due to the low, and even zero at TDC, ring speed, and the lowest oil viscosity. In addition, in this area, the pressure of the ring on the liner is the highest due to the greatest pressure behind the ring, and the wear resistance of the sleeve is the lowest due to the highest temperature. The wear also increases around the bottom dead center of the rings. However, here the temperature and pressure are much lower and the viscosity of the oil is higher, hence the increase in wear is much smaller.
Considering the wear of the ring faces, it was the smallest in the case of the top ring, bigger for the second ring, and the biggest for the oil ring (Figure 5a). The wear of the side surfaces of the first and second compression rings was similar (Figure 5b). The wear obtained in the measurements made after 120,000 km of the car’s mileage is similar to the wear obtained for automotive diesel engines after the 1000 h life tests [58,59]. The wear for the mileage of 300,000 km presented in Figure 4 and Figure 5 was obtained by multiplying the wear for 120,000 km by 2.5.

3.2. Blow-by Rate

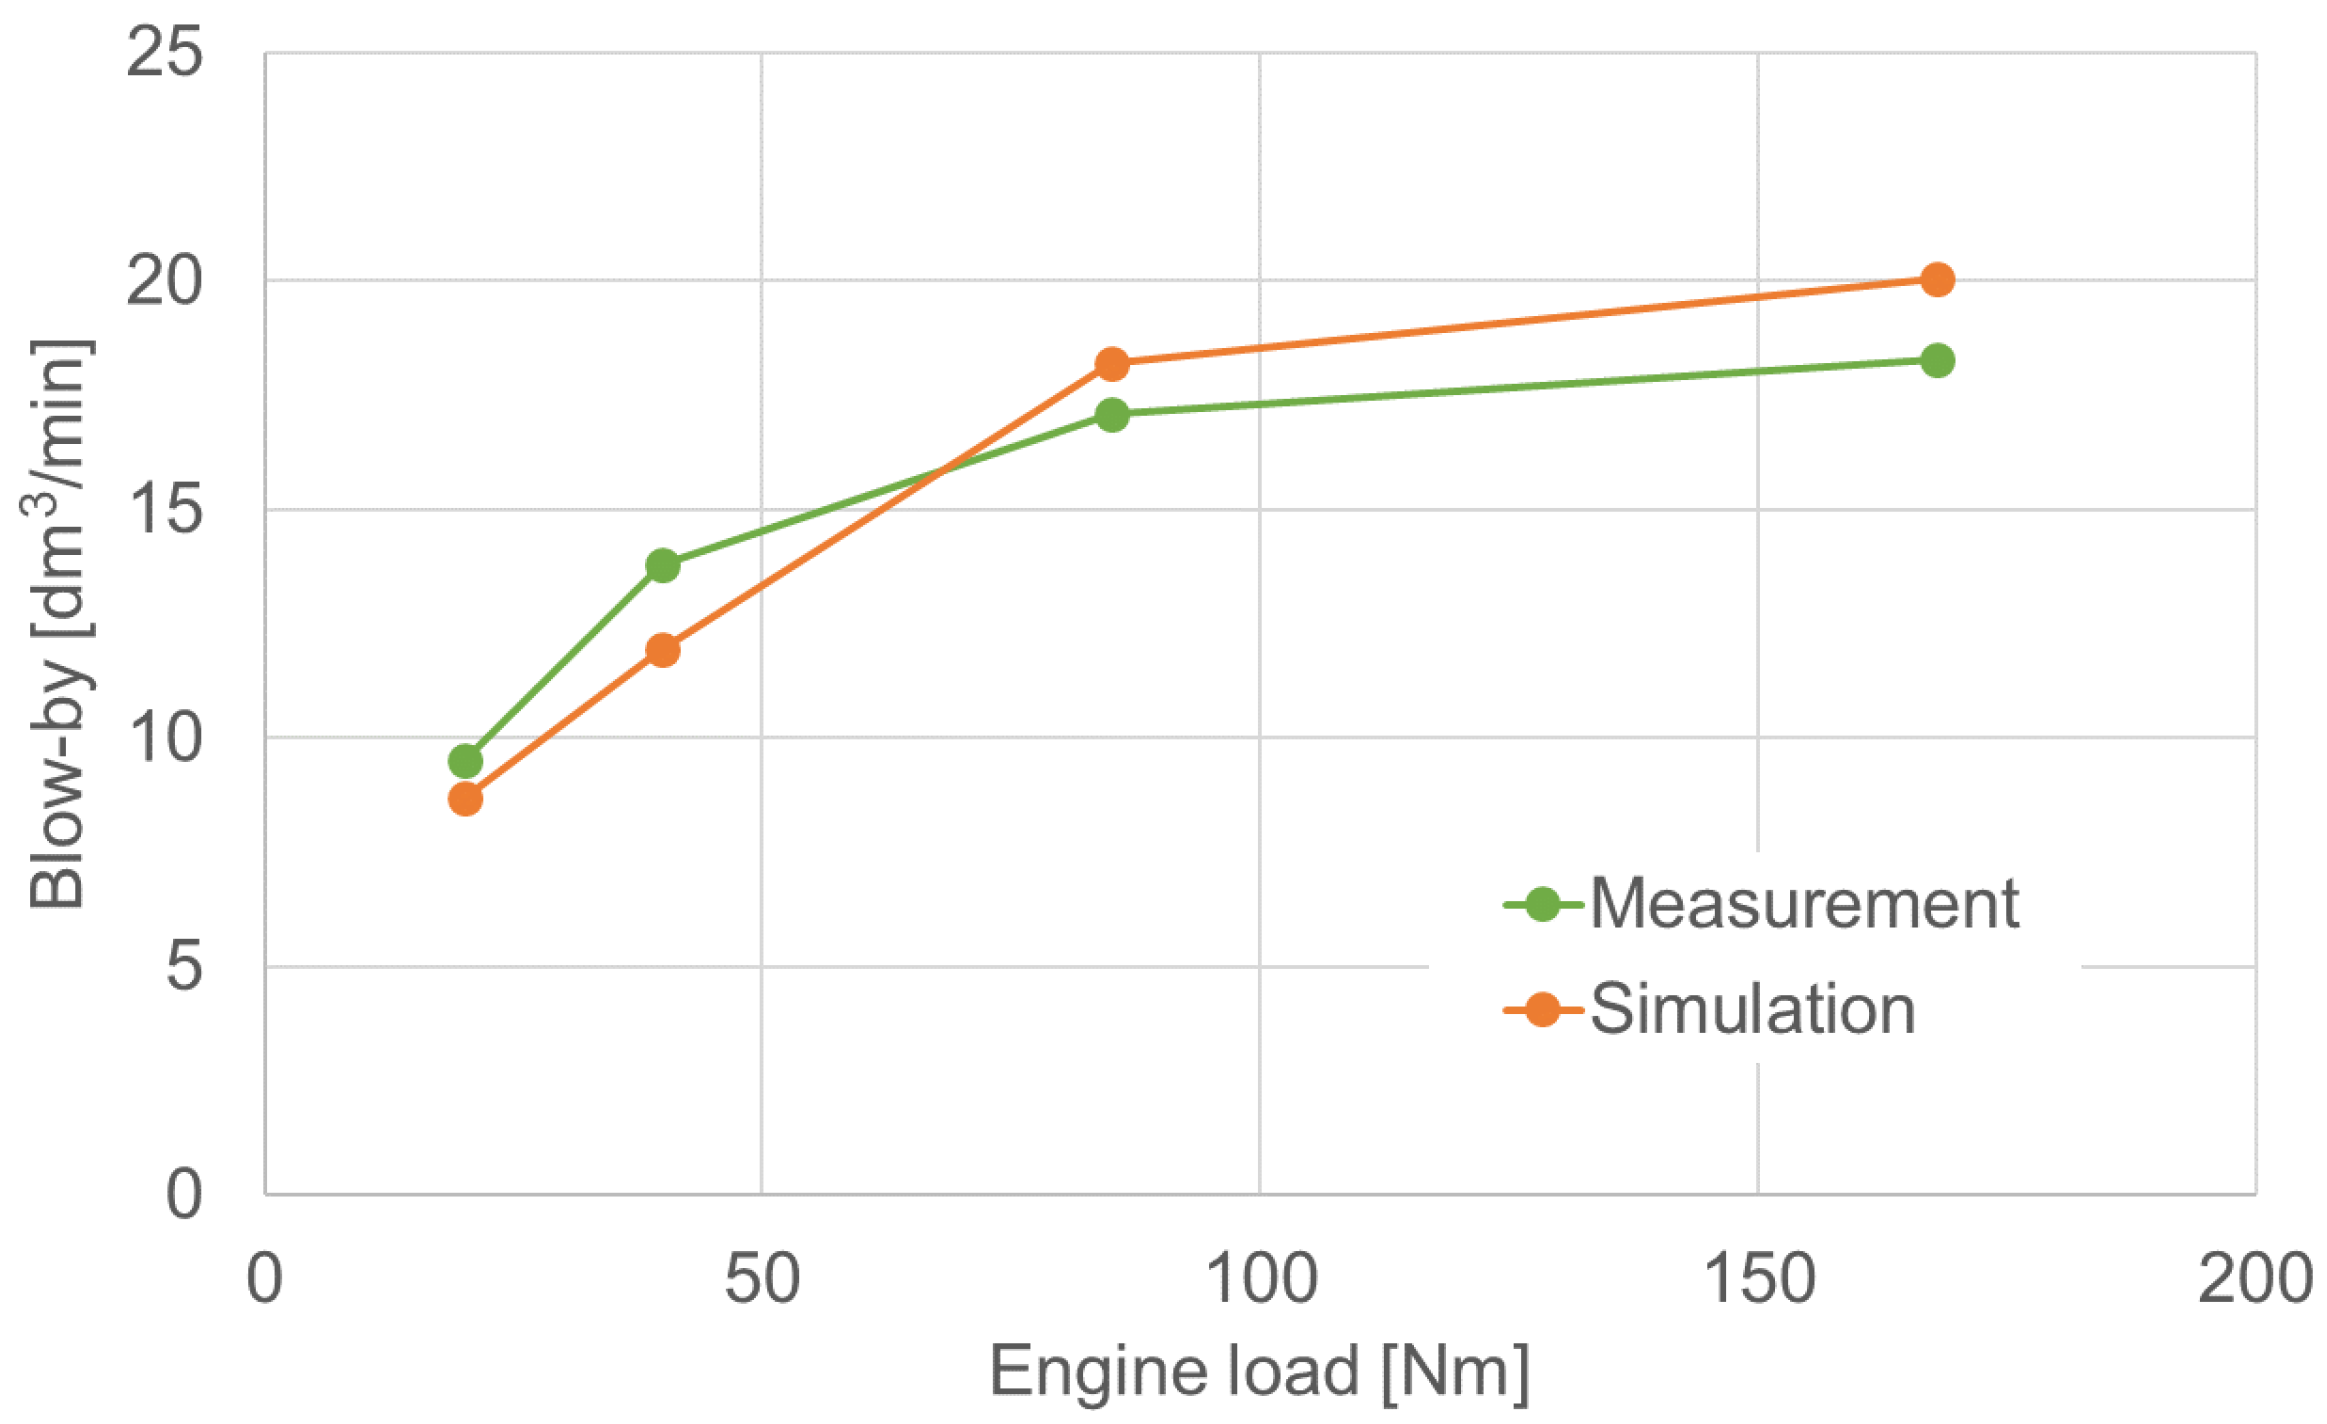
The in-cylinder pressures presented in Figure 3 were used as input data and simulations for an unworn engine were carried out. The calculated blow-by rates were compared with the actual ones (Figure 6). Both measured and simulated blow-by rates increase with increasing load; however, the actual blow-by increases slightly less than that obtained in the simulations. Despite this, the differences between the simulations and measurements did not exceed 15%, which was considered a satisfactory agreement of the results. It should be emphasized that although the model was not validated in terms of wear for the tested engine, it was previously verified using other engines [58,60].
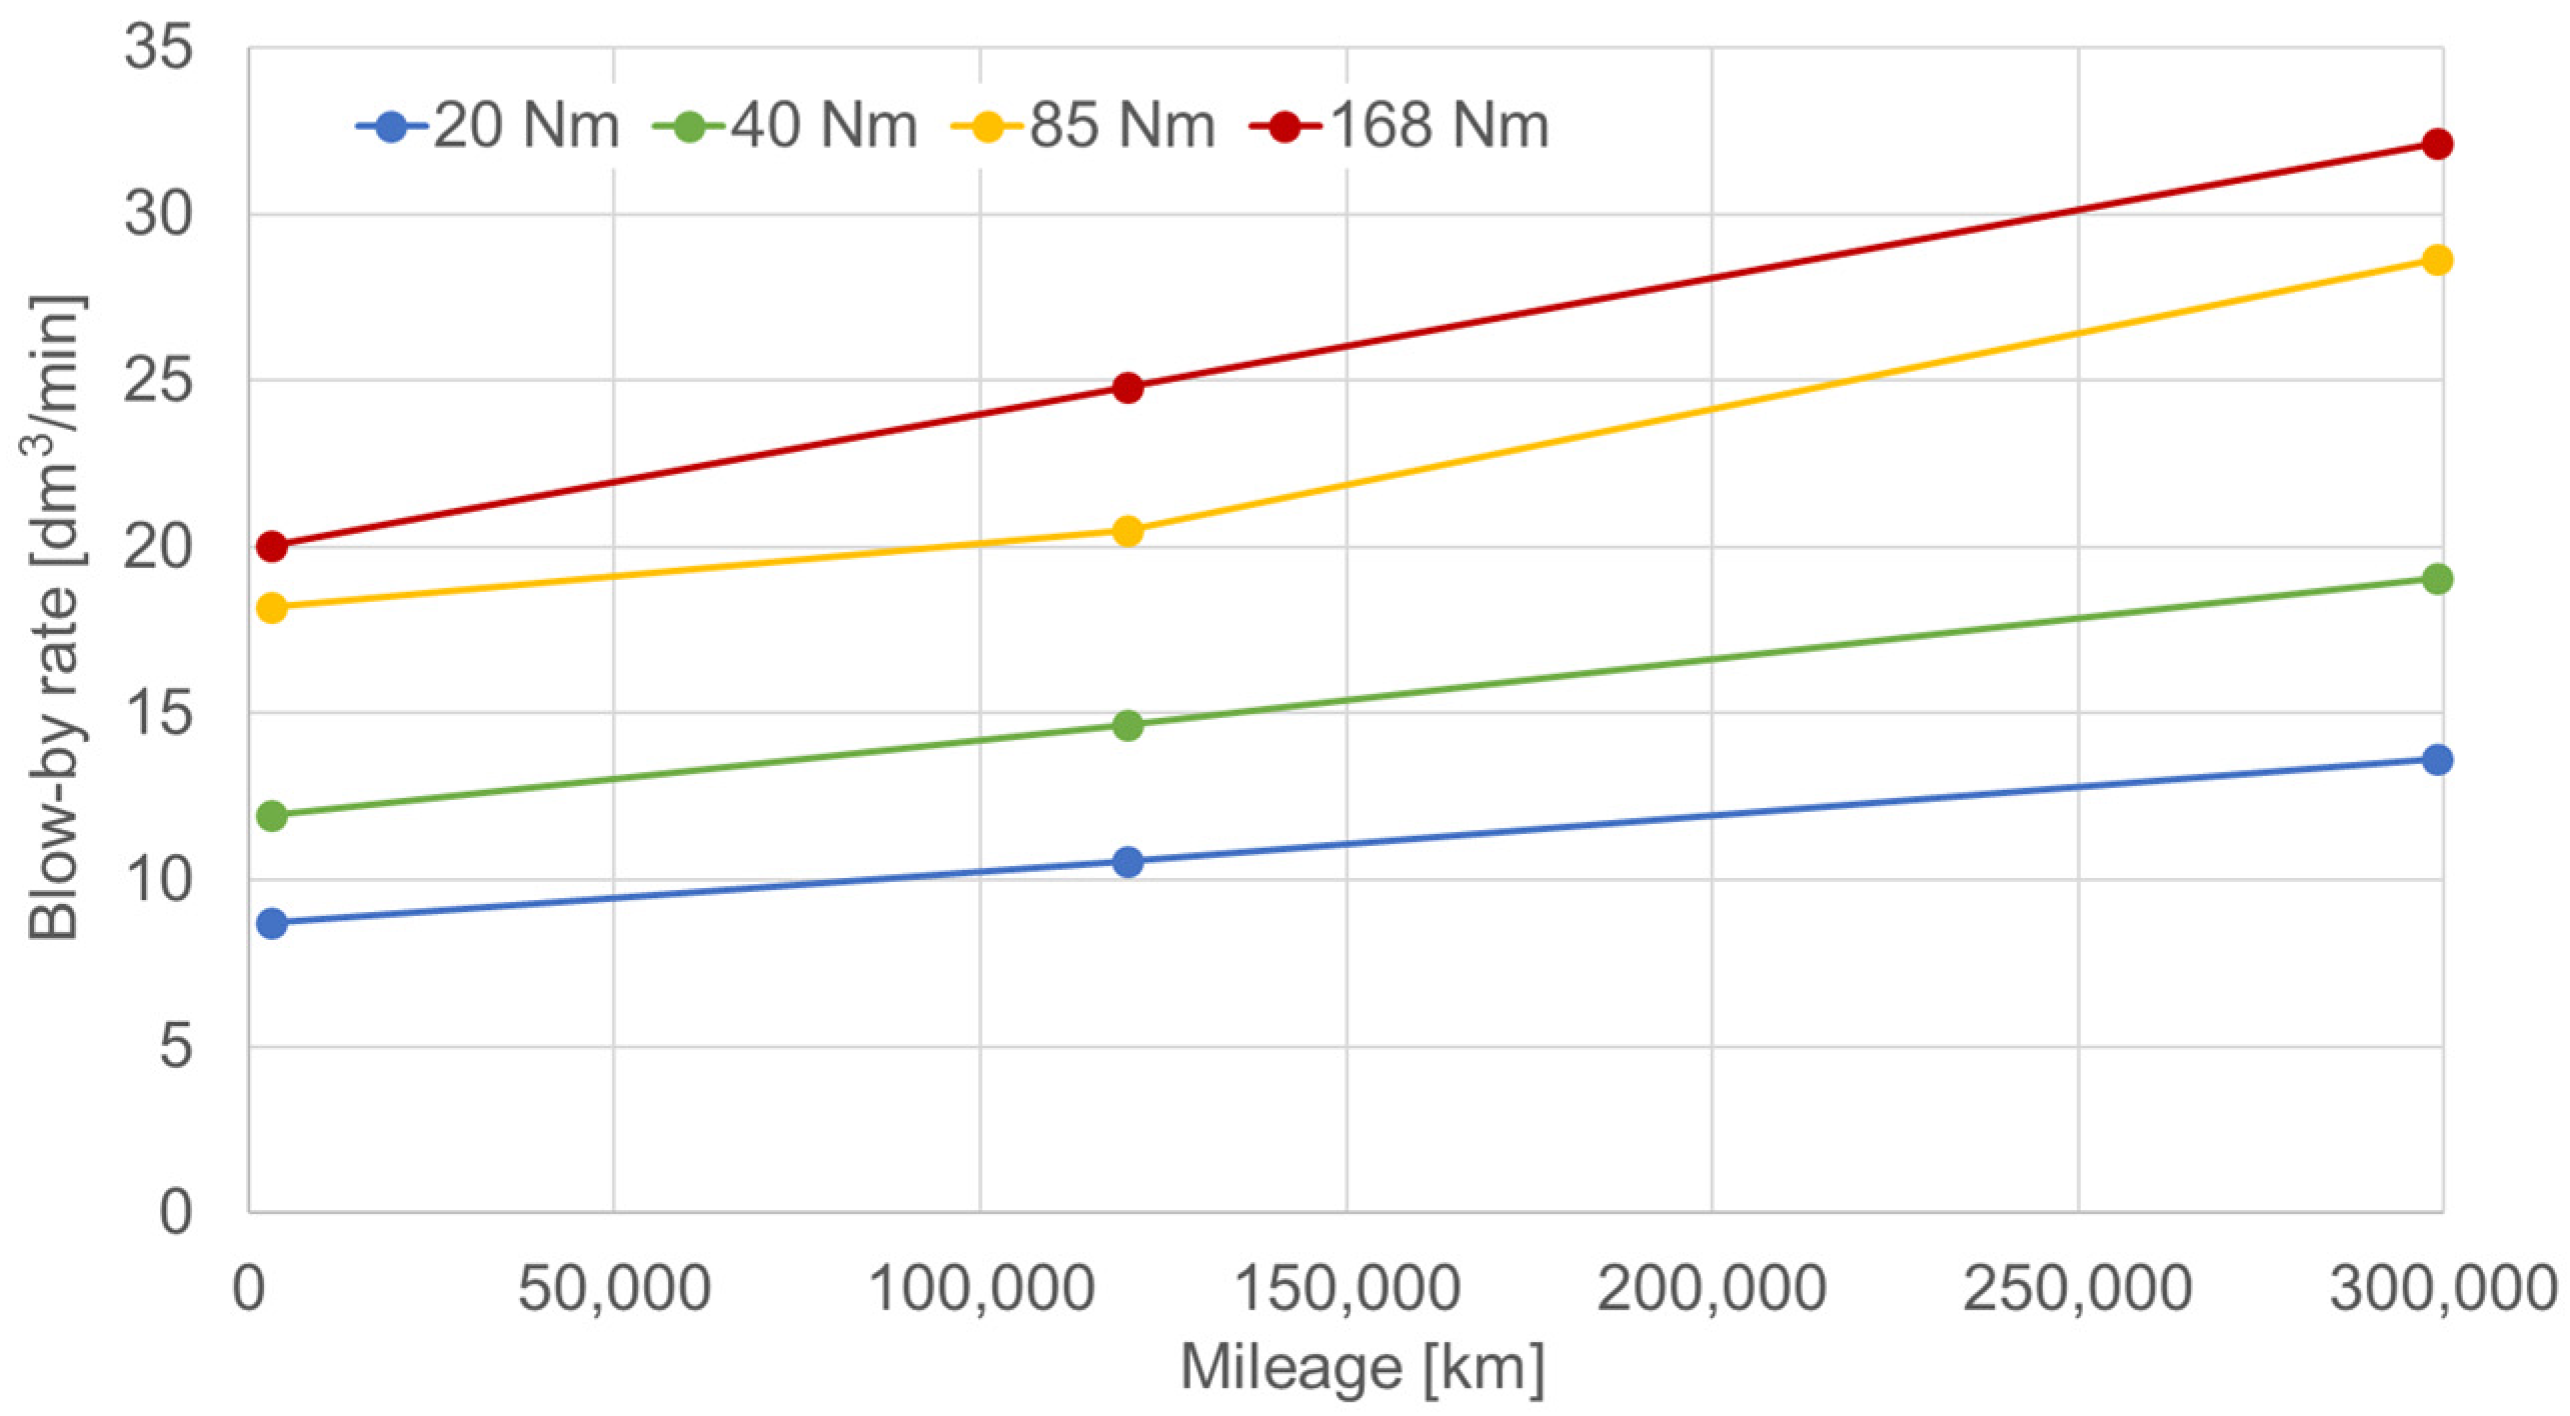
Taking into account the wear presented in Figure 4 and Figure 5, simulations were carried out for medium (120,000 km) and high (300,000 km) wear of the ring pack components. The impact of wear on the blow-by rate is shown in Figure 7.
Blow-by rates increase almost linearly with the increase in wear, and these increases are practically independent of the load—at a mileage of 300,000 km, they are from 56% to 60% higher than at a mileage of 3000 km. Such regular changes suggest that there are no significant qualitative changes in the operation of the ring pack caused by wear in the analyzed wear range. In order to confirm this, changes in instantaneous values of quantities determining the performance of the ring pack, such as pressures in the inter- and behind-ring spaces and flow rates through the channels connecting them, forces acting on the rings, and their positions in the grooves were analyzed. Exemplary results of such comparisons are presented in the next section.

3.3. Instantaneous Values of Parameters Associated with the Work of the Ring Pack

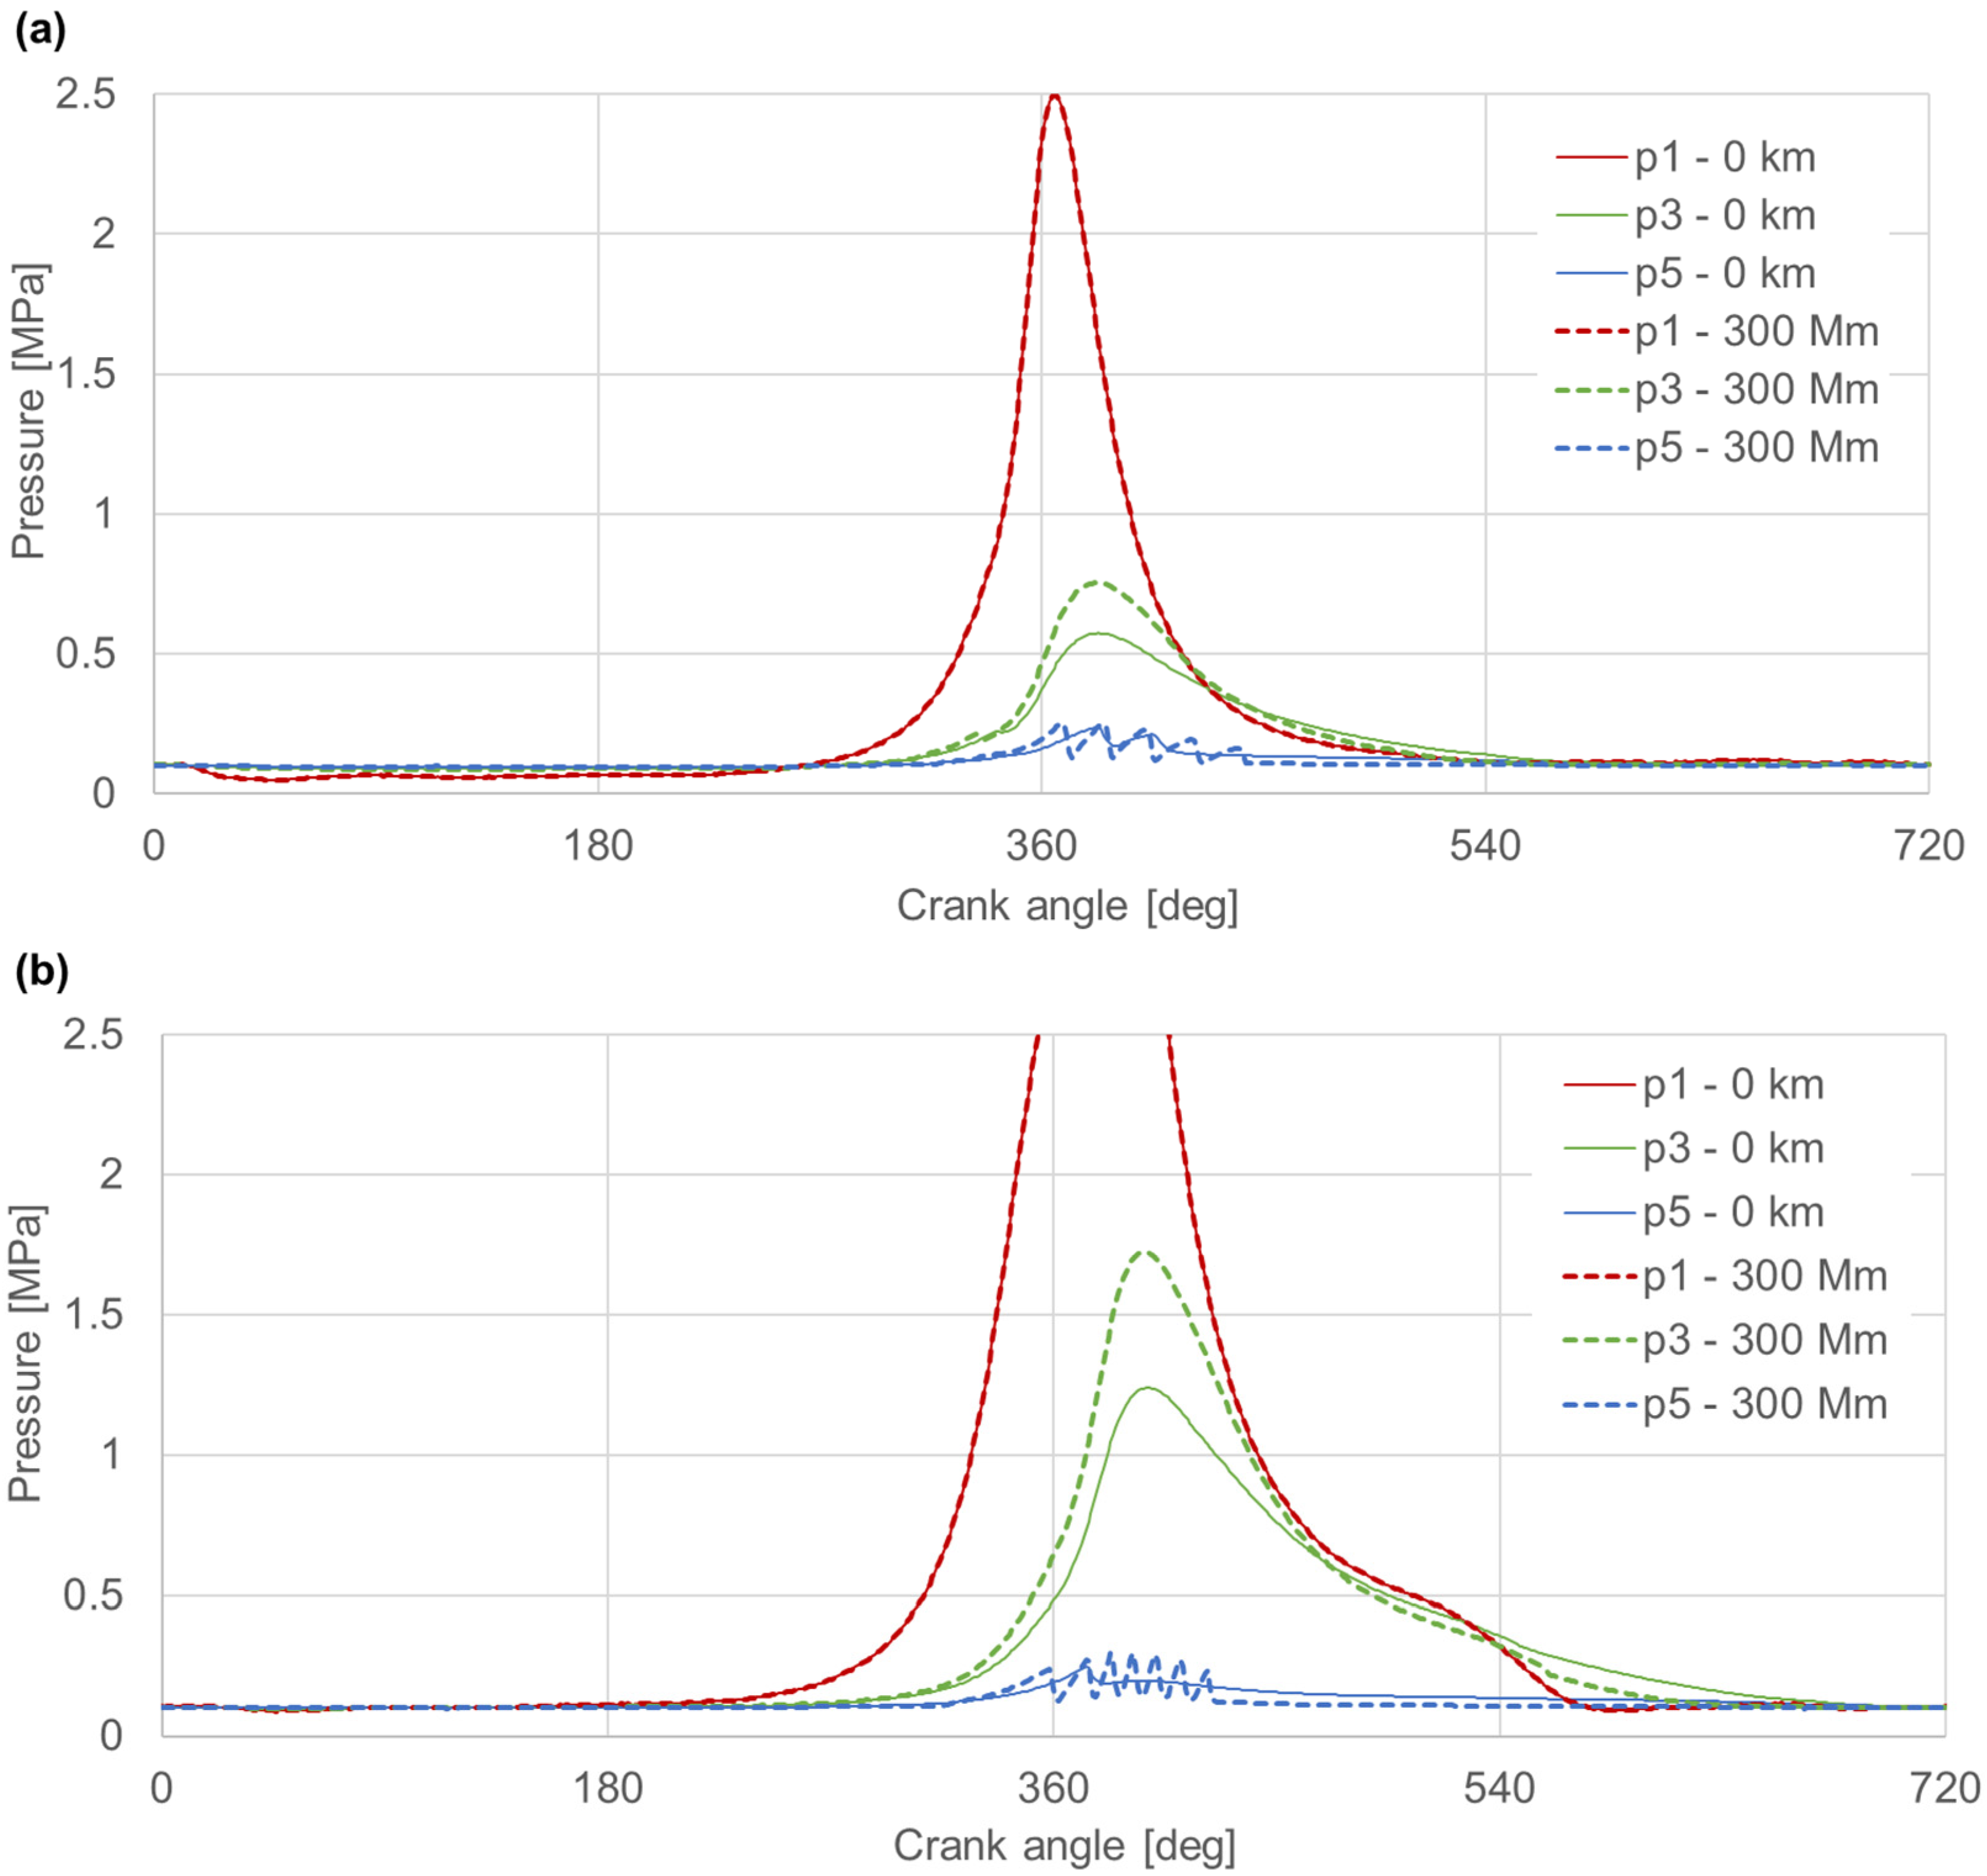
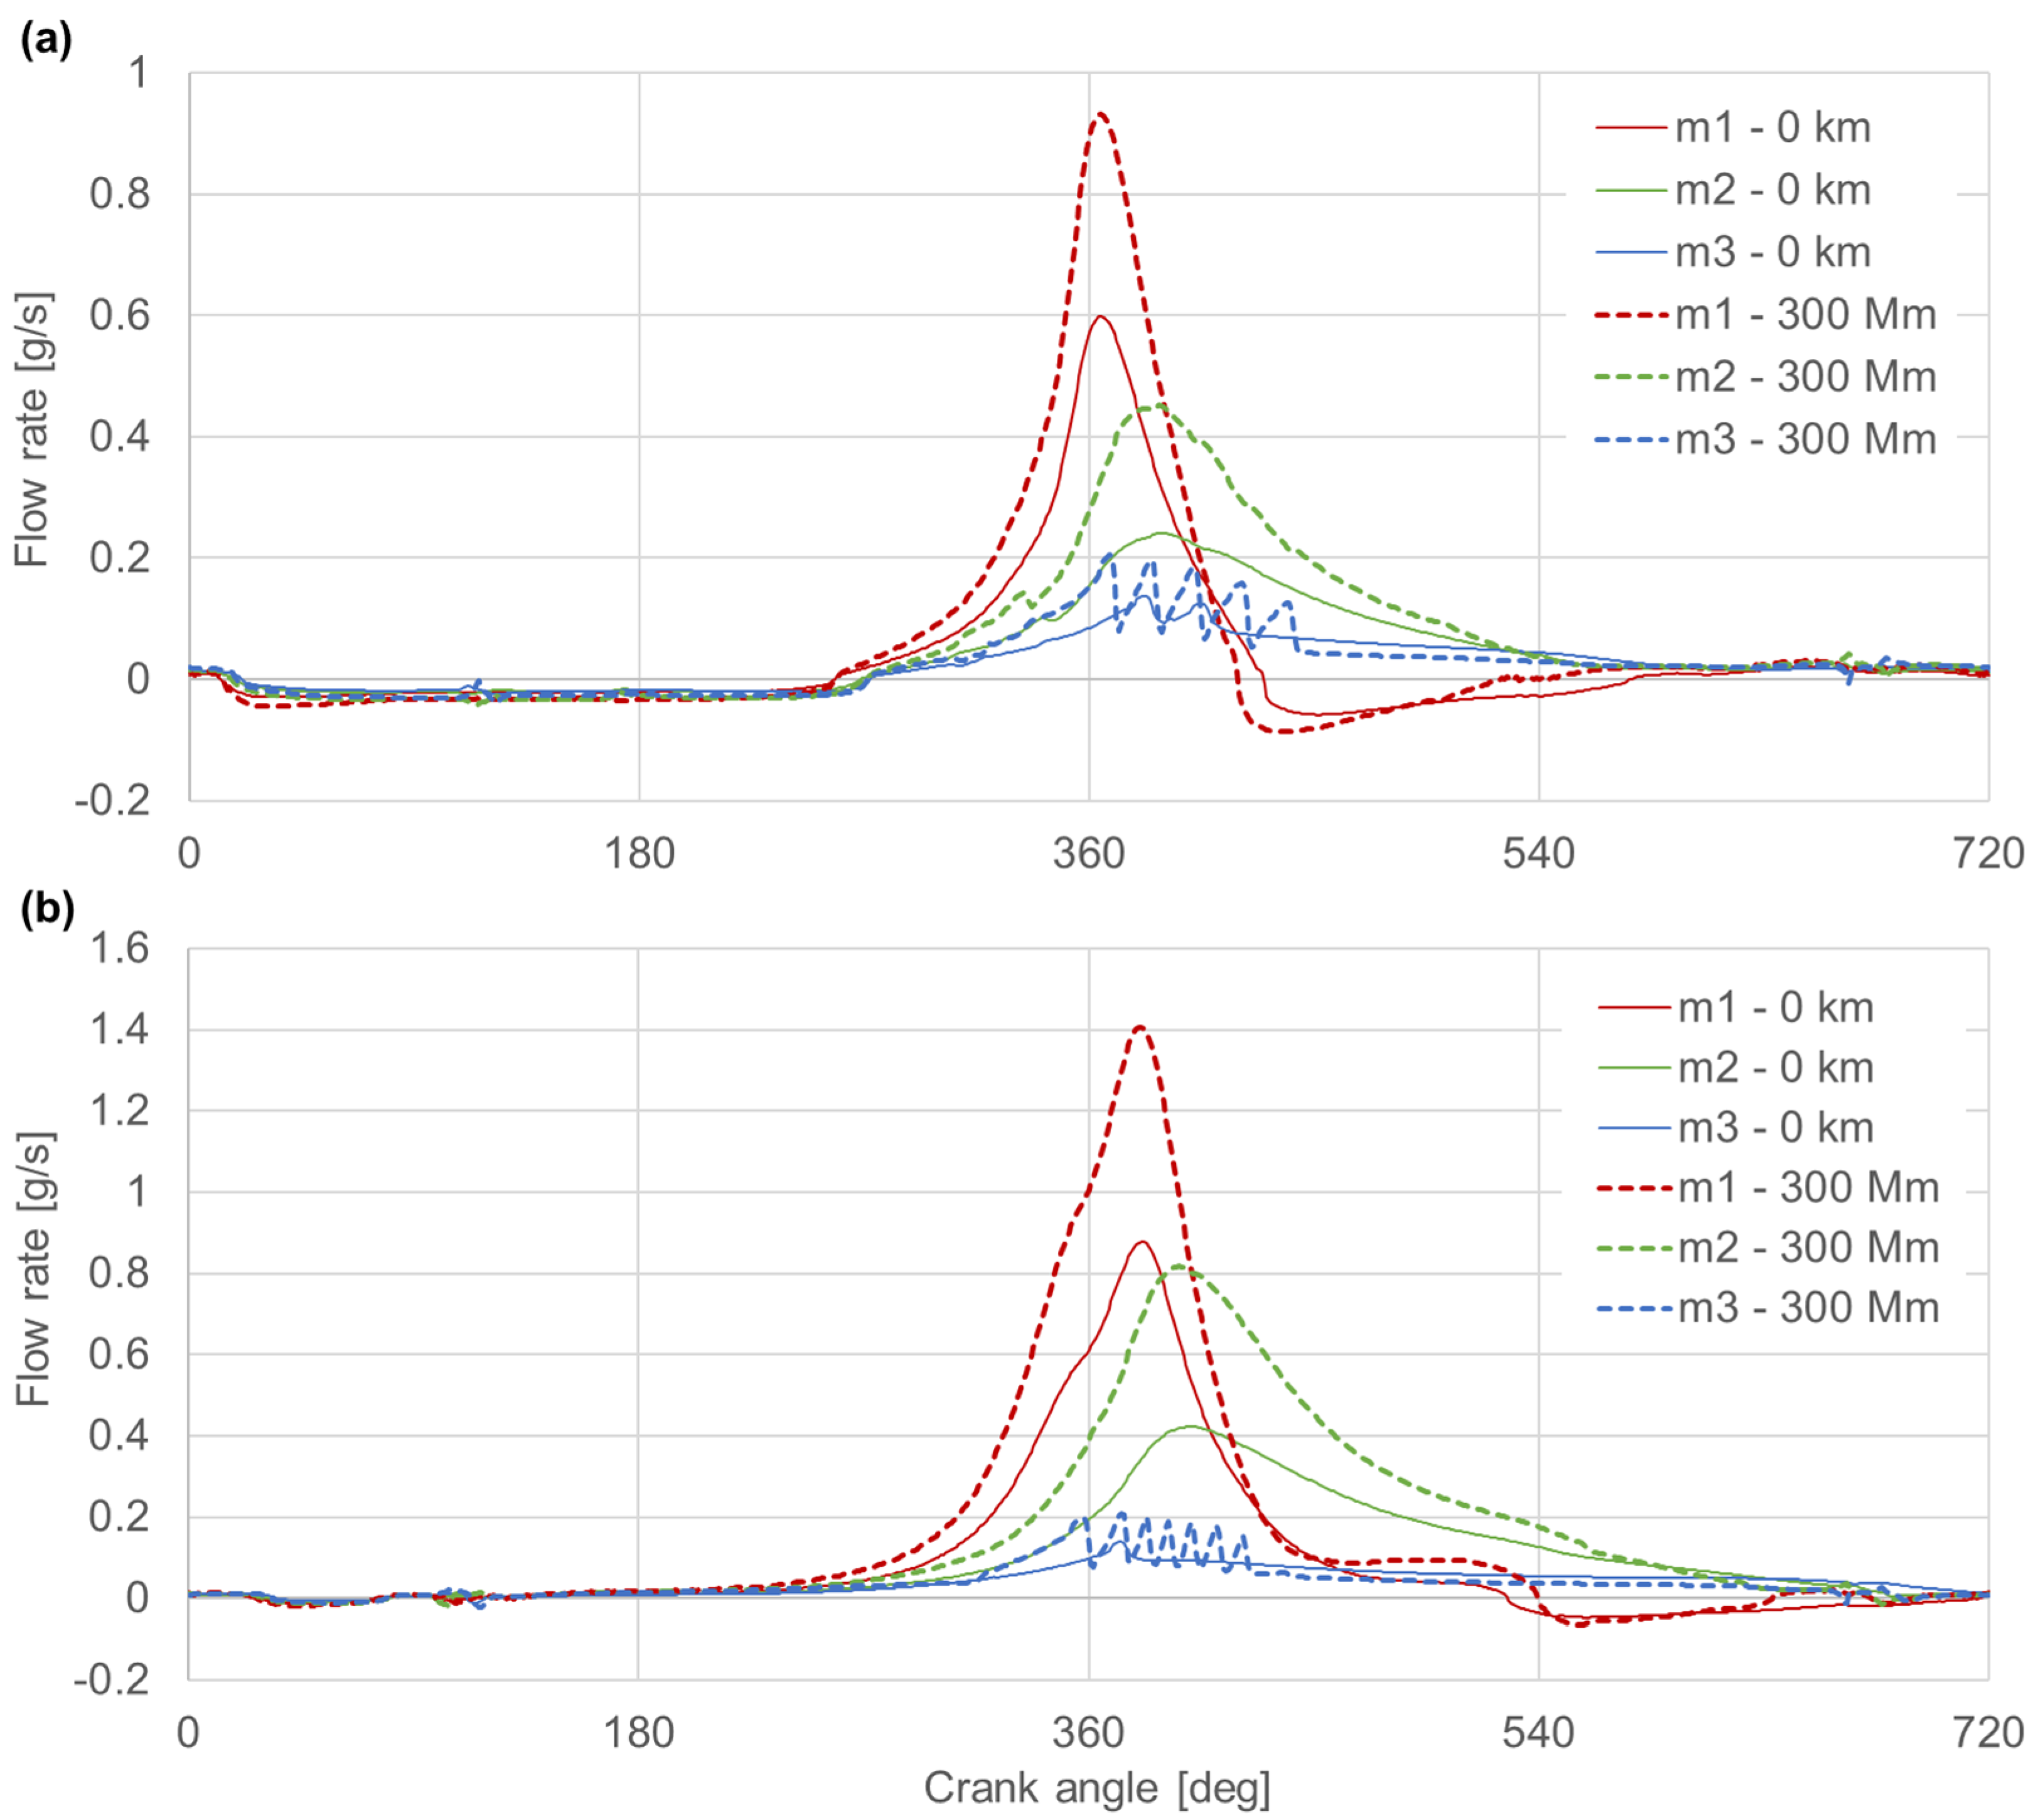
Figure 8, Figure 9, Figure 10 and Figure 11 show the pressure in the inter-ring spaces, the flow rate through the ring end gaps, the axial position of the rings in the grooves, and the friction force of the rings against the cylinder as a function of the crankshaft angle for an unworn and worn engine after a mileage of 300,000 km at the smallest and biggest tested loads.
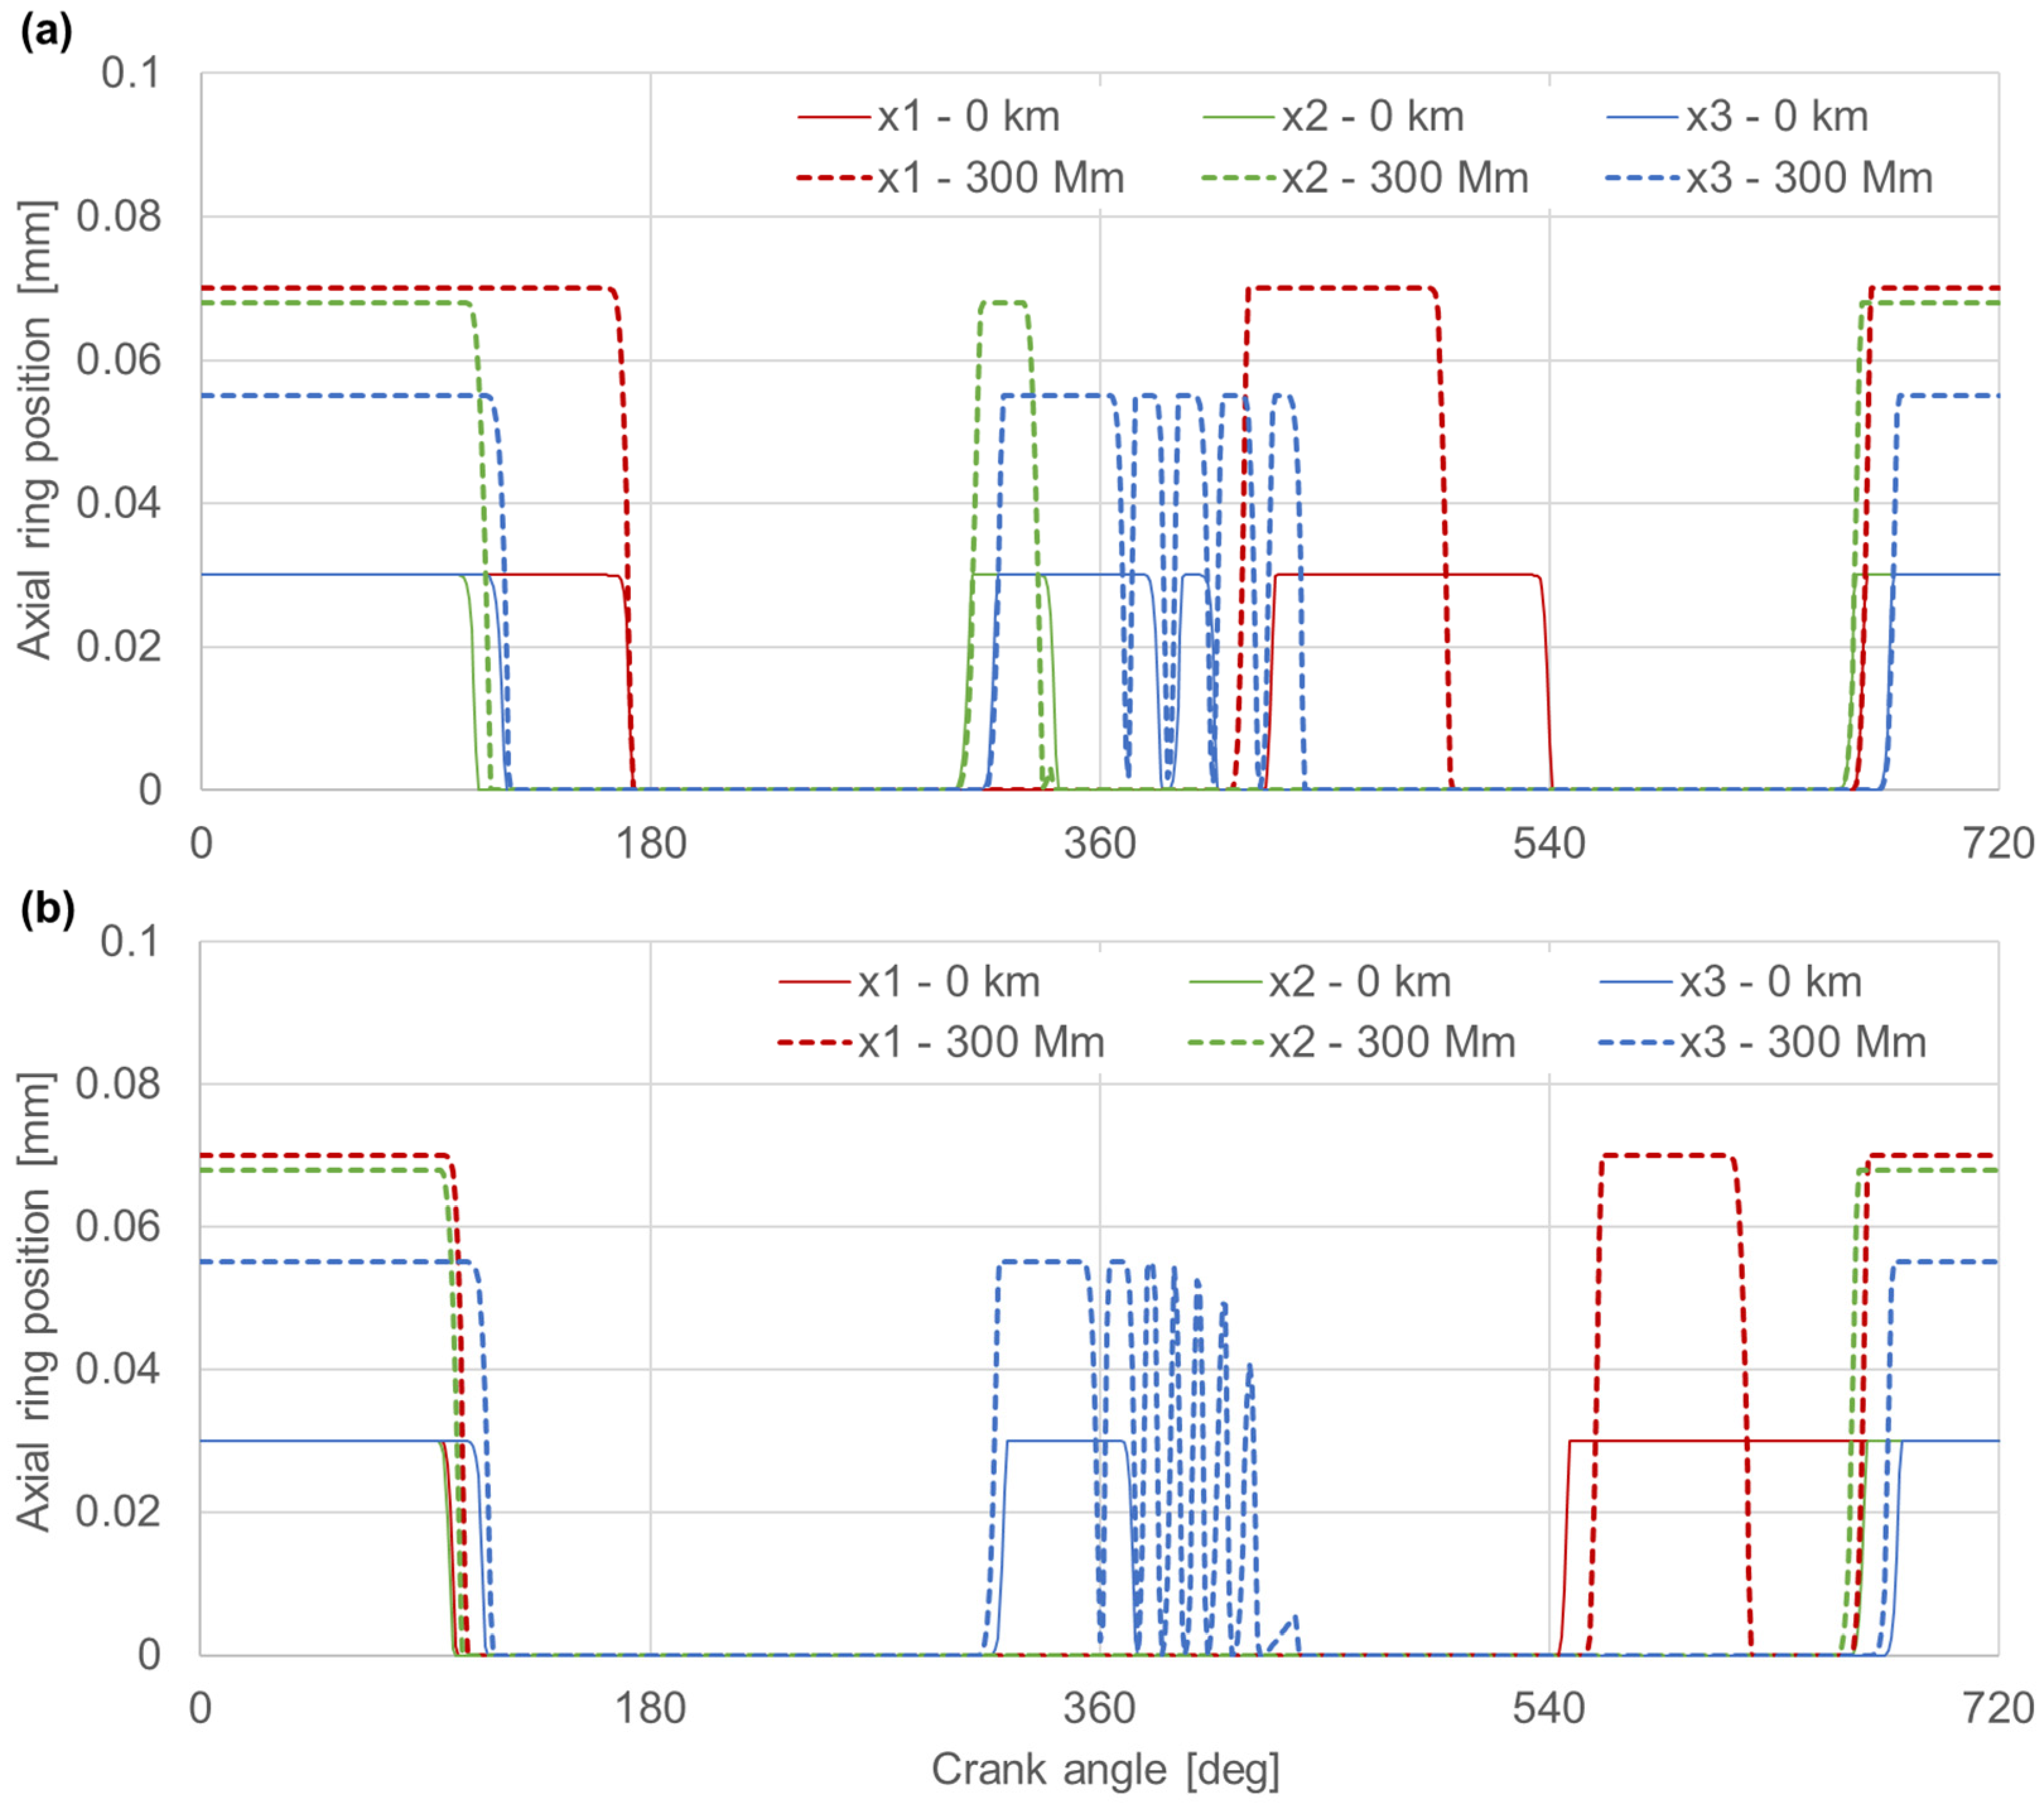
Both the maximum pressures in the inter-ring space p3 (Figure 8) and the flow rates in the end gaps of the compression rings (Figure 9) are higher for the worn engine, which is in line with expectations and results from the increased clearances in the ring pack. However, the shapes of the curves are similar. Additionally, the axial displacements of the rings are similar for the unworn and worn engine. The qualitative difference between the unworn and worn engine occurred at the highest analyzed engine load of 168 Nm. The difference consisted of the additional displacement of the top ring in the middle of the exhaust stroke in the worn engine (Figure 10b). In the unworn engine, the top ring moves axially in the groove only once, and in the worn engine twice during one engine cycle. This additional movement of the ring from the top to the bottom of the groove is caused by the equalization of the pressures above and below the ring and the drop of the resultant pressure force almost to zero. Since the inertia force is very small at this point, the ring moves downwards due to the friction force. The return movement is due to the inertial force, which increases as the ring approaches TDC.
Significant differences between the worn and unworn engine occurred in the axial displacements of the oil ring in the first half of the working stroke (Figure 10). In a worn engine, the oil ring moves in the groove many times, which does not occur in an unworn engine. These additional displacements cause pressure fluctuations above this ring p5 (Figure 8) and abrupt changes in the flow rate through the end gap of this ring m3 (Figure 9). It should be emphasized, however, that the effect of the oil ring on the sealing effect of the ring pack is very small and these additional displacements practically do not affect the blow-by rate and the energy losses associated with the blow-by.
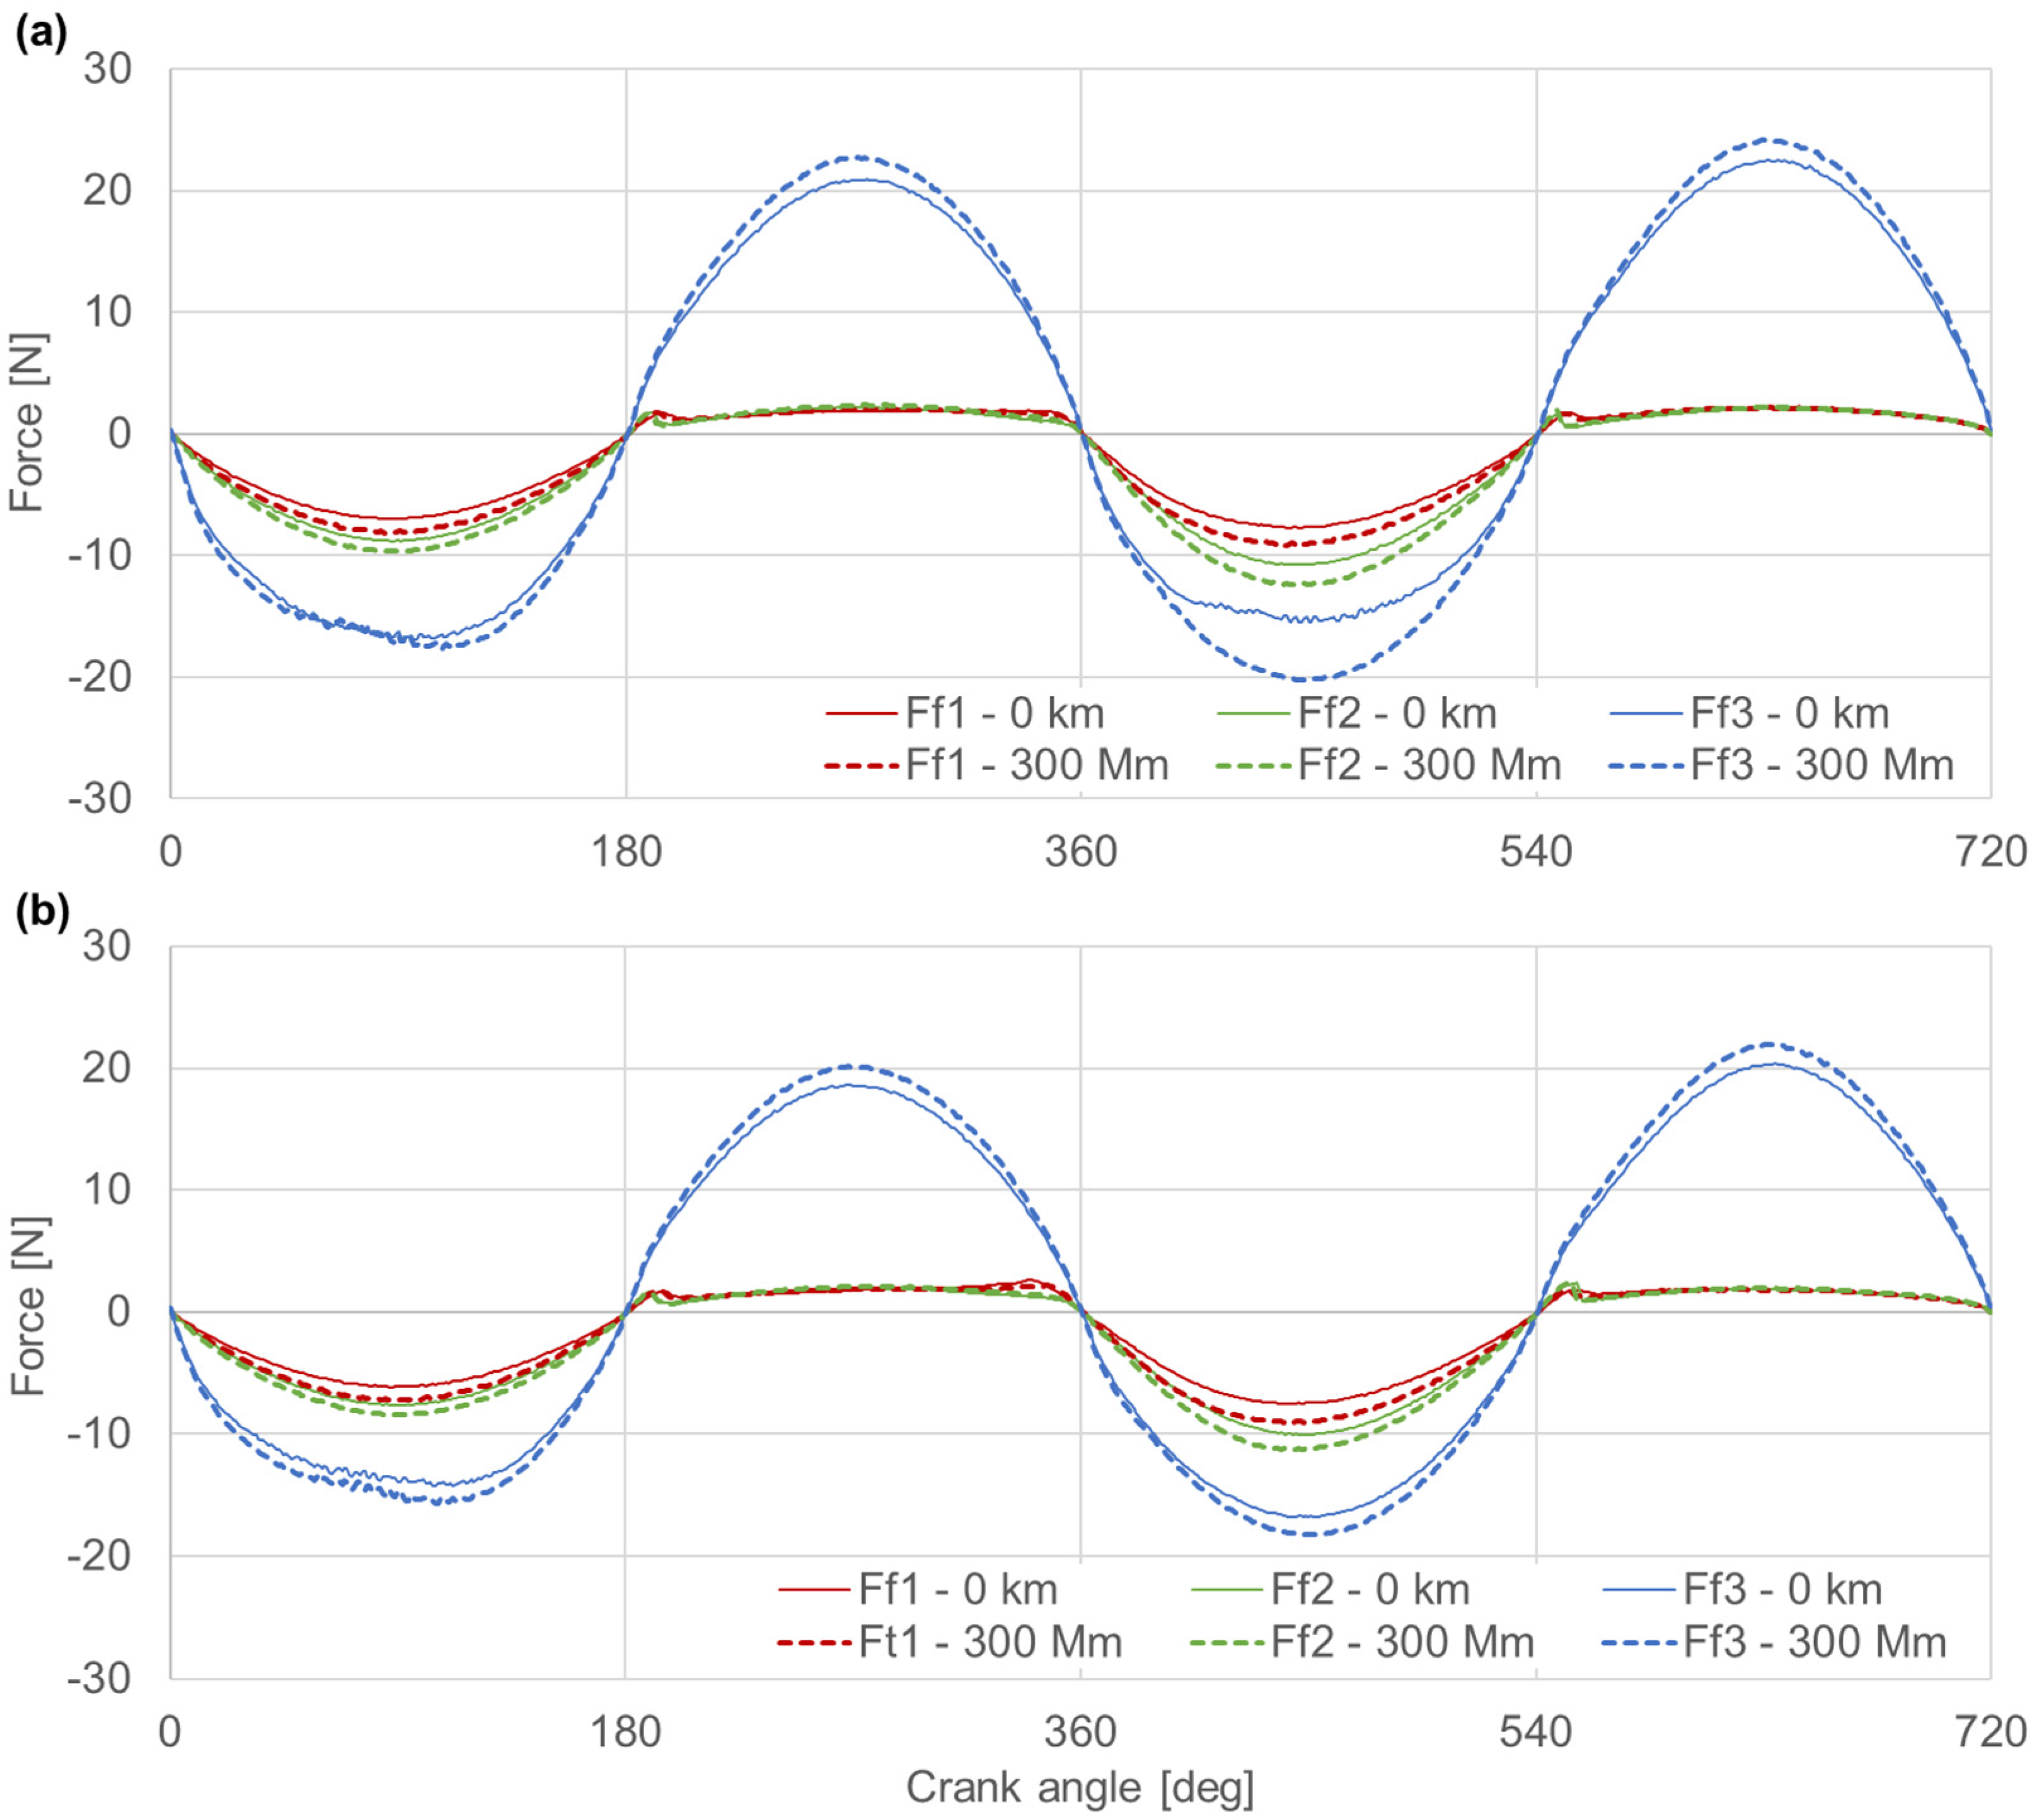
The viscous friction forces acting on individual rings for a worn and unworn engine are shown in Figure 11. It should be noted that the friction force of the oil ring is much bigger than the friction forces of the compression rings. That is because, among others, the oil ring consists of two rails, which in fact are two rings. The frictional forces of the rings are slightly greater for a worn engine than for an unworn one. Quantitatively, this will be discussed in detail in the next section.

3.4. Effect of Wear on Energy Losses

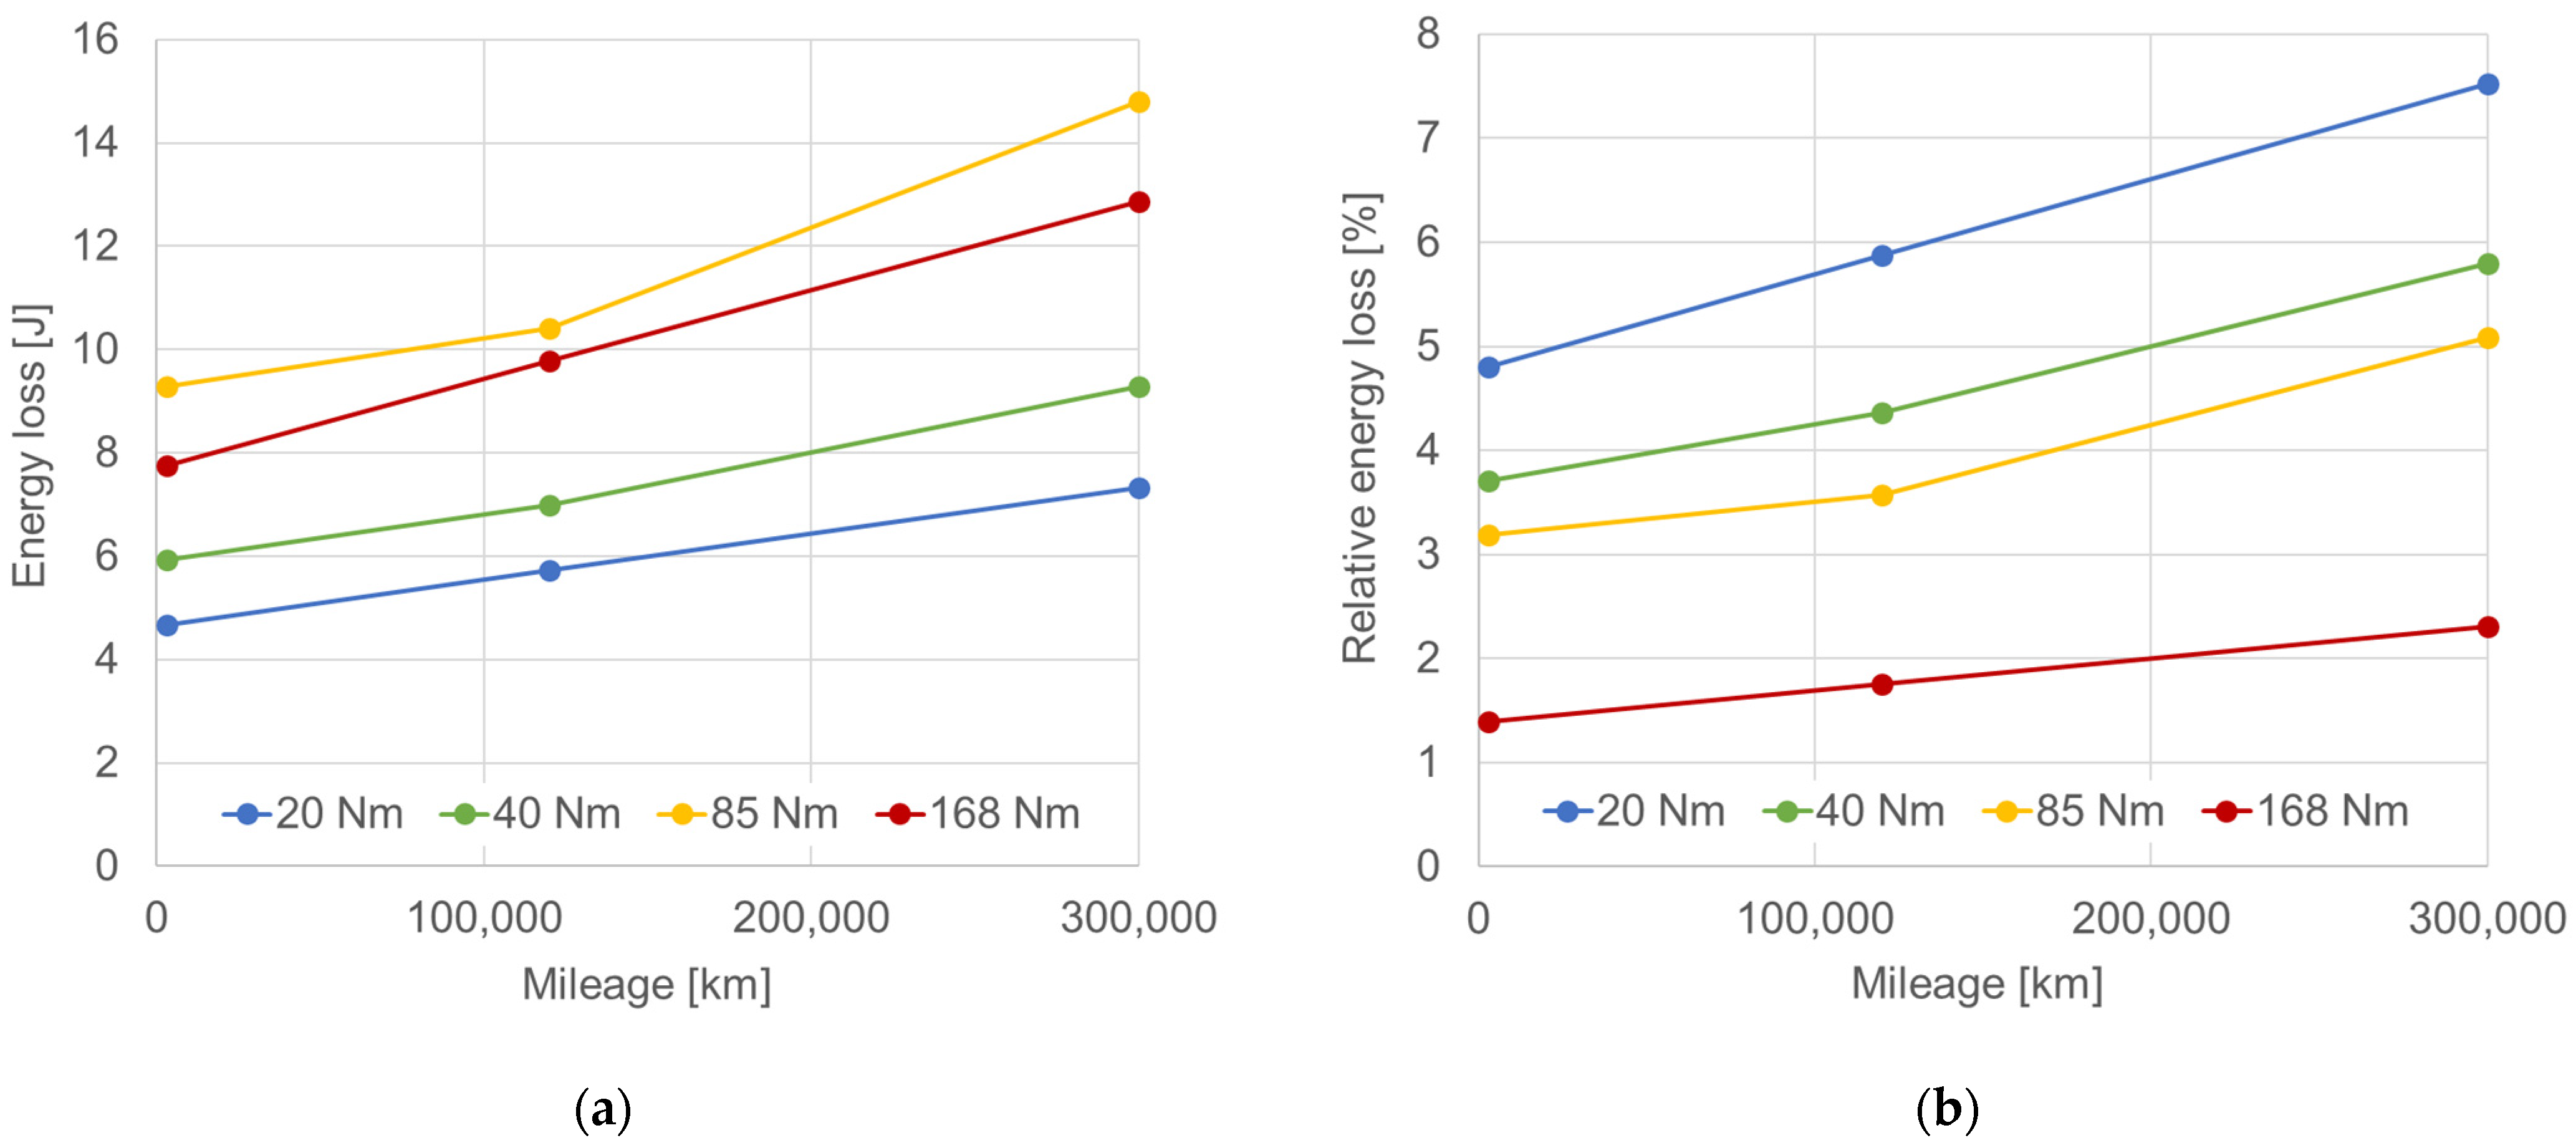
Absolute values of energy losses due to blow-by during one engine cycle for all analyzed loads and engine wear are presented in Figure 12a. In the range of small and medium loads, these losses increase with increasing engine load. However, at a very high load (168 Nm), the losses are smaller than at a medium load (85 Nm), even though the blow-by rate at 168 Nm is larger than at 85 Nm. This is because most gas flows from the combustion chamber to the inter-ring spaces at slightly different angles of the crankshaft. As a consequence, the work of volume change pdV, which depends on the instantaneous flow rate during the cycle, is smaller for 168 Nm despite the higher total flow.
Energy losses caused by blow-by increase almost linearly with wear and these increases for all engine loads are quite similar and range from 56% at 40 Nm to 66% at 168 Nm (Figure 12a). Therefore, these increases are close to the previously discussed increases in blow-by (56–60%).
The shares of energy losses due to blow-by in indicated work, which is fairly proportional to the torque, strongly depend on the engine load (Figure 12b). For an unworn engine, these shares range from 1.4% at a very high load to 4.8% at a very low load. What is more, these shares increase significantly with wear and for the engine of 300,000 km, they range from 2.3% to 7.5%, respectively. Thus, the lower the load, the greater the share of blow-by related losses and the faster the increase in this share due to engine wear.
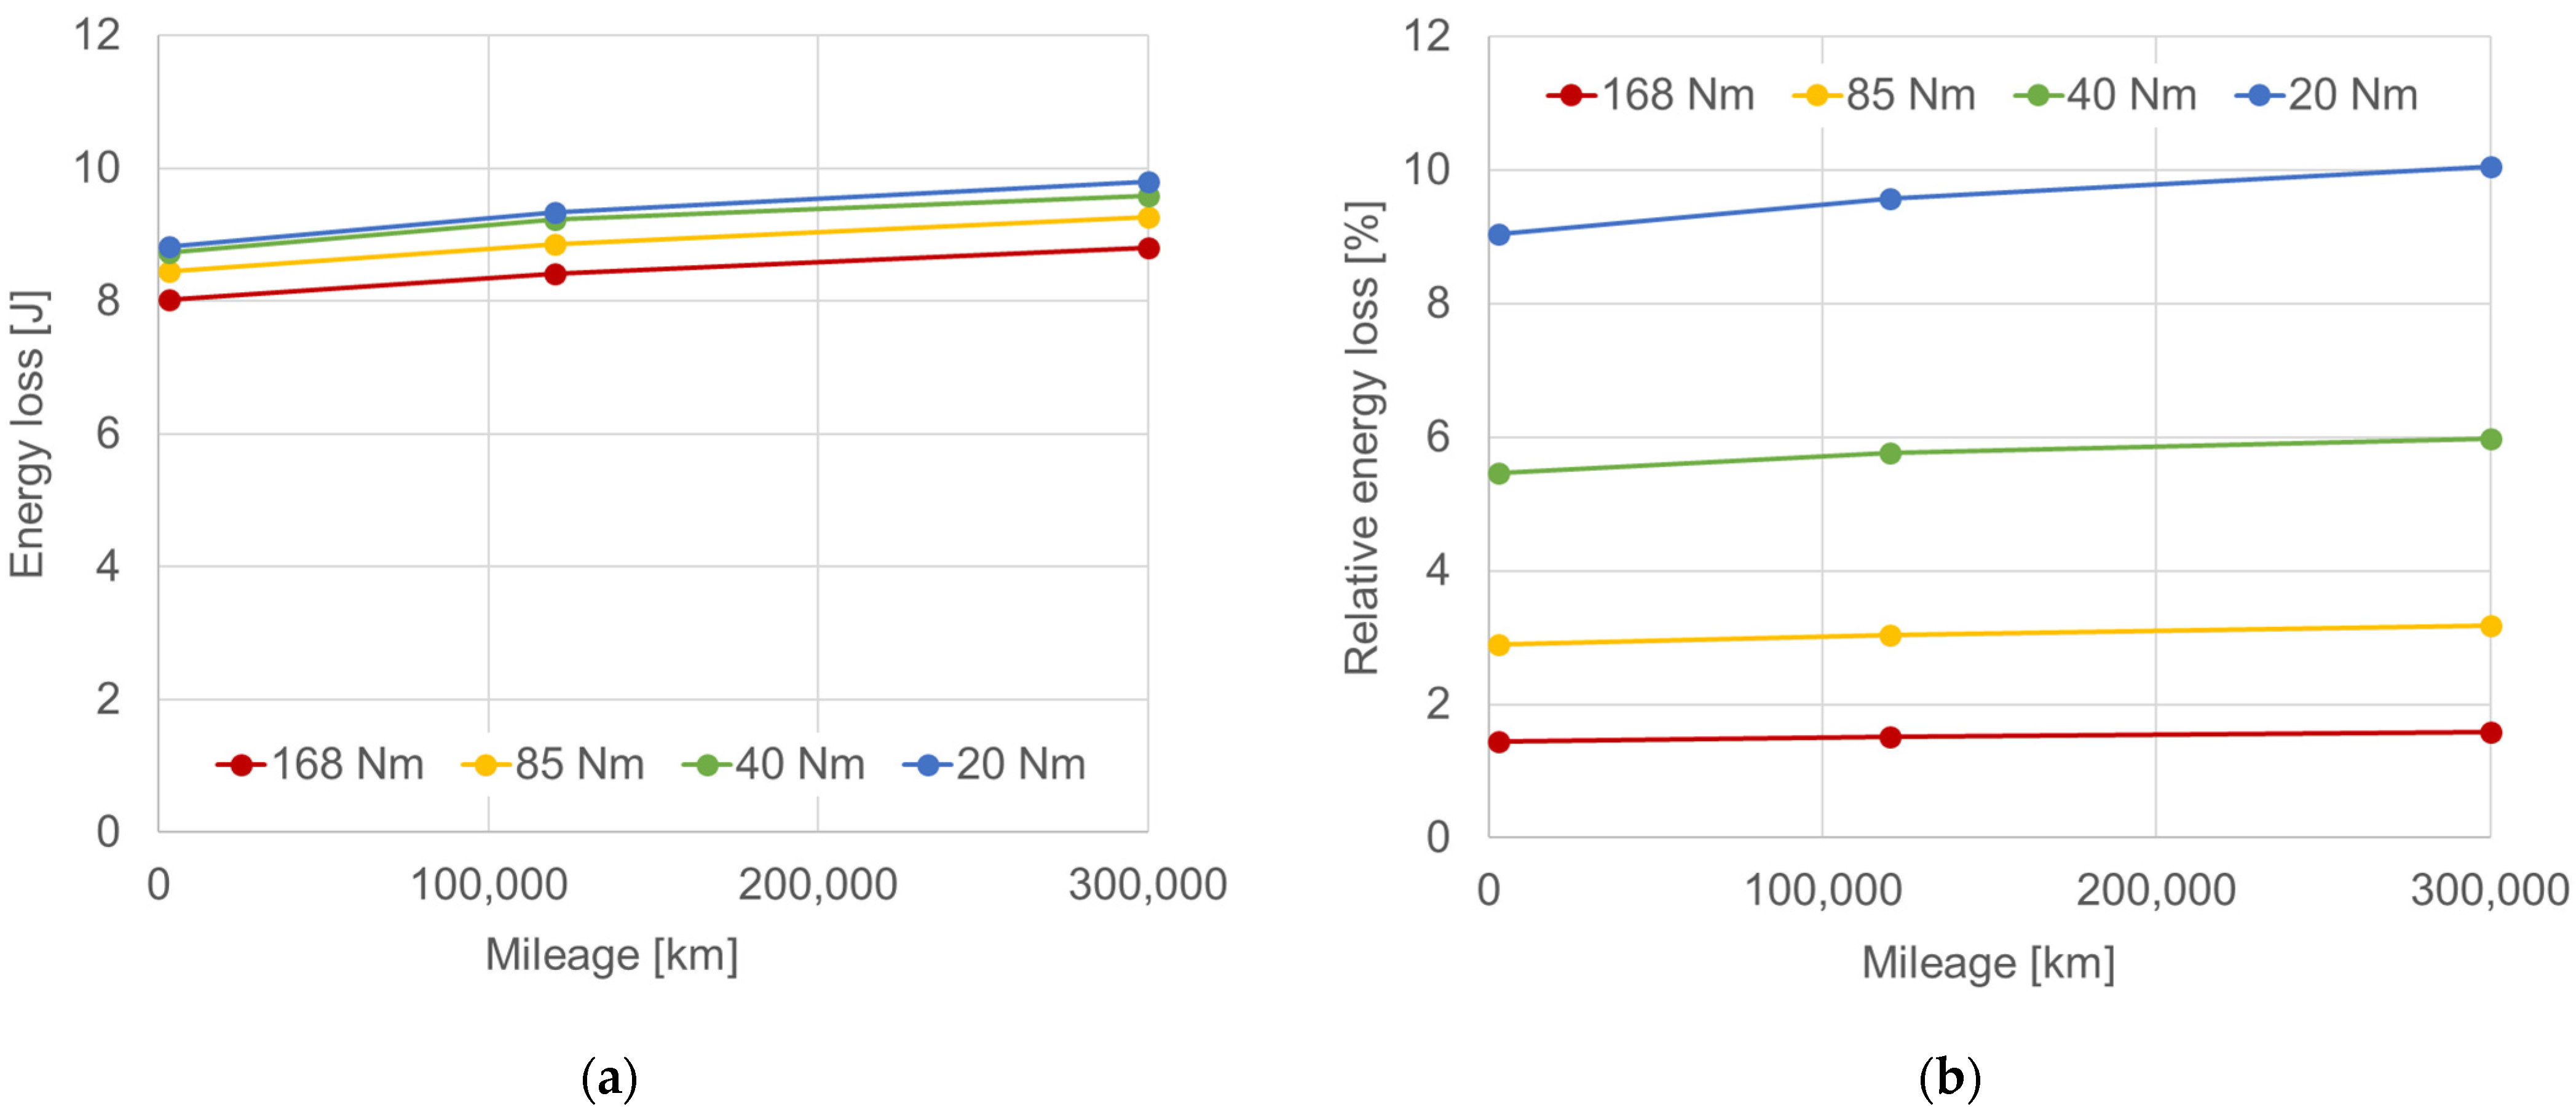
Energy losses caused by the friction of the rings against the cylinder were calculated on the basis of the simulated friction forces of particular rings (Figure 11). Figure 13a shows the losses for the ring pack during one engine cycle for all analyzed loads and wear. These losses decrease as the engine load increases. At a very high load, they are approx. 10% smaller than at a very low load. This is due to the higher temperature of the cylinder liner, and thus the lower viscosity of the oil, at higher loads. The share of energy lost due to ring friction in the indicated work strongly depends on the engine load and ranges from 1.5% at a very high load to 9% at a very low load (Figure 13b). These shares only slightly increase with engine wear—from 0.1% at a very high load to 1% at a very low load.
Assuming that changes in the analyzed losses do not affect the thermal efficiency of the engine, which is generally accepted considering that these changes are small compared to the fuel energy [48], the percentage changes in energy losses presented above will directly translate into percentage changes in fuel consumption. This means that wear of the ring pack components corresponding to 300,000 km of car mileage will result in an increase in fuel consumption from 1% at very high to almost 4% at very low load. Increased blow-by accounts for most of this increase, while the increase due to ring friction is much smaller. It should be noted that car engines operate in the low to medium load range most of the time. It should also be noted that the wear of engine components at a mileage of 300,000 km was predicted on the bases of wear measured after 120,000 km assuming its further linear progression.

4. Conclusions

The impact of wear of the piston–rings–cylinder system of a gasoline car engine on energy losses caused by blow-by and friction of the rings against the cylinder was evaluated in the presented work. A ring pack model consisting of integrated sub-models of gas flow, ring dynamics, and oil film was used for this evaluation. The main input data for the simulation, i.e., indicated pressures and wear, came from measurements. The wear was measured after a mileage of 120,000 km, whereas the wear for the mileage of 300,000 km was obtained by linear extrapolation of the wear at 120,000 km. Simulations were carried out for a constant engine speed of 2000 rpm and various loads. These conditions were selected taking into account typical engine operating conditions during normal car usage.
Relative, i.e., related to indicated work, energy losses resulting from blow-by in the unworn engine ranged from 1.4% at a very high load to 4.8% at a very low load. The shares of losses related to the friction of the rings ranged from 1.5% to 9%, respectively. In the engine after 300,000 km, blow-by losses ranged from 2.3% at a very high load to 7.5% at a very low load, while friction losses ranged from 1.6% to 10%, respectively.
Summarizing, the research shows that:
  • The energy losses due to blow-by are comparable to those due to friction of the rings, especially at low and medium engine loads;
  • Engine wear significantly affects the blow-by related energy losses, but has little effect on friction losses;
  • After a mileage of 300,000 km, the total share of both blow-by and friction losses in indicated work is higher than in the unworn engine from 1% at a high load to 4% at a low load. This will translate into the same increase in fuel consumption.
The scope of future work will include verification of the predicted wear at 300,000 km by measuring the actual one in the engine after such mileage, and verification of the model by comparing the simulated blow-by with the actual one measured in the engine of such high mileage.

Author Contributions

Conceptualization, G.K; methodology, G.K.; software, G.K.; validation, G.K.; formal analysis, G.K and P.K; investigation, G.K and P.K.; resources, G.K and P.K; data curation, G.K and P.K.; writing—original draft preparation, G.K.; writing—review and editing, G.K and P.K.; visualization, G.K.; supervision, G.K and P.K.; funding acquisition, P.K and G.K. All authors have read and agreed to the published version of the manuscript.

Funding

Research conducted by G.K. was partially financed in the framework of the project Lublin University of Technology – Regional Excellence Initiative, funded by the Polish Ministry of Science and Higher Education (contract no. 030/RID/2018/19).

Data Availability Statement

Not applicable.

Acknowledgments

The authors wish to thank AVL List GmbH for making the simulation software available within the framework of the AVL University Partnership Program.

Conflicts of Interest

The authors declare no conflict of interest.

References

  1. Kalghatgi, G. Is It the End of Combustion and Engine Combustion Research? Should It Be? Transp. Eng. 2022, 10, 100142. [Google Scholar] [CrossRef]
  2. Holmberg, K.; Erdemir, A. The Impact of Tribology on Energy Use and CO2 Emission Globally and in Combustion Engine and Electric Cars. Tribol. Int. 2019, 135, 389–396. [Google Scholar] [CrossRef]
  3. Usman, A.; Park, C.W. Optimizing the Tribological Performance of Textured Piston Ring–Liner Contact for Reduced Frictional Losses in SI Engine: Warm Operating Conditions. Tribol. Int. 2016, 99, 224–236. [Google Scholar] [CrossRef]
  4. Orozco Lozano, W.; Fonseca-Vigoya, M.D.S.; Pabón-León, J. Study of the Kinematics and Dynamics of the Ring Pack of a Diesel Engine by Means of the Construction of CFD Model in Conjunction with Mathematical Models. Lubricants 2021, 9, 116. [Google Scholar] [CrossRef]
  5. Chong, W.W.F.; Ng, J.-H.; Rajoo, S.; Chong, C.T. Passenger Transportation Sector Gasoline Consumption Due to Friction in Southeast Asian Countries. Energy Convers. Manag. 2018, 158, 346–358. [Google Scholar] [CrossRef]
  6. Buberger, J.; Kersten, A.; Kuder, M.; Eckerle, R.; Weyh, T.; Thiringer, T. Total CO2-Equivalent Life-Cycle Emissions from Commercially Available Passenger Cars. Renew. Sustain. Energy Rev. 2022, 159, 112158. [Google Scholar] [CrossRef]
  7. Leach, F. A Negative Emission Internal Combustion Engine Vehicle? Atmos. Environ. 2023, 294, 119488. [Google Scholar] [CrossRef]
  8. Mamala, J.; Śmieja, M.; Prażnowski, K. Analysis of the Total Unit Energy Consumption of a Car with a Hybrid Drive System in Real Operating Conditions. Energies 2021, 14, 3966. [Google Scholar] [CrossRef]
  9. Paul, S.; Debnath, D.; Doloi, S.; Mohanty, S. Fractal Mathematics Applications for Wear Image Analysis of Engines Using Biofuels. Mater. Today: Proc. 2022, 66, 3784–3789. [Google Scholar] [CrossRef]
  10. Liu, Z.; Guo, Z.; Rao, X.; Xu, Y.; Sheng, C.; Yuan, C. A Comprehensive Review on the Material Performance Affected by Gaseous Alternative Fuels in Internal Combustion Engines. Eng. Fail. Anal. 2022, 139, 106507. [Google Scholar] [CrossRef]
  11. García, C.P.; Orjuela Abril, S.; León, J.P. Analysis of Performance, Emissions, and Lubrication in a Spark-Ignition Engine Fueled with Hydrogen Gas Mixtures. Heliyon 2022, 8, e11353. [Google Scholar] [CrossRef] [PubMed]
  12. Gracz, W.; Marcinkowski, D.; Golimowski, W.; Szwajca, F.; Strzelczyk, M.; Wasilewski, J.; Krzaczek, P. Multifaceted Comparison Efficiency and Emission Characteristics of Multi-Fuel Power Generator Fueled by Different Fuels and Biofuels. Energies 2021, 14, 3388. [Google Scholar] [CrossRef]
  13. Kindrachuk, M.; Volchenko, D.; Balitskii, A.; Abramek, K.F.; Volchenko, M.; Balitskii, O.; Skrypnyk, V.; Zhuravlev, D.; Yurchuk, A.; Kolesnikov, V. Wear Resistance of Spark Ignition Engine Piston Rings in Hydrogen-Containing Environments. Energies 2021, 14, 4801. [Google Scholar] [CrossRef]
  14. Grube, T.; Kraus, S.; Reul, J.; Stolten, D. Passenger Car Cost Development through 2050. Transp. Res. Part D Transp. Environ. 2021, 101, 103110. [Google Scholar] [CrossRef]
  15. Rokicki, T.; Bórawski, P.; Bełdycka-Bórawska, A.; Żak, A.; Koszela, G. Development of Electromobility in European Union Countries under COVID-19 Conditions. Energies 2021, 15, 9. [Google Scholar] [CrossRef]
  16. Razmjoo, A.; Ghazanfari, A.; Jahangiri, M.; Franklin, E.; Denai, M.; Marzband, M.; Astiaso Garcia, D.; Maheri, A. A Comprehensive Study on the Expansion of Electric Vehicles in Europe. Appl. Sci. 2022, 12, 11656. [Google Scholar] [CrossRef]
  17. Morfeldt, J.; Davidsson Kurland, S.; Johansson, D.J.A. Carbon Footprint Impacts of Banning Cars with Internal Combustion Engines. Transp. Res. Part D Transp. Environ. 2021, 95, 102807. [Google Scholar] [CrossRef]
  18. Kapsiz, M.; Durat, M.; Ficici, F. Friction and Wear Studies between Cylinder Liner and Piston Ring Pair Using Taguchi Design Method. Adv. Eng. Softw. 2011, 42, 595–603. [Google Scholar] [CrossRef]
  19. Xun, D.; Sun, X.; Liu, Z.; Zhao, F.; Hao, H. Comparing Supply Chains of Platinum Group Metal Catalysts in Internal Combustion Engine and Fuel Cell Vehicles: A Supply Risk Perspective. Clean. Logist. Supply Chain. 2022, 4, 100043. [Google Scholar] [CrossRef]
  20. Lieven, T.; Hügler, B. Did Electric Vehicle Sales Skyrocket Due to Increased Environmental Awareness While Total Vehicle Sales Declined during COVID-19? Sustainability 2021, 13, 13839. [Google Scholar] [CrossRef]
  21. Frieske, B.; Stieler, S. The “Semiconductor Crisis” as a Result of the COVID-19 Pandemic and Impacts on the Automotive Industry and Its Supply Chains. WEVJ 2022, 13, 189. [Google Scholar] [CrossRef]
  22. Hagman, J.; Stier, J.J. Selling Electric Vehicles: Experiences from Vehicle Salespeople in Sweden. Res. Transp. Bus. Manag. 2022, 45, 100882. [Google Scholar] [CrossRef]
  23. Manley, R.L.; Alonso, E.; Nassar, N.T. Examining Industry Vulnerability: A Focus on Mineral Commodities Used in the Automotive and Electronics Industries. Resour. Policy 2022, 78, 102894. [Google Scholar] [CrossRef]
  24. Severson, M.H.; Nguyen, R.T.; Ormerod, J.; Williams, S. An Integrated Supply Chain Analysis for Cobalt and Rare Earth Elements under Global Electrification and Constrained Resources. Resour. Conserv. Recycl. 2023, 189, 106761. [Google Scholar] [CrossRef]
  25. Teske, S.; Bratzel, S.; Tellermann, R.; Stephan, B.; Vargas, M. Net Zero: The Remaining Global Market Volume for Internal Combustion Engines in Light-Duty Vehicles under a 1.5 °C Carbon Budget Trajectory. Energies 2022, 15, 8037. [Google Scholar] [CrossRef]
  26. Ayetor, G.K.; Mbonigaba, I.; Sackey, M.N.; Andoh, P.Y. Vehicle Regulations in Africa: Impact on Used Vehicle Import and New Vehicle Sales. Transp. Res. Interdiscip. Perspect. 2021, 10, 100384. [Google Scholar] [CrossRef]
  27. Abo-Khalil, A.G.; Abdelkareem, M.A.; Sayed, E.T.; Maghrabie, H.M.; Radwan, A.; Rezk, H.; Olabi, A.G. Electric Vehicle Impact on Energy Industry, Policy, Technical Barriers, and Power Systems. Int. J. Thermofluids 2022, 13, 100134. [Google Scholar] [CrossRef]
  28. Holmberg, K.; Andersson, P.; Erdemir, A. Global Energy Consumption Due to Friction in Passenger Cars. Tribol. Int. 2012, 47, 221–234. [Google Scholar] [CrossRef]
  29. Ma, W.; Biboulet, N.; Lubrecht, A.A. Performance Evolution of a Worn Piston Ring. Tribol. Int. 2018, 126, 317–323. [Google Scholar] [CrossRef]
  30. Pabón León, J.A.; Rojas Suárez, J.P.; Orjuela Abril, M.S. Numerical Study of the Physical Processes of Gas Leakage in the Compression Ring in Diesel Engines. J. Phys. Conf. Ser. 2021, 2118, 012016. [Google Scholar] [CrossRef]
  31. Gao, L.; Cui, Y.; Xu, Z.; Fu, Y.; Liu, S.; Li, Y.; Hou, X. A Fully Coupled Tribo-Dynamic Model for Piston-Ring-Liner System. Tribol. Int. 2023, 178, 107998. [Google Scholar] [CrossRef]
  32. Baby, A.K.; Rajendrakumar, P.K.; Lawrence, K.D. Influence of Honing Angle on Tribological Behaviour of Cylinder Liner–Piston Ring Pair: Experimental Investigation. Tribol. Int. 2022, 167, 107355. [Google Scholar] [CrossRef]
  33. Kang, J.; Lu, Y.; Yang, X.; Zhao, X.; Zhang, Y.; Xing, Z. Modeling and Experimental Investigation of Wear and Roughness for Honed Cylinder Liner during Running-in Process. Tribol. Int. 2022, 171, 107531. [Google Scholar] [CrossRef]
  34. Chen, T.; Wang, L.; Xu, J.; Gao, T.; Qin, X.; Yang, X.; Cong, Q.; Jin, J.; Liu, C. Effect of Groove Texture on Deformation and Sealing Performance of Engine Piston Ring. Machines 2022, 10, 1020. [Google Scholar] [CrossRef]
  35. Grabon, W.; Pawlus, P.; Wos, S.; Koszela, W.; Wieczorowski, M. Effects of Honed Cylinder Liner Surface Texture on Tribological Properties of Piston Ring-Liner Assembly in Short Time Tests. Tribol. Int. 2017, 113, 137–148. [Google Scholar] [CrossRef]
  36. Zabala, B.; Igartua, A.; Fernández, X.; Priestner, C.; Ofner, H.; Knaus, O.; Abramczuk, M.; Tribotte, P.; Girot, F.; Roman, E.; et al. Friction and Wear of a Piston Ring/Cylinder Liner at the Top Dead Centre: Experimental Study and Modelling. Tribol. Int. 2017, 106, 23–33. [Google Scholar] [CrossRef]
  37. Wróblewski, P.; Rogólski, R. Experimental Analysis of the Influence of the Application of TiN, TiAlN, CrN and DLC1 Coatings on the Friction Losses in an Aviation Internal Combustion Engine Intended for the Propulsion of Ultralight Aircraft. Materials 2021, 14, 6839. [Google Scholar] [CrossRef] [PubMed]
  38. Tomanik, E.; Fujita, H.; Sato, S.; Paes, E.; Galvao, C.; Morais, P. Investigation of PVD Piston Ring Coatings With Different Lubricant Formulations. In Proceedings of the ICEF2017; Volume 2: Emissions Control Systems; Instrumentation, Controls, and Hybrids; Numerical Simulation; Engine Design and Mechanical Development, Seattle, WA, USA, 15 October 2017. [Google Scholar]
  39. Dubey, M.K.; Chaudhary, R.; Emmandi, R.; Seth, S.; Mahapatra, R.; Harinarain, A.K.; Ramakumar, S.S.V. Tribological Evaluation of Passenger Car Engine Oil: Effect of Friction Modifiers. Results Eng. 2022, 16, 100727. [Google Scholar] [CrossRef]
  40. Gamble, R.J.; Priest, M.; Taylor, C.M. Detailed Analysis of Oil Transport in the Piston Assembly of a Gasoline Engine. Tribol. Lett. 2003, 14, 147–156. [Google Scholar] [CrossRef]
  41. Kunt, M.A.; Calam, A.; Gunes, H. Analysis of the Effects of Lubricating Oil Viscosity and Engine Speed on Piston-Cylinder Liner Frictions in a Single Cylinder HCCI Engine by GT-SUITE Program. Proc. Inst. Mech. Eng. Part E: J. Process Mech. Eng. 2022, 09544089221132988. [Google Scholar] [CrossRef]
  42. Gołębiowski, W.; Zając, G.; Sarkan, B. Evaluation of the Impact of Tractor Field Works on Changes in Selected Elements of Engine Oils. Agric. Eng. 2022, 26, 1–12. [Google Scholar] [CrossRef]
  43. Lenauer, C.; Tomastik, C.; Wopelka, T.; Jech, M. Piston Ring Wear and Cylinder Liner Tribofilm in Tribotests with Lubricants Artificially Altered with Ethanol Combustion Products. Tribol. Int. 2015, 82, 415–422. [Google Scholar] [CrossRef]
  44. Fernandes, W.; Tomanik, E.; Moreira, H.; Cousseau, T.; Pintaude, G. Effect of Aged Oils on Ring-Liner Wear. SAE Int. J. Fuels Lubr. 2020, 13, 167–176. [Google Scholar] [CrossRef]
  45. Nikolakopoulos, P.; Mavroudis, S.; Zavos, A. Lubrication Performance of Engine Commercial Oils with Different Performance Levels: The Effect of Engine Synthetic Oil Aging on Piston Ring Tribology under Real Engine Conditions. Lubricants 2018, 6, 90. [Google Scholar] [CrossRef] [Green Version]
  46. Fang, C.; Meng, X.; Kong, X.; Zhao, B.; Huang, H. Transient Tribo-Dynamics Analysis and Friction Loss Evaluation of Piston during Cold- and Warm-Start of a SI Engine. Int. J. Mech. Sci. 2017, 133, 767–787. [Google Scholar] [CrossRef]
  47. Rahmani, R.; Rahnejat, H.; Fitzsimons, B.; Dowson, D. The Effect of Cylinder Liner Operating Temperature on Frictional Loss and Engine Emissions in Piston Ring Conjunction. Appl. Energy 2017, 191, 568–581. [Google Scholar] [CrossRef] [Green Version]
  48. Tomanik, E.; Profito, F.; Sheets, B.; Souza, R. Combined Lubricant–Surface System Approach for Potential Passenger Car CO2 Reduction on Piston-Ring-Cylinder Bore Assembly. Tribol. Int. 2020, 149, 105514. [Google Scholar] [CrossRef]
  49. Tormos, B.; Martín, J.; Pla, B.; Jiménez-Reyes, A.J. A Methodology to Estimate Mechanical Losses and Its Distribution during a Real Driving Cycle. Tribol. Int. 2020, 145, 106208. [Google Scholar] [CrossRef]
  50. Zhao, L.; Li, J.; Yang, Q.; Wang, Y.; Zhang, X.; Li, H.; Yang, Z.; Xu, D.; Liu, J. Study on Friction and Wear Properties of New Self-Lubricating Bearing Materials. Crystals 2022, 12, 834. [Google Scholar] [CrossRef]
  51. Venkateswara babu, P.; Syed, I.; BenBeera, S. Experimental Investigation on Effects of Positive Texturing on Friction and Wear Reduction of Piston Ring/Cylinder Liner System. Mater. Today Proc. 2020, 24, 1112–1121. [Google Scholar] [CrossRef]
  52. Fenske, G.; Erch, R.; Demas, N.; Eryilmaz, O.; De la Cinta, M.; Martin, L. Parasitic Energy Losses. Argonne Natl. Lab. US Dep. Energy 2009. [Google Scholar]
  53. Turnbull, R.; Dolatabadi, N.; Rahmani, R.; Rahnejat, H. An Assessment of Gas Power Leakage and Frictional Losses from the Top Compression Ring of Internal Combustion Engines. Tribol. Int. 2020, 142, 105991. [Google Scholar] [CrossRef]
  54. Koszalka, G.; Hunicz, J. Comparative Study of Energy Losses Related to the Ring Pack Operation in Homogeneous Charge Compression Ignition and Spark Ignition Combustion. Energy 2021, 235, 121388. [Google Scholar] [CrossRef]
  55. Richardson, D.E.; Krause, S.A. Predicted Effects of Cylinder Kit Wear on Blowby and Oil Consumption for Two Diesel Engines. J. Eng. Gas Turbines Power 1999, 122, 520–525. [Google Scholar] [CrossRef]
  56. Koszałka, G.; Guzik, M. Mathematical Model of Piston Ring Sealing in Combustion Engine. Pol. Marit. Res. 2015, 21, 66–78. [Google Scholar] [CrossRef] [Green Version]
  57. Priest, M.; Dowson, D.; Taylor, C.M. Theoretical Modelling of Cavitation in Piston Ring Lubrication. Proc. Inst. Mech. Eng. Part C J. Mech. Eng. Sci. 2000, 214, 435–447. [Google Scholar] [CrossRef]
  58. Koszalka, G.; Suchecki, A. Durability Prediction of a Diesel Engine Piston-Rings-Cylinder Assembly on the Basis of Test Bench Results. SAE Tech. Pap. 2011. [Google Scholar] [CrossRef]
  59. Koszalka, G.; Suchecki, A. Changes in Performance and Wear of Small Diesel Engine during Durability Test. Combust. Engines 2015, 162, 34–40. [Google Scholar] [CrossRef]
  60. Koszałka, G. Predicting the Durability of the Piston-Rings-Cylinder Assembly of a Diesel Engine Using a Piston Ring Pack Model. Eksploat. I Niezawodn.-Maint. Reliab. 2011, 40–44. [Google Scholar]
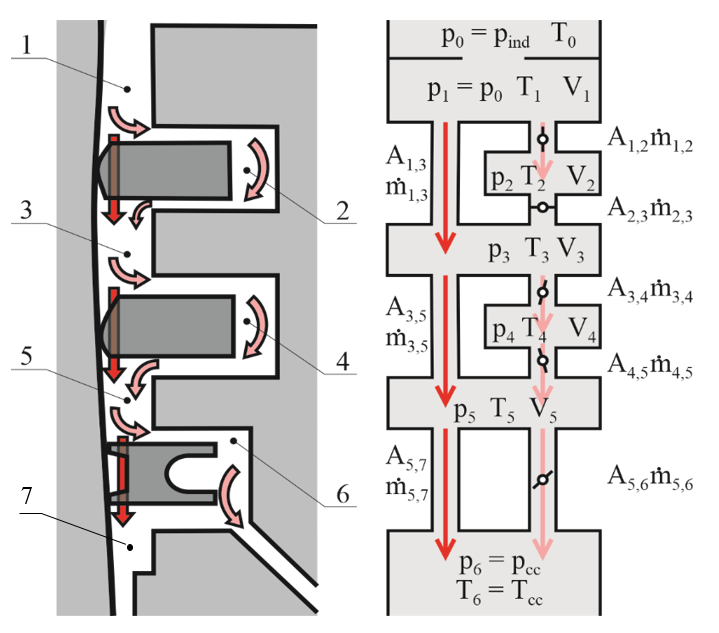
Figure 1. A schema of the ring pack and corresponding orifice-volume model; 1—top land, 2 and 4—behind ring spaces, 3—the second land, 5—the third land, 6 and 7—spaces connected to the crankcase.
Energies 15 09570 g001
Figure 2. Forces acting on the ring.
Energies 15 09570 g002
Figure 3. Indicated pressure for different engine loads.
Energies 15 09570 g003
Figure 4. Wear of the cylinder liner.
Energies 15 09570 g004
Figure 5. Wear of the rings: (a) increase in the ring end gaps; (b) changes in the ring heights.
Energies 15 09570 g005
Figure 6. Simulated and measured blow-by rate.
Energies 15 09570 g006
Figure 7. Effect of wear on blow-by rate at different engine loads.
Energies 15 09570 g007
Figure 8. Pressure in the inter-ring spaces for different wear and loads: (a) engine load 20 Nm; (b) engine load 168 Nm.
Energies 15 09570 g008
Figure 9. Mass flow rates in the ring end gaps for different wear and loads: (a) engine load 20 Nm; (b) engine load 168 Nm.
Energies 15 09570 g009
Figure 10. Axial displacements of the rings in the grooves for different wear and loads: (a) engine load 20 Nm; (b) engine load 168 Nm.
Energies 15 09570 g010
Figure 11. Friction forces between the rings and cylinder liner for different wear and loads: (a) engine load 20 Nm; (b) engine load 168 Nm.
Energies 15 09570 g011
Figure 12. The energy lost by cycle due to blow-by at different engine loads and wear: (a) absolute values; (b) values related to indicated work.
Energies 15 09570 g012
Figure 13. The energy lost by cycle due to ring pack friction at different engine loads and wear: (a) absolute values; (b) values related to indicated work.
Energies 15 09570 g013
Table 1. Engine specification.
Parameter Value
Displacement 1995 cm3
Nominal diameter of the bore84 mm
Stroke90 mm
Compression ratio12:1
No of valves4
Max power105 kW at 6000 rpm
Max torque190 Nm at 4500 rpm
Table 2. Main dimensions of the piston rings.
Parameter Top RingSecond RingOil Ring
Axial height(mm)1.201.52.0
Radial thickness(mm)3.83.83.8
Nominal ring end gap(mm)0.200.300.25
Nominal ring side clearance(mm)0.030.030.03
Publisher’s Note: MDPI stays neutral with regard to jurisdictional claims in published maps and institutional affiliations.