Article

Utilizing Rooftop Renewable Energy Potential for Electric Vehicle Charging Infrastructure Using Multi-Energy Hub Approach

1
Chemical Engineering Department, University of Waterloo, Waterloo, ON N2L 3G1, Canada
2
ABen Hub Incorporated, Kitchener, ON N2E 0E1, Canada
3
Department of Chemical Engineering, Khalifa University of Science, Technology and Research (KUSTAR), Abu Dhabi P.O. Box 2533, United Arab Emirates
*
Authors to whom correspondence should be addressed.
Energies 2022, 15(24), 9572; https://doi.org/10.3390/en15249572
Submission received: 1 September 2022 / Revised: 29 October 2022 / Accepted: 3 November 2022 / Published: 16 December 2022
(This article belongs to the Special Issue Development and Implementation of Clean Energy Hubs)

Abstract

:
Electric vehicles (EV) have the potential to significantly reduce carbon emissions. Yet, the current electric vehicle charging infrastructure utilizes electricity generated from non-renewable sources. In this study, the rooftop area of structures is analyzed to assess electricity that can be generated through solar- and wind-based technologies. Consequently, planning an electric vehicle charging infrastructure that is powered through ‘clean’ energy sources is presented. We developed an optimal modeling framework for the consideration of Renewable Energy Technologies (RET) along with EV infrastructure. After examining the level of technology, a MATLAB image segmentation technique was used to assess the available rooftop area. In this study, two competitive objectives including the economic cost of the system and CO2 emissions are considered. Three scenarios are examined to assess the potential of RET to meet the EV demand along with the Abu Dhabi city one while considering the life-cycle emission of RET and EV systems. When meeting only EV demand through Renewable Energy Technologies (RET), about 187 ktonnes CO2 was reduced annually. On the other hand, the best economic option was still to utilize grid-connected electricity, yielding about 2.24 Mt CO2 annually. In the scenario of meeting both 10% EV demand and all Abu Dhabi city electricity demand using RE, wind-based technology is only able to meet around 3%. Analysis carried out by studying EV penetration demonstrated the preference of using level 2 AC home chargers compared to other ones. When the EV penetration exceeds 25%, preference was observed for level 2 (AC public 3ϕ) chargers.

1. Introduction

One of the major challenges the electric vehicle industry faces, as opposed to combustion engine vehicles, is the lack of infrastructure across many countries [1]. Historically speaking, the first car was driven by Karl Benz in 1886 [2]. It was not until 1913 when the first filling station was built for automobiles [3]. On the other hand, even though the first electric vehicle was invented in the 1800s, the first mass produced hybrid vehicles were introduced in 1997 [4]. By December 2013, an electric vehicle charging infrastructure was completed by Estonia with nationwide coverage [5].
In contrast, Abu Dhabi, the capital of the United Arab Emirates, is one of the largest producers of energy globally. However, more than 99% of its electricity is generated from fossil-based fuels [6]. The government aims to increase its dependence on renewables up to 7% by 2020 as a step to mitigate carbon emissions [7]. The country has also promoted the use of electric vehicles (EV) by offering financial incentives in order to mitigate emissions from the transport sector [8,9]. Coupled with rise in fuel prices, there exists potential for a significant shift to electric vehicles.
As EVs are a promising solution for emission and pollution reduction in urban areas, many governments propose different types of tax credits or incentives for purchasing EVs. Although this will ease the penetration of EVs into the urban area in the city, there are many challenges. Regardless of the challenges of coupling of EVs with grid, the underlying challenge for the integrating of renewable power generations with EVs remains. There is already significant research into the design and applications of electric vehicle integration and vehicle to grid operation to help intermittency challenges of renewable energy [10,11,12]. However, the focus of our work is to optimally design and integrate renewable technologies with EV charging at the city scale with emphasis on the investigation of carbon emission reduction.
Bhatti et al. [13] conducted a comprehensive review of EV charging using solar photovoltaic (PV) technology. This work only considers solar PV with the simulation approach, while our work considers different rooftop renewable energy technologies including wind and different types of solar considering an optimal planning approach. Another study investigated the optimal design of renewable energy for EV charging in high-density areas. They considered Hong Kong as their case study [14]. Osório et. al. [15] reviewed many research studies, discussing solar PV, EV changing, as well as the challenges of integration of a PV system for EV charging. Minh et al. investigated the techno-economic aspect of coupling PVs with EV changing infrastructure with an emphasis on solar irradiation in Vietnam [16].
Within the past decade, several renewable energy projects have been initiated or completed outside the Abu Dhabi (AD) city, such as Shams CSP, Masdar PV and Bani Yas Wind farm, to aid in meeting the AD 2020 target. Abu Dhabi has been exploring rooftop RET deployment schemes since 2008 [17]. Yet, these have been limited to policy-making stages, and the idea of utilizing rooftop area of major structures within the metropolitan region toward renewable energy generation has not been studied. Thus, this study aims to utilize the rooftop area of major structures within the Abu Dhabi city for electricity generation using renewable energy technologies. This produced energy is used in planning of electric vehicle charging infrastructure as well toward meeting the Abu Dhabi electricity demand. Economic and environmental considerations are made in addition to technical limitations. Different scenarios have been analyzed to investigate the impact of various parameters on the total cost and overall carbon emission reduction.

2. Electric Vehicles (EVs)

There are mainly four types of electric vehicles: Battery Electric Vehicle (BEV), Plug-in Hybrid Electric Vehicle (PHEV), Hybrid Electric Vehicle (HEV) and Fuel-cell electric vehicle [1,18]. BEVs, also referred to as EVs, are completely powered by the battery and can be charged using an external source of electricity [18]. PHEVs and HEVs, in contrast, are equipped with both driving systems: internal combustion as well as electric drivetrain. PHEVs rely highly on the battery and can be recharged using on-grid electricity whereas HEV batteries are charged entirely by consuming gasoline. Fuel-cell electric vehicles (FCEV) generate power to operate its electric motor, using stored hydrogen and oxygen from the air. Since HEVs and FCEVs do not benefit from an EV charging infrastructure; these vehicles are not considered in this study.

2.1. Specifications

Several automobile manufacturers have invested in the EV industry and have produced vehicles that are already commercially available. Apart from the cost of the vehicle, another important factor in determining what EV to purchase is its driving range. Table 1 shows the ranges and prices of some electric vehicles that are commercially available. It is observed that even the cheapest EVs listed have a range of more than 100 km.

2.2. Chargers

There are generally three levels of chargers commercially available for electric vehicles (BEV and PHEV) [22]. Each charger is subjected to different technical limitations that affect the time it takes to charge EVs. For example, a level 1 (110 V) charger may take up to 10 h to fully charge a 20 kWh EV battery, whereas level 2 home chargers may fully charge a similar battery in about 5 h. On the other hand, level 3 AC chargers may charge about 80% of a 20 kWh battery in less than half an hour [23,24]. Table 2 shows the specifications of the electric chargers commercially available. One significant element of information is the number of 20 kWh charging cycles each charger can provide in a day. Super-fast DC public chargers have up to 288 cycles, while level 2 AC public chargers have a maximum of 4 cycles. In contrast to charging, options exist where batteries may be swapped with fully charged ones to save time (i.e., 3 min) [20]. However, this alternative requires stocking batteries which may differ from one EV to the other [23]. Moreover, not all EVs are equipped with easily replaceable energy storage systems.

2.3. Greenhouse Gas (GHG) Emissions

Electric vehicles, in general, faced several economic and technical challenges such as high cost and limited mileage. Due to these factors, they failed to compete with internal combustion engine vehicles and were not able to penetrate the market [4]. However, these factors have now become relatively competitive to those of ICE vehicles. Moreover, the rise in environmental concerns, due to high CO2 emissions, has driven governments to battle these issues by promoting ‘cleaner’ alternatives.
Electric cars can emit GHG emissions ranging from 0 to 155 g/km, depending on the fuel type in use [25]. As mentioned earlier, BEVs run entirely on batteries; hence, they do not emit any significant level of direct GHG emissions. However, a comprehensive life-cycle analysis may dictate significant emissions associated with these energy storage systems at the manufacturing stage. Measures may be taken during that process to mitigate or reduce harmful pollutants. A scenario within this study considers life-cycle emissions and depicts results based on these emissions. PHEVs and HEVs, on the contrary, are equipped with internal combustion engines that could emit about 50 to 130 g/km of direct CO2 emissions, assuming various ratios of electricity and petrol consumption [25].

2.4. Rooftop Assessment

Renewable energy technology has become technically viable such that it can be employed for designing a sustainable energy framework. However, when it comes to rooftop RET, several factors such as shading and orientation affect potential energy output. There are several approaches to account for these limitations. A study was conducted that identified strategies to aid the effective implementation of rooftop solar PV in the United Arab Emirates [17]. Studying mentioned strategies and factors in detail is beyond the scope of this paper, since this work focuses on the feasibility of EV infrastructure based on renewable energy.

3. Methodology

3.1. Superstructure

Figure 1 shows the superstructure that outlines the renewable energy sources considered in this study as well as the energy hubs and electric vehicle chargers.
Electric vehicle (EV) charging stations, powered by energy hubs, will be located in different areas in the city. These locations may include residential sites, work locations, schools, hospitals and other notable places where vehicles may be parked for a significant amount of time. Even though superchargers exist for electric vehicles that could charge the battery for 30 min resulting in the range of 270 km, most vehicles can drive about an additional 18 km per hour when charging with standard chargers (Level 2) [26]. Therefore, Level-2 charging stations would be considered primarily for these locations.
The infrastructure would consist of several charging points across the city in areas where vehicles will be parked for a significant amount of time. These charging points would be powered by energy hubs that will facilitate the integration of renewables. In the superstructure, presented in Figure 1, E represents an energy hub at a particular site (i.e., rooftop) whilst Cij, within the green rectangle, represents each charger connected to this energy hub. In addition to charging electric vehicles, energy generated by these hubs may be used to partially meet the energy demand of Abu Dhabi city. For electricity generation from solar energy, both solar PV and Micro-CSP technologies have been considered in this study. In addition, small wind turbines are used to generate electricity from wind energy.

3.2. Rooftop Area Estimation

As mentioned earlier, there are several factors that affect rooftop energy potential including solar irradiance, direction of tilt of solar roof and rooftop area. In order to calculate the rooftop areas, different tools can be utilized for processing images of aerial maps, such as watershed segmentation, template matching, level set theory, and other LiDAR-based tools. However, as stated, the aim of the research to determine the feasibility of rooftop RET is in line with the designing of EV charging infrastructure. Thus, MATLAB Image Segmenter 7.0 and Image Region Analyzer v1.39 tools were simply used to detect and analyze the rooftop area from map images. A detailed study of other relevant factors is beyond the scope of this research. The satellite images of the studied area were captured using Google maps. In this section, the application of these tools is demonstrated.
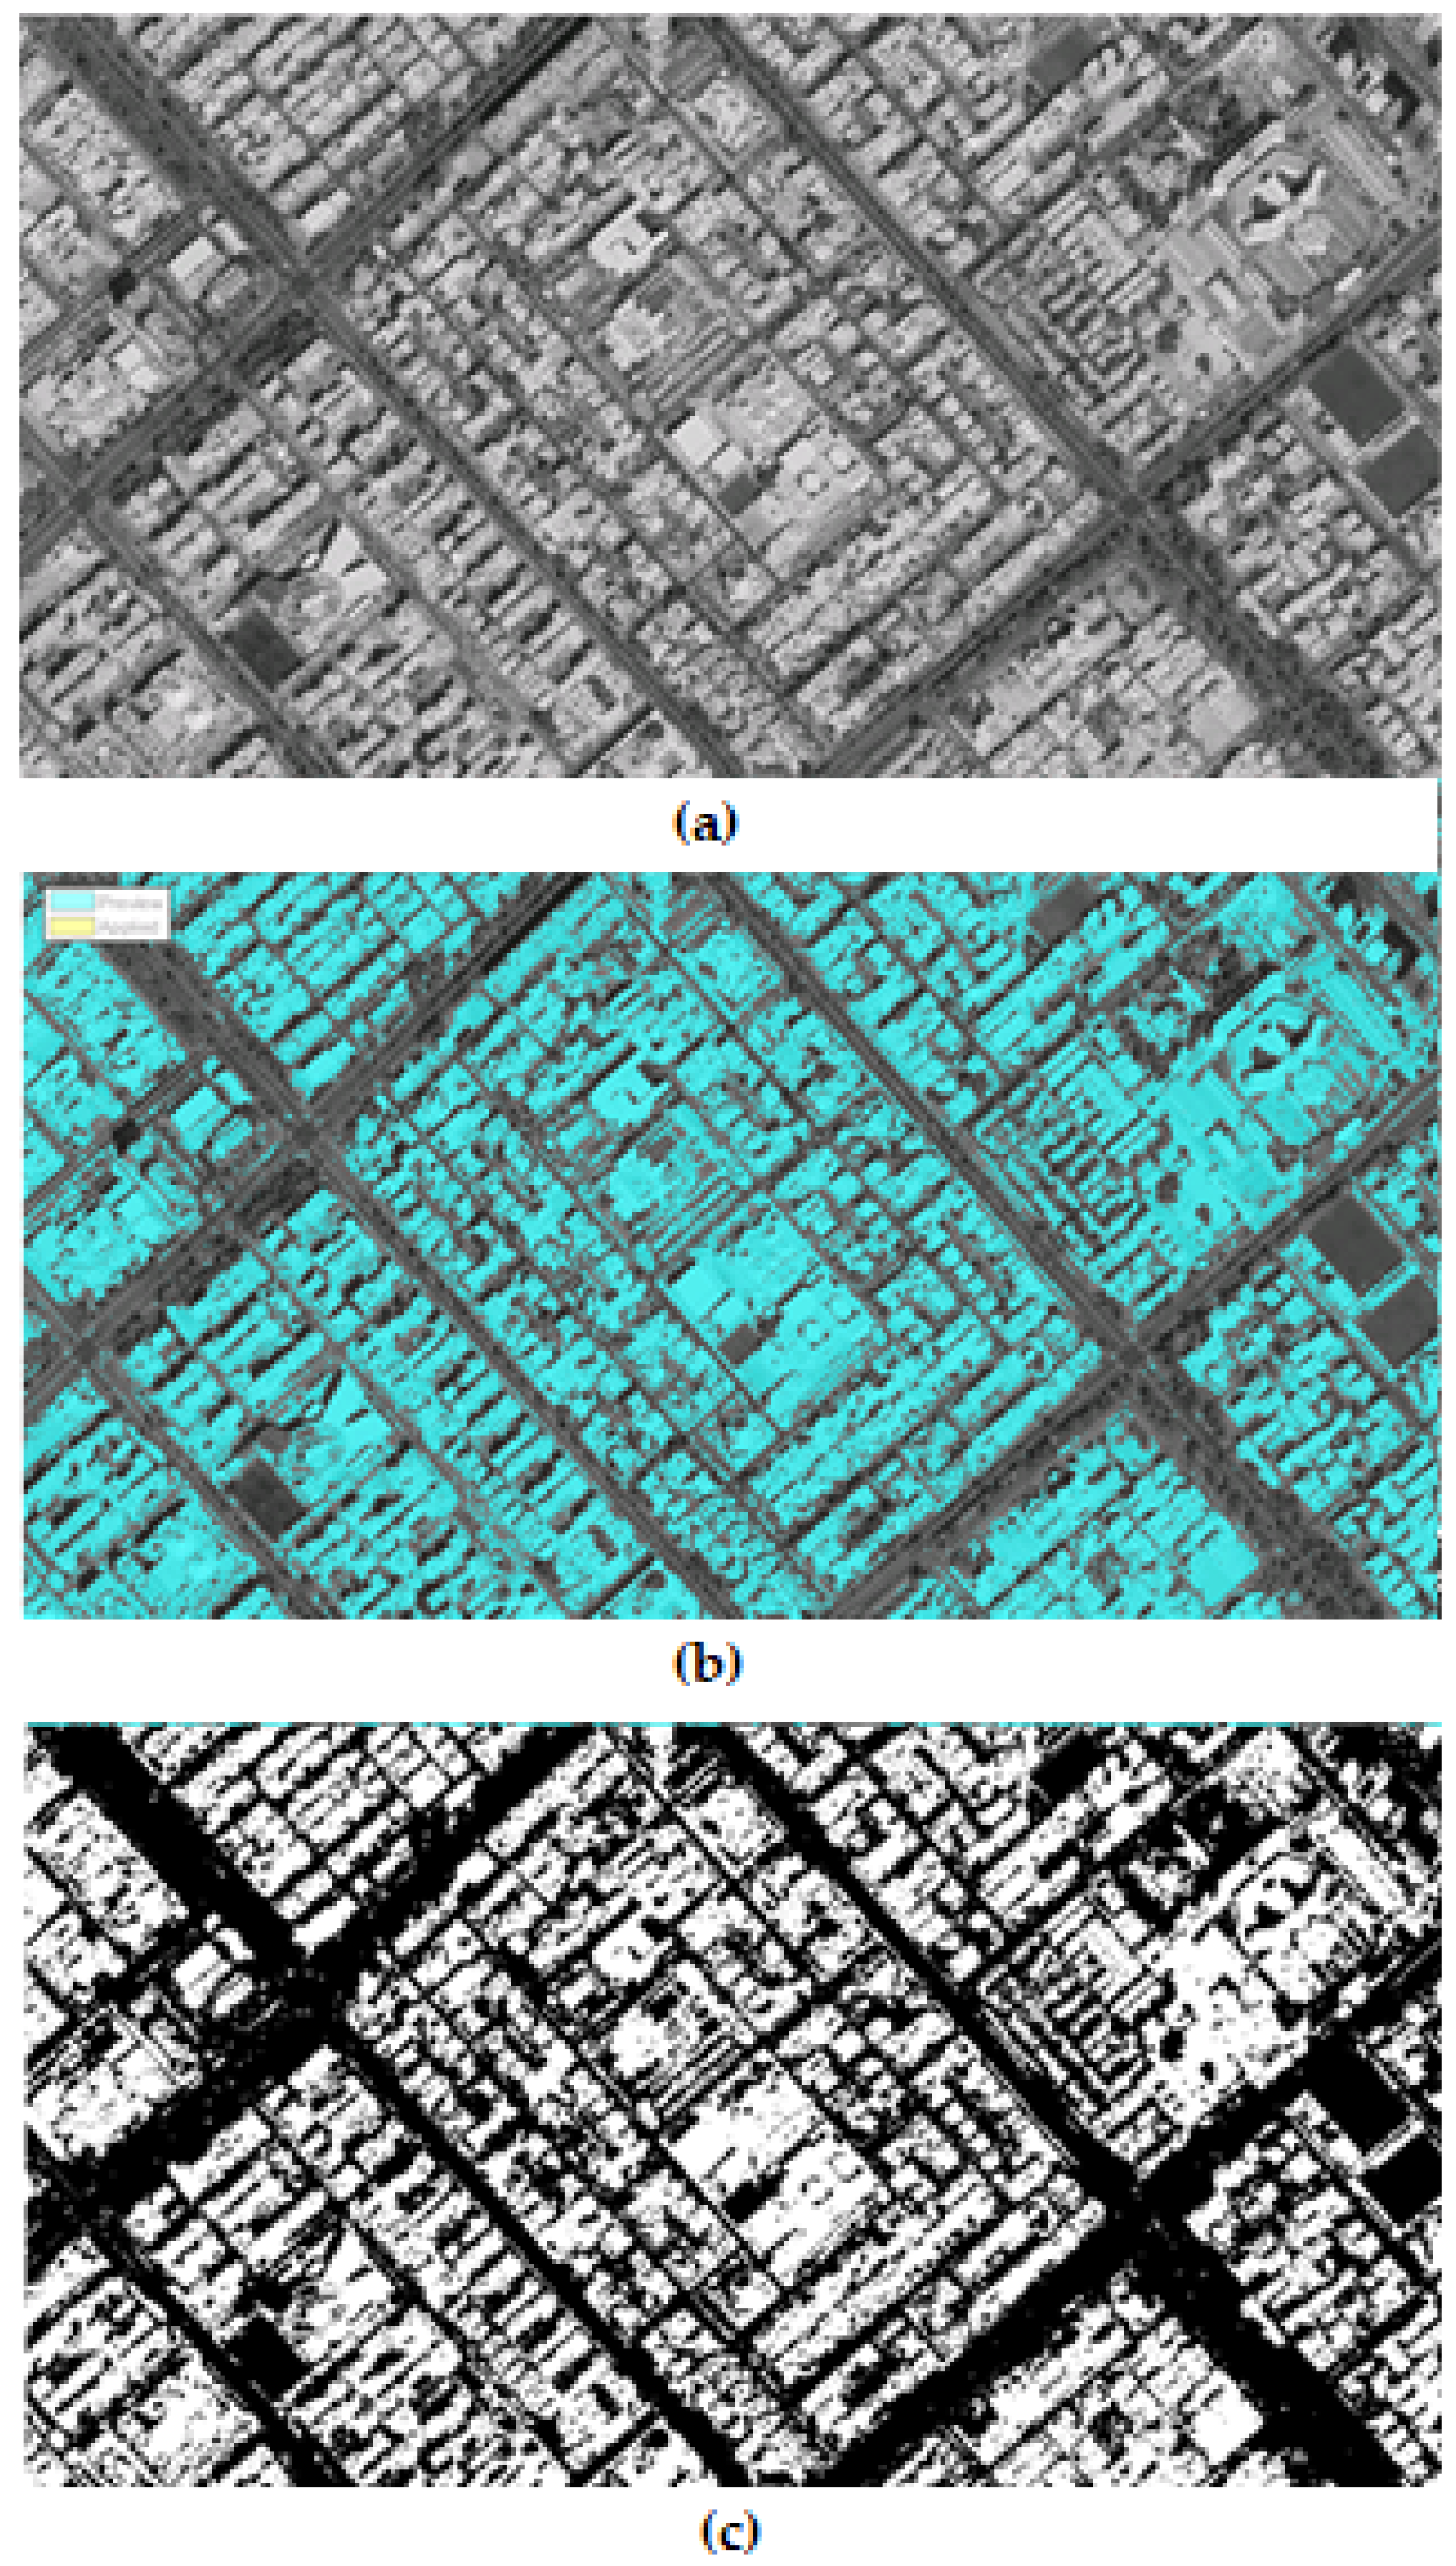
Abu Dhabi is the largest emirate that accounts for about 87% (67,640 km2) of the United Arab Emirates by land. However, the Abu Dhabi city comprises 972 km2 with a population of about 1.5 million as of 2013 [27]. Moreover, the city is designed in blocks of localities. A satellite image of each block of structures is captured, as seen in Figure 2, as long as adequate details of each building can be observed. The image is then segmented where a threshold is applied to it. Based on the detail of the image, an appropriate level of threshold is applied, resulting in an image where the rooftop is made distinct from other noises (i.e., non-rooftop area), as evident from the last image in Figure 3.
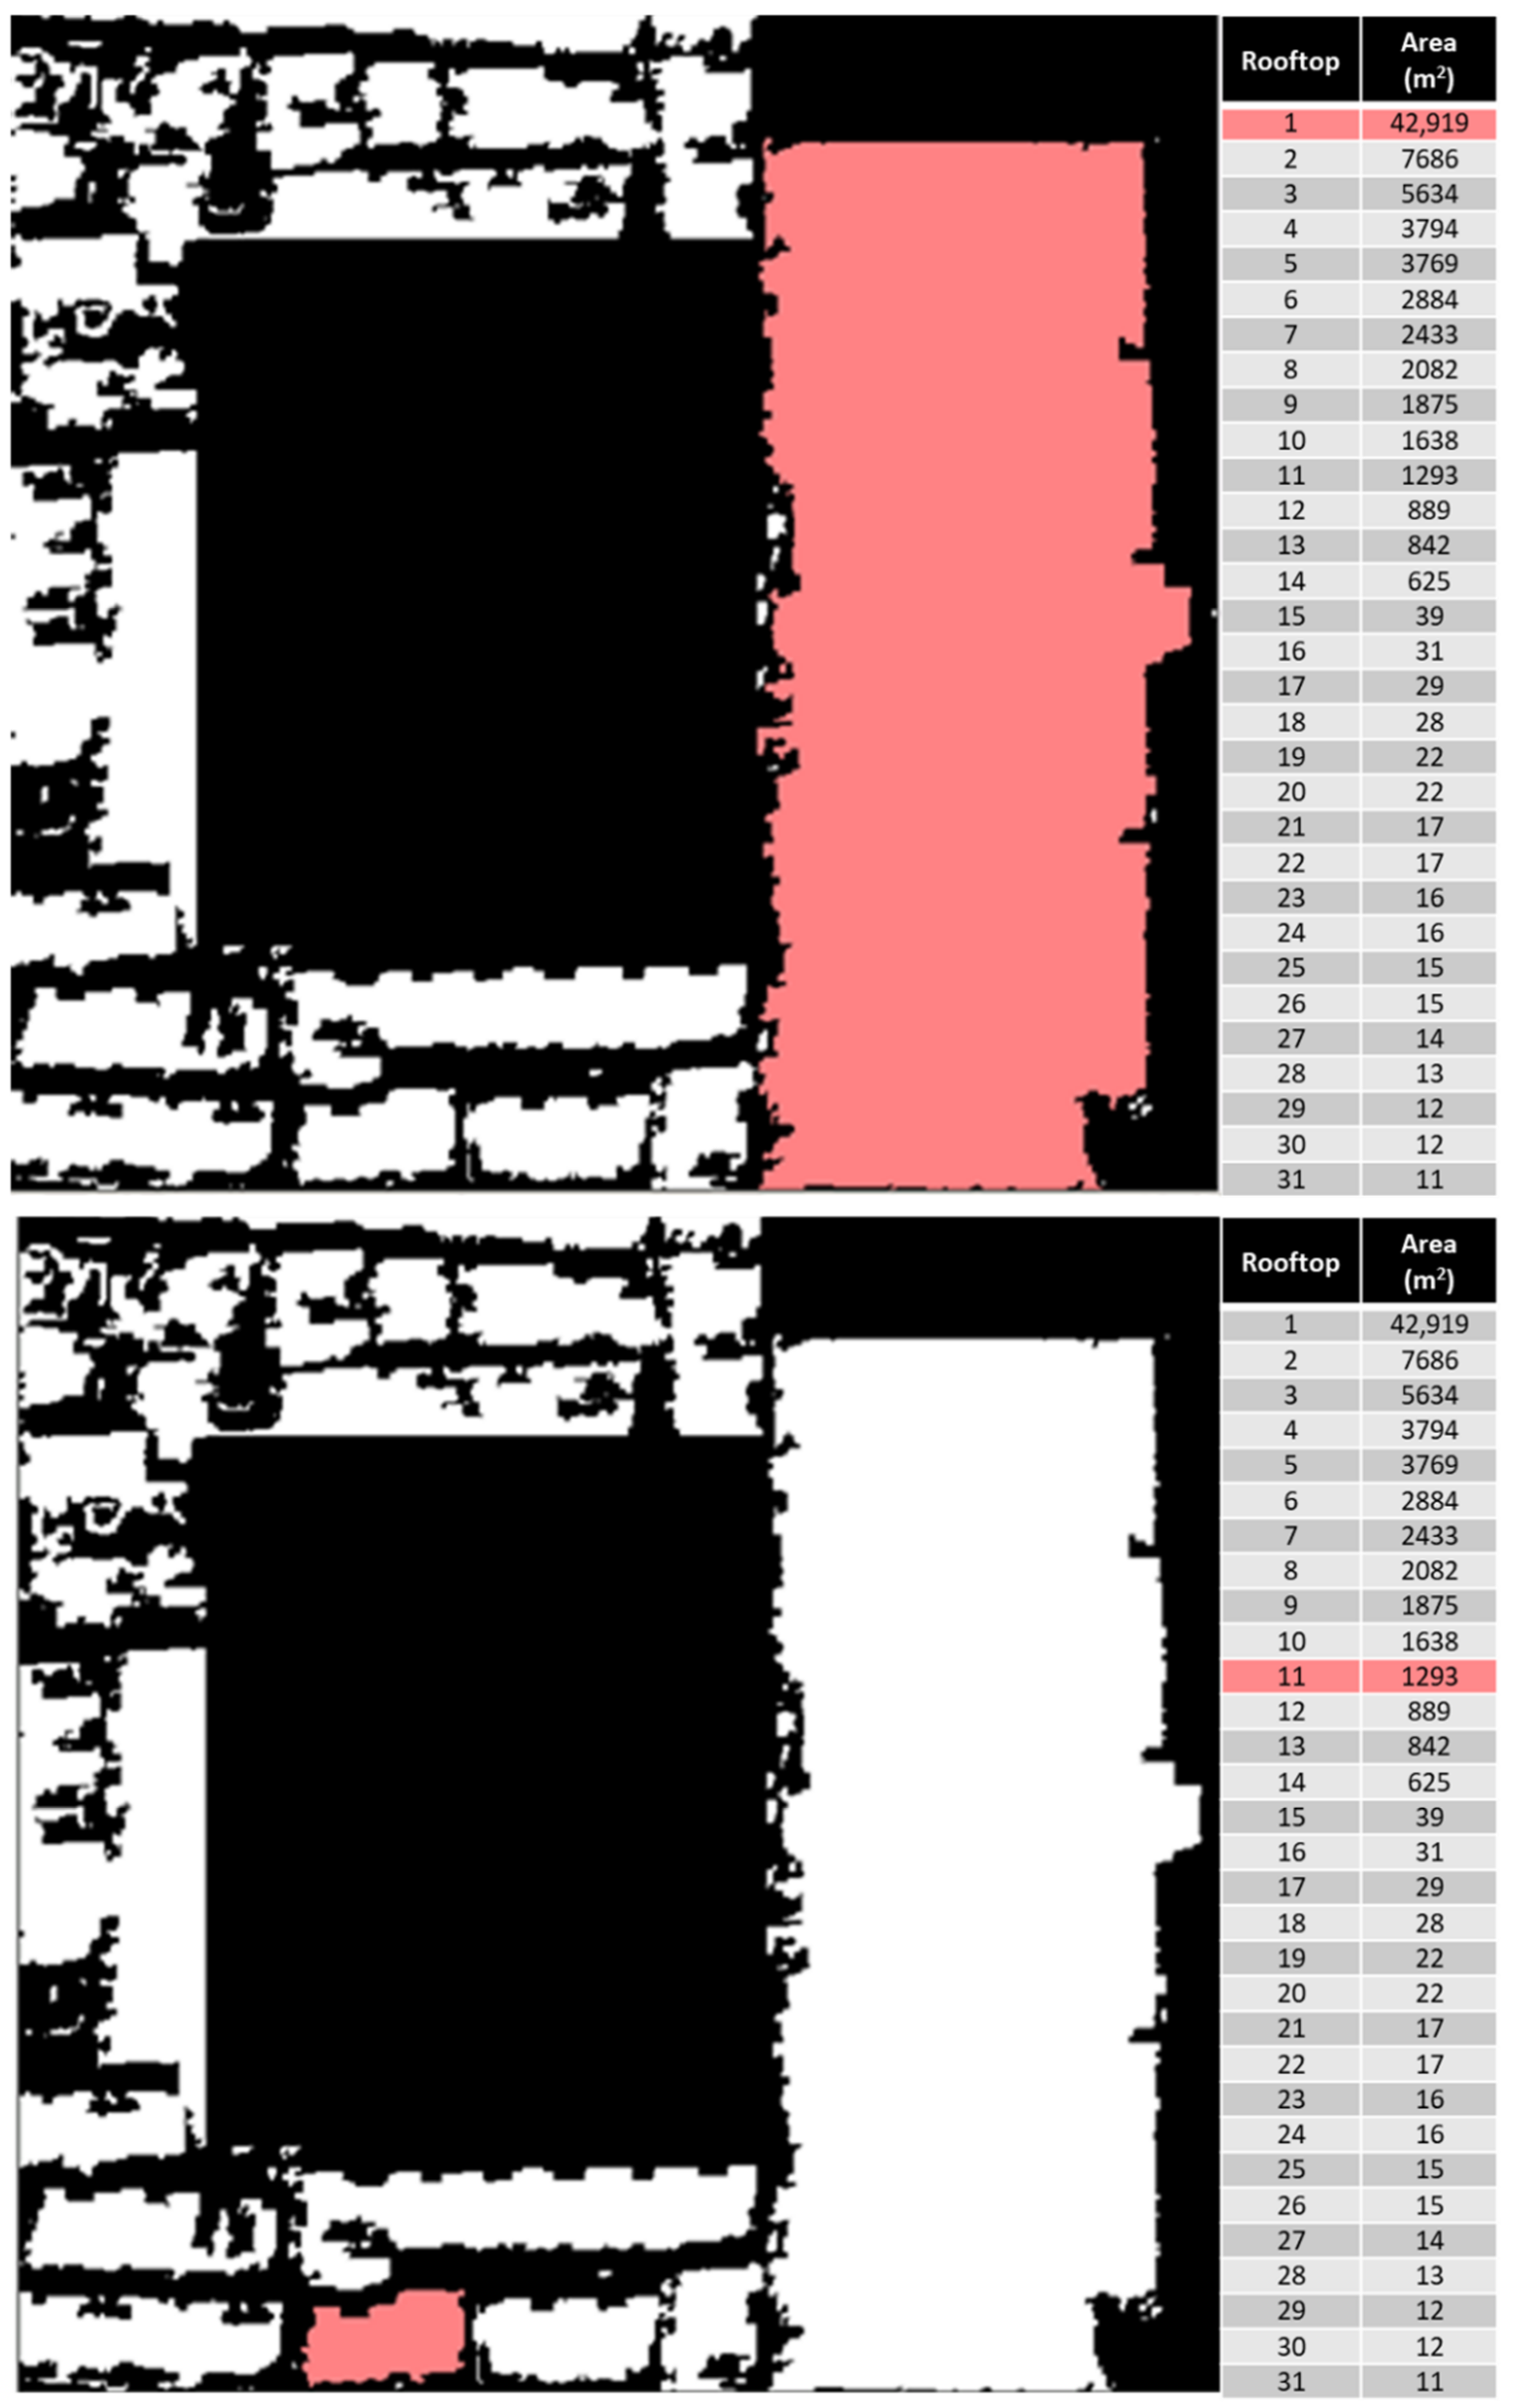
Post-threshold adaptation, the image is transformed such that the identified areas within it can be analyzed quantitatively. An area, based on the scale of the transformed image and its pixels, is calculated, as shown in Figure 4. The actual area of the rooftop is, then, obtained, using the scale at which the image was captured.

3.3. Model Formulation

3.3.1. Objective Function

The main purpose of investing in RET is to mitigate carbon emissions. Hence, the main objective function, g, is to develop based on the amount of CO2 emissions produced from energy consumption ( g E n e r g y ) and utilization of electric/ICE vehicles ( g V e h ), as seen from Equation (1). g E n e r g y , as seen in Equation (2), is calculated by multiplying the amount of electricity production from each energy source with the associated CO2 emissions per unit of electricity. g V e h , expressed using Equation (3), considers the number of different types of vehicles, the emissions generated from them per km and the average mileage these vehicles have over the considered timeframe. For example, if the annual emissions reduction is studied, the average mileage over a year may be considered.
g T = g E n e r g y + g V e h
g E n e r g y = t s j P s , j , t C O 2 s , j
g V e h = n I C E g I C E k m I C E + n E V g E V k m E V + n P H E V g P H E V k m P H E V
On the other hand, another objective function, the total economic cost ( z ), employing respective renewable energy and electric vehicle charging technologies, is evaluated using Equation (4). These two objective functions are formulated in order to study different scenarios as well as develop a Pareto front to identify outcome at various stages. In order to develop this frontier, the modified epsilon constraint method is employed. The total economic cost comprises of energy generation cost ( C E T ) as well as cost of electric vehicle charging infrastructure ( C I T ).
z = C E T + C I T
The cost of energy includes the capital and operating cost as well as fuel costs if required by the energy generation plant. Since electricity is the only output energy vector considered in this study, the cost of energy is calculated using the levelized cost of electricity (LCOE) values of different energy generation technologies. This levelized cost of electricity incorporates the capital, operation, and maintenance costs of utilizing a particular energy generation technology, when considering the tax rate, discount rate and other imperative factors. The cost of EV charging infrastructure comprises capital costs and operating and maintenance costs of charging infrastructure, as seen in Equation (6). The capital cost incurred at energy hub “s” at time “t” is represented using Equation (7). In this study, the total cost of chargers ( C C H s T ) installed at energy hub s is amortized considering a constant discount rate ( D ) and a similar lifetime for all chargers ( N C H ). Moreover, Equation (8) represents the calculation of total cost of charges, where C C H s T is equal to the total number of each type of charger ( n C H s ) installed at energy hub s multiplied by the cost ( C C H ) of corresponding chargers, respectively. The cost of each charger includes the cost of equipment, parts for installation and labor costs. In this work, we consider three types of level 2 chargers and three models of level-3 ones, as mentioned in Table 2. Here, “21” refers to level-2 charging AC public 3ϕ, while “22”, and “23” refer to AC public and AC home, respectively.”31” refers to Level-3 DC superfast charging DC public, while “32” and “33” refer to DC public, and AC public, respectively.
C E T = s t j L C O E j   ×   P s , j , t
C I T = s t C C I s , t c a p + C C I s , t O & M
C C I s , t c a p = C C H s T 1 + D N C H 1 D 1 + D N C H
C C H s T = n C H s 21 C C H 21 + n C H s 22 C C H 22 + n C H s 23 C C H 23 + n C H s 31 C C H 31 + n C H s 32 C C H 32 + n C H s 33 C C H 33  

3.3.2. Energy Hub

The energy hub, in this study, is modeled without a storage technology, using the following equation. Multiple input energy vectors and a single output energy (i.e., electricity) were considered.
L s , t = j C j P s , j , t
The load ( L s , t ) by each energy hub s at time t is met using electric power P s , j , t , converted from energy vector j, and storage technology, q. In order to allow the networking of energy hubs, this load is defined by the demand of the energy ( D e m s , t ) and the energy transfered ( T s , b , t ) from/to other energy hubs, provided a connection exists between them with the transmission factor of ( α s , b ), as seen in Equation (10).
L s , i , t = D e m s , t + b S s T s , b , t α s , b
D e m s , t mainly constitutes the electric chargers connected to this energy hub. Since this information is readily available, this demand can be simulated based on the number of electric vehicles that have penetrated the transport industry, as a percentage of total cars. In one the observed scenarios, this is extended to the region’s electricity demand.

3.3.3. Renewable Energy Technology

The yield of electric power from each RET is subjected to technical limitations. Electricity generated from solar photovoltaic (PV) technology is defined by Equations (11) and (12), whereas electricity produced from concentrated solar power (CSP) technologies is defined by Equations (13) and (14). Energy derived from wind turbines is expressed using Equations (15) and (16). Several other formulations exist in the literature that consider additional parameters for added accuracy. In this paper, the area required for each type of RE technology, denoted by L a n d , is defined by Equations (17)–(19). G H I and D N I , in Equations (11) and (13), are the global horizontal irradiance and direct normal irradiance, respectively. P R is the performance ratio while C F is the capacity factor of deployed technology. N represents the number of units, P o w e r represents the power output of each unit, and h represent operational hours of this unit. In Equation (14), ρ a i r is the density of air, A s w e p t is the area swept by the blades of the wind turbine and w s is the wind speed. Other parameters, such as A r e a P V m o d u l e , A p e r t u r e S C A , l e n g t h S C A , represent the area of each PV module, aperture and length of each solar collector assembly, as the terms suggest, respectively.
P s , P V , t   L a n d s , P V × G H I t × P R P V
t P s , P V , t = N s , P V m o d u l e × C F P V × P o w e r P V m o d u l e × P R P V × h P V
P s , C S P , t   L a n d s , C S P × D N I t × P R C S P
t P s , C S P , t = N s , C S P S C A × C F C S P × P o w e r C S P S C A × P R C S P × h C S P
P s , W T , t   L a n d s , W T 0.5 ρ a i r A s w e p t w s s , t 3 h
t P s , C S P , t = N s , W T × C F W T × P o w e r W T × h W T
L a n d s , P V = 1.5 × A r e a P V m o d u l e × N s , P V m o d u l e
L a n d s , C S P = 4 × A p e r t u r e S C A × l e n g t h S C A × N s , C S P S C A
L a n d s , W T = 5 × r o t o r W T   2
The factors 1.5 and 4 in Equations (17) and (18) account for the structure of these technologies when they are mounted. In Equation (19), r o t o r refers to the rotor diameter of the blades of the wind turbine. Each wind turbine needs to be placed approximately 5 rotor diameters apart in order to avoid the wake effect. The sum of the required spaces for each RET is constrained by the maximum roof area available at energy hub sites.
s L a n d s , P V + L a n d s , C S P + L a n d s , W T A r e a s m a x

3.3.4. EV Charging

As part of the EV charging infrastructure, parking spaces need to be designated for electric vehicles where chargers are installed. Thus, each charger occupies a parking space. The parking ratio, ratio of parking spaces to building area, is used to constraint the available EV parking spaces. Equations (21) and (22) are used to define the minimum and maximum parking spaces available at each energy hub site. These conditions are necessary for the promotion of EVs whilst accommodating ICE vehicles in the transition period. Level 31 chargers are the ‘Super-fast DC’ public chargers that are mainly perceived as chargers at dedicated EV charging stations. Therefore, the number of level 31 chargers at these stations is subjected to the constraint presented in Equation (23). At these stations, EVs would stopover and recharge in a similar manner as ICE vehicles would refuel at gas stations. n c h , in the equations below, represents the number of each type of charger required at each energy hub. For example, n c h s 21 is the number of level 21 chargers that are installed at energy hub s. P a r k m i n and P a r k m a x are the minimum and maximum allowable parking ratio of the entire parking lot that is dedicated for electric vehicle charging. A r e a m a x is the total number of parking spaces at a particular energy hub.
n c h s 21 + n c h s 22 + n c h s 23 + n c h s 32 + n c h s 33   P a r k m i n × S p o t s s
n c h s 21 + n c h s 22 + n c h s 23 + n c h s 32 + n c h s 33   P a r k m a x × S p o t s s
n c h m i n 31     n c h s 31   n c h m a x 31
In this study, rooftops of structures involving hospitals, high-rise buildings, schools and malls have been considered where vehicles are parked for a considerable amount of time. Not all chargers may be appropriate for each type of site. Thus, the types of chargers not suitable for a particular site need to be eliminated, as shown below.
n c h s 23 + n c h s 31 + n c h s 32 + n c h s 33 = 0     s s c h o o l
n c h s 23 + n c h s 31 = 0     s m a l l
n c h s 23 + n c h s 31 + n c h s 32 = 0   s h o s p i t a l
n c h s 31 + n c h s 32 = 0     s b u i l d i n g
n c h s 21 + n c h s 22 + n c h s 23 + n c h s 32 + n c h s 33 = 0       s s t a t i o n
The number of electric vehicles that can be charged by each type of charger needs to be constrained by values that are dictated by feasibility and the technical limitations of the type of charger. For example, as seen from Table 2, the maximum number of 20 kWh EVs that can be charged by a level-21 charger (AC public 3ϕ) is 8 in 24 h. They may not be feasible to use at sites where parking time is restricted to a couple of hours. On the other hand, if charging stations with level-31 chargers are studied, a minimum number of vehicles needs to be considered that will be serviced by these stations. Thus, the following constraints are imposed (Equation (25)).
N e v s , m i n 21     N e v s , t 21   N e v s , m a x 21
N e v s , m i n 22     N e v s , t 22   N e v s , m a x 22
N e v s , m i n 23     N e v s , t 23   N e v s , m a x 23
N e v s , m i n 31     N e v s , t 31   N e v s , m a x 31
N e v s , m i n 32     N e v s , t 32   N e v s , m a x 32
N e v s , m i n 33     N e v s , t 33   N e v s , m a x 33

4. Results and Discussion

In this section, the results from the rooftop area estimation analysis are presented. Additionally, various scenarios, involving EV demand, Abu Dhabi electricity demand and life-cycle emissions of RET and EVs, are presented. Impact of different EV penetration within the transport sector on annual costs and carbon emissions is analyzed and discussed.

4.1. Rooftop Area

In this study, the rooftop area of major structures within Abu Dhabi city was determined using the tools discussed in the earlier sections. The area yielded from this method was compared to the actual rooftop area of the structures. Figure 5 shows the structures used with their respective unscaled areas, which were used for comparison.
After scaling the areas, the average percentage difference between the actual and calculated areas, based on MATLAB tools, was found to be 18.55%. This area accounts for the entire rooftop, including rooftop area covered with installations such as HVAC equipment. In a study conducted by Koo et al. [28], the average rooftop area available for RET installation was found to be 61.2% of the building area. Thus, this value is considered in this study, as well, when considering RET technologies.

4.2. Scenario 1: Considering Renewable Energy Technologies with EV Demand Only

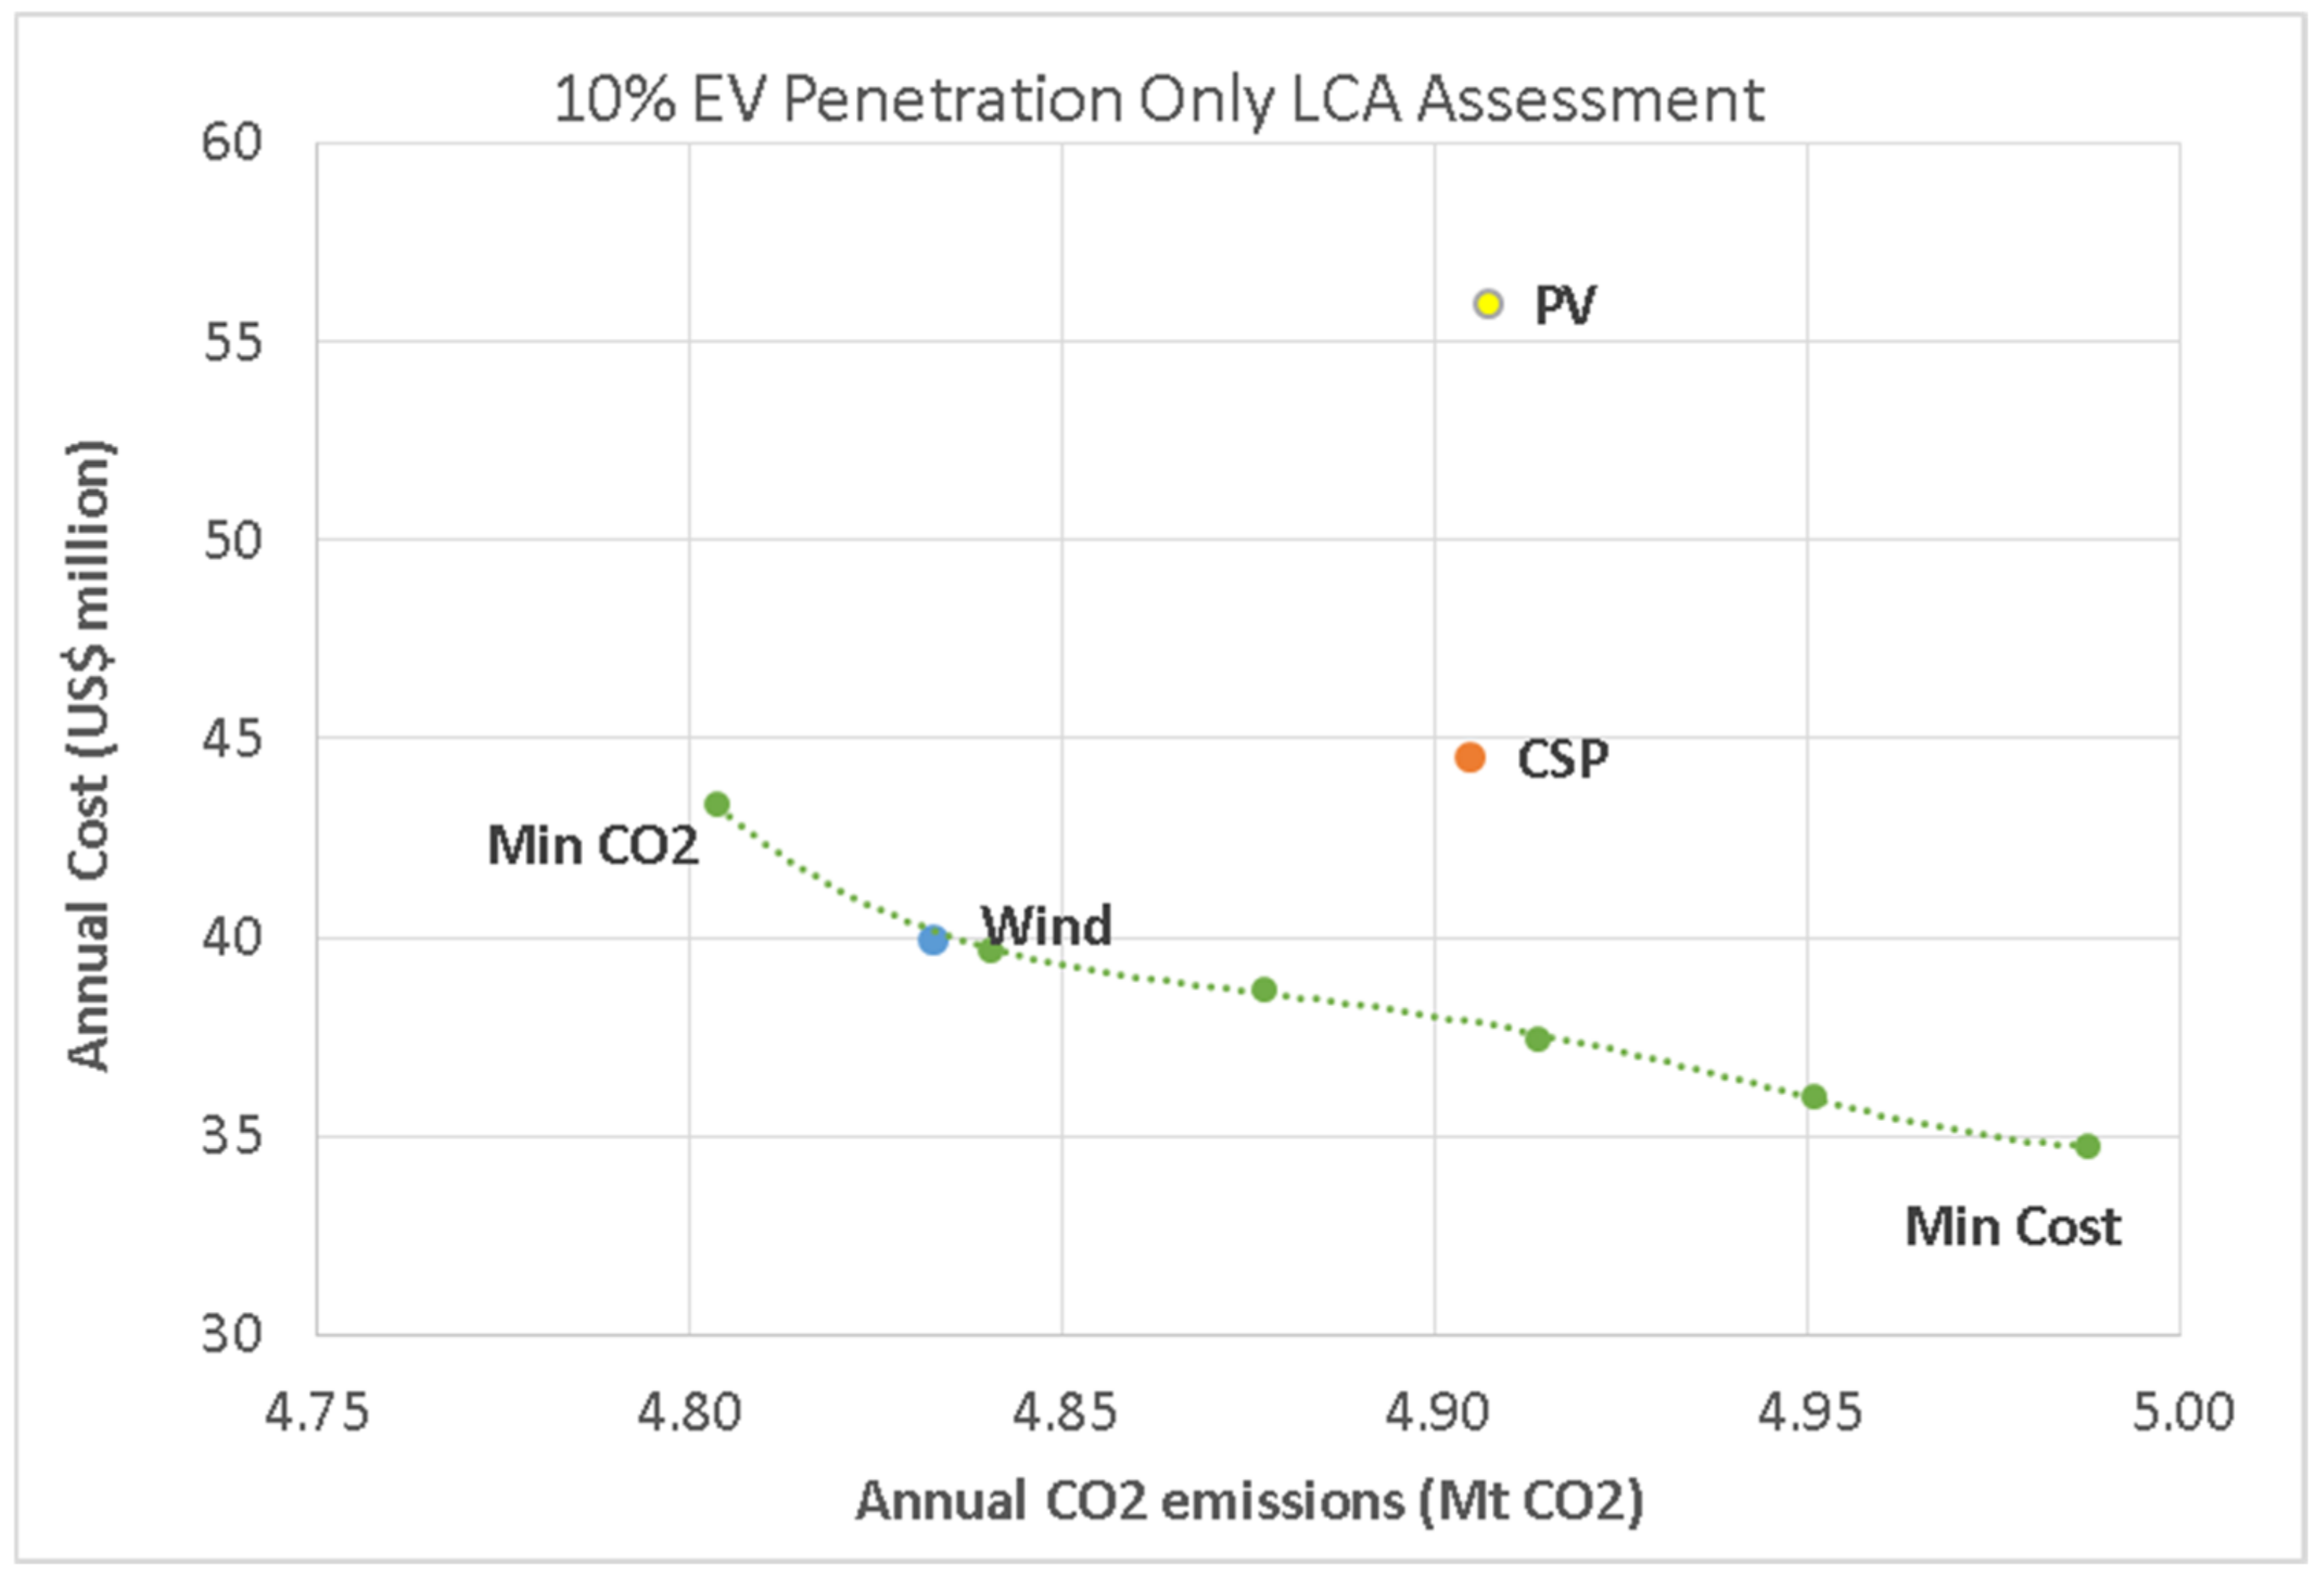
In this scenario, rooftop renewable energy technologies are exclusively utilized to meet EV charging demand. The annual cost and CO2 emissions realized for 10% EV penetration, for different energy generation configurations, have been recorded in Figure 6. The Pareto front, in this case, is denoted by the green dotted line which is generated using the epsilon constraint method, considering the objective function pertaining to total carbon emissions ( g T ) and total economic cost (z). The electricity produced by each of the technologies as well as the RET equipment installed is noted in Table 3.
Case studies are as follows:
  • Case 1: best economic option (min Cost);
  • Case 2: best environmental option (min CO2);
  • Case 3: to consider only PV and grid for power generation (PV only);
  • Case 4: to consider only Concentrate Solar Power (CSP) for power generation and grid (CSP only);
  • Case 5: to consider only wind and grid for power generation (Wind only).
The share of electricity generation for each energy generation technology and the number of RET equipment installed for each case study are introduced in Figure 6.
As evident from Figure 6, the least amount of emissions annually are observed for the ‘Min CO2’ case where almost all electricity demand is met via renewable energy technologies, mainly through wind energy (84%). In this case, 131,578 small wind turbines and 79,849 micro-CSP solar collector assemblies are installed. In contrast, the least annual cost for energy generation and EV charging infrastructure yields when all electricity is purchased from the local electrical grid. The difference in annual costs, as evident from Figure 6, for the two scenarios (i.e., min cost and min CO2) is $8.59 million. In addition, the reduction in emissions observed, by employing RET, is about 187 ktonnes CO2, annually. This cost roughly translates to $46 per ton of CO2 mitigated. In comparison to the average carbon capture and storage (CCS) cost from point source, as reported by Rubin et al. [29], the cost appears to be $8 cheaper per ton CO2. The reported cost for utilizing RET also includes mitigating emissions that would, otherwise, be emitted to ambient air. Capturing these emissions, from ambient air, would be more difficult and result in higher costs.
If opting for a single RET, investing in wind energy would be more economically and environmentally beneficial, as indicated by the results in Figure 6. Generating electricity from wind is cheaper than generation through solar energy. Furthermore, solar PV and CSP, without energy storage systems, are only able to meet about 46% of the given EV demand. The installation of storage system will allow these technologies to meet further demand; however, this will result in higher costs.

4.3. Scenario 2: Considering Renewable Energy Technologies with EV + Abu Dhabi City Demand

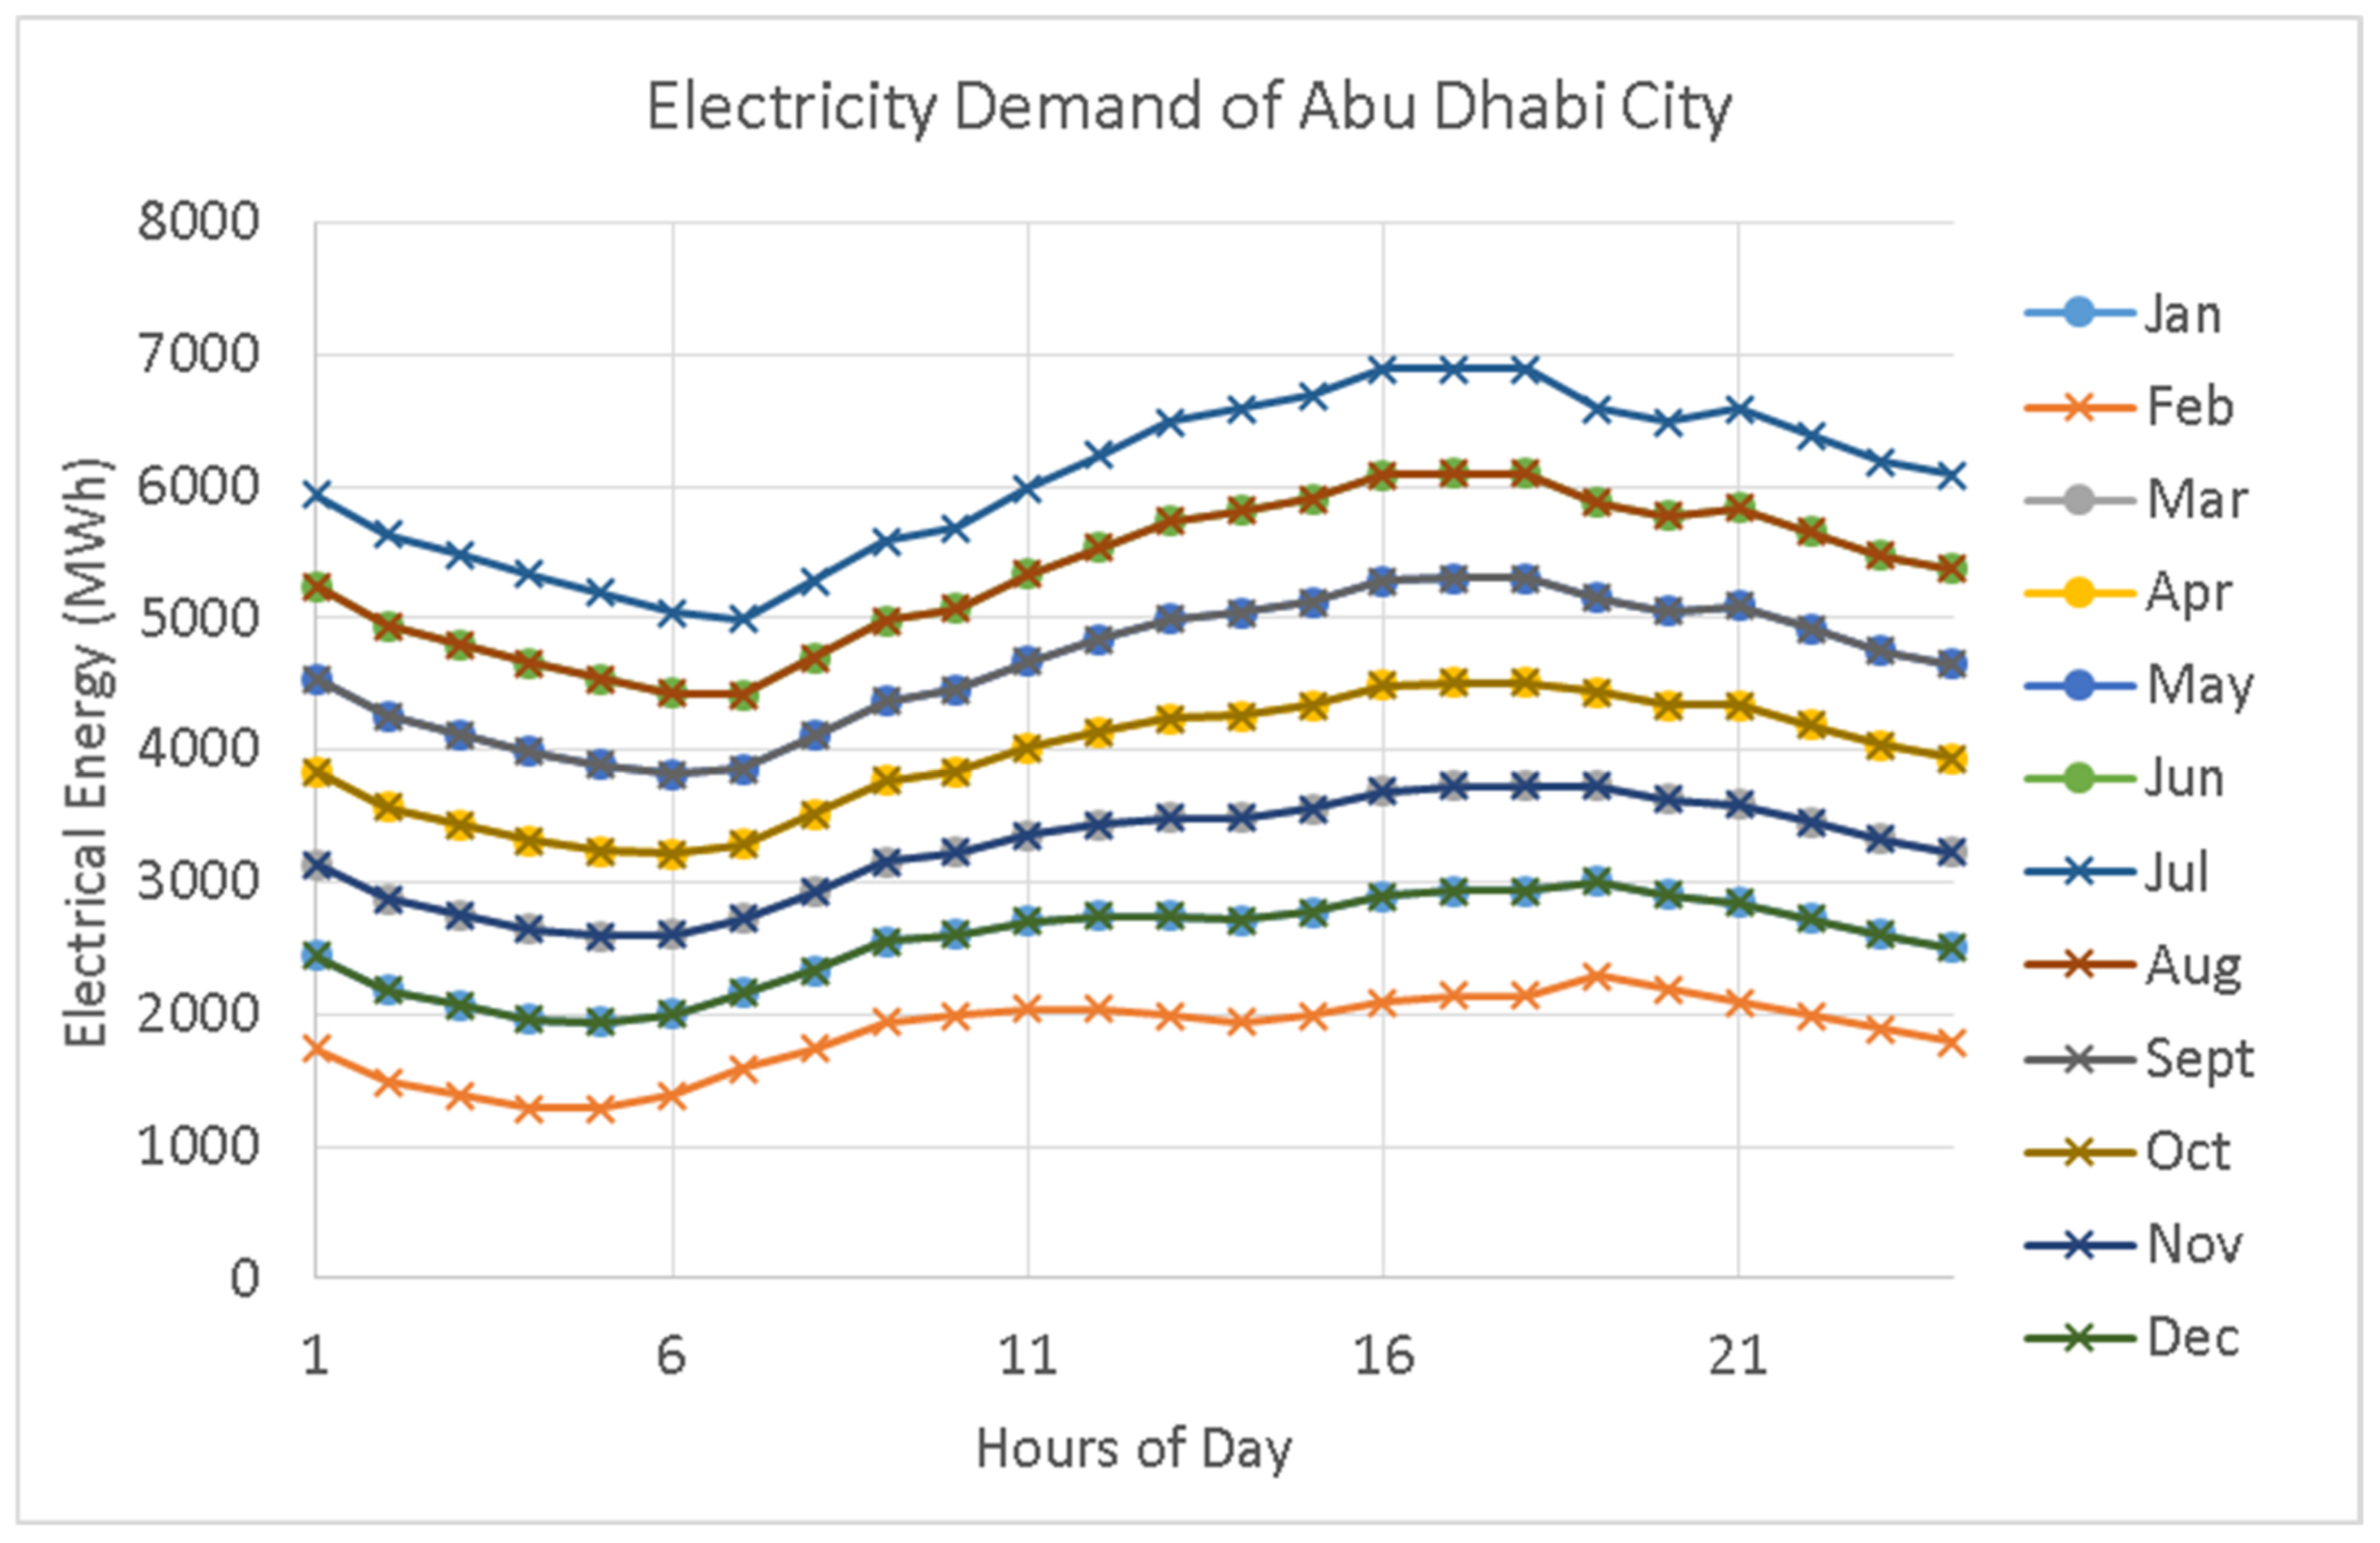
In this scenario, rooftop RET installations were utilized in order to meet electric vehicle energy demand as well as Abu Dhabi city electricity consumption. The hourly electricity demand for each month is shown in Figure 7. At least 80% of the total energy demand of buildings is attributed toward cooling systems [30]. The average afternoon temperature in Abu Dhabi ranges from 24 to 42 °C throughout the year. Thus, cooling systems are utilized all year around. As observed in Figure 7, the highest hourly electricity consumption in a day occurs at about 4 PM, whereas the highest monthly electricity consumption takes place in July, reflecting the increased usage of cooling systems in warm weather.
Case studies are as follows: Case 1: best economic option (min Cost), Case 2: best environmental option (min CO2), Case 3: to consider only PV and grid for power generation (PV only), Case 4: to consider only Concentrate Solar Power (CSP) for power generation and grid (CSP only), Case 5: to consider only wind and grid for power generation (Wind only).
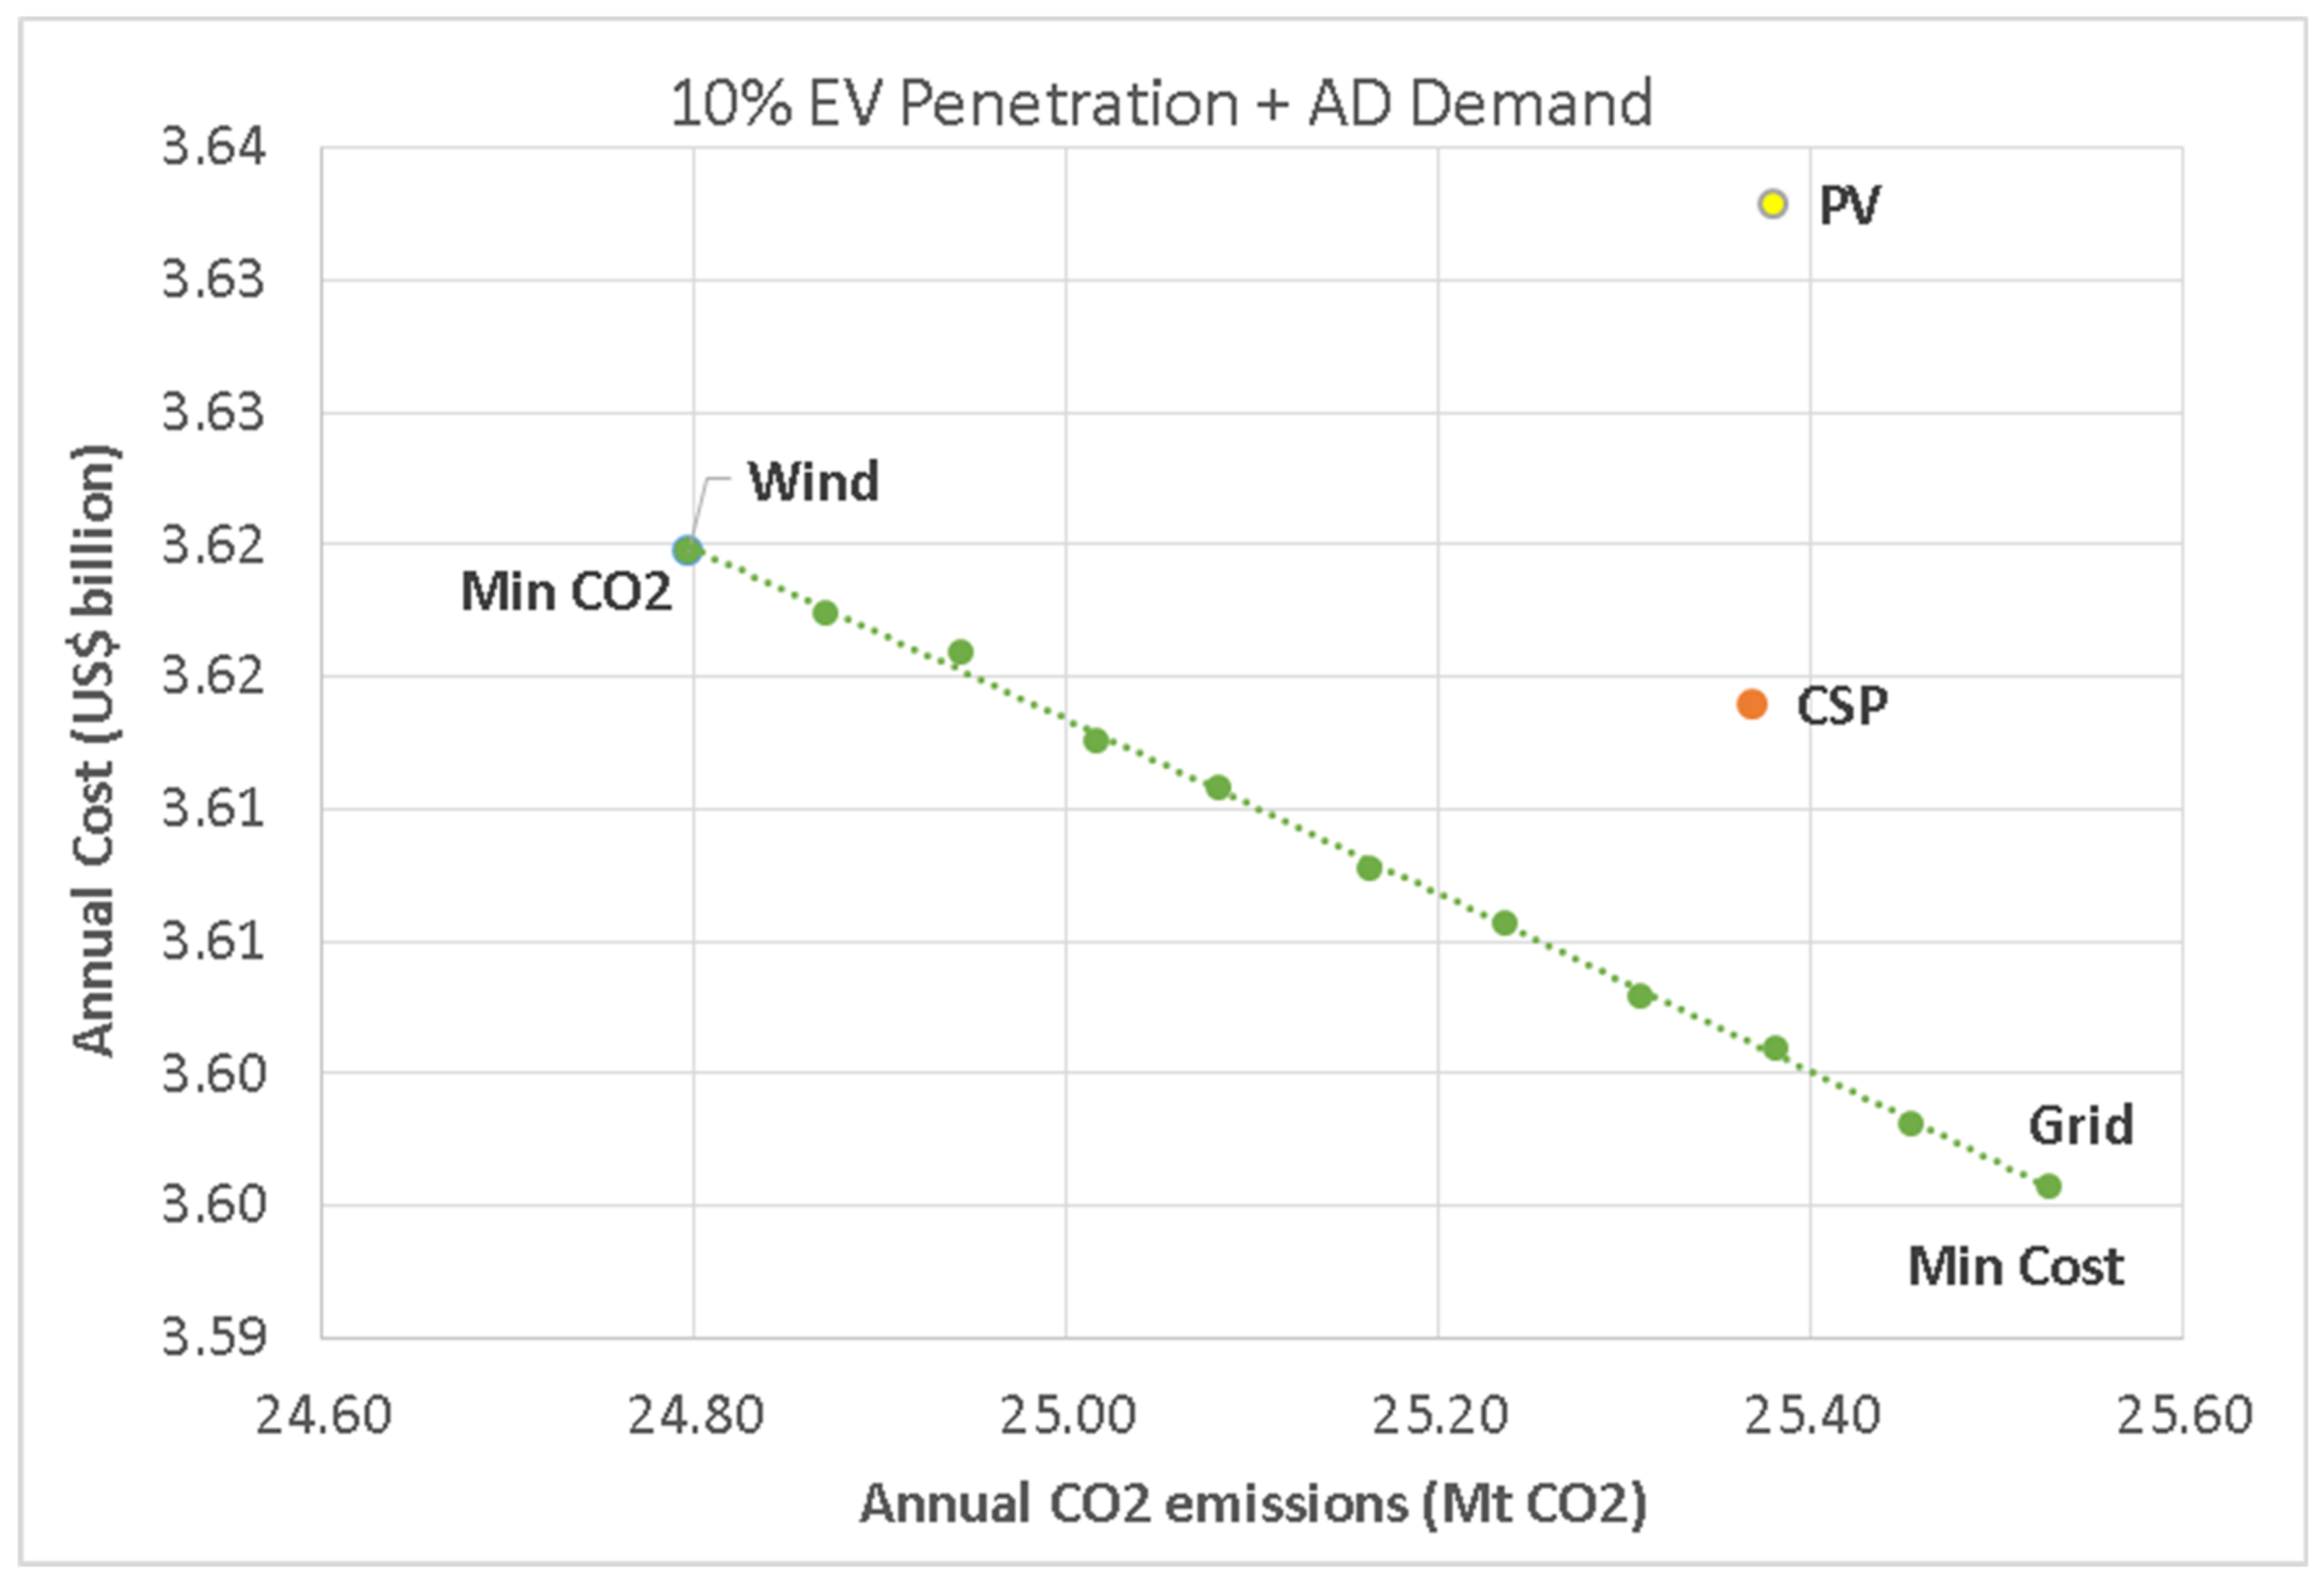
Figure 8 shows the cost incurred and the carbon emissions generated for the entire year when using different energy configuration. With the minimum carbon emissions scenario, about 730 ktonnes of CO2 are mitigated, at an additional cost of $24 million, as compared to the minimum cost scenario where all electricity is purchased from the electrical grid, as evident from Table 4. Unlike the previous case (i.e., EV demand only), most of the electricity consumed is purchased from the electrical power grid. About 3.12% of the electricity is generated via small wind turbines. A small contribution of about 23.3 MWh of electricity is made via 511 solar PV modules installed. In this study, the considered micro-CSP technology was found to be effective for sites with at least 2700 m2 available area. Moreover, dedicated charging stations with level-31 chargers were only allowed solar PV technology. This restriction was placed, as these stations are mainly surrounded with high-rise structures where small wind turbines may not prove to be efficient. Therefore, despite solar micro-CSP being a more economic option, the model suggests the installation of PV modules. For the cases of PV only and CSP only, the latter was observed to produce 16 GWh more electricity than the former.
Another observation is made when comparing the two cases, meeting EV demand only and meeting EV + Abu Dhabi city demand. It is observed that in this case, more energy is generated via renewable energy technologies even though the same rooftop area is available. This is because excess energy is not allowed by the model since no energy storage systems are considered. Therefore, in the previous case, electricity generated via wind turbines is restricted by the demand of electric vehicles. Even if more wind speed was observed during a particular hour, an amount of electricity that suffices the hourly EV demand is only generated. In this case, on the contrary, energy generated by wind turbines is used to meet Abu Dhabi (AD) demand as well. This demand is considerably much higher than the required EV demand. Consequently, the electricity generated is mainly dictated by the available wind speed rather than electricity demand. The same situation occurs for solar energy technologies. Electric power generated during sunlight hours contributes toward meeting the overall demand. Therefore, a much higher contribution of solar energy generated electricity is observed. In addition, the optimality region, lying between min CO2 and min cost, appears to be a straight line, since the demand is very high as compared to RET-produced electricity.

4.4. Scenario 3: Considering Life-Cycle Emissions of EVs

In this scenario, we study renewable energy technologies with EV demand while considering their life-cycle emissions. The United Arab Emirates takes pride in having the largest industrial battery plant in the Gulf. Moreover, it has already invested significantly in renewable energy and plans to increase the share of renewable energy. In addition, the UAE plans to explore several manufacturing industries in the future [32]. It is possible that the UAE may consider manufacturing of RET equipment and electric vehicles parts, locally, as it currently does for some ICE vehicles. Hence, life-cycle emissions of RET and EVs are accounted for in this scenario. The results obtained are depicted in Figure 9.
The general outlook appears to be very similar to the scenario where EV demand is only studied. However, comparing the minimum carbon emissions scenario with that of minimum cost, about 183 ktonnes of CO2 is mitigated annually at a cost of $8.59 million. In this particular case study, life-cycle emissions of both ICEs and EVs were considered. Since the percentage of EV penetration is considered, the resulting emissions will be offset. Nevertheless, to investigate the true impact, a detailed study on this aspect alone needs to be conducted.

4.5. Sensitivity Analysis—Market Share of EVs

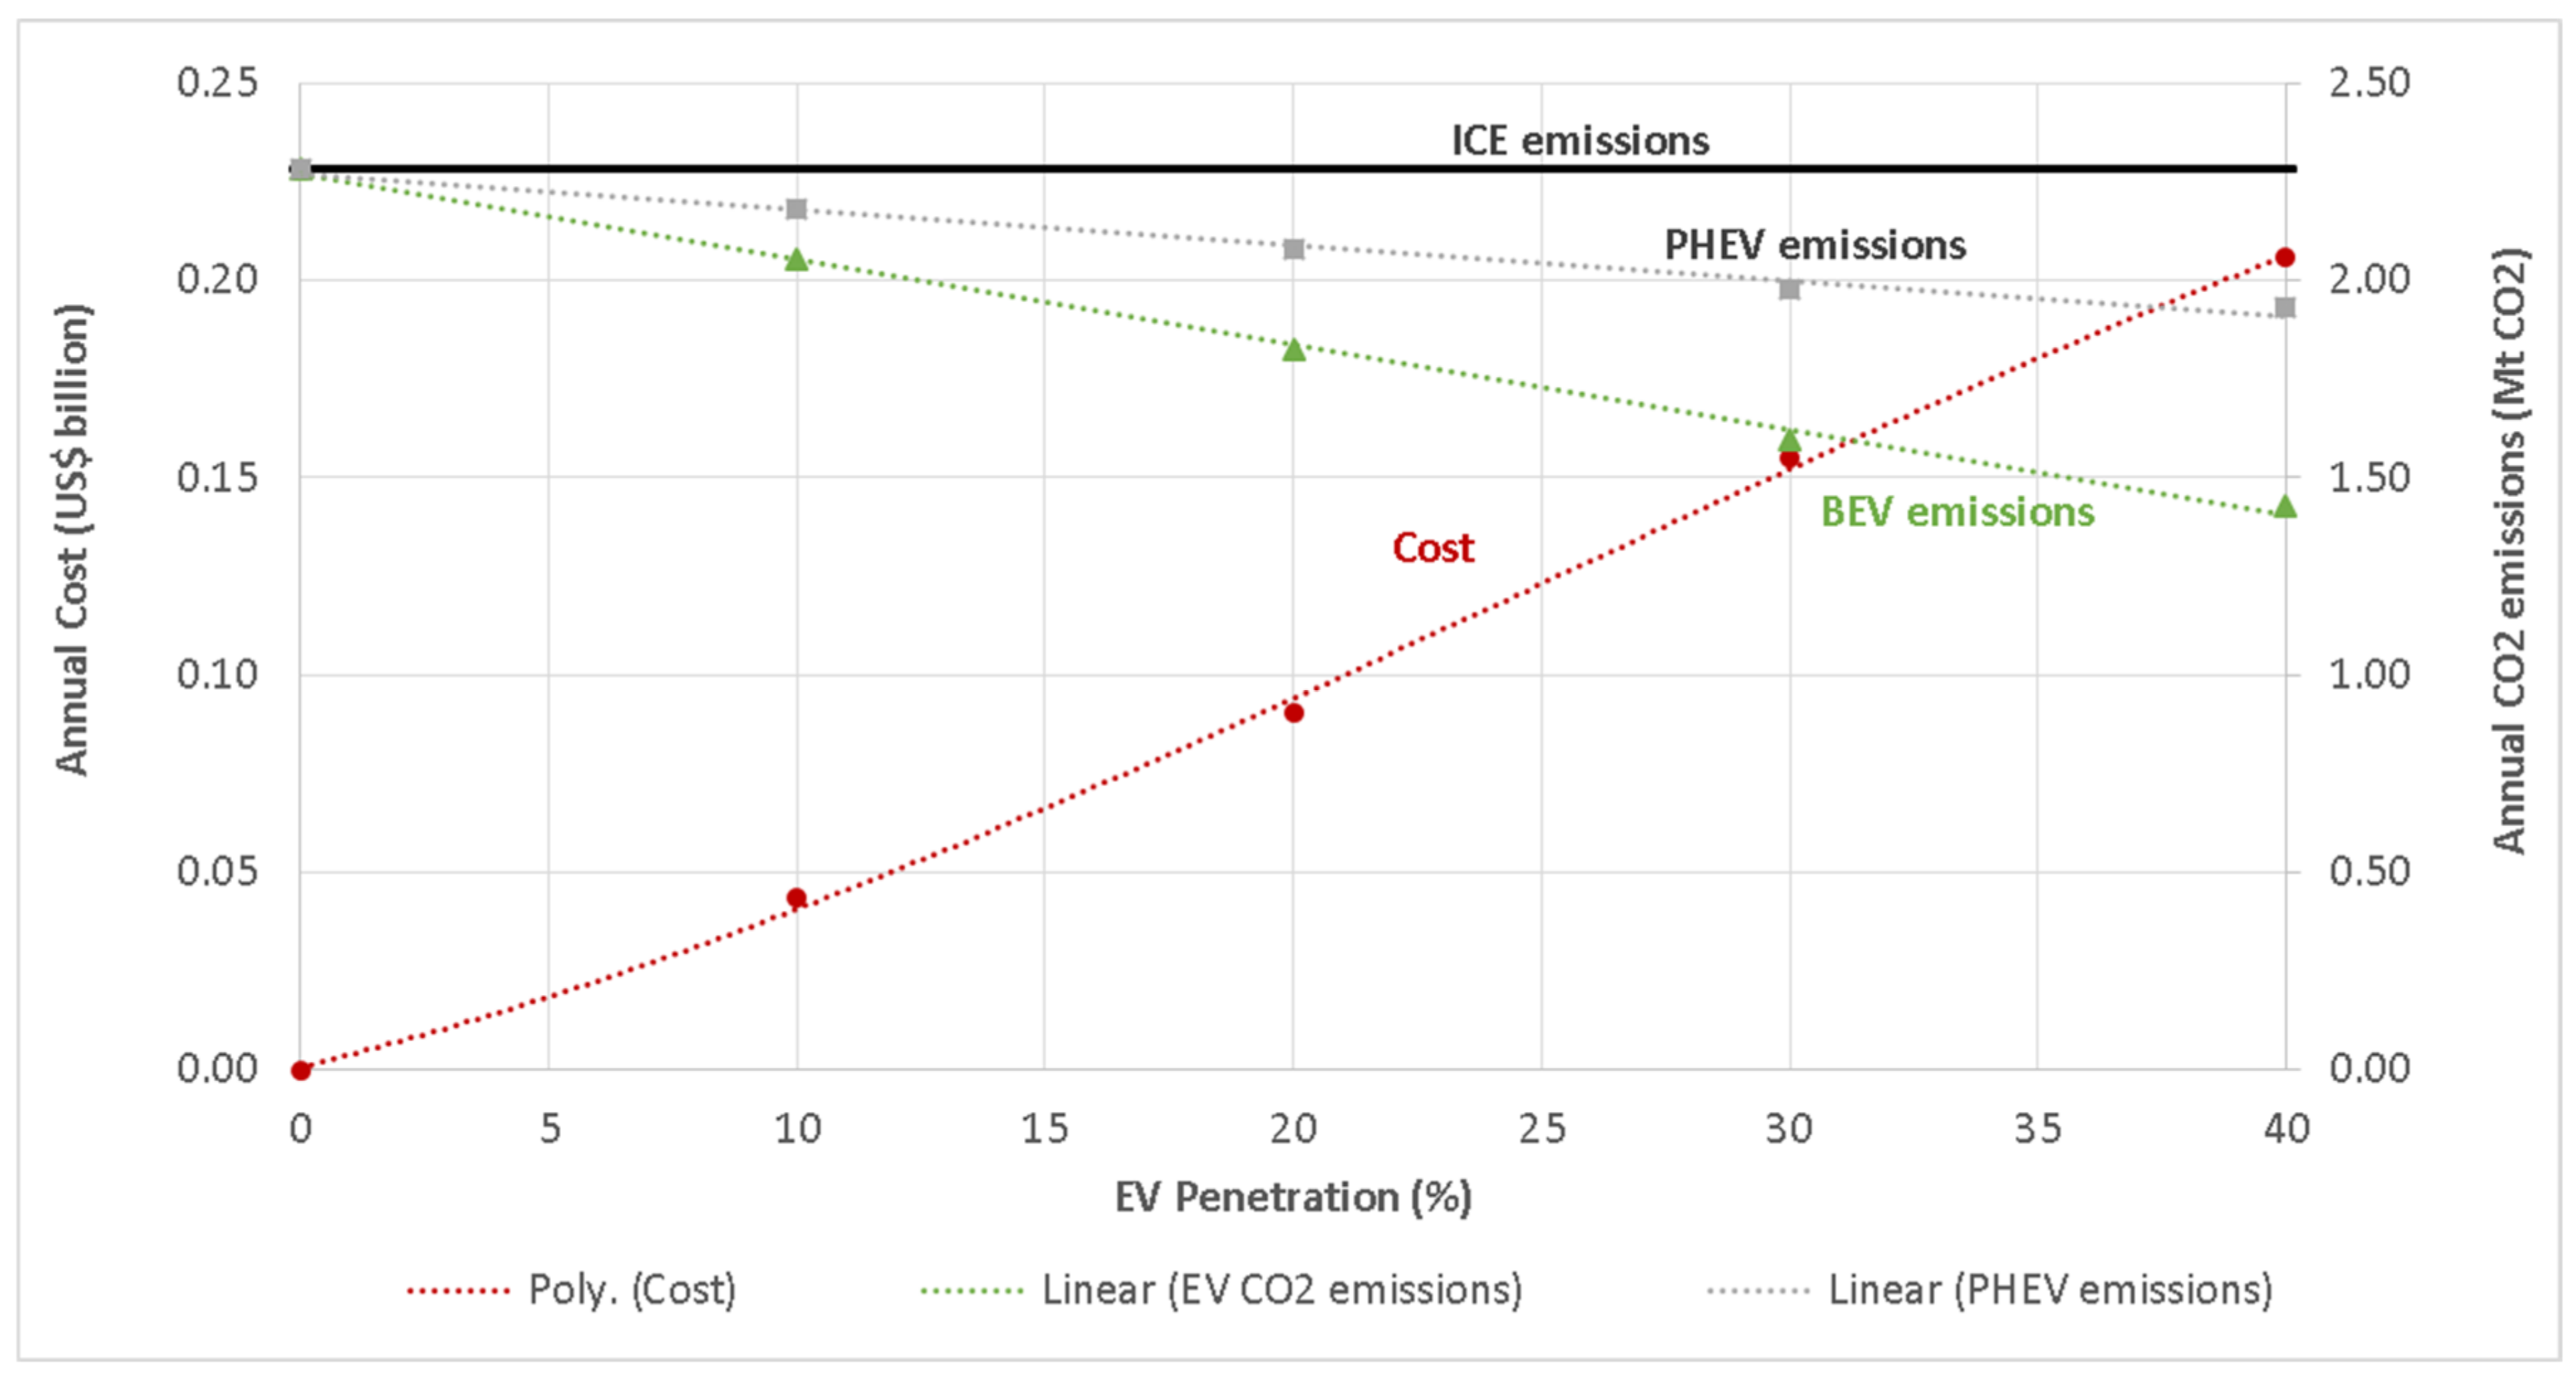
In the previous scenarios, the impact of 10% EV penetration was assumed, and annual costs and emissions were studied. In this case, a different market share of EV penetration is studied when meeting EV demand only and coupled EV-Abu Dhabi demand. Figure 10 and Figure 11 show the results obtained for each of these cases, respectively.
As observed in Figure 10, as the EV penetration increases, the annual carbon emissions mitigated increases for both, BEVs and PHEVs. Moreover, the annual cost appears to increase as a result of more RET and EV charging infrastructure installed. On the other hand, in the case of EV plus Abu Dhabi demand, the emissions generated by BEV decreases as more battery electric vehicles penetrate the transport sector. However, the annual emissions when considering PHEVs increases with increasing EV penetration. This is because, in the second case, EV charging demand is mainly met through electricity purchased from the grid. PHEVs do reduce ambient air emissions, but they increase the point sources emissions. However, due to increasing EV charging demand, the amount of electricity consumed from the grid, eventually produced through fossil fuels, increases. This leads to an increase in point source emissions from power plants. For the PHEVs option, the construction of further renewable energy projects may be planned to increase the RE share to the grid, or CCS technology may be utilized to mitigate these point source emissions.
As evident from Figure 12, as the EV penetration ratio increases, the required number of chargers increases as well. However, the number of chargers does not exceed a maximum of 108,810 for this case study. Since all chargers occupy a parking space, each charger represents an available EV parking space. These parking spaces are restricted by a minimum and maximum, as indicated in Equations (20) and (21). Therefore, a different type of charger is selected rather than adding a parking space. Initially, at a low EV penetration ratio, the results suggests the operation of dedicated charging stations where level-31 chargers (‘Super-fast DC’ public) are installed. Once the maximum is reached for these dedicated stations (i.e., 10 chargers per station), level-23 (AC home) chargers are installed. Once 20% of the transport sector comprises EVs, level-32 (DC public) and level-22 (AC public) are utilized. However, at 25%, the maximum parking spaces allocated for EVs is reached. Thus, level-23 (AC home) chargers are compromised with level-21 (AC public 3ϕ) chargers. This trend continues until no more EV penetration can occur with the same designated parking ratio, as stated in Equation (21). At that stage, since EVs would have penetrated most of the transport industry, the parking ratio can be increased in order to facilitate more chargers.

5. Conclusions

In this research work, a comprehensive study was carried out to determine the rooftop renewable energy potential for the optimal designing of an EV charging infrastructure. Using MATLAB segmentation and region analyzing tools, the average percentage difference between the actual and calculated rooftop areas was found to be 18.55%. We developed a mathematical modeling framework to optimally design Renewable Energy Technologies (RET) in the presence of electric vehicle demand using a multi-energy hub approach; two competitive objectives including the economic cost of the system and CO2 emissions are considered. Three scenarios are examined to assess the potential of RET to meet the EV demand along with the Abu Dhabi city one, while considering the life-cycle emission of RET and EV systems.
In scenario 1 (with EV demand only), the deployment of wind turbines and CSP technology for electricity generation resulted in least emissions. Yet, minimum economic cost was realized when electricity was purchased completely from the grid. In scenario 2 (with both EV and Abu Dhabi city demand), the grid majorly contributed in meeting electricity demand, whilst wind technology was considered to meet a part of this demand. In scenario 3 (with life-cycle emissions of RET and EV systems), wind technology was found to produce the least life-cycle emissions whilst realizing the least economic cost compared to other renewable energy technologies.
Sensitivity analysis on the market share of EVs was carried out to show that battery-based electric vehicles can reduce environmental impact with an increased EV market share. The number and type of chargers to be utilized under each scenario was also determined with increasing EV penetration.
Future work will be on the consideration of other storage systems in each energy hub along with the stochastic modeling of EV demands. Moreover, the characteristics of the bidirectional energy source of BEV can be reflected in future research.

Author Contributions

S.T.T.: formal analysis, investigation and datd curation; A.A.: software, resources and project administration; A.M.: validation and writing—review&editing; A.E.: writing—review&editing, superivision and funding acquisition. All authors have read and agreed to the published version of the manuscript.

Funding

This research received no external funding.

Institutional Review Board Statement

Not applicable.

Informed Consent Statement

Not applicable.

Data Availability Statement

Details regarding database can be made accessible upon reasonable request to the authors.

Conflicts of Interest

The authors declare no conflict of interest.

Nomenclature

IndicesExplanationUnit
i Type of output energy carrier
j Type of input energy carrier
t Time period
s , b Particular energy hub
Sets
I Set of output energy carriers
J Set of input energy carriers
S Set of energy hubs
T Time period (30 years)
Parameters
A s w e p t Area swept by a blade in wind turbine ( π r o t o r W T 2 ) m2
A p e r t u r e S C A Aperture of a solar collector assembling in CSP technologym
A r e a P V M o d u l e Area of a photovoltaic (PV) modulem2
A r e a m a x Maximum area allocated for energy generation technologies installations at a particular energy hubm2
C Coupling matrix
C C H Cost of a particular electric vehicle charger$
C F Capacity factor of a particular energy generation technology
C O 2 Carbon emissions associated with each energy generation technologygCO2/kWh
C R F Capital Recovery Factor
D Discount rate%
D P V Depreciated present value
D N I Direct Normal Irradiance exposed to CSP technologyW/m2
g I C E Emissions associated with each internal combustion engine (ICE) vehicle for each km of distance traveledgCO2/km
g E V Emissions associated with each battery-powered electric vehicle (EV) for each km of distance traveledgCO2/km
g P H E V Emissions associated with each plug-in hybrid electric vehicles (PHEV) for each km of distance travelledgCO2/km
k m I C E Average distance travelled by internal combustion engine (ICE) vehicleskm
k m E V Average distance travelled by battery-powered electric vehicles (EV)km
k m P H E V Average distance travelled by plug-in hybrid electric vehicles (PHEV)km
L C O E Levelized cost of electricity for a particular energy generation technology$/kWh
N e v m a x Maximum number of electric vehicles that can be charged using a particular electric vehicle charger
P a r k m i n Ratio of minimum parking spaces allocated for charging electric vehicles at a particular energy hub
P a r k m a x Ratio of minimum parking spaces allocated for charging electric vehicles at a particular energy hub
P o w e r Power rating of a particular energy generation technologyW
P R Performance ratio of a particular energy generation technology
r o t o r W T Rotor diameter of the blades of single wind turbine
T Tax rate%
S p o t s Total parking spaces available at a particular energy hub
α Matrix defining connection between energy hubs with their transmission factors
ρ a i r Density of air
Continuous Variables
C C H T Total cost of electric vehicle chargers$
C C I c a p Capital cost of electric vehicle charging infrastructure$
C C I O & M   Operating and maintenance cost of electric vehicle charging infrastructure$
C E Total annual cost associated with energy generation$
C I Total annual cost associated with electric vehicle charging infrastructure$
D e m Total energy demand by a particular energy hubkWh
g T Total annual generated emissions—objective functiongCO2
g E n e r g y Annual CO2 emissions produced from energy consumption through various technologies including renewable and non-renewablegCO2
g V e h Annual CO2 emissions produced from utilization of electric/Internal Combustion Engine (ICE) vehiclesgCO2
P Energy generated from each of the different energy generation technologieskWh
T r Energy transferred between energy hubskWh
Z Total annual cost- objective function$
Integer Variables
n E V Number of battery-powered electric vehicles (EV)
n I C E Number of internal combustion engine (ICE) vehicles
n P H E V Number of plug-in hybrid electric vehicles (PHEV)
N C S P S C A Number of solar collector assemblies (SCA) using solar concentrated power (CSP)
N P V m o d u l e Number of photovoltaic (PV) modules
N W T Number of wind turbines
n c h Number of electric vehicle chargers
N e v Number of electric vehicles charged by a particular electric vehicle charger

References

  1. Egbue, O.; Long, S. Barriers to widespread adoption of electric vehicles: An analysis of consumer attitudes and perceptions. Energy Policy 2012, 48, 717–729. [Google Scholar] [CrossRef]
  2. Dietsche, K.-H.; Kuhlgatz, D. History of the automobile. In Fundamentals of Automotive and Engine Technology; Springer Vieweg: Wiesbaden, Germany, 2014; pp. 1–7. [Google Scholar] [CrossRef]
  3. Mills, J. Test Your Knowledge: Where and When Was the World’s First Petrol Station Established. The Sunday Times, 24 July 2015. [Google Scholar]
  4. Matulka, R. The History of the Electric Car. Available online: https://www.energy.gov/articles/history-electric-car (accessed on 2 November 2022).
  5. Gerdes, J. Estonia Launches Nationwide Electric Vehicle Fast-Charging Network. Forbes, 26 February 2013. [Google Scholar]
  6. U.S. Energy Information Administration. Annual Energy Outlook 2015. Off. Integr. Int. Energy Anal. 2015, 1, 20585. [Google Scholar]
  7. Mezher, T.; Dawelbait, G.; Abbas, Z. Renewable energy policy options for Abu Dhabi: Drivers and barriers. Energy Policy 2012, 42, 315–328. [Google Scholar] [CrossRef]
  8. Graves, L. Dubai Announces New Electric Vehicle Incentives. The National, 24 September 2017. [Google Scholar]
  9. Baldwin, D. UAE Paves Way for Zero-Carbon Electric Cars. Gulf News, 18 December 2017. [Google Scholar]
  10. Yu, H.; Niu, S.; Shang, Y.; Shao, Z.; Jia, Y.; Jian, L. Electric vehicles integration and vehicle-to-grid operation in active distribution grids: A comprehensive review on power architectures, grid connection standards and typical applications. Renew. Sustain. Energy Rev. 2022, 168, 112812. [Google Scholar] [CrossRef]
  11. Shang, Y.; Liu, M.; Shao, Z.; Jian, L. Internet of smart charging points with photovoltaic Integration: A high-efficiency scheme enabling optimal dispatching between electric vehicles and power grids. Appl. Energy 2020, 278, 115640. [Google Scholar] [CrossRef]
  12. Zheng, Y.; Shao, Z.; Jian, L. The peak load shaving assessment of developing a user-oriented vehicle-to-grid scheme with multiple operation modes: The case study of Shenzhen, China. Sustain. Cities Soc. 2021, 67, 102744. [Google Scholar] [CrossRef]
  13. Bhatti, A.R.; Salam, Z.; Aziz, M.J.B.A.; Yee, K.P. A critical review of electric vehicle charging using solar photovoltaic. Int. J. Energy Res. 2016, 40, 439–461. [Google Scholar] [CrossRef]
  14. Huang, P.; Ma, Z.; Xiao, L.; Sun, Y. Geographic Information System-assisted optimal design of renewable powered electric vehicle charging stations in high-density cities. Appl. Energy 2019, 255, 113855. [Google Scholar] [CrossRef]
  15. Osório, G.J.; Gough, M.; Lotfi, M.; Santos, S.F.; Espassandim, H.M.; Shafie-khah, M.; Catalão, J.P. Rooftop photovoltaic parking lots to support electric vehicles charging: A comprehensive survey. Int. J. Electr. Power Energy Syst. 2021, 133, 107274. [Google Scholar] [CrossRef]
  16. Minh, P.V.; Le Quang, S.; Pham, M.H. Technical economic analysis of photovoltaic-powered electric vehicle charging stations under different solar irradiation conditions in Vietnam. Sustainability 2021, 13, 3528. [Google Scholar] [CrossRef]
  17. Griffiths, S.; Mills, R. Potential of rooftop solar photovoltaics in the energy system evolution of the United Arab Emirates. Energy Strategy Rev. 2016, 9, 1–7. [Google Scholar] [CrossRef]
  18. CAA, Types of Electric Vehicles. Canadian Automobile Association. 2016. Available online: http://electricvehicles.caa.ca/types-of-electric-vehicles/ (accessed on 1 August 2016).
  19. Granovskii, M.; Dincer, I.; Rosen, M.A. Economic and environmental comparison of conventional, hybrid, electric and hydrogen fuel cell vehicles. J. Power Sources 2006, 159, 1186–1193. [Google Scholar] [CrossRef]
  20. Liu, J. Electric vehicle charging infrastructure assignment and power grid impacts assessment in Beijing. Energy Policy 2012, 51, 544–557. [Google Scholar] [CrossRef]
  21. Edelstein, S. Electric Car Price Guide: Every 2015–2016 Plug-In Car Specs. Green Car Reports. 2016. Available online: http://www.greencarreports.com/news/1080871_electric-car-price-guide-every-2015-2016-plug-in-car-with-specs-updated (accessed on 2 August 2016).
  22. Morrow, K.; Karner, D.; Francfort, J.U.S. Department of Energy Vehicle Technologies Program—Advanced Vehicle Testing Activity Plug-in Hybrid Electric Vehicle Charging Infrastructure Review Novem Charging Infrastructure Review. Power 2008, 58517, 34. [Google Scholar] [CrossRef] [Green Version]
  23. CAA, Charging Stations. Canadian Automobile Association. 2016. Available online: http://electricvehicles.caa.ca/types-of-electric-vehicles/charging-stations/ (accessed on 2 August 2016).
  24. Schroeder, A.; Traber, T. The economics of fast charging infrastructure for electric vehicles. Energy Policy 2012, 43, 136–144. [Google Scholar] [CrossRef]
  25. Van Vliet, O.; Brouwer, A.S.; Kuramochi, T.; van den Broek, M.; Faaij, A. Energy use, cost and CO2 emissions of electric cars. J. Power Sources 2011, 196, 2298–2310. [Google Scholar] [CrossRef] [Green Version]
  26. Shahan, Z. Electric Car Charging 101. EV Obsession. 2015. Available online: https://evobsession.com/electric-car-charging-101-types-of-charging-apps-more/ (accessed on 2 August 2016).
  27. Ahmad, A. Abu Dhabi Population Swells. The National, 4 November 2014. [Google Scholar]
  28. Koo, C.; Hong, T.; Park, H.S.; Yun, G. Framework for the analysis of the potential of the rooftop photovoltaic system to achieve the net-zero energy solar buildings. Progress Photovolt. Res. Appl. 2014, 22, 462–478. [Google Scholar] [CrossRef]
  29. Rubin, E.S.; Davison, J.E.; Herzog, H.J. The cost of CO2 capture and storage. Int. J. Greenh. Gas Control 2015, 40, 378–400. [Google Scholar] [CrossRef]
  30. Kaul, N. The Bad Boys of Energy Consumption. Gulf News, 8 November 2017. [Google Scholar]
  31. ADWEC (Abu Dhabi Water & Electricity Company). Statistical Report 1999–2016. Abu Dhabi: ADWEC. 2016. Available online: https://www.ewec.ae/sites/default/files/documents/2016%20Statistical%20Report.pdf (accessed on 2 November 2022).
  32. Wright, I. UAE Aims to Become International Manufacturing Hub. Available online: https://www.engineering.com/story/uae-aims-to-become-international-manufacturing-hub (accessed on 2 November 2022).
Figure 1. Superstructure of electric vehicle (EV) charging and energy infrastructure.
Energies 15 09572 g001
Figure 2. Map image showing the aerial view of structures within the sample region considered in Abu Dhabi city.
Energies 15 09572 g002
Figure 3. (a) Pre-processing, (b) threshold adaptation, and (c) post-processing images depicting the rooftop area of buildings in the sample region.
Energies 15 09572 g003
Figure 4. Rooftop area calculation for the sample region within Abu Dhabi city in m2.
Energies 15 09572 g004
Figure 5. Example of unscaled areas of two structures used to calculate the percentage difference between the actual and detected rooftop area.
Energies 15 09572 g005
Figure 6. Tradeoff between annual cost and carbon emissions for each case study (different energy generation configurations) for considering 10% EV charging demand.
Energies 15 09572 g006
Figure 7. Hourly electricity demand of Abu Dhabi city for each month [31].
Energies 15 09572 g007
Figure 8. Trade-off between annual cost and CO2 emissions in different case studies for meeting both 10% EV and Abu Dhabi city electricity demand.
Energies 15 09572 g008
Figure 9. Trade-off between annual cost and CO2 emissions in different case studies for meeting 10% EV whilst considering life-cycle emissions using different energy configurations.
Energies 15 09572 g009
Figure 10. Trade-off between annual cost and carbon emissions for different EV penetration ratios when meeting EV electricity demand.
Energies 15 09572 g010
Figure 11. Trade-off between annual cost and carbon emissions for different EV penetration ratios when meeting both EV and Abu Dhabi electricity demand.
Energies 15 09572 g011
Figure 12. Number of each type of EV chargers installed for each ratio of EV penetration.
Energies 15 09572 g012
Table 1. Specifications of some electric vehicles (EV) available on the market [19,20,21].
ModelManufacturerRange (km)Price (USD)Li-ion Battery Size (kWh)Type
Cayenne S E Porsche2387,70010.8PHEV
i8BMW24150,0007.1PHEV
A3 SportbackAudi2539,5008.8PHEV
GLE550eMercedes Benz2966,3008.7PHEV
Fusion EnergiFord3431,9957.6PHEV
Optima PHEVKia4735,0009.8PHEV
Pacifica PHEVChrysler5243,09016PHEV
VoltChevrolet8533,22014PHEV
i-MiEVMitsubishi10023,48516BEV
Electric Drive Smart11025,75016.5BEV
Focus ElectricFord12229,99523BEV
Spark EVChevrolet13225,99519BEV
e-GolfVolkswagen13429,81536BEV
500eFiat14032,78024BEV
B250eMercedes Benz14042,37536BEV
Soul EVKia15032,80030BEV
LeafNissan17029,86080BEV
i3BMW18142,27533BEV
BoltChevrolet38337,49660BEV
IONIQ 5Hyundai345–448−47,65058–77.4BEV
EV6Kia41044,000–570,00058–77.4BEV
Model STesla43569,50085BEV
Clarity Fuel CellHonda58960,000-FCEV
NexoHyundai59555,000-FCEV
Table 2. EV chargers specifications [24].
Type of ChargersLevel 3Level 2
‘Super-Fast DC’ PublicDC PublicAC PublicAC Public
AC PublicAC Home
Lifetime (years)1010–1510–1510–1510–1510–15
Load limit (V)2000500400230230230
Power limit (kW)25062.5507.33.63.6
Duration of 20 kWh charge cycle (min)51924164333333
Maximum number of 20 kWh charging EV/day2887560841
Cost incl. installation (US$/kW)5851780210016001624325
Table 3. SCA: solar collector assembly, WT: wind turbines, CSP: concentrate solar power.
CasePower Generated-GWhNumber of Each Technology
PVCSPWindGridPV ModuleSCAWT
Min Cost0.000.000.00277.81000
Min CO20.0044.31233.410.09079,489131,578
PV only126.880.000.00150.932,781,67200
CSP only0.00126.880.00150.930227,6070
Wind only0.000.00233.4144.4000131,578
Table 4. The share of electricity generation for each energy generation technology and the number of RET equipment installed for each case study introduced in Figure 8.
CasePower Generated—TWhNumber of Each Technology
PVCSPWindGridPV ModuleSCAWT
Min Cost0.000.000.0034.90000
Min CO2~00.001.0933.815110611,984
PV0.220.000.0034.684,824,42700
CSP0.000.240.0034.660424,8900
Wind0.000.001.0933.8100611,984
SCA: solar collector assembly, WT: wind turbines, CSP: concentrated solar power.
Publisher’s Note: MDPI stays neutral with regard to jurisdictional claims in published maps and institutional affiliations.