Review

Local Charge Carrier Dynamics for Photocatalytic Materials Using Pattern-Illumination Time-Resolved Phase Microscopy

Department of Applied Chemistry, Chuo University, Tokyo 112-8551, Japan
*
Author to whom correspondence should be addressed.
Energies 2022, 15(24), 9578; https://doi.org/10.3390/en15249578
Submission received: 26 November 2022 / Revised: 8 December 2022 / Accepted: 13 December 2022 / Published: 16 December 2022

Abstract

:
We showed two demonstrations of the local charge carrier dynamics measurements of photocatalytic materials using our recently developed time-resolved phase-contrast microscopic technique combined with the clustering analyses. In this microscopic time-resolved technique, we observed the charge carrier dynamics via the refractive index change instead of the luminescence or absorption change, where we could often observe non-radiative charge carrier processes such as charge carrier trapping and non-radiative relaxation. By the clustering analyses of all the pixel-by-pixel responses, we could extract various different charge carrier dynamics because photocatalytic materials have inhomogeneity on surfaces and the charge carrier behavior depends on the local structure and species. Even for typical photocatalytic materials, titanium oxide and hematite, we could recognize various charge carrier dynamics, which cannot be differentiated by the general fitting procedure for the averaged time response. We could categorize the surface-trapped charge carriers (holes and electrons) and bulk carriers in the nanosecond to millisecond order, which indicates that this analytical procedure will play an important role in understanding the charge carrier dynamics for various photocatalytic materials.

1. Introduction

Water splitting using sunlight energy is a promising way to generate green hydrogen for future energy demand [1,2,3,4,5,6,7,8,9,10]. Much effort has been devoted to searching for new materials, and various semiconductor materials were proposed as candidates; TiO2, a-Fe2O3, BiVO4, SrTiO3, and C3N5 [11,12,13,14,15,16,17,18,19,20,21,22,23,24]. The overall efficiency for the photocatalytic water splitting depends on various physical properties and, obviously, absorption for the broad wavelength region in the sunlight spectrum is necessary for generating photo-excited charge carriers. After photoabsorption, the photo-excited charge carriers must be separated into electrons and holes (charge separation), and each charge carrier has to be transferred to the outer circuit, for which the recombination and the trapping to surface and defect states should be reduced. These various kinetic processes of the charge carriers could be understood by the time-resolved measurement techniques.
Typical time-resolved techniques for studying charge carrier dynamics are time-resolved photoluminescence (TP) [25,26,27,28,29,30,31], transient absorption (TA) [19,32,33,34,35,36,37,38], and time-resolved microwave conductivity (TMC) [39,40]. TP has a higher sensitivity to photo-excited charge carriers, but non-radiative processes such as non-radiative recombination and charge carrier trapping cannot be detected. TA is a general method for observation of the photo-excited charge carriers, but the sensitivity was not sufficiently high for detection, and the selection of the wavelength is sometimes difficult. TMC provides information on the mobile charge carriers but not on the trapped charge carriers. There are advantages and disadvantages for each method, and each method has been used based on its purposes and availability.
From a different point of view, a photocatalytic substrate is prepared by calcinating source particles or reacting precursor solutions on a substrate, and they usually have a rough surface. The contact area of the photocatalytic surfaces is usually inhomogeneous with full of surface and defect states, causing the trapping of photo-excited charge carriers from the conduction and the valence bands. This is the reason why the charge carrier dynamics for photocatalytic materials are usually different from the single crystalline materials. A typical example can be found for a well-known photocatalytic material, TiO2 [41,42,43,44]. The different behavior of the charge carriers is due to the surface/interface states, and their spatial dependence must be understood.
For this purpose, TP [39,45] and TA microscopy [46] have been used with a spatial resolution of charge carrier dynamics. However, TP microscopy could not detect non-emissive charge carriers, and it is unfavored because the trapped charge carriers for photocatalytic materials usually do not give light emission. The TA microscopy is a useful tool, but each local position needs to be measured by the pump-probe method with surface scanning. This is mostly for the improvement of the signal quality, and the observed time region is limited until the nanosecond order. Additionally, the microscopic scanning measurements need an adjustment at each spot, which makes it difficult for a rough surface.
We have developed a time-resolved pattern-illumination phase microscopy (PI-PM) method for the study of the spatial dependence of the charge carrier dynamics [47]. In this method, a microscopic time sequence of photo-excited charge carriers is observed via the refractive index change using the phase-contrast imaging. The refractive index change is caused by the density change of photo-excited charge carriers, and the charge carrier dynamics were observed with a microscopic resolution and with a high time resolution. The information obtained via the refractive index changes is different from that obtained by TA and TP methods, and non-radiative responses such as charge carrier trapping and interfacial charge transfer have been frequently observed in the photovoltaic and photocatalytic processes, compared with the TP and TA methods [48,49].
In the PI-PM method, two types of informatics calculations are used in the image recovery and the following analysis. Since it is a pump-probe technique for obtaining a time-resolved image, the image has a large fluctuation due to the stability of the pulse light. The image sequence data (three-dimensional data (space and time)) are recovered by the three-dimensional total variation regularization [50] which has been applied for the recovery of the noisy image sequence in the microscopic biological observation. In the analysis of the data, the temporal responses at all the pixels (>10,000) in a PI-PM image sequence are categorized in terms of the local charge carrier responses by the clustering analysis. The response shapes are compared, and the similarity is used for the categorization of the types of charge carriers. The category map of the types of charge carriers could reveal the position-dependence.
In this study, we applied the PI-PM method to study the local charge carrier dynamics of typical oxide semiconductor materials; TiO2 and α-Fe2O3. The charge carrier dynamics were studied with/without scavengers, and dynamics were assigned. Even for these common materials, multiple responses for electrons and holes were found, and these issues must be reconsidered for many photocatalytic materials.

2. Materials and Methods

2.1. Preparation of TiO2 and α-Fe2O3 Films

TiO2 substrates were made with a paste of the TiO2 powder (P25, AEROXIDE). P25 powder (0.1978 g) and ethanol (80.0 μL) were ground for 1 min in a mortar, and this process was repeated 15 times. Ethanol (5.0 mL), α-terpineol (1.9602 g), and ethyl cellulose (0.1097 g) were added and stirred for 10 min. The mixture was finally evaporated to remove the ethanol and finish the P25 paste. The P25 paste was coated on a glass substrate with the doctor-blade technique with a spacer of 5 μm. It was sintered at 450 °C for 2 h. α-Fe2O3 substrates were prepared by a solution-derived method. An FTO substrate (2 × 3 cm2) was used as a substrate. It was immersed in a precursor solution of hematite (0.15 M FeCl3 aq. and 1 M NaNO3, (Wako)) for 1 h at 100 °C. It was sintered at 650 °C to convert it to hematite.
A liquid layer on a film was prepared by putting another glass slide together with a silicon rubber spacer (thickness: 0.5 mm). Acetonitrile (ACN), ethanol (EtOH), and 0.1 mM nitrobenzene (NB)/EtOH was inserted into the gap. ACN was used as an inert liquid, indicating no charge transfer from photocatalytic materials to the liquid side [48], otherwise, photo-excited electrons are scavenged by oxygen in air or solutions. EtOH was used as a hole scavenger, and NB/EtOH was used as an electron-and-hole scavenger. We revealed that NB was converted into nitrosobenzene in the photocatalytic reaction [51], under the hole scavenging condition (in ethanol). This means that nitrobenzene works as an electron scavenger and ethanol works as a hole scavenger. We could not find an optimal scavenger that works only for electrons under the pulse-light illumination condition. A typical electron scavenger, Ag+, was photo-reduced to form nanoparticles on the substrates, which affected the signal response, and Fe3+ cannot be used because it is a colored solution for the pump light.
The sample analytical data were shown previously [52]. The SEM images for TiO2 and Fe2O3 substrates are shown in Figure S1 in Supporting Information (SI). Typical sizes of the TiO2 and Fe2O3 particles on the surfaces were 50–100 and 100–200 nm in diameter and 5 μm and 500 nm in thickness, respectively.

2.2. PI-PM Method

The PI-PM method and the following clustering analysis were used for studying microscopic charge carrier dynamics, and the basic principle of this technique is described in previous papers [53], and the optical configuration is shown in Figure S2 in SI. A pump light (355 nm, ~1 mJ/cm2) pattern is illuminated on a sample for the photo-excitation of charge carriers. Photo-excited charge carriers are generated and decay in time due to the charge trapping, recombination, and transfer to the liquid side. The distribution of the photo-excited charge carriers is observed via the refractive index change by the phase-contrast imaging. The refractive index change is proportional to the density change (∆N) due to the photoexcitation. The refractive index was imaged by the self-imaging technique, where the refractive index change is converted to the intensity image by a minor defocusing. The theoretical background is described in the following papers [54]. In this setup, we could differentiate the changes in the absorption change and the refractive index change by adjusting the focus position. At the focus position, only the absorption change could be observed. We did not observe any detectable absorption change for the samples used in this study, and image contrast is only given by the refractive index change. The pattern-illumination is preferable for applying image recovery calculations, and we utilized various image recovery techniques, such as robust principal component analysis (RPCA) [54], the least absolute shrinkage and selection operator (LASSO) [55] and total validation regularization [50], as described in a different paper [56]. In this study, the image quality was recovered by the three-dimensional total variation regularization for the data, consisting of a sequence of images in time [50]. The full image size was 480.8 × 93.9 µm2, corresponding to 1024 × 200 pixels.
In the image sequence data, responses >10,000 are contained in all the pixels of images. The responses are categorized into several groups based on the similarity of the responses. The similarity was represented by the Euclidian distance between all the pairs of responses. The similarity matrix was analyzed with the eigenvalue analysis to categorize into groups. The average response in each category was obtained by averaging the responses in each category, and the category was mapped out on the same surface image to compare the category types of the charge carriers and the surface structure. In the clustering analysis, the rectangle regions, 19 × 46 µm2 and 25 × 60 µm2 for TiO2 and Fe2O3, respectively, were used for analysis.

3. Results

3.1. Charge Carrier Dynamics of a TiO2 Particulate Film

Time-resolved image sequences for a TiO2 particulate film in contact with three types of solvents (ACN and EtOH, and NB/EtOH) were measured in the same region by the PI-PM method. Figure 1a–c shows partial regions of the time-resolved images of the refractive index change (0 ns–100 µs). The pump light pattern on the sample is drawn at the bottom of Figure 1 (Black region: irradiated region). The photo-irradiated regions showed an inhomogeneous contrast just after the photo-excitation, and the contrast became strongest around 500 ns–1 μs, followed by a decay until ~10–100 μs. Compared with the contrast change in different solvents, no apparent difference was recognized directly from the image sequences. The average response in the whole region was calculated by averaging the image intensities at all the pixels in the light-irradiated regions (Figure 1d). The signal intensity increased and peaked around hundreds of nanoseconds, and they decayed around ~100 μs. Compared with the response in ACN, the response in EtOH and NB/EtOH was delayed for both the rising and decaying parts. However, each process was still not clear from the average response, and we made the clustering analysis for local regions.
In the previous papers [49,56], particulate films often showed a response with a rising response in the order of nanoseconds in the refractive index change, followed by a decay in the order of microseconds. For TiO2 particulate films, the rising response with hundreds of nanoseconds was assigned due to the charge carrier trapping to the surface states, and the following decay corresponds to the recombination of charge carriers and the thermal diffusion, extending to the millisecond order.
Three regions were analyzed by the clustering analysis in Figure 2. (the regions were indicated in Figure 1 at the bottom). One of the results is shown here (the other two regions are shown in Figures S3 and S4 in SI and the general tendencies were similar in every region). In ACN, we could find four categories in the responses; a single rise-and-decay with the rise and decay time constants of ~150 ns and ~1 μs (red), a single valley type of response with fall and recovery time constants of ~30 ns and ~2 μs (blue), and two separated rise-and-decay responses with the first rise and decay time constants of ~5 ns and ~40 ns and the second rise and decay time constants of ~1 μs and ~15 μs (green) and no response (black).
By introducing the hole scavenger, EtOH, two obvious changes in the dynamics were observed. Firstly, the second rise-and-decay in the green response was lost. Secondly, the ratio of the red response increased (11 to 33 %), and also the rise-and-decay response was delayed (1 to 3.5 μs). Considering that these changes were caused by the hole scavenger, the second rise-and-decay in the green response was due to the surface-trapped holes with a lifetime on the microsecond order. The red response was related to the electrons because the number of the survived electrons could increase by a decrease in the holes. The delay in the response was reasonable because the recombination process was delayed due to fewer available holes.
The addition of NB as an electron scavenger could totally diminish the region with the green response. Additionally, the ratio of the red response for NB/EtOH was slightly decreased, compared with that for EtOH (refer to area ratios of Category 1 for Regions 1–3). This indicates that the first rise-and-decay of the green response corresponds to the electrons used for the NB reduction. However, the electrons of the red response were reduced only slightly. It was considered that the first rise-and-decay of the green response (~40 ns) corresponds to the electrons at the conduction band, which had a higher reduction ability than the electrons observed in the red response. Since the red response showed an increase in the order of hundreds of nanoseconds, which was assigned to the charge trap process to the surface states, it indicates that the red response corresponds to the surface-trapped electrons. Due to the lower reduction ability, they were only slightly scavenged by NB. It is interesting to note that the green response includes both the conduction electrons and the surface-trapped holes. The surface-trapped holes were generated only where the conduction electrons were excited effectively. One of the possibilities is that the remaining holes after the decay of the conduction band electrons could trap to the surface states.
The blue response did not change the response shape nor the ratio of the region by introducing the scavengers. Since they decayed in the order of tens of microseconds, it was supposedly due to the thermal response caused by the release of heat from the photo-excited charge carriers.
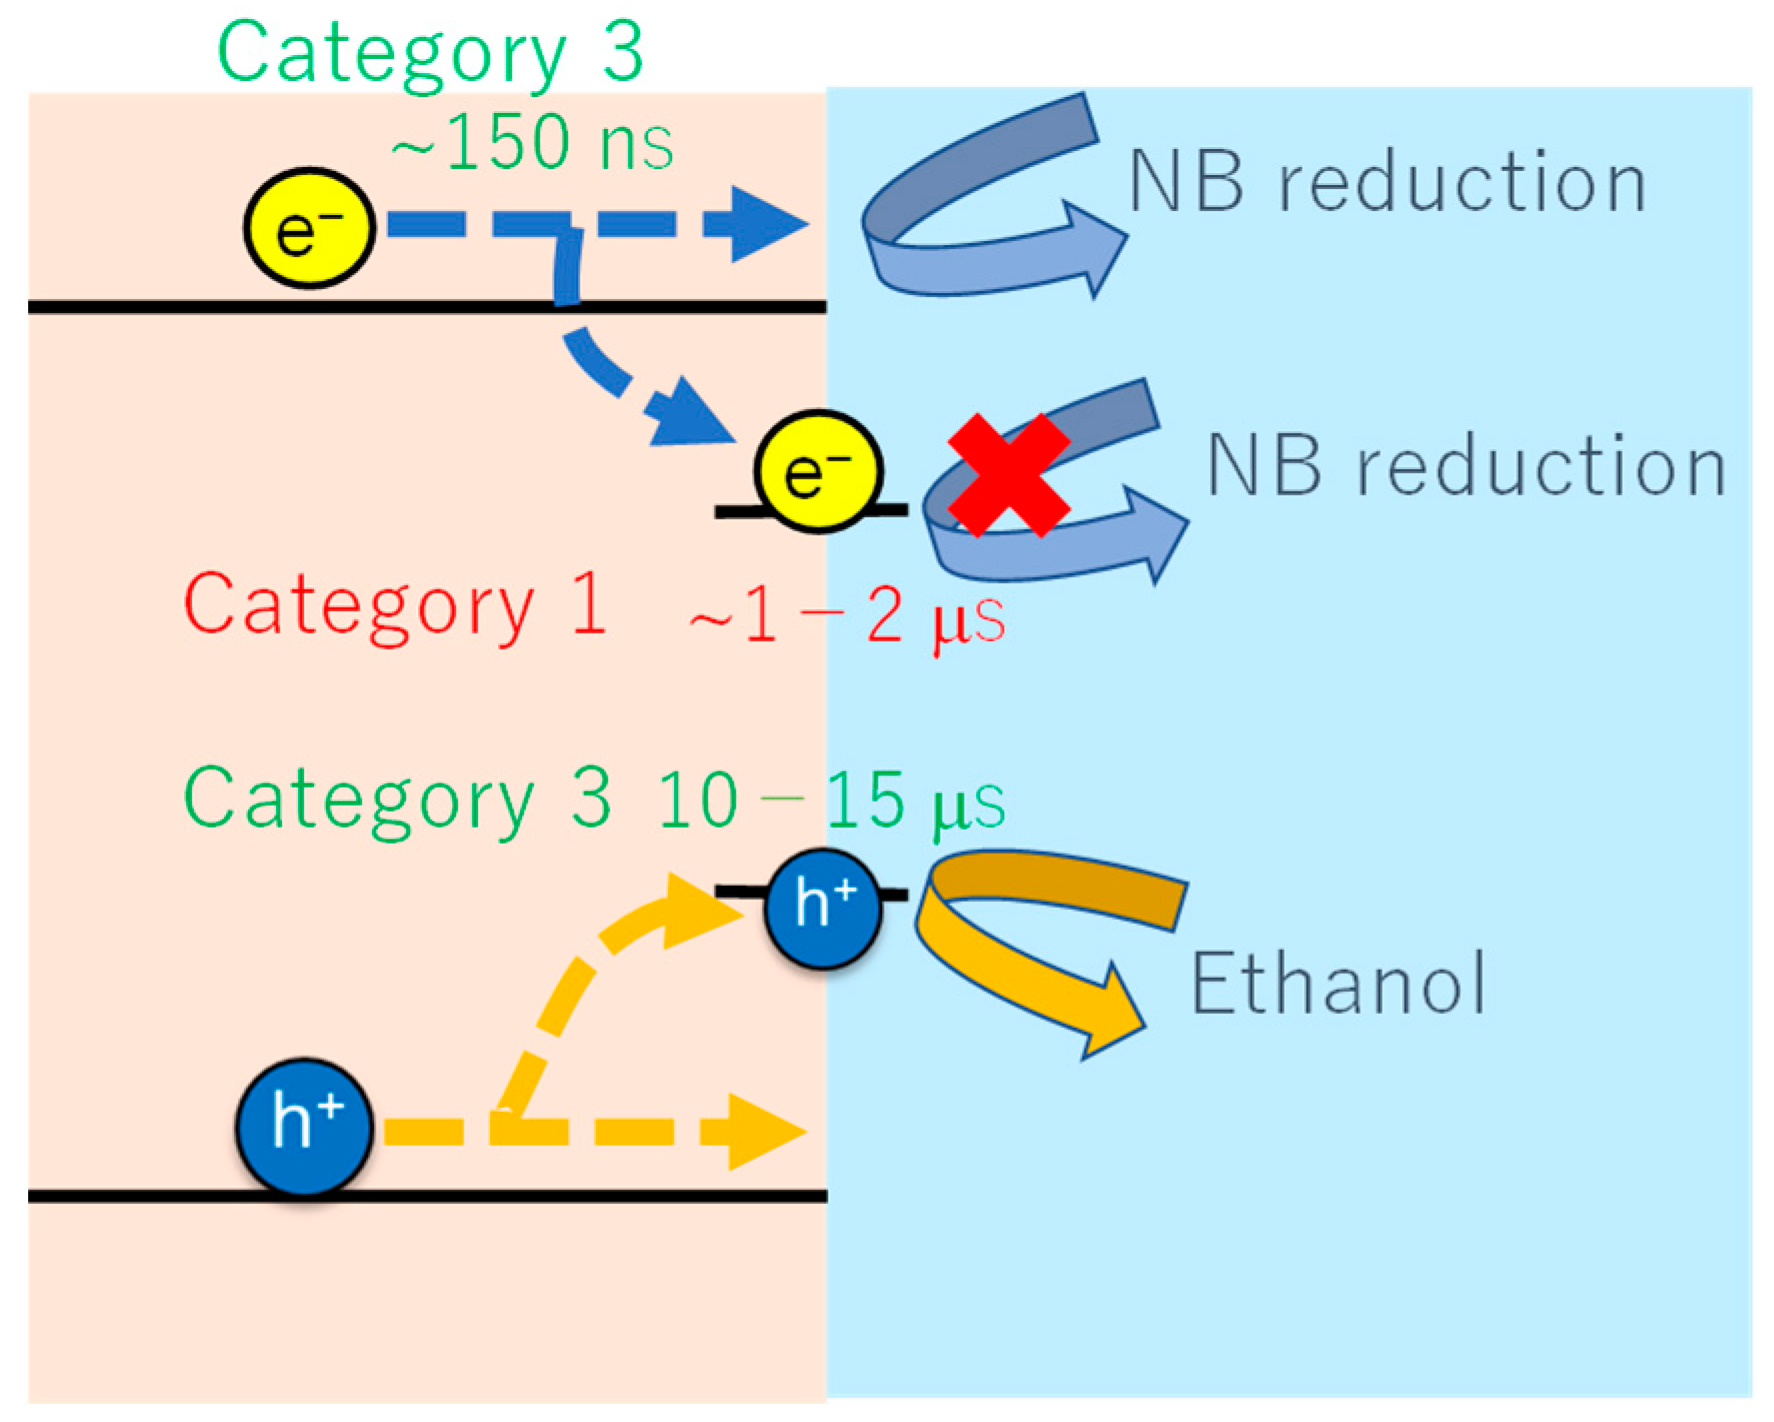
In short, we could recognize four types of response by the clustering analyses of the particulate TiO2 films; electrons at the conduction band (~150 ns), surface-trapped electrons (~1 μs), surface-trapped holes (~15 μs), and thermal response (~2 μs). The summary diagram is provided in Figure 3. The surface-trapped holes were scavenged by ethanol. The electrons in the conduction band can reduce NB, but the surface-trapped electrons do not have the ability to reduce it.

3.2. Charge Carrier Dynamics of an Fe2O3 Film

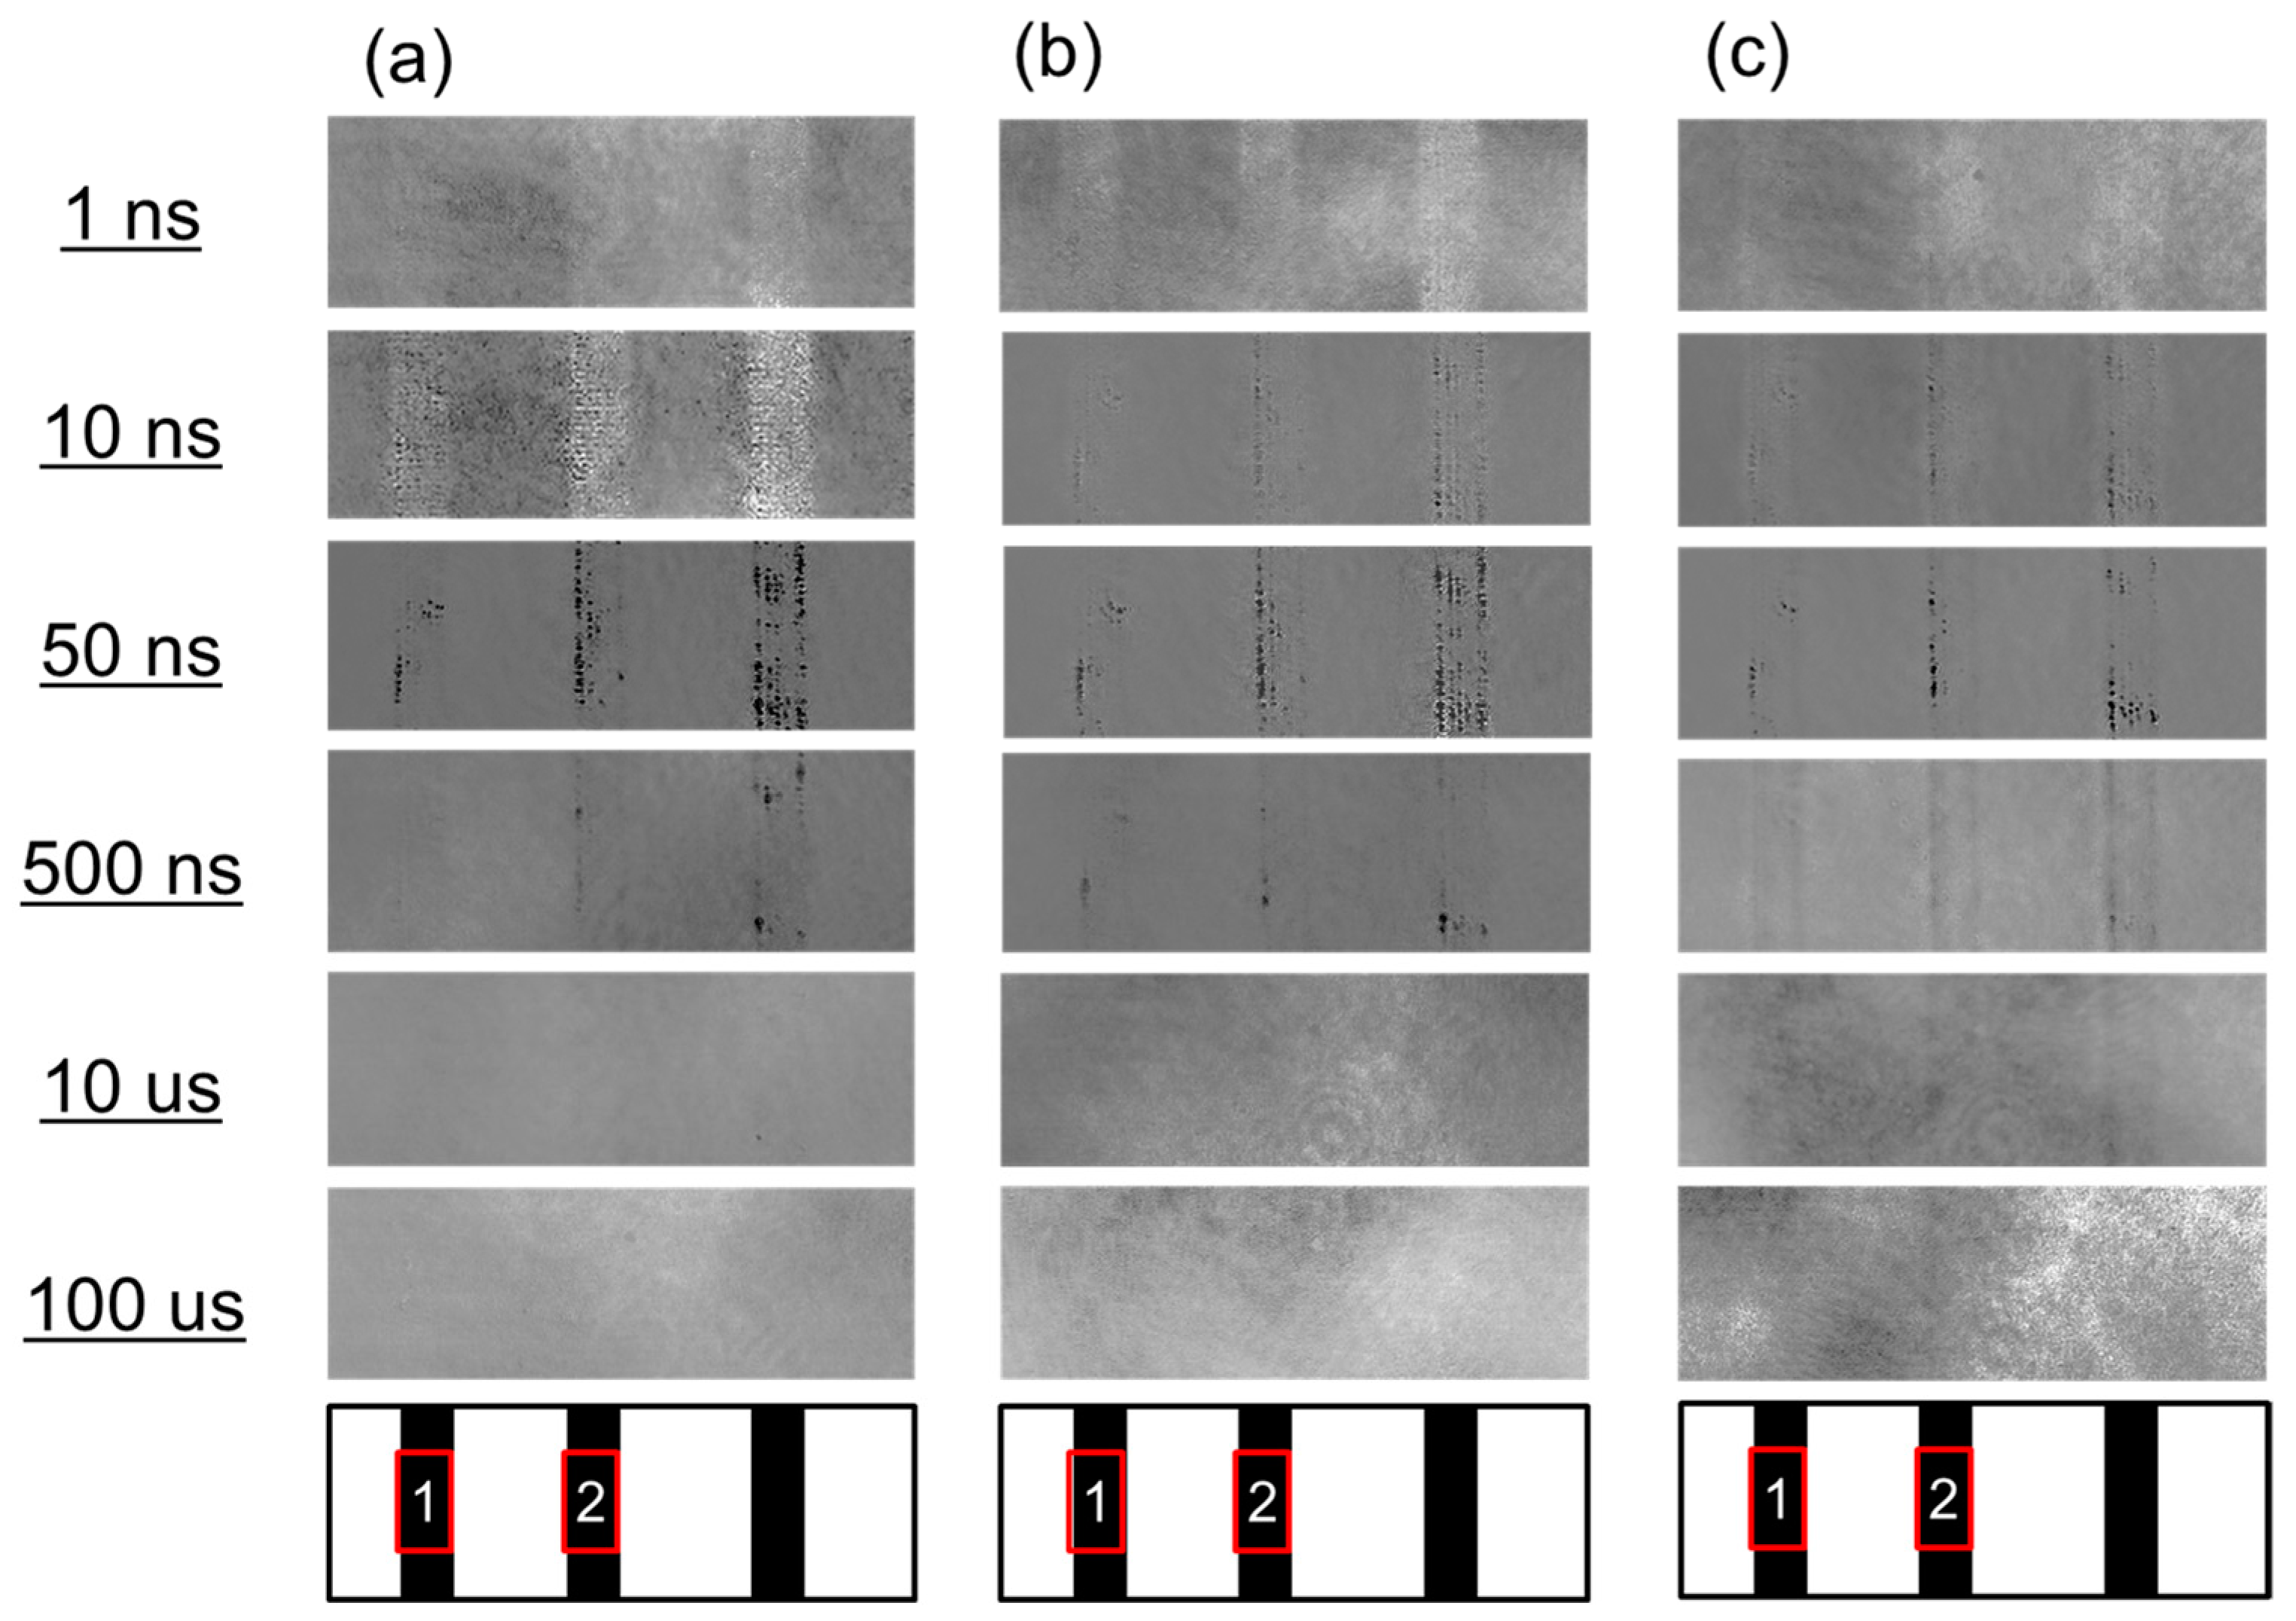
Time-resolved image sequences for an Fe2O3 film in contact with three types of solvents (ACN, EtOH, and NB/EtOH) were measured in the same region by the PI-PM method. Figure 3a–c show partial regions of the time-resolved images of the refractive index change (0 ns–100 µs). The pump light pattern on the sample is drawn at the bottom of Figure 3. The photo-irradiated regions showed an inhomogeneous contrast from 1 ns followed by an unclear increase/decrease, and decayed until a few hundreds of nanoseconds. It seems that a positive (whitish) contrast was apparent in ACN until around 10 ns, compared with those in EtOH. However, the final decay time was <500 ns for all the solvents.
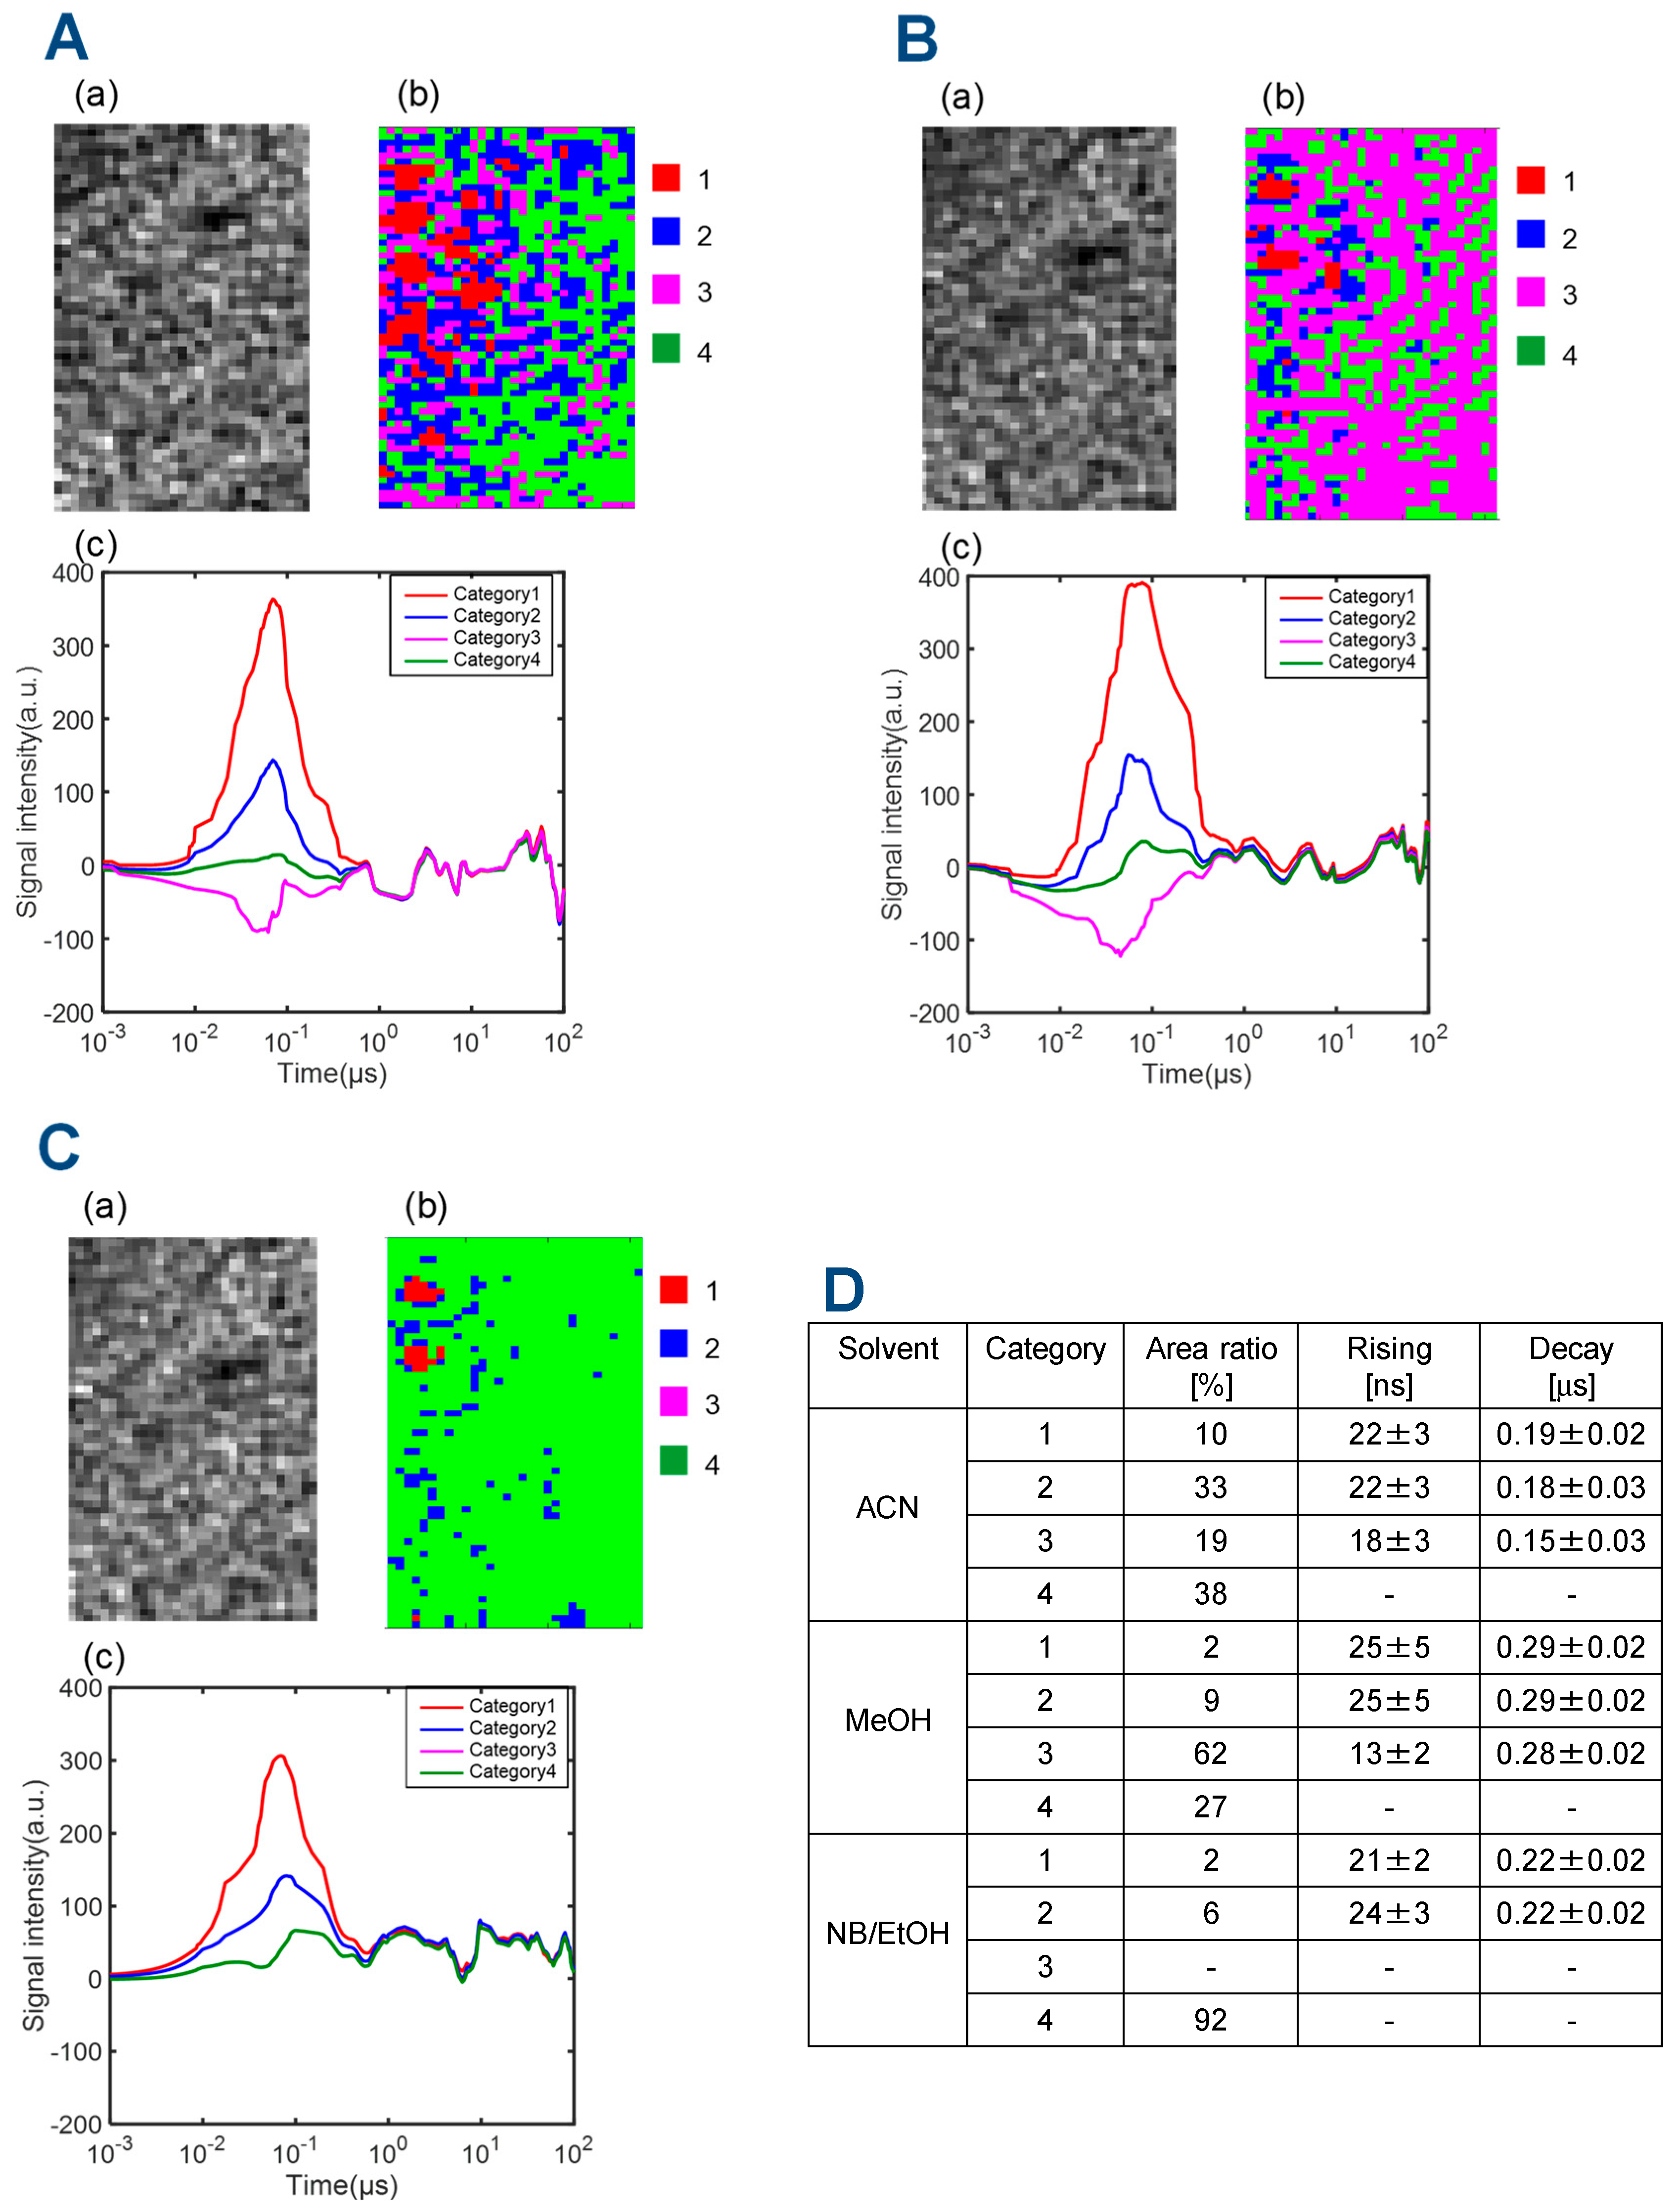
To make an assignment of charge carrier dynamics, the clustering of the charge carrier dynamics for Figure 4 was studied. Figure 5 shows the categorized maps of the charge carrier responses of α-Fe2O3 film in region 1 of Figure 4. We recognized four types of responses in α-Fe2O3 film in ACN; a positive-strong response (Category 1), a positive response (Category 2), a negative response (Category 3), and no response (Category 4) were categorized. The ratio of the four categories in this region was 10, 33, 19, and 38 %, respectively. When the solvent was changed to EtOH, the categories were the same as those in ACN, but the ratio drastically changed; 2, 9, 62, and 27 % for the four categories. The positive responses (Categories 1 and 2) were reduced and changed into negative responses (Category 3). (The difference between Category 1 and 2 is only the intensity difference, corresponding to the density difference of the photoexcited carriers.) This result clearly indicates that the positive response was due to photo-excited holes, which were scavenged by EtOH. By replacing the solvent with NB/EtOH, the negative response (Category 3) could not be detected, and only Categories 1, 2 and 4 were recognized. However, it is noted that most of the signals were lost and changed into no response (Category 4), judging from the ratio of the categories; 2, 6, 0, and 92%, respectively. From the effect of the electron scavenger, the negative response (Category 3) was due to the electron response. It is noted that the electron response showed a faster response than holes (the negative response showed an initial decrease around a few nanoseconds, while the positive response started to increase after 10 ns.).
The results for the other region are shown in Figure S5 in SI. The general tendency was similar; four categories of the responses were recognized with two positive responses, a negative response and no response. The ratio of the positive responses was scavenged and reduced by EtOH and changed into a negative response. With the addition of NB in EtOH, the negative response regions were almost lost. These results also support our assumption that the positive responses were due to photo-excited holes and the negative response was due to the photo-excited electrons. It seems that the photo-excited electrons appeared faster around a few nanoseconds, almost the same as the pulse width, and the holes were observed after 10 ns. Both of the responses decayed within a few hundred nanoseconds. The rise-and-decay (positive) and fall-and-recover (negative) responses were assigned due to the charge carrier trapping to the surface states based on the slow rising/falling responses on the order of nanoseconds. It was effectively shown in the previous study that it takes time for the photo-excited charge carriers to reach the surface states during the diffusion for photocatalytic particulate films [49]. Thus, it is supposed that the rising and falling parts for the positive and negative responses correspond to the hole and electron trapping to the surface states. The faster response for the electrons indicates that photo-excited electrons at the conduction band could reach the surface states faster than the holes did in the case of hematite. The surface-trapped electrons and holes disappeared due to the recombination, which confirmed that both of the signal intensities were lost around a similar time. In short, the diagram obtained from these measurements is given in Figure 6. The photo-excited electrons and holes were trapped to the surface states with time constants of 10–30 ns, and the trapping process was faster for electrons, and they recombined about 200–300 ns.

4. Conclusions

We showed demonstration applications of the PI-PM method combined with the clustering analysis for two major photocatalytic materials. It is usually difficult to assign different types of charge carriers from only the time-resolved response, even from the effect of various scavengers for each charge carrier. However, in the PI-PM method, the charge carriers were categorized by the charge carrier responses, which were returned back to the surface map of different charge carrier types. By investigating the charge carrier maps for different scavengers, the charge carrier types are usually more obvious compared with the general procedure. (ex., a response change due to the scavengers.) In a sense, the charge carrier response was originally averaged, which could include various different responses, especially for the inhomogeneous samples such as photocatalysts and photovoltaics, but using a huge number of the charge carrier responses and the clustering analysis, the data dimension were expanded, and more useful extension of the data is available. These demonstration experiments could convince you to use the data effectively to understand the charge carrier dynamics for photocatalytic and photovoltaic materials.

Supplementary Materials

The following supporting information can be downloaded at: https://www.mdpi.com/article/10.3390/en15249578/s1, Figure S1: SEM images of samples; Figure S2: Optical setup of the PI-PM method; Figure S3: PI-PM data analysis for TiO2 in region 2; Figure S4: PI-PM data analysis for TiO2 in region 3; Figure S5: PI-PM data analysis for Fe2O3 in region 2.

Author Contributions

K.K. (Kenji Katayama) designed the experiments and made measurements. K.K. (Kei Kawaguchi) and Y.E. prepared samples and made measurements. All the authors discussed the analysis. K.K. (Kenji Katayama) prepared a draft of the paper, and all the authors reviewed and discussed it. All authors have read and agreed to the published version of the manuscript.

Funding

The research was financially supported by JST PRESTO (#JPMJPR1675), JSPS Kakenhi (#22K05158) and the Institute of Science and Engineering, Chuo University.

Data Availability Statement

All the data are available on request.

Conflicts of Interest

I declare that the authors have no competing interests or other interests that might be perceived to influence the results and/or discussion reported in this article.

References

  1. Hisatomi, T.; Kubota, J.; Domen, K. Recent Advances in Semiconductors for Photocatalytic and Photoelectrochemical Water Splitting. Chem. Soc. Rev. 2014, 43, 7520–7535. [Google Scholar] [CrossRef] [PubMed]
  2. Hisatomi, T.; Domen, K. Reaction Systems for Solar Hydrogen Production via Water Splitting with Particulate Semiconductor Photocatalysts. Nat. Catal. 2019, 2, 387–399. [Google Scholar] [CrossRef]
  3. Wang, Q.; Domen, K. Particulate Photocatalysts for Light-Driven Water Splitting: Mechanisms, Challenges, and Design Strategies. Chem. Rev. 2020, 120, 919–985. [Google Scholar] [CrossRef] [PubMed]
  4. Ng, B.-J.; Putri, L.K.; Kong, X.Y.; Teh, Y.W.; Pasbakhsh, P.; Chai, S.-P. Z-Scheme Photocatalytic Systems for Solar Water Splitting. Adv. Sci. 2020, 7, 1903171. [Google Scholar] [CrossRef] [Green Version]
  5. Djurišić, A.B.; He, Y.; Ng, A.M.C. Visible-Light Photocatalysts: Prospects and Challenges. APL Mater. 2020, 8, 030903. [Google Scholar] [CrossRef] [Green Version]
  6. Tao, X.; Zhao, Y.; Wang, S.; Li, C.; Li, R. Recent Advances and Perspectives for Solar-Driven Water Splitting Using Particulate Photocatalysts. Chem. Soc. Rev. 2022, 51, 3561–3608. [Google Scholar] [CrossRef]
  7. Maeda, K.; Higashi, M.; Lu, D.; Abe, R.; Domen, K. Efficient Nonsacrificial Water Splitting through Two-Step Photoexcitation by Visible Light Using a Modified Oxynitride as a Hydrogen Evolution Photocatalyst. J. Am. Chem. Soc. 2010, 132, 5858–5868. [Google Scholar] [CrossRef]
  8. Wang, Q.; Hisatomi, T.; Jia, Q.; Tokudome, H.; Zhong, M.; Wang, C.; Pan, Z.; Takata, T.; Nakabayashi, M.; Shibata, N.; et al. Scalable Water Splitting on Particulate Photocatalyst Sheets with a Solar-to-Hydrogen Energy Conversion Efficiency Exceeding 1%. Nat. Mater. 2016, 15, 611–615. [Google Scholar] [CrossRef]
  9. Sayama, K.; Mukasa, K.; Abe, R.; Abe, Y.; Arakawa, H. Stoichiometric Water Splitting into H2 and O2 Using a Mixture of Two Different Photocatalysts and an IO3−/I− Shuttle Redox Mediator under Visible Light Irradiation. Chem. Commun. 2001, 23, 2416–2417. [Google Scholar] [CrossRef]
  10. Sayama, K.; Mukasa, K.; Abe, R.; Abe, Y.; Arakawa, H. A New Photocatalytic Water Splitting System under Visible Light Irradiation Mimicking a Z-Scheme Mechanism in Photosynthesis. J. Photochem. Photobiol. A Chem. 2002, 148, 71–77. [Google Scholar] [CrossRef]
  11. Kato, H.; Asakura, K.; Kudo, A. Highly Efficient Water Splitting into H2 and O2 over Lanthanum-Doped NaTaO3 Photocatalysts with High Crystallinity and Surface Nanostructure. J. Am. Chem. Soc. 2003, 125, 3082–3089. [Google Scholar] [CrossRef]
  12. Takata, T.; Jiang, J.; Sakata, Y.; Nakabayashi, M.; Shibata, N.; Nandal, V.; Seki, K.; Hisatomi, T.; Domen, K. Photocatalytic Water Splitting with a Quantum Efficiency of Almost Unity. Nature 2020, 581, 411–414. [Google Scholar] [CrossRef]
  13. Li, C.; Fan, W.; Chen, S.; Zhang, F. Effective Charge Carrier Utilization of BiVO4 for Solar Overall Water Splitting. Chem.-Eur. J. 2022, 28, e202201812. [Google Scholar] [CrossRef]
  14. Choi, M.-J.; Kim, T.L.; Choi, K.S.; Sohn, W.; Lee, T.H.; Lee, S.A.; Park, H.; Jeong, S.Y.; Yang, J.W.; Lee, S.; et al. Controlled Band Offsets in Ultrathin Hematite for Enhancing the Photoelectrochemical Water Splitting Performance of Heterostructured Photoanodes. ACS Appl. Mater. Interfaces 2022, 14, 7788–7795. [Google Scholar] [CrossRef]
  15. Fu, J.; Fan, Z.; Nakabayashi, M.; Ju, H.; Pastukhova, N.; Xiao, Y.; Feng, C.; Shibata, N.; Domen, K.; Li, Y. Interface Engineering of Ta3N5 Thin Film Photoanode for Highly Efficient Photoelectrochemical Water Splitting. Nat. Commun. 2022, 13, 729. [Google Scholar] [CrossRef]
  16. Yang, Y.; Niu, W.; Dang, L.; Mao, Y.; Wu, J.; Xu, K. Recent Progress in Doped G-C3N4 Photocatalyst for Solar Water Splitting: A Review. Front. Chem. 2022, 10, 955065. [Google Scholar] [CrossRef]
  17. Jiménez, J.M.; Perdolt, D.; Berger, T. Reactivity of Hydrogen-Related Electron Centers in Powders, Layers, and Electrodes Consisting of Anatase TiO2 Nanocrystal Aggregates. J. Phys. Chem. C 2021, 125, 13809–13818. [Google Scholar] [CrossRef]
  18. Yang, G.; Xiong, J.; Lu, M.; Wang, W.; Li, W.; Wen, Z.; Li, S.; Li, W.; Chen, R.; Cheng, G. Co-Embedding Oxygen Vacancy and Copper Particles into Titanium-Based Oxides (TiO2, BaTiO3, and SrTiO3) Nanoassembly for Enhanced CO2 Photoreduction through Surface/Interface Synergy. J. Colloid Interface Sci. 2022, 624, 348–361. [Google Scholar] [CrossRef]
  19. Qin, S.; Denisov, N.; Zhou, X.; Zdražil, L.; Fehn, D.; Hwang, I.; Bruns, M.; Kim, H.; Meyer, K.; Schmuki, P. Critical Factors for Photoelectrochemical and Photocatalytic H2 Evolution from Grey Anatase (001) Nanosheets. J. Phys. Energy 2022, 4, 044004. [Google Scholar] [CrossRef]
  20. Xiao, J.; Li, C.; Jia, X.; Du, B.; Li, R.; Wang, B. Enabling High Low-Bias Performance of Fe2O3 Photoanode for Photoelectrochemical Water Splitting. J. Colloid Interface Sci. 2022, 633, 555–565. [Google Scholar] [CrossRef]
  21. Xiong, X.; Zhang, C.; Zhang, X.; Fan, L.; Zhou, L.; Chu, Y.; Huang, W.; Wu, C.; Li, J.; Yang, X.; et al. Uniformly Citrate-Assisted Deposition of Small-Sized FeOOH on BiVO4 Photoanode for Efficient Solar Water Oxidation. Electrochim. Acta 2021, 389, 138795. [Google Scholar] [CrossRef]
  22. Su, Z.; Fang, F.; Li, X.; Han, W.; Liu, X.; Chang, K. Synergistic Surface Oxygen Defect and Bulk Ti3+ Defect Engineering on SrTiO3 for Enhancing Photocatalytic Overall Water Splitting. J. Colloid Interface Sci. 2022, 626, 662–673. [Google Scholar] [CrossRef] [PubMed]
  23. Qi, Y.; Zhang, J.; Kong, Y.; Zhao, Y.; Chen, S.; Li, D.; Liu, W.; Chen, Y.; Xie, T.; Cui, J.; et al. Unraveling of Cocatalysts Photodeposited Selectively on Facets of BiVO4 to Boost Solar Water Splitting. Nat. Commun. 2022, 13, 484. [Google Scholar] [CrossRef] [PubMed]
  24. Zhang, J.; Huang, Y.; Lu, X.; Yang, J.; Tong, Y. Enhanced BiVO4 Photoanode Photoelectrochemical Performance via Borate Treatment and a NiFeOx Cocatalyst. ACS Sustain. Chem. Eng. 2021, 9, 8306–8314. [Google Scholar] [CrossRef]
  25. Yamakata, A.; Kawaguchi, M.; Murachi, R.; Okawa, M.; Kamiya, I. Dynamics of Photogenerated Charge Carriers on Ni- and Ta-Doped SrTiO3 Photocatalysts Studied by Time-Resolved Absorption and Emission Spectroscopy. J. Phys. Chem. C 2016, 120, 7997–8004. [Google Scholar] [CrossRef]
  26. Brüninghoff, R.; Wenderich, K.; Korterik, J.P.; Mei, B.T.; Mul, G.; Huijser, A. Time-Dependent Photoluminescence of Nanostructured Anatase TiO2 and the Role of Bulk and Surface Processes. J. Phys. Chem. C 2019, 123, 26653–26661. [Google Scholar] [CrossRef] [Green Version]
  27. Gallart, M.; Cottineau, T.; Hönerlage, B.; Keller, V.; Keller, N.; Gilliot, P. Temperature Dependent Photoluminescence of Anatase and Rutile TiO2 Single Crystals: Polaron and Self-Trapped Exciton Formation. J. Appl. Phys. 2018, 124, 133104. [Google Scholar] [CrossRef]
  28. Saini, C.P.; Barman, A.; Banerjee, D.; Grynko, O.; Prucnal, S.; Gupta, M.; Phase, D.M.; Sinha, A.K.; Kanjilal, D.; Skorupa, W.; et al. Impact of Self-Trapped Excitons on Blue Photoluminescence in TiO2 Nanorods on Chemically Etched Si Pyramids. J. Phys. Chem. C 2017, 121, 11448–11454. [Google Scholar] [CrossRef]
  29. Singh, M.K.; Mehata, M.S. Temperature-Dependent Photoluminescence and Decay Times of Different Phases of Grown TiO2 Nanoparticles: Carrier Dynamics and Trap States. Ceram. Int. 2021, 47, 32534–32544. [Google Scholar] [CrossRef]
  30. Wei, D.; Huang, Y.; Bai, J.; Seo, H.J. Manipulating Luminescence and Photocatalytic Activities of BiVO4 by Eu3+ Ions Incorporation. J. Phys. Chem. C 2020, 124, 11767–11779. [Google Scholar] [CrossRef]
  31. Wang, X.; Shen, S.; Feng, Z.; Li, C. Time-Resolved Photoluminescence of Anatase/Rutile TiO2 Phase Junction Revealing Charge Separation Dynamics. Chin. J. Catal. 2016, 37, 2059–2068. [Google Scholar] [CrossRef]
  32. Ichihara, F.; Sieland, F.; Pang, H.; Philo, D.; Duong, A.-T.; Chang, K.; Kako, T.; Bahnemann, D.W.; Ye, J. Photogenerated Charge Carriers Dynamics on La- and/or Cr-Doped SrTiO3 Nanoparticles Studied by Transient Absorption Spectroscopy. J. Phys. Chem. C 2020, 124, 1292–1302. [Google Scholar] [CrossRef]
  33. Selim, S.; Francàs, L.; García-Tecedor, M.; Corby, S.; Blackman, C.; Gimenez, S.; Durrant, J.R.; Kafizas, A. WO3/BiVO4: Impact of Charge Separation at the Timescale of Water Oxidation. Chem. Sci. 2019, 10, 2643–2652. [Google Scholar] [CrossRef] [Green Version]
  34. Grigioni, I.; Ganzer, L.; Camargo, F.V.A.; Bozzini, B.; Cerullo, G.; Selli, E. In Operando Photoelectrochemical Femtosecond Transient Absorption Spectroscopy of WO3/BiVO4 Heterojunctions. ACS Energy Lett. 2019, 4, 2213–2219. [Google Scholar] [CrossRef]
  35. Ravensbergen, J.; Abdi, F.F.; van Santen, J.H.; Frese, R.N.; Dam, B.; van de Krol, R.; Kennis, J.T.M. Unraveling the Carrier Dynamics of BiVO4: A Femtosecond to Microsecond Transient Absorption Study. J. Phys. Chem. C 2014, 118, 27793–27800. [Google Scholar] [CrossRef]
  36. Hillman, S.A.J.; Sprick, R.S.; Pearce, D.; Woods, D.J.; Sit, W.-Y.; Shi, X.; Cooper, A.I.; Durrant, J.R.; Nelson, J. Why Do Sulfone-Containing Polymer Photocatalysts Work So Well for Sacrificial Hydrogen Evolution from Water? J. Am. Chem. Soc. 2022, 144, 19382–19395. [Google Scholar] [CrossRef]
  37. Zhu, H.; Xiao, S.; Tu, W.; Yan, S.; He, T.; Zhu, X.; Yao, Y.; Zhou, Y.; Zou, Z. In Situ Determination of Polaron-Mediated Ultrafast Electron Trapping in Rutile TiO2 Nanorod Photoanodes. J. Phys. Chem. Lett. 2021, 12, 10815–10822. [Google Scholar] [CrossRef]
  38. Li, Y.; Wu, Q.; Chen, Y.; Zhang, R.; Li, C.; Zhang, K.; Li, M.; Lin, Y.; Wang, D.; Zou, X.; et al. Interface Engineering Z-Scheme Ti-Fe2O3/In2O3 Photoanode for Highly Efficient Photoelectrochemical Water Splitting. Appl. Catal. B Environ. 2021, 290, 120058. [Google Scholar] [CrossRef]
  39. Fravventura, M.C.; Siebbeles, L.D.A.; Savenije, T.J. Mechanisms of Photogeneration and Relaxation of Excitons and Mobile Carriers in Anatase TiO2. J. Phys. Chem. C 2014, 118, 7337–7343. [Google Scholar] [CrossRef]
  40. Ziwritsch, M.; Müller, S.; Hempel, H.; Unold, T.; Abdi, F.F.; van de Krol, R.; Friedrich, D.; Eichberger, R. Direct Time-Resolved Observation of Carrier Trapping and Polaron Conductivity in BiVO4. ACS Energy Lett. 2016, 1, 888–894. [Google Scholar] [CrossRef]
  41. Yamada, Y.; Kanemitsu, Y. Determination of Electron and Hole Lifetimes of Rutile and Anatase TiO2 Single Crystals. Appl. Phys. Lett. 2012, 101, 133907. [Google Scholar] [CrossRef] [Green Version]
  42. Yamakata, A.; Ishibashi, T.; Onishi, H. Time-Resolved Infrared Absorption Spectroscopy of Photogenerated Electrons in Platinized TiO2 Particles. Chem. Phys. Lett. 2001, 333, 271–277. [Google Scholar] [CrossRef]
  43. Yamakata, A.; Ishibashi, T.; Onishi, H. Water- and Oxygen-Induced Decay Kinetics of Photogenerated Electrons in TiO2 and Pt/TiO2:  A Time-Resolved Infrared Absorption Study. J. Phys. Chem. B 2001, 105, 7258–7262. [Google Scholar] [CrossRef]
  44. Yamakata, A.; Ishibashi, T.; Onishi, H. Electron- and Hole-Capture Reactions on Pt/TiO2 Photocatalyst Exposed to Methanol Vapor Studied with Time-Resolved Infrared Absorption Spectroscopy. J. Phys. Chem. B 2002, 106, 9122–9125. [Google Scholar] [CrossRef]
  45. De Quilettes, D.W.; Vorpahl, S.M.; Stranks, S.D.; Nagaoka, H.; Eperon, G.E.; Ziffer, M.E.; Snaith, H.J.; Ginger, D.S. Impact of Microstructure on Local Carrier Lifetime in Perovskite Solar Cells. Science 2015, 348, 683–686. [Google Scholar] [CrossRef] [Green Version]
  46. Zhu, Y.; Cheng, J.-X. Transient Absorption Microscopy: Technological Innovations and Applications in Materials Science and Life Science. J. Chem. Phys. 2020, 152, 020901. [Google Scholar] [CrossRef]
  47. Ebihara, M.; Ikeda, T.; Okunaka, S.; Tokudome, H.; Domen, K.; Katayama, K. Charge Carrier Mapping for Z-Scheme Photocatalytic Water-Splitting Sheet via Categorization of Microscopic Time-Resolved Image Sequences. Nat. Commun. 2021, 12, 3716. [Google Scholar] [CrossRef]
  48. Kuwahara, S.; Katayama, K. Distinction of Electron Pathways at Titanium Oxide/Liquid Interfaces in Photocatalytic Processes and Co-Catalyst Effects. Phys. Chem. Chem. Phys. 2016, 18, 25271–25276. [Google Scholar] [CrossRef] [Green Version]
  49. Katayama, K.; Chugenji, T.; Kawaguchi, K. Charge Carrier Trapping during Diffusion Generally Observed for Particulate Photocatalytic Films. Energies 2021, 14, 7011. [Google Scholar] [CrossRef]
  50. Huang, X.; Fan, J.; Li, L.; Liu, H.; Wu, R.; Wu, Y.; Wei, L.; Mao, H.; Lal, A.; Xi, P.; et al. Fast, Long-Term, Super-Resolution Imaging with Hessian Structured Illumination Microscopy. Nat. Biotechnol. 2018, 36, 451–459. [Google Scholar] [CrossRef]
  51. Katayama, K.; Takeda, Y.; Shimaoka, K.; Yoshida, K.; Shimizu, R.; Ishiwata, T.; Nakamura, A.; Kuwahara, S.; Mase, A.; Sugita, T.; et al. Novel Method of Screening the Oxidation and Reduction Abilities of Photocatalytic Materials. Analyst 2014, 139, 1953–1959. [Google Scholar] [CrossRef] [Green Version]
  52. Katayama, K.; Chugenji, T.; Kawaguchi, K. Defocus-Induced Phase Contrast Enhancement in Pattern Illumination Time-Resolved Phase Microscopy. AIP Adv. 2021, 11, 115215. [Google Scholar] [CrossRef]
  53. Katayama, K. Photo-Excited Charge Carrier Imaging by Time-Resolved Pattern Illumination Phase Microscopy. J. Chem. Phys. 2020, 153, 054201. [Google Scholar] [CrossRef]
  54. Candès, E.J.; Li, X.; Ma, Y.; Wright, J. Robust Principal Component Analysis? J. ACM 2011, 58, 11:1–11:37. [Google Scholar] [CrossRef]
  55. Miyama, M.J.; Hukushima, K. Real-Space Analysis of Scanning Tunneling Microscopy Topography Datasets Using Sparse Modeling Approach. J. Phys. Soc. Jpn. 2018, 87, 044801. [Google Scholar] [CrossRef]
  56. Ebihara, M.; Sohn, W.Y.; Katayama, K. Lifetime Mapping of Photo-Excited Charge Carriers by the Transient Grating Imaging Technique for Nano-Particulate Semiconductor Films. Rev. Sci. Instrum. 2019, 90, 073905. [Google Scholar] [CrossRef]
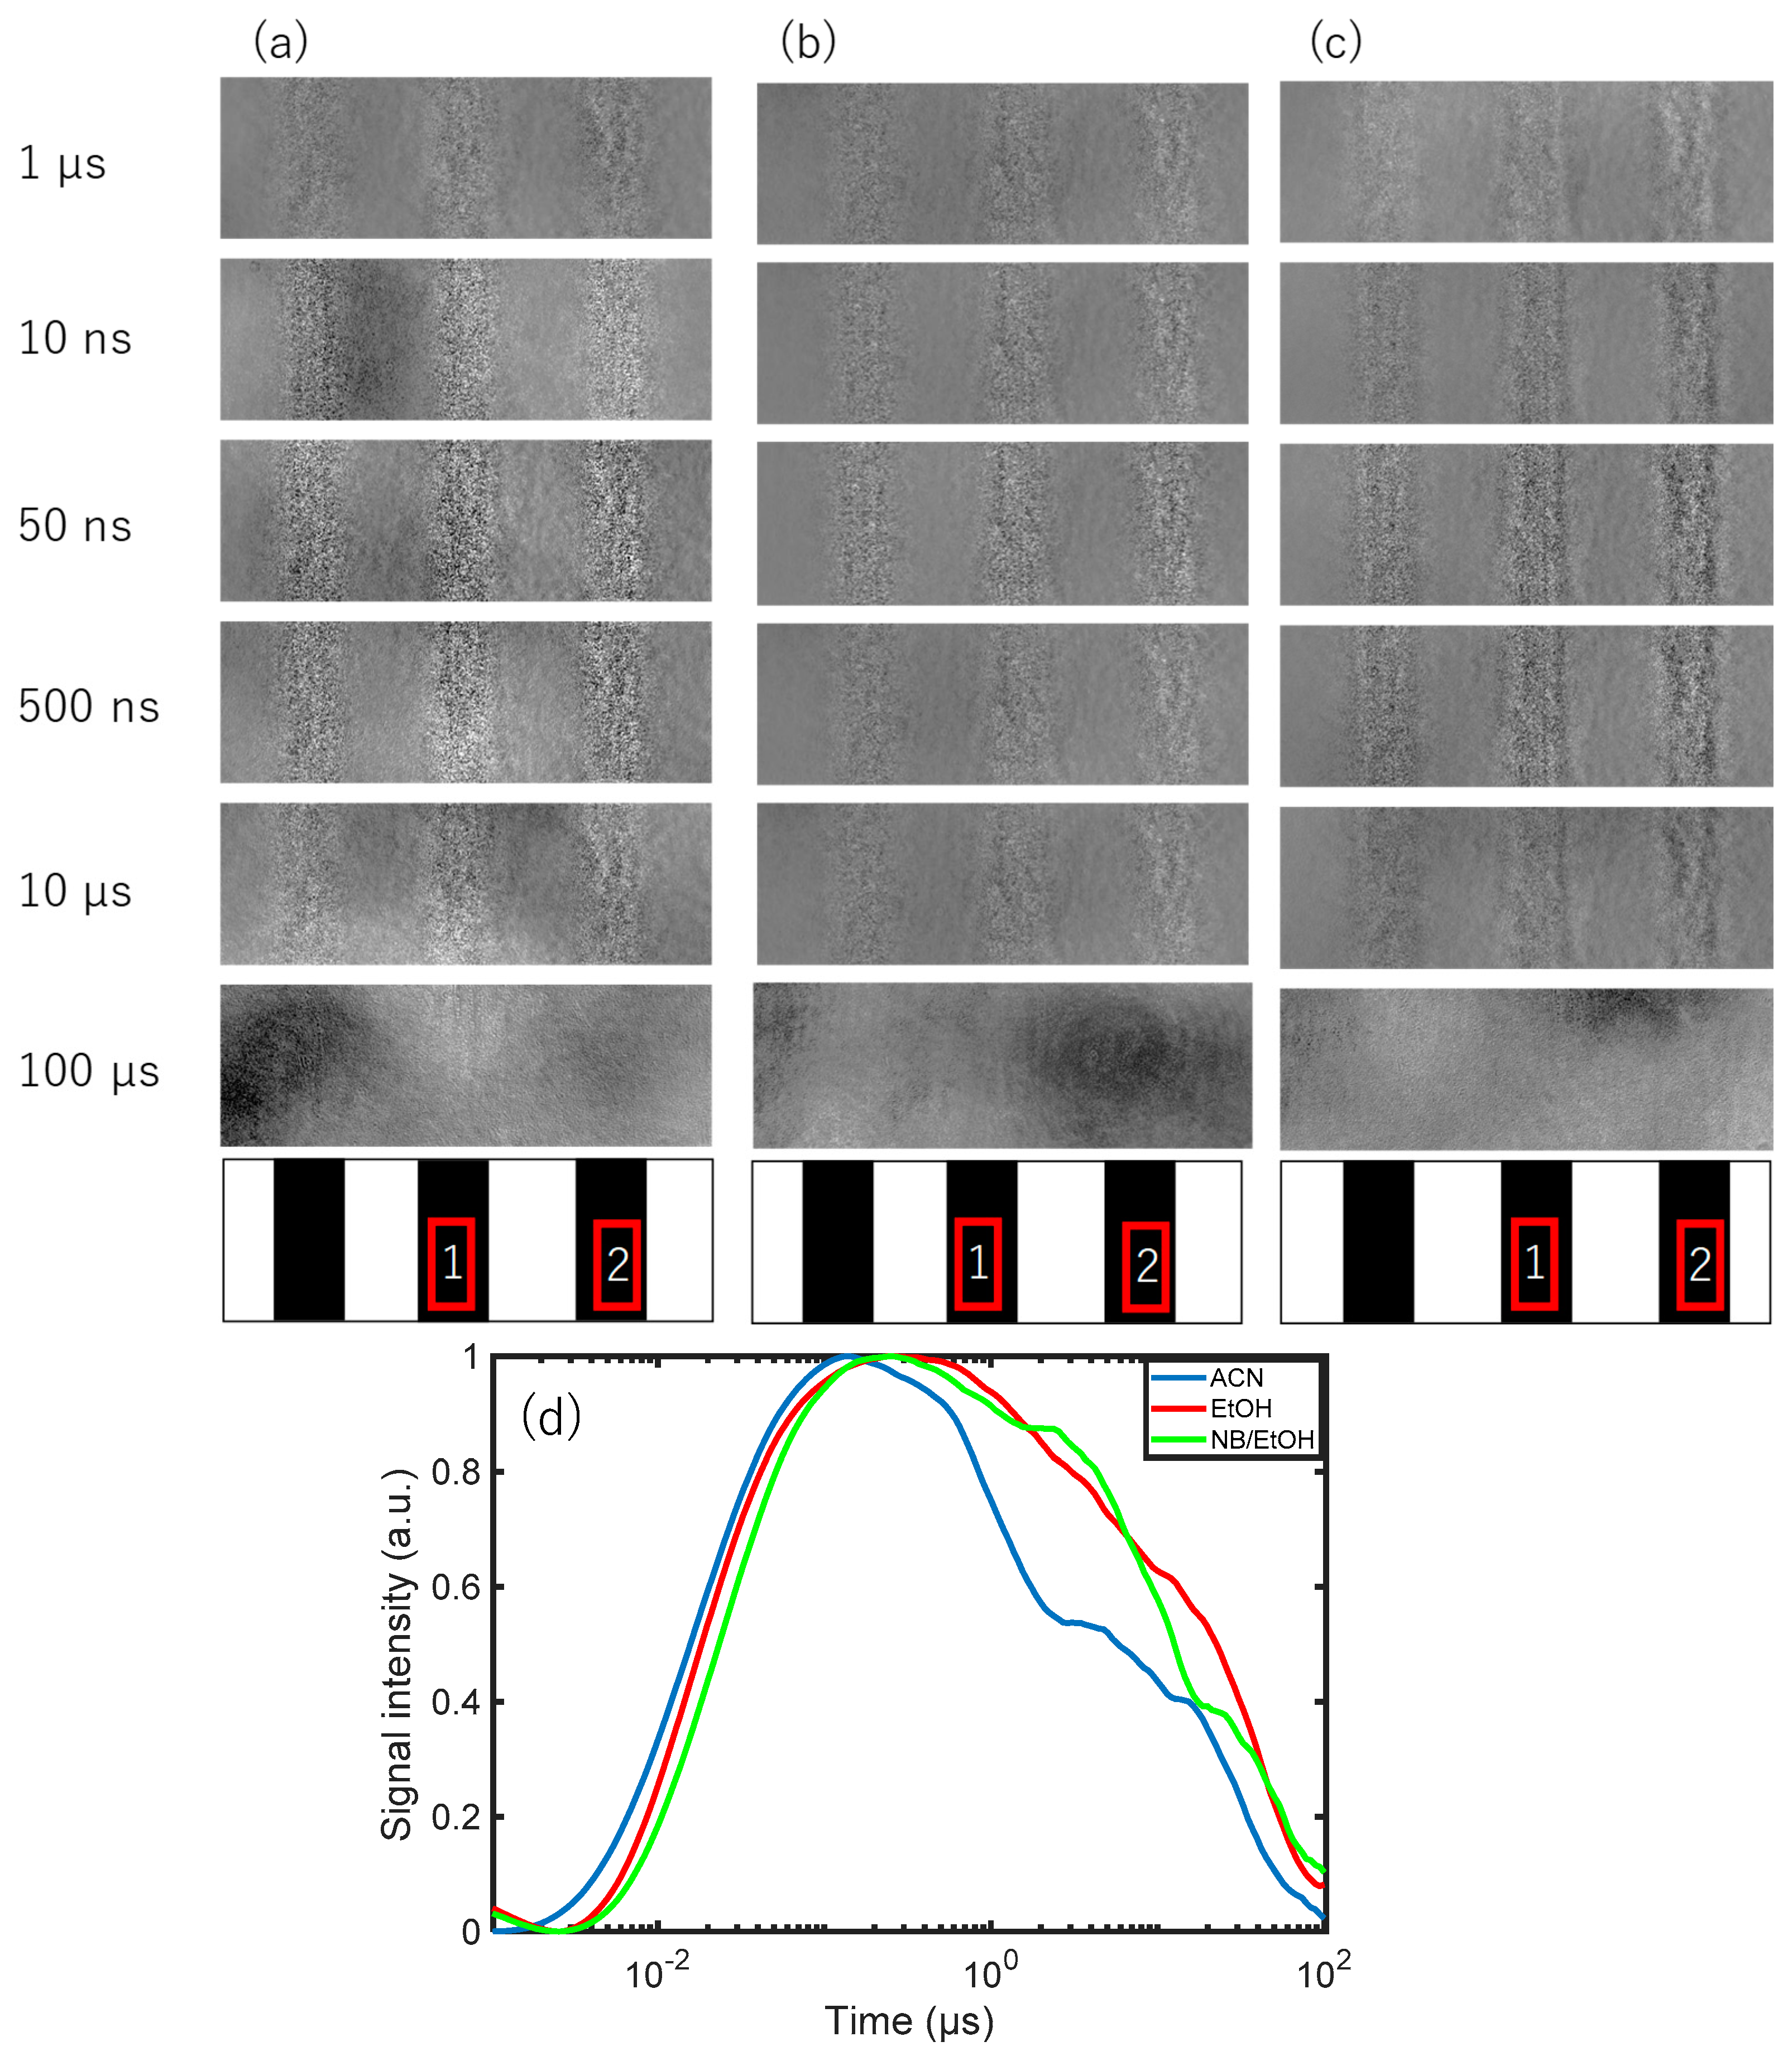
Figure 1. A time-resolved image sequence of the refractive index change (1 ns–100 µs) for a TiO2 film in (a) ACN, (b) EtOH, (c) NB/EtOH measured by the PI-PM method. The drawings at the bottom show the pattern of the pump light (black regions). (d) The average transient responses of (ac) were obtained from the image sequences of the refractive index change. The signal intensities were obtained by calculating image intensities in the light-irradiated regions of the photoinduced refractive index change of (ac).
Energies 15 09578 g001
Figure 2. The categorized maps of the charge carrier responses of a TiO2 film in (A) ACN, (B) EtOH, and (C) NB/EtOH in region 1 of Figure 1. (a) corresponds to a microscopic image, and the corresponding categorized map is shown in (b). The averaged responses for three categories are shown in (c). The ratios of categories and the rise/decay times for the categories are summarized in (D).
Energies 15 09578 g002
Figure 3. The summary diagram of charge carrier dynamics for a TiO2 film in ACN, EtOH, and NB/EtOH; Category 1: surface trapped electrons, Category 3: electrons at the conduction band and surface-trapped holes.
Energies 15 09578 g003
Figure 4. A time-resolved image sequence of the refractive index change (1 ns–100 µs) for α-Fe2O3 film in (a) ACN, (b) EtOH, (c) NB/EtOH measured by the PI-PM method. The drawings at the bottom show the pattern of the pump light (black regions).
Energies 15 09578 g004
Figure 5. The categorized maps of the charge carrier responses of an α-Fe2O3 film in (A) ACN, (B) EtOH, and (C) NB/EtOH in region 1 of Figure 3. (a) corresponds to a microscopic image, and the corresponding categorized map is shown in (b). The averaged responses for three categories are shown in (c). The ratios of categories and the decay/rise times for the categories are summarized in (D).
Energies 15 09578 g005
Figure 6. The summary diagram of charge carrier dynamics for α-Fe2O3 film in ACN, EtOH, and NB/EtOH; Categories 1 and 2: surface-trapped holes, Category 4: surface-trapped electrons.
Energies 15 09578 g006
Publisher’s Note: MDPI stays neutral with regard to jurisdictional claims in published maps and institutional affiliations.