Article

Day-Ahead Operation Analysis of Wind and Solar Power Generation Coupled with Hydrogen Energy Storage System Based on Adaptive Simulated Annealing Particle Swarm Algorithm

1
Institute of Solar Engineering Technology, Northwest Engineering Corporation Limited, PowerChina, Xi’an 710065, China
2
State Key Laboratory of Multiphase Flow in Power Engineering, Xi’an Jiaotong University, Xi’an 710049, China
*
Authors to whom correspondence should be addressed.
Energies 2022, 15(24), 9581; https://doi.org/10.3390/en15249581
Submission received: 29 October 2022 / Revised: 10 December 2022 / Accepted: 12 December 2022 / Published: 16 December 2022
(This article belongs to the Special Issue Heat and Mass Transfer and Fluid Flow)

Abstract

:
As the low-carbon economy continues to evolve, the energy structure adjustment of using renewable energies to replace fossil fuel energies has become an inevitable trend. To increase the ratio of renewable energies in the electric power system and improve the economic efficiency of power generation systems based on renewables with hydrogen production, in this paper, an operation optimization model of a wind–solar hybrid hydrogen energy storage system is established based on electrochemical energy storage and hydrogen energy storage technology. The adaptive simulated annealing particle swarm algorithm is used to obtain the solution, and the results are compared with the standard particle swarm algorithm. The results show that the day-ahead operation scheme solved by the improved algorithm can save about 28% of the system operating cost throughout the day. The analytical results of the calculation example revealed that the established model had fully considered the actual operational features of devices in the system and could reduce the waste of wind and solar energy by adjusting the electricity purchased from the power grid and the charge and discharge powers of the storage batteries under the mechanism of time-of-use electricity price. The optimization of the day-ahead scheduling of the system achieved the minimization of daily system operation costs while ensuring that the hydrogen-producing power could meet the hydrogen demand.

1. Introduction

In recent years, faced with the increasing depletion of fossil fuel energies and their related environmental problems such as air pollution and climate change, countries around the world have reached a consensus on energy policies that involves steadily facilitating the optimization of energy structures and realizing the orderly replacement of fossil fuels with renewable energies. However, due to the limitations of current technologies and electrical power infrastructure, the power supply of renewable energies lacks consistency. Electricity generation by renewable energies is highly subject to natural conditions and thus is intermittent, which causes adverse influences on the stability and safety of power grids [1].
In electric power systems, power storage technologies are effective for solving problems induced by large-scale, grid-tied power generation systems based on renewable energies [2]. Current energy storage systems can be divided into five main categories: mechanical energy storage, electrochemical energy storage, electromagnetic energy storage, thermal energy storage, and chemical energy storage. Electrochemical energy storage utilizes the conversion between electric energy and chemical energy, featuring modularity, fast response, and high-level commercialization. However, this technology can only achieve short-term energy storage, and the battery has a limited number of charge and discharge cycles.
Compared with other energy storage methods, hydrogen energy storage has the following four obvious advantages:
(a) In terms of new energy consumption, hydrogen energy storage has obvious advantages in discharge time (hours to quarter) and capacity scale (100 GW level) over other energy storage methods.
(b) In terms of a large-scale energy storage economy, with an increase in energy storage time, the marginal value of the energy storage system decreases and the total affordable cost will also decrease. The cost of large-scale hydrogen storage is an order of magnitude lower than that of electricity storage.
(c) In terms of flexibility in storage and transportation methods, hydrogen energy storage can be achieved via long-pipe trailers, pipeline hydrogen transportation, natural gas hydrogen doping, and liquid ammonia.
(d) In terms of geographical restrictions and ecological protection, compared with other large-scale energy storage technologies such as pumped storage and compressed air, hydrogen energy storage does not require specific geographical conditions and will not damage the ecological environment.
Huang et al. [3] studied the day-ahead power generation planning model of the wind-storage combined power generation system and balanced the operating economy of the system and the wind power absorption capacity to within an acceptable operating cost. Battery energy storage has variable life characteristics, and it is important to comprehensively consider the impact of discharge depth on the operating cost of energy storage [4]. Unlike traditional batteries, hydrogen energy storage uses excessive renewable power to electrolyze water and generate the hydrogen to be stored, achieving the large-scale storage of power generated from renewable energies [5]. Yang et al. [6] studied the optimization solution for the operation of the wind power coupled hydrogen energy storage system and establishes a mixed-integer linear programming model with the randomness of wind power generation considered for the goal of maximizing the systemic profits of the coupled system. Liu et al. [7] set up a wind–photovoltaic–hydrogen–thermal virtual power plant based on a wide range power adaptation strategy for an alkaline electrolyzer and used an improved multi-channel meshless light optimization algorithm to optimize the operation scheduling and equipment capacity configuration of each device. Ge et al. [8] established a peak–valley electricity price model in the regional electric vehicle scenario to guide the orderly charging of electric vehicles to achieve the purpose of smoothing the fluctuations caused by large-scale wind and solar power generation access in the power grid and optimizing the peak–valley difference of the power grid. Considering the coupling characteristics of multi-energy complementarity, it is necessary to pay attention to the coordinated control of hydrogen storage and battery energy storage.
In a nutshell, against the backdrop of energy structure transition, this paper focuses on the hydrogen supply demand of the load end, uses both wind and solar power to electrolyze water to create hydrogen, and builds a system of wind and solar power generation coupled with hydrogen energy storage. The paper considers the operation, maintenance costs, and peak cut of each device in the system, utilizes the adaptive simulated annealing particle swarm optimization (ASAPSO) algorithm to optimize the power generation scheduling of each device, and suggests a solution for the day-ahead optimization of system operation.

2. Structure and Mathematical Model of Wind and Solar Power Generation Coupled with Hydrogen Energy Storage System

2.1. Structure of System

Hydrogen energy storage can be viewed as an extension of chemical energy storage, which, compared to traditional chemical battery energy storage, has better performance in multiple respects: (1) hydrogen has higher energy density than regular storage batteries [9]; (2) storage batteries can only be used as a medium to store energy in the short term, due to its self-discharge problem, while hydrogen can be used as a medium for large-scale energy storage; (3) hydrogen is a type of clean energy and causes no environmental pollution.
Figure 1 shows the topological structure of wind and solar power generation coupled with the hydrogen energy storage system established, which consists of a wind power generation system, a solar power generation system, a battery storage system, a hydrogen storage system, and the hydrogen demand end.
In Figure 1, the system modulation platform is responsible for hydrogen and power management, which means it conducts scheduling optimization on the power system and hydrogen production system according to the current wind and solar power generation and the actual demand from the hydrogen demand end. Additionally, the high-pressure hydrogen storage system is not involved in the scheduling control by the power regulation platform. It is only responsible for storing the hydrogen produced from the electrolyzer, so it needs to work synchronously with the electrolyzer, meet the demand for hydrogen storage, and align with the hydrogen transport end.
In actual operation, the system aims to minimize the daily operation cost and adopts a system scheduling strategy of fully utilizing wind and solar power to make the electrolyzer produce hydrogen and imposing penalties whenever wind or solar power is wasted. Due to the time-of-use electricity price mechanism of the power grid, to avoid the system having to purchasing electricity when it is at its price peak, it is designed to purchase electricity at the price valley of hydrogen production. By doing so, the system can ensure that hydrogen storage can meet the demand from the load-carrying end, even when wind and solar power generation is insufficient and when the hydrogen production power drops.

2.2. Mathematical Model

2.2.1. Photovoltaics Model

The output power of the photovoltaics (PV) battery set changes along with the solar light intensity, temperature, and other uncertain factors. The output power of the PV array is [10]:
P P V t = P S T C × G t G S T C 1 + k × T t T S T C
where P P V t denotes the output power of the PV array under a light intensity of G t ; G S T C , T S T C , and P S T C are the light intensity, PV array temperature, and max output power in the standard testing environment, respectively; k stands for the temperature coefficients (generally, k = 0.45 ) ; and   T t indicates the surface temperature of the PV array at moment t.

2.2.2. Wind Power Generation Model

When the wind speed is lower than the lower limit, the wind turbine cannot output electric energy, and this lower limit is usually 3–4 m/s, which is called the cut-off wind speed. Between the cut-off wind speed and the rated wind speed, the curve increases to the power of 3 of the wind speed. When the rated wind speed or greater is reached, the wind turbine control system will maintain constant output power. In order to ensure the structural integrity of the wind power system, when the wind speed exceeds a certain threshold (also known as the cut-out wind speed), the wind turbine will automatically shut down, and this threshold (usually set at about 25 m/s) is determined by the designed wind power generation system.
The relation between the input wind speed v and the output power Pt of a single wind turbine in the wind power generation model is calculated with the following formula [11]:
P t = 0 0.5 ρ π R 2 v 3 P n 0 v < v i , v i < v < v n v n < v < v o v > v o
where v denotes the actual wind speed at the height of the wheel hub of a turbine in m/s, v i , v o , and v n are the wind speed; P n stands for the specified power of the turbine in kW; ρ is the air density in kg/m3; and R is the length of the turbine blades in meters.
During period t, the predictable total amount of wind power that can be scheduled in the wind power generation field is expressed by the formula below:
P w , t = j = 1 M P t j Δ t
where M denotes the total number of turbines; P t j is the predicted power generated by the jth turbine in period t; and Δ t stands for the adjacent period.

2.2.3. Storage Battery Devices

Storage battery devices are used to cut the peaks in power, and their mathematical model can be expressed as [12]:
E t = E t 1 × 1 σ + Δ t × P c h t × η c h Δ t × P d i s t × η d i s
where E t stands for the overall energy stored during period t by the battery in kW·h; σ is the self-discharge efficiency of the battery; P c h t and P d i s t are the charging and discharging power of the battery during period t, respectively, in kW; and η c h and η d i s denote the charging and discharging efficiency of the battery device, respectively.

2.2.4. Alkaline Electrolyzer

The electricity-to-hydrogen conversion relations and the amount of hydrogen produced are expressed by the formula [13]:
Q e l = P e l Δ t ρ η e l
where Q e l denotes the amount of hydrogen output in m3; P e l is the input power of the electrolyzer in kW; Δ t is the electrolyzer operation time in h; ρ stands for the electricity-to-hydrogen conversion parameter in the electrolyzer in m3/kW·h, and η e l is the working efficiency of the electrolyzer in %.

3. Day-Ahead Scheduling Optimization Model for Wind and Solar Power Generation Coupled with Hydrogen Energy Storage System

3.1. Targeted Function

The day-ahead scheduling optimization model established in this paper for a system of wind and solar power generation coupled with hydrogen energy storage includes the wind power generation system, the PV system, the storage battery system, the hydrogen production system based on an electrolyzer, and a hydrogen storage system. The model was designed with the goal of minimizing the operational costs of the entire system within one scheduling day. The daily operational cost includes the renewable energy station operation costs, the hydrogen production costs by the electrolyzer, the maintenance costs of the power-storage devices, the cost incurred by purchasing electricity from the grid, the cost of storing hydrogen in tanks, and the penalty for wasting wind or solar energy. Therefore, the targeted function is written as:
m i n C d a y = m i n C n e w + C p e n + C e l e + C s t o + C g r i d + C c o m
where C d a y , C n e w , C p e n , C e l e , C s t o , C g r i d , and C c o m denote the daily operational cost of the whole system, the operational cost of the wind power and PV stations, the penalty cost for wind and solar energy waste, the cost of the hydrogen-producing electrolyzer, the maintenance cost of the energy storage devices, the cost incurred by purchasing electricity from the grid, and the cost of storing hydrogen in tanks, respectively.
(1) Operation Cost of Wind Power and PV Stations
C n e w = K w P w t + K p v P p v t
where K w and K p v denote the operation costs of the wind power station and PV station in yuan/kW, respectively; P w t and P p v t stand for the scheduled power of wind and PV power in kW during period t.
(2) Cost of Penalty for Wind and Solar Energy Waste
C p e n = k w P w C t + k p v P p v C t
P w C t = P w m a x t w t P p v C t = P p v m a x t p v t
where k w and k p v stand for the cost coefficients of penalties for wasting wind and solar energy, respectively, and P w C t and P p v C t denote the amount of wind energy and solar energy wasted during period t.
(3) Cost of Hydrogen Production by Alkaline Electrolyzer
C e l e t = P e l e t × C p e r _ e l e + C w a t e r × V H 2 t
where P e l e t denotes the operation power of the alkaline electrolyzer in kW during period t in kW, C p e r _ e l e stands for the cost of operating the electrolyzer in yuan/(kW·h), C w a t e r is the cost of water consumed in yuan/Nm3, and V H 2 t is the amount of hydrogen produced in Nm3.
For every 1Nm3 of hydrogen produced by the electrolyzer, 0.89 kg of water is consumed. The price of electrolysis water is 10 yuan/t, so the water consumption cost for producing 1 Nm3 is 0.0089 yuan [14].
(4) Maintenance Cost of Energy Storage Devices
C s t o t = P b a t t × C p e r _ b a t
where P b a t t denotes the output power of the storage battery device in kW during period t and C p e r _ b a t is the maintenance cost for battery devices per kW·h of power in yuan/(kW·h).
(5) Cost of Purchasing Electricity from Grid
C g r i d t = P g r i d t × C p e r _ g r i d
where P g r i d t denotes the power of electricity in kW purchased from the grid during period t, and C p e r _ g r i d is the time-of-use electricity price of the industrial electricity sold by the grid in yuan/(kW·h).
(6) Cost of Storing Hydrogen in Tanks
Hydrogen tanks are devices used to compress and store hydrogen.
C c o m t = V H 2 t × C p e r _ c o m
In the formula, V H 2 t denotes the amount of hydrogen to be compressed from the system during period t, and C p e r _ c o m stands for the cost of storing each unit of hydrogen in yuan/Nm3.

3.2. Constraint Conditions

The model has equation constraint and inequation constraint conditions. The penalty function was used to process the constraint conditions with the basic aim of seeking answers by changing constraint optimization problems into unconstrained problems. The equation constraint is mainly used to impose a constraint on the power balance and the equation between the amounts of energy in the batteries at the start and end of one day. The inequation constraint conditions consider the upper and lower limits of the operation power of each device.
(1) Constraint on System Power Balance
P r e n e w t + P b a t t + P g r i d t = P e l e t , t t s t a r t , t e n d
where P r e n e w t denotes the power generated by renewable energies in kW, namely wind and solar energies, during period t, and P b a t t is the charge and discharge power of storage batteries. In this paper, the discharge power of batteries is positive, the charge power is negative, and both are expressed in kW.
(2) Constraints on Storage Battery System
The volume of power in the batteries is related to the volume, the charge and discharge power, and the self-discharge power in the previous period. The state of charge (SOC) of the batteries during period t is expressed as:
S b a t t = S b a t t 1 1 σ η c P b a t t Δ t E b a t
where S b a t t denotes the SOC of the batteries during period t, σ is the self-discharge ratio of the batteries, η c is the efficiency of charge and discharge, and E b a t stands for the total capacity of the batteries in kW·h.
Apart from fulfilling the constraint on volume change, the batteries also need to obey the constraints on battery safety, including the constraint on the upper and lower limits of charge and discharge powers, the upper and lower limit of SOC, and the equation of the SOC at the start of a day with that at the end of the day [15].
The constraint on the upper and lower limits of charge and discharge powers is expressed as:
0 P b a t t P d i s m a x P c h m a x b a t t
where P c h m a x and P d i s m a x are the charge and discharge limits of batteries in kW, respectively. Additionally, the upper and lower limit constraints on the battery SOC are:
S b a t m i n S b a t t S b a t m a x
where S b a t m i n and S b a t m a x denote the minimum SOC value and the maximum SOC value of the batteries.
The equation of the SOC at the start of a day with the SOC at the end of the day is expressed as:
S b a t t = t s t a r t = S b a t t = t e n d
where S b a t t = t s t a r t and S b a t t = t e n d denote the SOCs of batteries at the start and end of the schedule, respectively.
(3) Constraint on Grid Interaction Power
P g r i d m i n P g r i d t P g r i d m a x , t t s t a r t , t e n d
where P g r i d m i n and P g r i d m a x are the minimum and maximum power of electricity purchased from the grid, respectively, in kW.
(4) Constraint on Electrolyzer Operation Power
P e l e m i n P e l e t P e l e m a x , t t s t a r t , t e n d
where P ele m i n and P ele m a x denote the minimum and maximum operation powers of the alkaline electrolyzer during production, respectively.
(5) Constraint on Hydrogen Production
M H 2 t = M H 2 t 1 + V H 2 t Δ t L H 2 t M H 2 t 0 M H 2 t s t a r t = M H 2 t e n d
In the formula above, M H 2 t stands for the amount of remaining hydrogen stored in the system during period t in Nm3, V H 2 t is the rate of hydrogen production by the electrolyzer during period t in Nm3/h, L H 2 t is the load of hydrogen on the demand side during t, and M H 2 t s t a r t and M H 2 t e n d is the amount of hydrogen remaining at the start and end of the schedule, respectively, in Nm3.
To meet the hydrogen load requirement at the demand side and achieve hydrogen production and consumption simultaneously, the system should not store a large amount of hydrogen after a period of scheduling and only needs to make sure the hydrogen stored is enough for the operation of the next day, which means the amount of hydrogen stored in the system at the end of scheduling should remain the same as the amount at the start of scheduling.

4. Adaptive Simulated Annealing Particle Swarm Optimization Algorithm

System operation scheduling is a strongly coupled and non-linear optimization problem, which is usually solved by metaheuristic optimization algorithms [16]. There are two types of metaheuristic optimization algorithms: one is the evolution algorithm, which is based on the simulation of natural evolution and survival of the fittest, such as the genetic algorithm [17] and the evolution algorithm [18]. The other type is swarm intelligence algorithms, which are based on societal and cooperative behaviors of individuals, such as particle swarm optimization (PSO) [19], the bee algorithm [20], and the ant colony algorithm [21].
The PSO algorithm adopted in this paper is a random searching algorithm based on swarms, which is inspired by the food searching behaviors of bird swarms. Similar to other metaheuristic searching algorithms, PSO starts with a swarm with possible solutions generated randomly, then the particles use their experience and the best experience of their peers to decide the next move, and the global optimal solution to the problem is converged after iterative calculation step by step. Every particle in the swarm is the possible solution to the problem and corresponds to the adaptiveness value determined by its position. The speed of a particle decides the direction and range of its movement, and the speed adjusts dynamically along with the movement of its own and other particles to achieve individual optimization in the space of possible solutions. The expressions of the updated speed and position of the particle swarm during evolution are listed below:
ν i k + 1 = ω ν i k + c 1 r 1 p i b e s t k x i k + c 2 r 2 G b e s t k x i k
x i k + 1 = x i k + v i k
where ν i k and x i k denote the speed and position of the ith particle in the kth iteration; ω stands for the weight coefficient of inertia, which can control the development and exploration ability of the algorithm; c 1 and c 2 are the identity recognition and social recognition factors, respectively; r 1 and r 2 are random numbers; p i b e s t denotes the individual optimal position of the ith particle; and G b e s t is the optimal position for the swarm.
To improve the speed and accuracy of the search for the optimal solution of the PSO algorithm and avoid getting the local optimal solution, Yan et al. [22] suggested an adaptive simulated annealing particle swarm optimization algorithm, which uses the hyperbolic tangent function shown below to control the weight coefficient of inertia and achieve non-linear adaptive change:
ω = ω m i n m a x / 2 + tan h 4 + 8 × k m a x ( ) m a x ω m i n m a x / 2
where ω m a x and ω m i n denote the maximum and minimum weight coefficient of inertia, which are usually 0.95 and 0.4, respectively, k stands for the current number of iterations, and k m a x is the maximum number of iterations.
If c 1 has a high value, then the particles only move in the local range. Additionally, if the value of c 2 is too high, the particles will converge too early and obtain the local optimal solution [23]. The asynchronous change strategy was adopted to control the learning factor in order to achieve the goal of changing the focus of optimal solution searching in different phases. The asynchronous learning factor is expressed as [24]:
c 1 k = c 1 m a x 1 m i n × k k m a x 1 m a x
c 2 k = c 2 m i n 2 m a x × k k m a x 2 m i n
where c 1 k and c 2 k are the values of c 1 and c 2 at the kth iteration; c 1 m a x , c 1 m i n , c 2 m a x , and c 2 m i n are the maxima and minima of c 1 and c 2 , respectively.
Then, the simulated annealing operation is introduced. According to the metropolis principles and temperature, the swarm was instructed to accept a worse solution at a certain probability. The roulette strategy was adopted to determine the alternative global optimal value p g from all p i values. Additionally, the formula of updated speed is rewritten as:
ν i k + 1 = ω ν i k + c 1 r 1 p i b e s t k x i k + c 2 r 2 p g k x i k
The adaptive simulated annealing particle swarm optimization algorithm (ASAPSO) conducts adaptive change on three important parameters in the PSO and adds the simulated annealing operation to improve the accuracy and speed of searching for the global optimal solution. The detailed steps are listed below:
Step 1: Configure the initial parameters, such as the size of the swarm N, the maximum number of iterations M, the variable dimension D, initial temperature, temperature decrease coefficient, etc.
Step 2: Input the parameter constraints of devices such as wind power and PV systems, storage batteries, electrolyzers, etc., to obtain the initial particles, including their position and speed.
Step 3: Calculate the adaptiveness value of each particle in the initial swarm, find the optimal value for the targeted function, and record the individual optimal position and the global optimal position.
Step 4: Configure the initial temperature for simulated annealing and apply adaptive changes to ω , c 1 , and c 2 .
Step 5: Conduct adjacent field searching on particles using the simulated annealing algorithm according to the metropolis principles.
Step 6: Update the optimal position of each particle and the global optimal position of the swarm.
Step 7: Judge whether the maximum of iterations has been reached. If not, repeat Step 4. Otherwise, stop the iteration.
Step 8: Output the current optimal particle, namely the global optimal solution found, and the algorithm ends.

5. Calculation Example Analysis

5.1. Calculation Example Parameters

Figure 1 shows the structure of the wind and solar power generation coupled with a hydrogen energy storage system in which the wind turbines have a capacity of 700 kW and the PV power station has a capacity of 900 kW. The upper limit of electricity power purchased from the higher-level grid is 400 kW. The grid adopts a time-of-use electricity pricing mechanism. It is an electricity pricing system that calculates electricity charges separately according to peak electricity consumption and low electricity consumption. Divide the 24 h day into multiple time periods. Peak electricity consumption generally refers to the concentration of electricity consumption units when the power supply is tight, e.g., during the day, when the standard charge is higher. Trough electricity consumption generally refers to electricity consumption when there are fewer electricity units and sufficient power supply, such as at night, when the standard charge is lower. The implementation of peak and valley electricity prices is conducive to making full use of equipment and energy, prompting all units to stagger the time of electricity consumption.
The details are listed in Table 1.
The optimization used 1 h as the interval to determine the scheduling plan for each day. Then, the wind–solar power generation model was built in MATLAB/Simulink according to the mathematical model in Section 2.2. The output power of the wind turbines and PV system were calculated in the Simulink model using data on wind speed, temperature, and solar light intensity. Figure 2 illustrates the predicted power generated by wind and solar energies.
Table 2 lists the operation parameters of each energy storage device in the system.
Figure 3 shows the hydrogen loading demand curve, and Table 3 summarizes the values of the other parameters.
To evaluate the performance of the economic operation model for the system of wind and solar power generation coupled with hydrogen energy storage and the effectiveness of the improved optimization algorithm, the calculation example in this paper employed the adaptive simulated annealing particle swarm optimization algorithm in MATLAB.

5.2. Result Analysis of Calculation Example

5.2.1. Day-Ahead Operation Plan for System and State of Capacity of Power Storage Devices

Figure 4 is a diagram of the day-ahead scheduling plan for the system of wind and solar power generation coupled with hydrogen energy storage. Under this plan, the daily operation cost of the system is 9.61 × 10 3 .
Figure 5 shows the hydrogen production speed and the remaining amount of hydrogen in the storage tanks. From Figure 4 and Figure 5, we can see that when wind power generation is high, the grid electricity price is at its valley, or the hydrogen demand is low, and the electrolyzer improves its electrolysis power to meet the demand for hydrogen before supplementing hydrogen in the tanks. For example, during the period 04:00–07:00, the electricity price was at its valley, and PV power generation was low, so the system purchased low-price electricity from the grid to produce a large amount of hydrogen in the electrolyzer in order to store hydrogen energy for the subsequent hiked demand. When solar power generation is low, the grid electricity price is high, or the hydrogen production speed cannot meet the high hydrogen demand, the demand is fulfilled by the remaining hydrogen in the storage tanks and the hydrogen produced in the electrolyzer. During the period 14:00–15:00, some wind energy is wasted. This is caused by the low demand for hydrogen and the full storage of hydrogen in the tanks. In such cases, the system does not need to produce a large amount of hydrogen, so excessive power is not consumed.
Figure 6 illustrates the state of the charge of storage batteries. As Figure 4 and Figure 6 show, when the hydrogen demand is low, wind power generation is too high, or the grid electricity price is at its valley, and the batteries are charged to store energy. When the hydrogen demand is high, wind power generation is low, or the grid electricity price is at its peak, and the storage batteries discharge to the electrolyzer. As such, the storage batteries serve the function of peak cut and improve the stability and reliability of the system’s operation.

5.2.2. System Operation Cost Analysis

This section calculates the operational cost of each part of the wind–solar power generation coupled with a hydrogen energy storage system using the ASAPSO algorithm to obtain ten results, whose average values are the final calculation results. Table 4 lists the results.
Table 1 shows that with the state of capacity parameters in the example, the system still wastes a certain amount of wind and solar energy. One reason is that the model is not able to fully utilize all the wind and solar energies by selling the extra electricity produced to the grid. The system can only purchase electricity from its upper-level grid and cannot sell electricity to it because the system does not have the function of mutual power exchange with the grid. Another reason is the capacity limit of storage batteries. In the calculation example, the capacity limit of storage batteries is 800 kW·h.

5.2.3. Algorithm Comparison

Table 5 shows the comparison of targeted function values when using the PSO algorithm and ASAPSO algorithm to get the optimization results of the model. The comparison reveals that the BASPSO algorithm performed better.
The daily operation cost of the system calculated by the PSO algorithm is usually around 1.41 × 10 4 yuan, but the cost calculated by the ASAPSO is only 1.02 × 10 4 yuan, a 28% reduction in cost. The reason for the high cost calculated by the PSO algorithm was that it was confined to the local optimal solution during reiterative calculation and was unable to break away from the local optimal solution to search for the global one.
The ASAPSO algorithm added a simulated annealing operator with the feature of probabilistic jumps, so it could help the algorithm jump out of the local optimal solution during searching. Moreover, the adaptive changes applied to key parameters such as the weight coefficient of inertia ω, the learning factor, etc., also strengthened the global searching capability of the ASAPSO algorithm.

6. Conclusions

Based on existing studies on wind and solar power generation coupled with battery storage systems, this paper added hydrogen production equipment and conducted research on the economic efficiency of a hydrogen energy storage system before establishing wind and solar power generation coupled with a hydrogen energy storage system. This system included a wind turbine set with a 700 kW capacity, a PV station with a 900 kW capacity, storage batteries with an 800 kW capacity, and an alkaline electrolyzer with a rated power of 1000 kW. Through the analysis of a calculation example with the system, the following major conclusions were drawn:
(1)
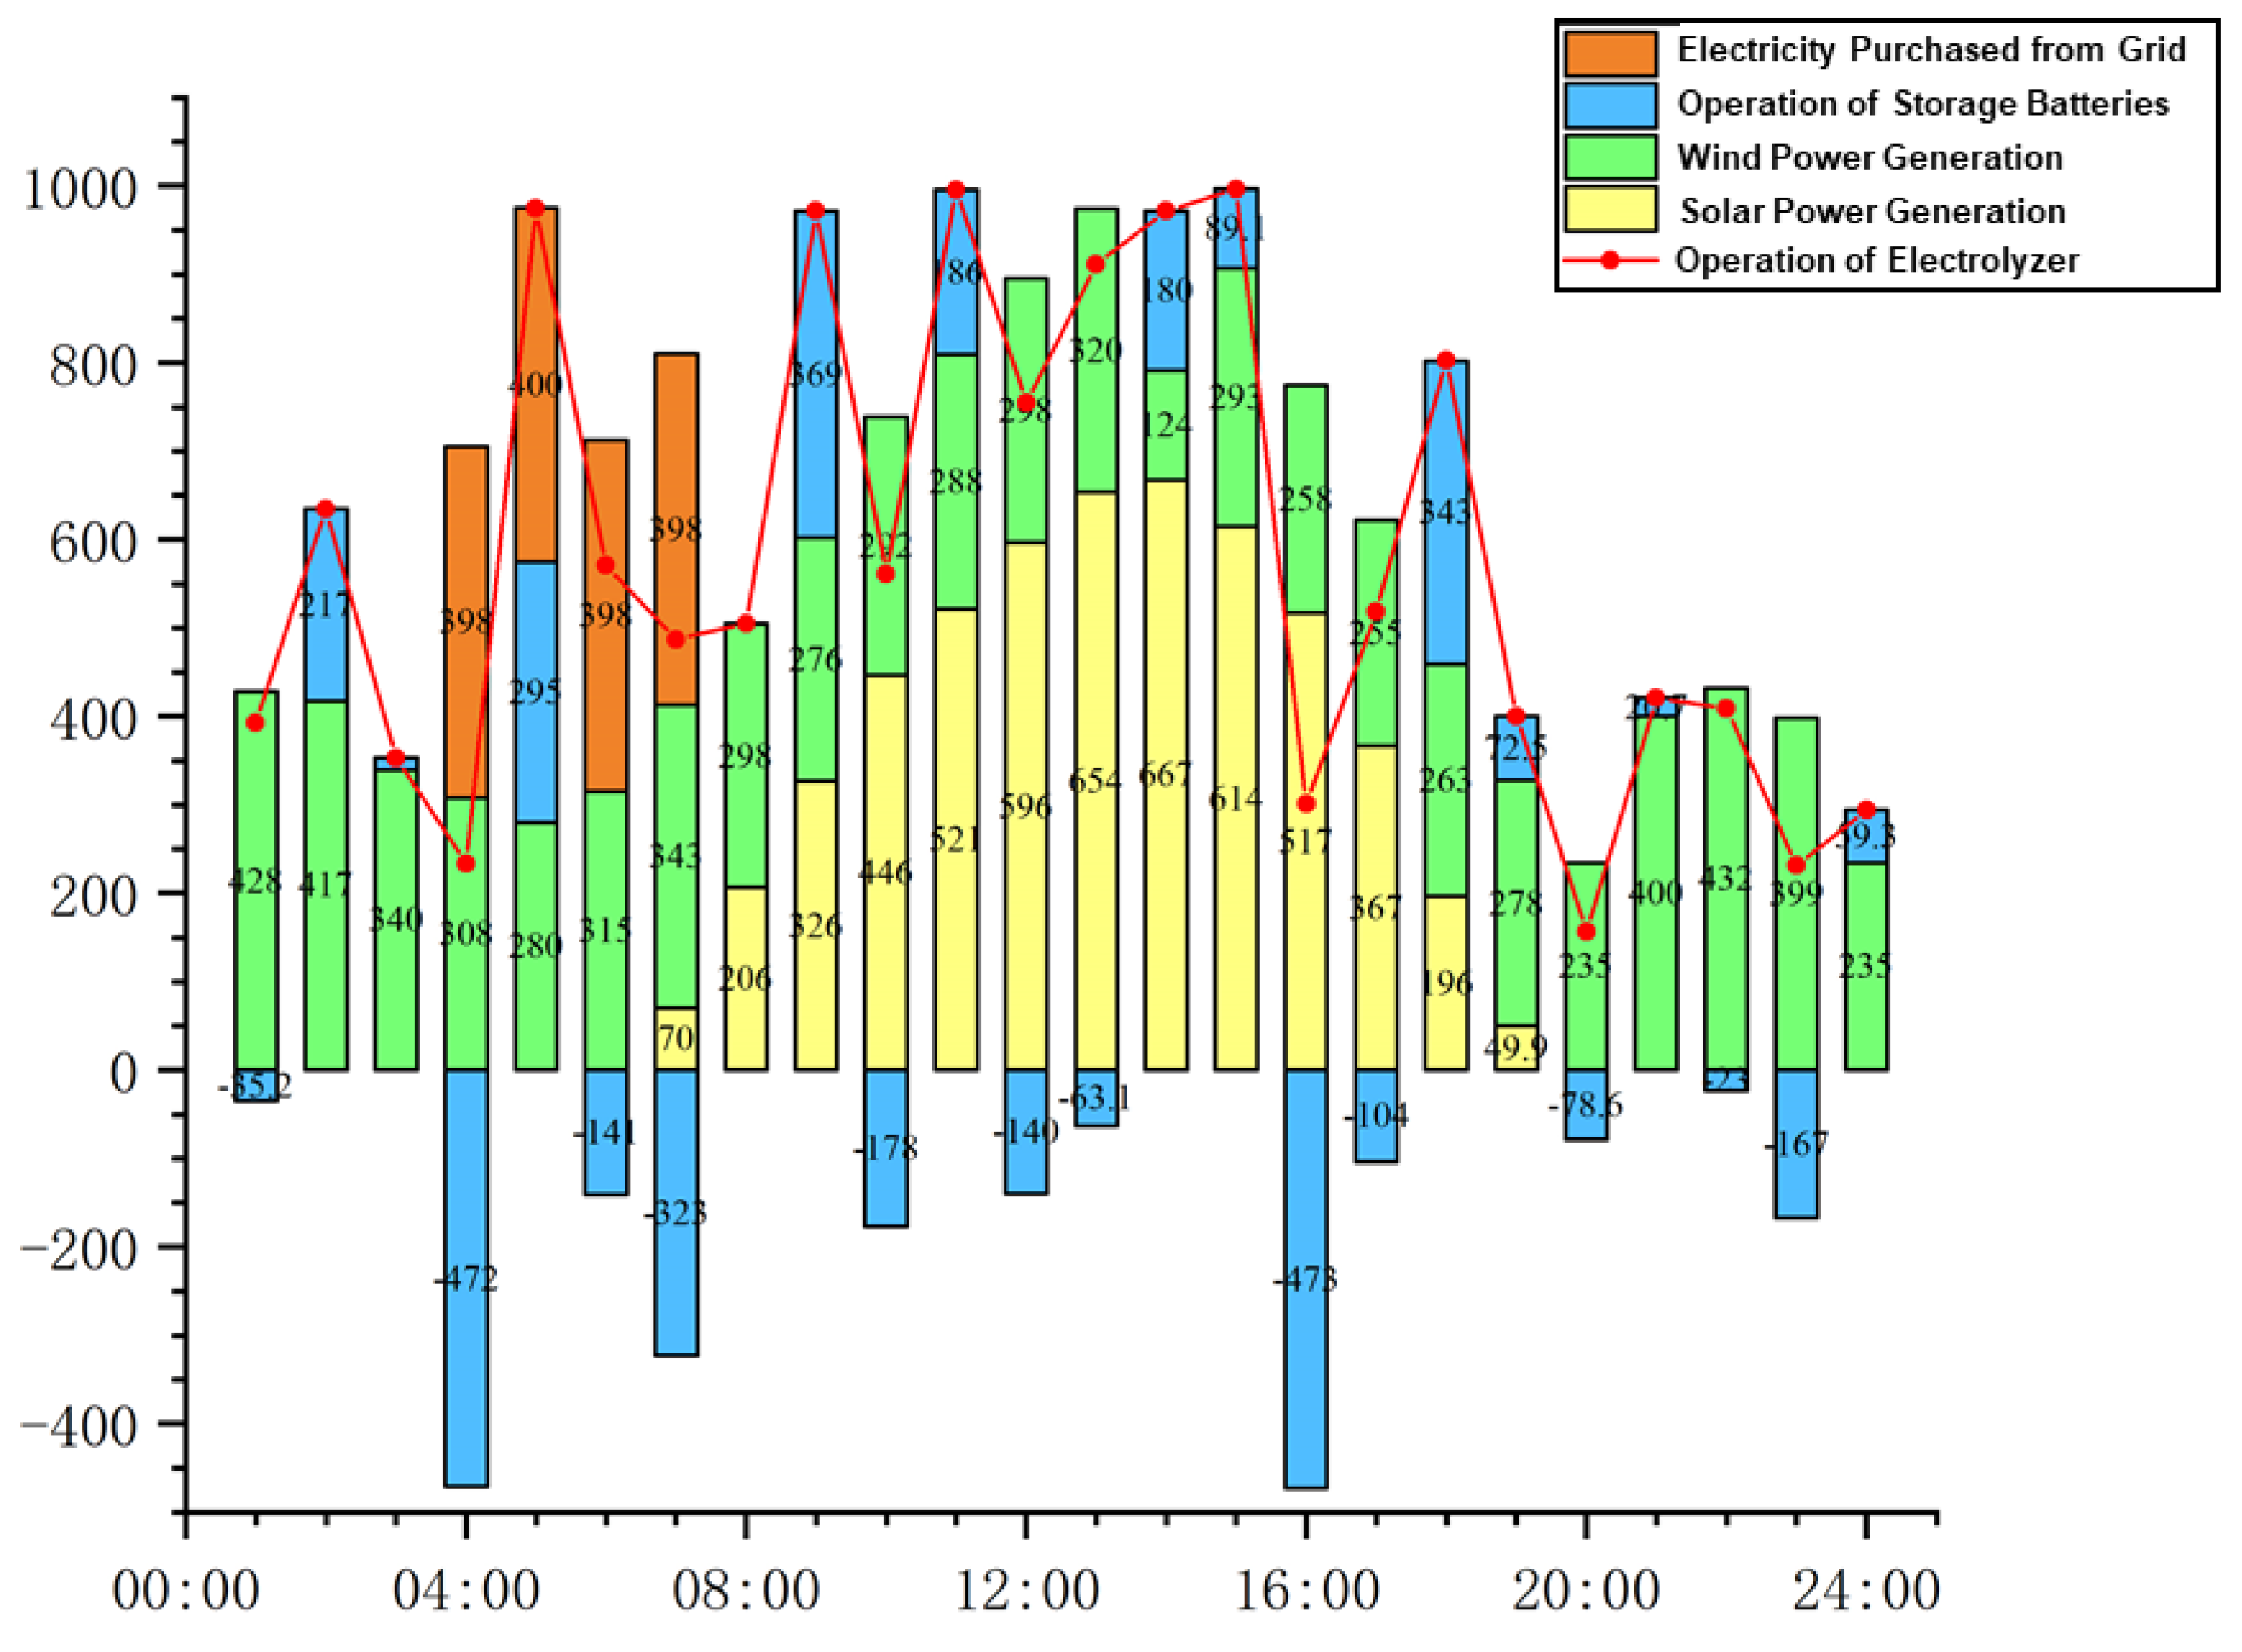
When building a day-ahead operation optimization model for wind–solar power generation coupled with hydrogen energy storage with the goal of minimizing the daily operation cost, the hydrogen demand could be met, and the economic efficiency of operating the system could be improved via coordinative scheduling among the hydrogen-producing devices, storage batteries, and electricity purchases from the grid.
(2)
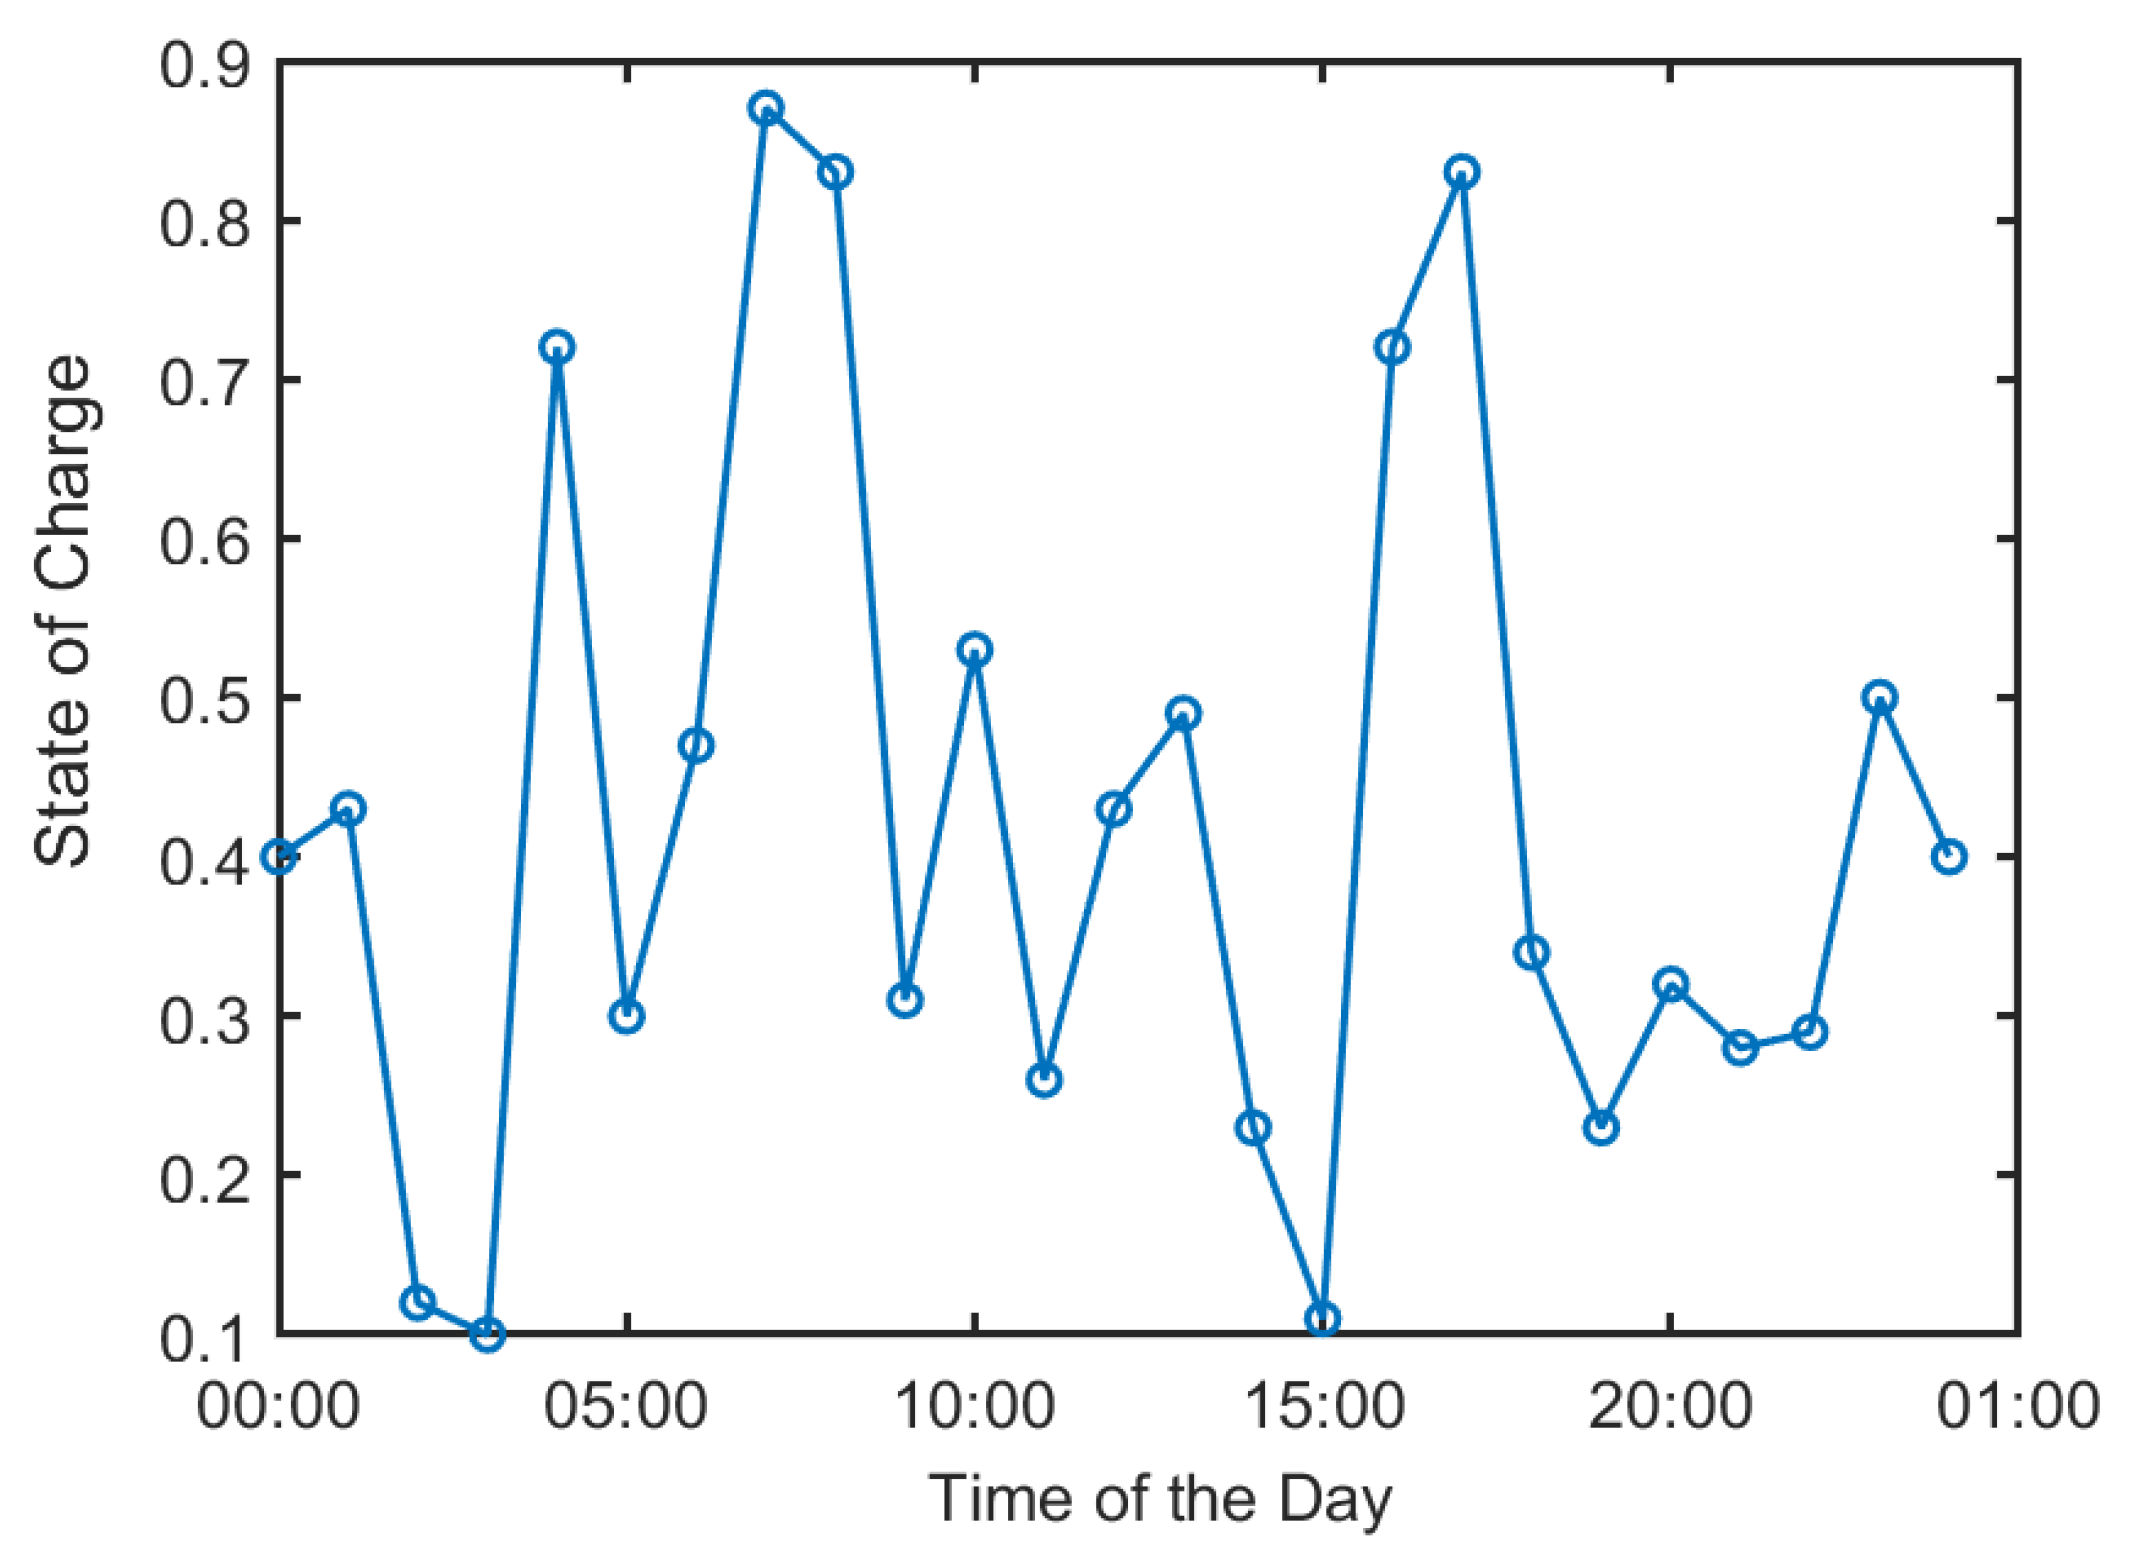
An analysis of the calculation example showed that storage batteries played the role of peak cutting, and their capacity might impact the consumption of wind and solar power by the system.
(3)
Compared to the standard PSO algorithm, the improved ASAPSO algorithm was more effective and showed better performance at jumping out of the local optimal solution and finding the global optimal solution, which helped save 28% of the daily operation cost of the system. Therefore, the optimization of the day-ahead operation plan for the wind–solar power generation coupled with a hydrogen energy storage system could significantly improve the economic efficiency of the system’s operation.

Author Contributions

Conceptualization, H.P. and Y.W.; methodology, K.C.; software, J.R.; validation, B.L.; formal analysis, Z.G.; data curation, K.C. and J.R.; writing—original draft preparation, K.C. and J.R.; writing—review and editing, Z.G.; project administration, J.Z. and P.C.; funding acquisition, K.C. All authors have read and agreed to the published version of the manuscript.

Funding

This research was funded by the Innovation Capability Support Program of Shaanxi (Grant No. 2022KJXX-92) and the Key Research and Development Program of Shaanxi (Grant No. 2022GY-186).

Conflicts of Interest

The authors declare no conflict of interest.

References

  1. Wan, J. Renewable Energy: How to Achieve the Orderly Replacement of Fossil Fuel Energies. World Knowl. 2021, 23, 20–22. [Google Scholar]
  2. Li, X.; Shao, Z. An Economic Optimal Scheduling Model for a Multi-energy Complementary Power Generation System with Multiple Energy Storage. In Proceedings of the 2021 IEEE 7th International Conference on Control Science and Systems Engineering (ICCSSE), Qingdao, China, 30 July 2021. [Google Scholar]
  3. Huang, Y.; Hu, W.; Chen, L. Day-ahead generation scheduling plan modes for large-scale wind-storage combined power generation system based on two-stage optimization. Autom. Electr. Power Syst. 2015, 39, 8–15. (In Chinese) [Google Scholar]
  4. Yi, L.; Zhang, Y.R.; Li, Y.; Zhang, J.; Zong, Z.D.; Xiang, W.P.; Liu, Y.L. Scheduling Optimization of Power Generation System with Wind Energy for Low-Carbon Economy. Water Resour. Power 2018, 36, 157, 213–216. [Google Scholar]
  5. Chen, A.J. Technological Features and Application Outlook of Hydrogen Energy Storage. China Sci. Technol. 2021, 19, 120–121. [Google Scholar]
  6. Yang, J.G.; Liu, W.M.; Li, S.X.; Deng, T.H.; Shi, Z.P.; Hu, Z.C. Optimization Operation Strategies and Efficiency Analysis of Wind Power Generation Coupled with Hydrogen Energy Storage. Electr. Power Constr. 2017, 38, 106–115. [Google Scholar]
  7. Liu, Y.J.; Fan, Y.F.; Hao, J.W.; Bai, X.; Song, Y. Capacity Configuration and Optimal Scheduling of a Wind-Photovoltaic-Hydrogen-Thermal Virtual Power Plant Based on a Wide Range Power Adaptation Strategy for an Alkaline Electrolyzer. Power Syst. Prot. Control 2022, 50, 48–60. [Google Scholar]
  8. Ge, S.Y.; Guo, J.Y.; Liu, H.; Zeng, P.L. Impacts of electric vehicle’s ordered charging on power grid load curve considering demand side response and output of regional wind farm and photovoltaic generation. Power Syst. Technol. 2014, 38, 1806–1811. (In Chinese) [Google Scholar]
  9. Ding, S.Y.; Lin, X.N.; Chen, Z.; Wang, Z.; Zhang, Z. A Design and Dispatch Strategy of Storage-hydrogen-cooling Combined Renewable Energy Absorption Facility on Rich Resource Island. Proc. CSEE 2019, 39, 4659–4673, 4969. [Google Scholar]
  10. Gao, J.; Zou, B. Economic Optimization Dispatch of Microgrid based on Particle Swarm Algorithm. Electron. World 2019, 20, 21–26. [Google Scholar]
  11. Shang, Q.X.; Sun, M. Optimal Dispatching of Power Grid based on Wind Power and Heat Storage Heating System. J. Sol. Energy 2021, 42, 65–70. [Google Scholar]
  12. Chai, G.A.; Wu, J.H.; Yao, L.; Zhang, Q. Operation Optimization of Combined Cooling, Heating and Power Microgrid Based on Improved Dynamic Inertia Weighted Particle Swarm Algorithm. Sci. Technol. Eng. 2022, 22, 1472–1479. [Google Scholar]
  13. Lu, J.; Yu, L.J.; Zheng, P.; Hou, S.Y. Super-Ahead Control Strategy of Wind-Hydrogen Coupled System. Acta Energ. Sol. Sin. 2022, 43, 53–60. [Google Scholar]
  14. Shao, Z.; Wu, J. Capacity Configuration Optimization of Hydrogen Production from Wind and PV Power Based on Dynamic Electricity Price. Acta Energ. Sol. Sin. 2020, 41, 227–235. [Google Scholar]
  15. Yuan, T.J.; Wan, Z.; Wang, J.J.; Zhang, T.; Jiang, D.F. Day-Ahead Power Generation Plan for Hydrogen-Producing System with Start and Stop Features of Electrolyser Considered. Electr. Power 2022, 55, 101–109. [Google Scholar]
  16. Zhang, G.; Wang, W.; Du, J.; Liu, H. A Multi-Objective Optimal Operation of a Stand-Alone Microgrid Using SAPSO Algorithm. J. Electr. Comput. Eng. 2020, 2020, 6042105. [Google Scholar]
  17. Shadmand, M.B.; Balog, R.S. Multi-Objective Optimization and Design of Photovoltaic-Wind Hybrid System for Community Smart DC Microgrid. IEEE Trans. Smart Grid 2014, 5, 2635–2643. [Google Scholar] [CrossRef]
  18. Maleki, A. Optimal Operation of a Grid-Connected Fuel Cell based Combined Heat and Power Systems using Particle Swarm Optimization for Residential Sector. Int. J. Ambient Energy 2019, 42, 550–557. [Google Scholar] [CrossRef]
  19. Kerdphol, T.; Fuji, K.; Mitani, Y.; Watanabe, M.; Qudaih, Y. Optimization of a Battery Energy Storage System using Particle Swarm Optimization for Stand-Alone Microgrids. Int. J. Electr. Power Energy Syst. 2016, 81, 32–39. [Google Scholar] [CrossRef]
  20. Maleki, A. Design and Optimization of Autonomous Solar-Wind-Reverse Osmosis Desalination Systems Coupling Battery and Hydrogen Energy Storage by an Improved Bee Algorithm. Desalination 2018, 435, 221–234. [Google Scholar] [CrossRef]
  21. Li, G.; Zhai, X.; Li, Y.; Feng, B.; Wang, Z.; Zhang, M. Multi-objective Optimization Operation Considering Environment Benefits and Economy Based on Ant Colony Optimization for Isolated Micro-grids. Energy Procedia 2016, 104, 21–26. [Google Scholar] [CrossRef]
  22. Yan, Q.M.; Ma, R.Q.; Ma, Y.X.; Wang, J. Adaptive Simulated Annealing Particle Swarm Optimization Algorithm. J. Xidian Univ. 2021, 48, 120–127. [Google Scholar]
  23. Hua, Y.; Zhu, W.; Jin, Y.; Ming, H.; Wang, S.; Jiao, Z. Research on photovoltaic MPPT control based on adaptive mutation particle swarm optimization algorithm. Acta Energ. Sol. Sin. 2022, 43, 219–225. [Google Scholar]
  24. Chen, K.; Qiu, X.; Shi, G.; Li, X. Time-Scale Decomposition of Energy Storage in Micro-Grid with Renewable Energy. Electr. Meas. Instrum. 2018, 55, 30–34. [Google Scholar]
Figure 1. Topological structure of wind and solar power generation coupled with hydrogen energy storage system.
Energies 15 09581 g001
Figure 2. Curves of predicted power generation by wind and solar energies.
Energies 15 09581 g002
Figure 3. Curve of hydrogen demand in system.
Energies 15 09581 g003
Figure 4. Day-ahead scheduling plan for wind and solar energy generation coupled with hydrogen energy storage system.
Energies 15 09581 g004
Figure 5. Hydrogen production speed of electrolyzer and remaining hydrogen amount in storage tanks.
Energies 15 09581 g005
Figure 6. State of charge of storage batteries.
Energies 15 09581 g006
Table 1. Time-of-use electricity price data from grid.
Time TypesSpecific PeriodsElectricity Price
Valley Time0:00–07:000.308
Regular Time07:00–09:00, 11:00–19:000.594
Peak Time09:00–11:00, 19:00–24:000.88
Table 2. Operation parameters of energy storage devices.
ParametersValuesParametersValues
P e l e m a x /(kW)1000 E b a t (kW⋅h)800
P e l e m i n /(kW)150 σ /%4.6
ρ /(m3/kW⋅h)0.25 η c /%95
η e l /%82 S b a t m a x /%90
P c h m a x /(kW)270 S b a t m i n /%10
P d i s m a x /(kW)270
Table 3. Values of other parameters.
ParametersValues
C p e r _ e l e /(yuan/(kW⋅h)) 0.5
C p e r _ b a t /(yuan/(kW⋅h))0.05
C p e r _ c o m /(yuan/Nm3)0.21
K w /(yuan/kW)0.03
K p v /(yuan/kW)0.04
k w /(yuan/kW)0.23
k p v /(yuan/kW)0.23
Table 4. Operation Cost of Each Part in the System.
ParametersValues
Penalty Cost of Wind Energy Waste 0.13 × 10 3
Penalty Cost of Solar Energy Waste 0.09 × 10 3
Operation Cost of Wind Power Generation System 0.33 × 10 3
Operation Cost of Solar Power Generation System 0.18 × 10 3
Cost of Purchasing Electricity 0.56 × 10 3
Operation Cost of Storage Batteries 0.23 × 10 3
Operation Cost of Electrolyzer 7.86 × 10 3
Operation Cost of Hydrogen Storage Tanks 0.81 × 10 3
Daily Operation Cost 1.02 × 10 4
Table 5. Comparison of targeted function values from two algorithms.
AlgorithmStandard PSOASAPSO
Average Targeted Function Values 1.41 × 10 4 1.02 × 10 4
Publisher’s Note: MDPI stays neutral with regard to jurisdictional claims in published maps and institutional affiliations.

