1. Introduction
A novel concept recently introduced and enforced by the European Commission as part of the
Clean Energy for all European Citizens Package [
1], is named
Active Customer. The union rules on the services required and the customer engagement are outlined in diverse regulations and directives [
2,
3,
4]. By the end of the year 2021, these shall be implemented as national laws throughout the European Union. Variants and interpretations are as diverse as are the national environments, and accordingly manifold are the possibilities to realise the customer engagement and a utile signalling system. Converting power quality or other grid health metrics into a simple colour scheme can serve as simplification and coarse discretisation, which also preserves some privacy by using a unidirectional signal that cannot be traced back. Several reasons may cause a red light situation, and thus, communicating a red light signal does not reveal the actual physical problem.
The traffic light-like approach presented intends to add simple signals that smart devices can easily integrate into local decision making as easily as price signals. Thereby, distributed component-based demand side management (DSM) that can consider market and grid demands in parallel shall become possible. Based at the customer level, fully distributed and scalable, a more dynamic,
flexible, and at the same time also cooperative utilisation of the grid resources shall be enabled, as for instance envisaged in [
5,
6]. At the same time, shall the introduced signalling support smooth on-demand emergency interaction with the local distribution grid operator (DSO) to reduce the stress resulting from connecting more volatile renewable energy sources (RES) to their grids. Recent examples and visions on the general topic of flexibility utilisation can be found in [
7] and on novel balancing in [
8]. Generally, to mitigate a local issue, the locally available capacities need to be known, or at least supposed, to enable preparatory measures and the situational adjustment of local responses [
9].
Today, the current utilisation state of local grid capacities is not communicated across lower grid levels. Instead, these levels are designed to cope with any predictable load level and variance. Communicating temporarily idle capacities to adjacent smart energy system components via traffic-light-like signals, i.e., a small set of easy to understand discrete signals, here similar to the three colours of street traffic lights, shall enable and improve local decision making. Vice versa, such simple signalling could also be used to advertise excess capacity of volatile energy sources to nearby loads that could make good use of it. Power that currently cannot be inserted due to momentarily insufficient local load, i.e., causing too high a voltage at the source’s grid connection point, becomes exploitable. Flexible loads along the same feeder can increase their consumption, causing the voltage at the grid connection point of the RES to drop, and thereby, enabling the insertion of renewable power that would not be produced else. Such a win–win situation can only be achieved when state information is openly shared, and else unused capacities are made available for exploitation. Dynamically adjusted power ingress limitation, as presented in [
6,
10], could be realised thereon as well. Such a dynamic proactive approach can also solve the systemic unfairness of RES curtailment in respect to the customers’ position along feeders [
11].
Figure 1 sketches the basic roles that can provide and make use of grid and resource state signalling. Sharing and mutually using the received information enables smart devices in the field to make smart decisions that have a positive effect beyond the individual profit. These smart entities manage assets (sources) at producer sites and appliances (loads) on customer premises. Both represent distributed energy resources (DERs) behind the meter, which constitute the prime addressees for traffic-light-like signals. Energy suppliers may offer price incentives via traffic-light-like ’saver’ signals. The local DSO may indicate the grid health, i.e., the currently available spare capacity. The inter-regional transmission system operator (TSO), more precisely in the role of the balancing responsible party (BRP), may use a traffic light to indicate the current capability to handle a supply–demand mismatch (i.e., load deviation from prediction) via the second-level reserves currently available within a balancing group. Aggregators, being on one side a supplier and at the same time a cooperative of contracted customers and producers, can accordingly send and receive signals within and beyond their customer base, respectively.
Traffic-light-like signalling, called a traffic light system (TLS), can and is already used in many situations to introduce intuitively understood signals, e.g., with Supervisory Control and Data Acquisition (SCADA) systems. The commonly well-known meaning of the three traffic light colours are as follows: green = go ahead, yellow = watch out and red = stop. Deviating from the known meanings requires fundamental explanation and challenges intuitive understanding. However, no colour at all (black) indicates malfunction. All three colours lighted might indicate system maintenance, and combinations of adjacent lights intuitively represent intermediate signals. Finally, the combination of red and green may be interpreted as undetermined because opposing components are lit.
With the rise of more DERs, the less homogeneous electricity demands per customer, and increased environmental influence on the individual demand patterns, it may be necessary to restructure the grid management into smaller regional cells and to fully digitalise the horizontal cooperation, i.e., to fully automate all system interaction using digital interfaces and interlinked digital procedures, as proposed by C/sells [
13] fostering cellularity, participation and diversity. The interlinked digital procedures, the appreciation of diversity and the participation principle are the novelty, not the cell structure, which is simply a finer granularity of today’s regional DSO’s interactions via the inter-regional (national) TSO or the interaction of European TSOs as part of ENTSO-E. Yet, the unbundling regulations isolate grid operation from energy trading, at least for grid operators of size, to enable competition and overlapping entities on the national markets.
Energy suppliers, aggregators and most recently also energy communities and active customers operate in parallel and compete as peers on the market level. Control of their behaviour is provided by the balancing group, which links energy sales and purchases to the actual power inserted and delivered in time. Deviations are compensated by rather expensive reserve power, which is commonly provided by a sequence of more to less quickly controllable generation reserves. The stress placed on the grid operation by distributed components inserting energy in one place and consuming it somewhere else cannot be considered well in such a centralised process.
The TLS we introduce addresses the lack of overarching information on grid states at the component level. The concept that we present in this article covers the basic requirements, possible aims and basic operation aspects. In a minimalist way, the TLS shall bridge the gap between the centralised market based energy management and the perfectly distributed control realised by grid codes. Analysing the detailed operation of the introduced TLS concept considering different realisation options and representative environments is not included. Rating the concept’s potential and the possible impact of closing that gap is left to the imagination of the reader and future studies.
The remainder of the article is structured as follows:
Section 2 presents examples of established signalling schemes among energy systems and the distributed responses thereto. Energy system experts may jump directly to
Section 3, where some examples of recently proposed traffic light approaches and other means to enable a more flexible energy system are introduced. Based thereon, we discuss some technical and opposing aims of some market and grid-level operation concepts. In
Section 4, a unifying signalling approach is proposed. The outlined traffic light scheme bridges the grid and market related control aims introducing forecasting, adequate warnings and responses thereto, to facilitate situation-aware preparations and shared problem mitigation.
Section 5 and
Section 6 recapitulate the intentions and potential, and briefly discuss current hindrances toward realising the proposed traffic-light-like signalling system and related control expansion options.
2. Signalling and Adjustments Commonly Used in Energy Systems
Grid voltage and frequency are the most present and accurate signals. They are available instantly everywhere across the synchronous electricity grid. Fuses and emergency breakers respond to over-current and voltage thresholds, respectively. These omnipresent physical signals are readily used to control the distributed power insertion. They enable the fastest possible response to deviations but provide limited information. The autonomous responses to frequency and voltage deviations at grid connection points are commonly regulated by statutory grid codes [
14,
15] wherever an electricity generating device is connected to the public grid [
16]. Smart edge devices, the foundation of any smart grid, can process more elaborate information to make smarter decisions possible.
2.1. Grid Codes and Autonomous Local Measures in General
Good smart meters can assess the power quality at a customer’s access point, i.e., local over- and under-voltage, grid-frequency deviations, power angles, and detect any sudden changes thereof. Smart power assets, in particular a power inverter inserting power from local generation, e.g., from photovoltaic (PV) panels, can adjust their power output to the power quality at the access point in order to mitigate apparent grid issues. Grid codes, sometimes called network codes, specify the regulatory required grid support. The applied mechanisms are listed below. Any on-demand support in excess of grid-code-based responses shall be considered acquirable ancillary services. These are not executed autonomously. They need to be (pre-)ordered, requested on demand and equitably remunerated. For example, when adjusting the load caused by an appliance, i.e., instantly increasing or decreasing it on demand for a certain time period, could be an ancillary service used for peak shaving and mitigating voltage issues, independent and in addition to the autonomous responses in respect to grid codes.
The topic of integrating many DERs in the low voltage (LV) distribution grid is addressed in many recent studies, proposing various means to smoothly insert power. Commonly, these are based on autonomous power insertion control. Methods to perform sensible insertion, which are typically the basis for grid codes, can inter alia be found in the comparison presented in [
17,
18]. These include:
P(U)-control: Active power (P) is curtailed via a function of the voltage (U), measured at the grid-access point. Thus, the inserted power is confined by the voltage level at which it is inserted. When a set voltage threshold is exceed at the grid-access point, the local power generation is reduced until the threshold is met again. This response occurs irrespective of what caused the violation of the threshold.
Q(U)-control: Reactive power (Q) is inserted based on the local grid voltage (U). Inductive or capacitive (positive or negative) reactive power insertion increase or decrease the local voltage. This strategy has the drawback that prosumers further away need to contribute more reactive power than those close to the transformer due to the voltage deviation being smaller close to the transformer. The electric resistance along the wires obstructs voltage regulation exclusively by reactive power compensation.
PF(P)-control: Forces the insertion of complex power with a certain power factor (PF), i.e., at the power angle , where , dependent on the power (P) currently inserted. In applying this scheme, all prosumers contribute an equal amount of reactive power. However, reactive power becomes inserted even when not being needed because it is provided independent of the voltage level, causing additional grid losses. Moreover, power factor control cannot always keep all local voltages within statutory margins.
Combinations: The above schemes may be combined. The combinations and appear useful and have been evaluated and proposed widely. However, no combination has yet been shown to achieve the optimal power flows that result when we solve the complex power flow optimisation for an LV-grid in a centralised approach assuming total control.
Frequency control: Common synchronous power generators store a huge amount of kinetic energy in their heavy rotors. The inertia of the rotating masses, being the derivative of this energy reservoir, provides enormous instantaneous power that counteracts any frequency difference between the grid and the rotating mass. Evidently, this is limited by the robustness of bearings and the conducting capacity of the electric wiring. However, when these physical limits are reached, the generator has to be disconnected, potentially causing a cascading failure that may lead to a regional or even larger black-out.
Many PV inverters perform grid-synchronised power insertion that blindly follows the grid frequency, and thus these do not provide inertia. Even worse, switched rectifiers are non-linear loads that distort the sine waveform, which causes the harmonics of the grid frequency to be reflected into the grid. Such harmonics of the grid frequency cannot be compensated like the power angles introduced by inductive and capacitive loads, which even may compensate each other. Smart inverters, so-called
synchronverters [
19], can provide virtual inertia [
20] if coupled with an adequately sized and powerful energy buffer, e.g., a capacitor bank, fly-wheel or battery. Their actual potential and economics are not yet approved. Economic viability appears achievable for upscale systems only, thus, causing them to be rather unachievable for the masses of household-level PV inverter and battery installations to be deployed in the coming years.
Realising these decentralised autonomous power ingress control schemes is typically required by local regulations, at least for assets of size. It is very common to enforce a distributed power control mechanism to at least assure a safe fallback operation mode. This is particularly needed where more sophisticated insertion control managed by a smart energy management system (EMS) may fail to perform due to communication dropouts. IT connectivity cannot be assumed to be always present and likewise complex software cannot be assumed to be entirely bug free. The predictable operation of smart energy assets has to persist irrespective of any IT flaws. Safe fallback operation is mandatory.
2.2. Distribution System Operator Response to Persisting Issues
Where instantaneous measures cannot prevent a persistent violation of grid safety thresholds, the DSO has to react. Either by shedding load, i.e., disconnecting (dropping) feeder lines, or by adjusting the LV transformer output. If possible, the former shall be avoided to prevent secondary damage to customer equipment and health.
The evaluation presented in [
21] focused on maintaining the grid voltages inside the statutory range defined by the upper and lower voltage limits, particularly, at 85% and 110% of the rated voltage. At different positions, both may be violated simultaneously along an LV feeder with high PV penetration and no local insertion curtailment. In that case, when only the on-load tap changer (OLTC) at the local LV transformer is used for voltage control, priority is given to mitigating the voltage that exceeds the limits most. Hence, both over-voltages and under-voltages are examined, and the OLTC is shifted in the direction that mitigates the most extreme deviation.
Figure 2 presents the 100th percentiles of over- and under-voltages in a typical LV distribution feeder for different PV-penetration levels.
Since only the upper and lower voltage limits, i.e., the red light states, are examined, it is clear that the OLTC responds ex post to a violation, and thus short violations of statutory limits cannot be prevented. To avoid these, it is necessary to introduce an intermediate voltage deviation, indicating a yellow state, where the OLTC shall be activated to keep the voltage of the feeder nodes always within the permissible range.
The actions conducted at different grid states can prioritise the operation of various grid assets as well as the prioritisation of different methods, which plays a key role in regulating the power quality. In [
22], the authors show that the coordination of the assets is crucial due to their individually limited impact, as shown in
Figure 3.
In case the OLTC is applied as a primary voltage control mechanism, the Q(U) adjustment is used to maintain the voltage close to the nominal voltage. The OLTC can be activated in a critical state, or prior, in some warning state, to prevent most avoidable critical states. In case the Q(U) method is applied only after a critical state is reached, the OLTC operates as add-on voltage control mechanism to prevent any further voltage violation. P(U) control can be added in case both Q(U) and OLTC cannot eliminate all present voltage violations.
As concluded in [
22], the aforementioned methods can mitigate over-voltage and under-voltage issues. However, other issues, such as voltage unbalance and grid loss, may thereby deteriorate. Consequently, the application of multi-objective optimisation is required for a joint improvement of the various power quality attributes across an LV grid.
2.3. Actively Managed Power Ingress and Egress Curtailment
To achieve a somewhat flexible matching of power consumption to production and distribution economics, switched low-price energy supply is widely applied. Independent feeder lines are not needed—only a dedicated meter and a remote switched power connector behind that meter. The interruptible power supply is switched on and off in accordance with the utilisation of production and distribution capacities. The radio signal that executes the switching is commonly broadcast directly over the power lines. Appliances that do not need a constant power supply are connected to the switched connector and, hence, support the DSO in the supply stabilising attempt by enabling them to alter the current demand remotely—a kind of legacy DSM solution.
Similarly, smart power generation, e.g., smart PV-inverters, can actively limit the power that is inserted in respect to received control messages. Likewise, the insertion control scheme, i.e., the applied grid code, may be changed on demand. When power generation cannot be controlled or where devices do not respond correctly, the DSO may need to cut the local power insertion. Production assets that exceed a defined insignificance threshold in terms of power capacity are commonly required to execute power insertion curtailment in accordance with statutory grid codes.
Plain on-off control applied for entire regions causes wide spreading power ripples across grid levels where too many loads or generators are simultaneously dropped. Grouping the assets into smaller bunches can help; however, the optimal response commonly depends on the cause that triggers the intervention. Thus, the optimal group composition is case sensitive and requires on-demand defined groups of individually switchable assets. However, the approach can as well be based on predicted load and generation schedules to derive dynamically adjusted power ingress limitations as presented in [
6,
10]. This dynamic proactive approach can also solve the systemic unfairness of simple curtailment in respect to the customers’ position along feeders [
11].
3. Traffic-Light-Like Control Attempts, Methods and Examples
Signalling among energy systems can be reduced to two principal approaches: (a) energy prices and incentives or (b) the physical states of assets and resources and groups thereof, e.g., renewable energy sources, individual feeders or entire grid sections. Price benefits and incentives invite the end customer to adjust the energy consumption such that their energy bill is optimised. The latter tells customers, i.e., their EMSs and smart appliances, to adjust their behaviour, in order to prevent the grid operator from having to shed loads, to curtail local RES or to disconnect selected feeders.
The common aim of recent TLS proposals is to enable smart energy products and services. Ensuring and supporting permanent system stability and supply safety are not always prime goals but are often envisaged or at least considered. The traffic light states (colours) introduce conditions to the application of the regulated (grid) and the non-regulated (market) mechanisms in terms of shaping the freedom of energy suppliers and customers to use power grid resources controlled and maintained by the affected chain of adjacent grid operators.
3.1. Renewable Energy Availability Indication
The examples are manifold. Many renewable power plants present their current state publicly using visible signals or counters that show the amount of produced renewable energy. Circling windmills transport the same message in the vicinity. Most residential battery electric storage systems (BESS) and smart PV-inverter provide means to indicate the current state. Often, these use colour information right on the device that can be grasped and considered subliminally. An indicator bar on a wall mounted battery in the living room or in the garage next to the electric vehicle (EV), will most likely influence the user on a very transparent and also subliminal level.
Energy Elephant: The
Smart Energy Traffic Light provided by
Energy Elephant [
23] provides a short-term (one day) forecast indicating the amount of RES shares in the electricity mix by traffic light colours. Whenever the electricity mix promises to be ecologically
”green”, the
green light shines, and vice versa, the
red light is on when the electricity mix is expected to be more
”grey” because most of the energy will be generated from
”dirty” fossil sources. Actually, the four colours shown in
Table 1 are used. A smartphone app and the webpage [
23] are the prime tools to access this information. The very true slogan promoting their traffic light system reads: “
How clean your electricity is really depends on when you use it and not on who is supplying it to you.”
Both smartphone- and webpage-based information is destined for the enthusiastic individuals that take on the burden to regularly check the information and that do not lose interest as time passes. The number of enthusiasts may remain limited if no immediate incentive is provided. To overcome this confinement to the eagerly interested, Energy Elephant created, in conjunction with the Trinity College Dublin, an open-source physical traffic light that changes colour depending on the current state of the Smart Energy Traffic Light System. This can be placed in public areas to show how ”green” the current energy supply is. Passers-by and people resident in visual range receive the information and can intuitively adjust their energy consumption behaviour. That may be insignificant in the beginning, but the persistence of the live information and the high number of people subliminally reached scale up the impact. The aim is optimally achieved when noticing the publicly shown traffic light colour becomes a subconscious habit, and the daily energy consumption behaviour of local citizens is persistently adapted to the daily recurring temporal pattern of traffic light phases.
3.2. Energy Market Based Load Management
Price-driven DSM is commonly market centric. The prime aim is to shift the demand caused by the customers to times where ample energy is available. Allocating a higher energy price (red signal) to peak hours and a lower price (green signal) when production capacity is commonly idle triggers the customers to adjust their consumption behaviour, i.e., to shift loads. All market-based mechanisms are speculative. Electric energy is traded on the national and international energy markets, i.e., is sold and purchased ahead of time, where E is the energy, and frame the time interval in which the sold energy shall be produced and delivered, and is the instantaneous power generated and consumed at time instance t. Hence, we assume energy trading entirely decoupled (unbundled) from grid operation, where grid limitations are neither considered in the trading nor in the energy pricing. Grid fees (tariffs) are assumed to be an independent (regulated) matter.
MeRegio: The German research project MeRegio (
Minimum Emission Region) implemented an energy price-based TLS approach [
24]. A device or smartphone-app called “
Stromampel” told the customer the current energy price and the expected changes over the next 24 h [
25]. Three colours were used:
red—standard price,
yellow—
saver rate and
green—
supersaver rate. According to [
26], a permanent shift of 12% load from peak times to off-peak times and 4% load from high to off-peak has been achieved with these price signals in different research projects, including the MeRegio project [
27]. Further, it is stated that peak and off-peak prices commonly also achieved load savings, ranging from 5% to 8%. Again, the statement in [
26] refers to several studies, here including the
moma project [
28].
eFriends: The Austrian start-up
eFriends Energy GmbH offers a solution to end-customers that indicates the availability of mostly PV-based electricity from peer members [
29]. Their slogan translates to: “
Shared electricity is better electricity”. The hardware called “
eFriends Watch” is a cube with eight lights. The more lights are alight, the more electricity provided by friends is currently available and used. A smartphone-app provides more detailed information, including information on how efficiently a customer uses shared electricity. The hardware enables intuitive behaviour changes, as with the
Smart Energy Traffic Light provided by
Energy Elephant. The app information provides direct feedback on the individual performance in using shared electricity from friends.
In contrast to the Irish Smart Energy Traffic Light, the information is not public and does not refer to the general electricity mix on the grid. eFriends constitutes a kind of citizen energy community with an internal market for the shareable electricity generated by friends. The price for the shared energy is settled bilaterally among friends. Grid fees (tariffs) and taxes apply independently, and clearly, running the community is the core business of the eFriends Energy GmbH. Therefore, we consider this to be a market-related system even though the shared electricity is traded privately among friends only. The energy that members require in addition to what they receive from friends is provided by regular electricity suppliers and possibly by eFriends as a joint supplier, who purchases the energy as usual on the national energy market. Constraints relating to the transfer of power from one friend to some other are not considered by the signalling system.
The share of renewable energy in the electricity mix is actively increased in case customers consume energy at times when volatile sources can readily provide the energy, given that two requirements are fulfilled: (a) renewable sources have unrestricted priority over sources with an unfavourable impact (e.g., release of fossil CO, causing dangerous waste, or imposing hazardous risks) and (b) energy from volatile RES takes priority over easily controllable RES, in particular those with a raw-energy buffer (e.g., pump-hydro power stations) required to compensate the volatility of the other RES. Traffic-light-like signalling can be used to achieve the required awareness change on the customer side.
3.3. Energy-Grid-Based Signalling of Resource and Infrastructure Status
Whereas most transmission grids are closely monitored and dynamically managed via a SCADA centre, most distribution grids are barely monitored or managed. Traditionally, fault detection was based on analysing customer complaints. All load assignment was assumed to be static. The worst case voltage drop from the last transformer until the customer at the far end of a feeder was assessed in the grid-planning phase, when the grid topology and the capacity of wires is decided, long before electricity is distributed. Modern distribution grids in urban areas are planned to support topology adjustments. Often, the topology consists of interwoven rings with remote-controlled circuit breakers to connect and disconnect sections. The advantages of such an adaptable distribution grid include the flexibility gained from the many possible topologies that can be realised, e.g., to isolate faults [
30,
31], as well as to provide capacity on demand. While the former increases the supply availability, a key performance indicator for grid reliability, the latter can save expensive rewiring when some load can be reassigned to a different feeder in order to fit in a new customer.
The introduction of many DERs, in particular customer-owned power generation that inserts power directly into the grid on the low-voltage level, changes the energy flow paradigm assumed for grid planning. For a net-zero municipal district, the local distribution grid transports, on average across all customers, an equal amount of energy to and from their connection points. While net-zero means that the sum over the year shall be zero, it does not apply balancing per day or hour or any shorter duration. This means that sometimes the energy flow must be reverse, transferring electric power from lower grid levels to higher levels in order to achieve the long-term balance—the net-zero criterion. Consequentially, wires in the distribution grid are not operated at their capacity limit most of the time. Peaks occur temporarily and mostly within predictable time periods.
A distribution-grid-based TLS can enable better off-peak utilisation of distribution grid resources. Local energy transfers among peer customers connected to the same distribution grid can be enabled during off-peak times. To ensure that such transfers do not endanger grid operation and grid safety, the participating customers need to be prevented from performing such transfers when it is not safe to do so. Meaning, such transfers shall be enabled during green phases only. At the same time, a controlled local power insertion or draining can also serve to stabilise the grid if, during red phases, the flexibility of switchable loads may be controlled by the local grid operator. Thus, a grid traffic light is needed to inform smart energy devices on what to expect and how to behave.
TP-SGA Smart Grid Traffic Light: The traffic light model shown in
Figure 4, developed by the
Technology Platform Smart Grids Austria (TP-SGA) [
www.smartgrids.at] in coordination with other organisations, including the German
Bundesverband der Energie- und Wasserwirtschaft e.V. (BDEW) [
www.bdew.de, accessed on 1 December 2021], interprets the
Red state as an indication of immanent risk to grid stability or safe operation. This extreme state allows the DSO to intervene in order to maintain grid stability. Possible interventions are power ingress curtailment and load shedding and, if inevitable, the subsequent disconnection of less critical feeders. Maintaining a reliable power supply to critical customers and infrastructures is key.
Green light indicates that sufficient grid capacity is available to customers without restriction.
Yellow indicates that optimisation is needed and actions by customer systems are necessary, for example, adjusting the insertion of reactive power or turning off non-critical loads, i.e., executing demand response actions [
26]. The numerous contractual and regulatory requirements in Germany and Austria are found to pose a problem. They tend to be very detailed and restricted to the existing system, thus, causing serious integration difficulties for novel optimisation and control approaches.
BDEW traffic light concept: A similar approach towards a traffic light model for evaluating the grid status was developed by the German Association of Energy and Water Industries (BDEW) [
32], which is also the basis for the above-outlined TP-SGA model. The main purpose is to postpone the high investments required to expand the distribution grid in the traditional way for the integration of uncontrolled volatile RES and EV charging. The traffic light model is intended to reduce the need for grid expansion by utilising flexibility, which shall determine the phase (colour) of the traffic light [
33]. For a specific period of time and network segment, the proposed traffic light signal shall present the grid status using the following colours [
26,
33]:
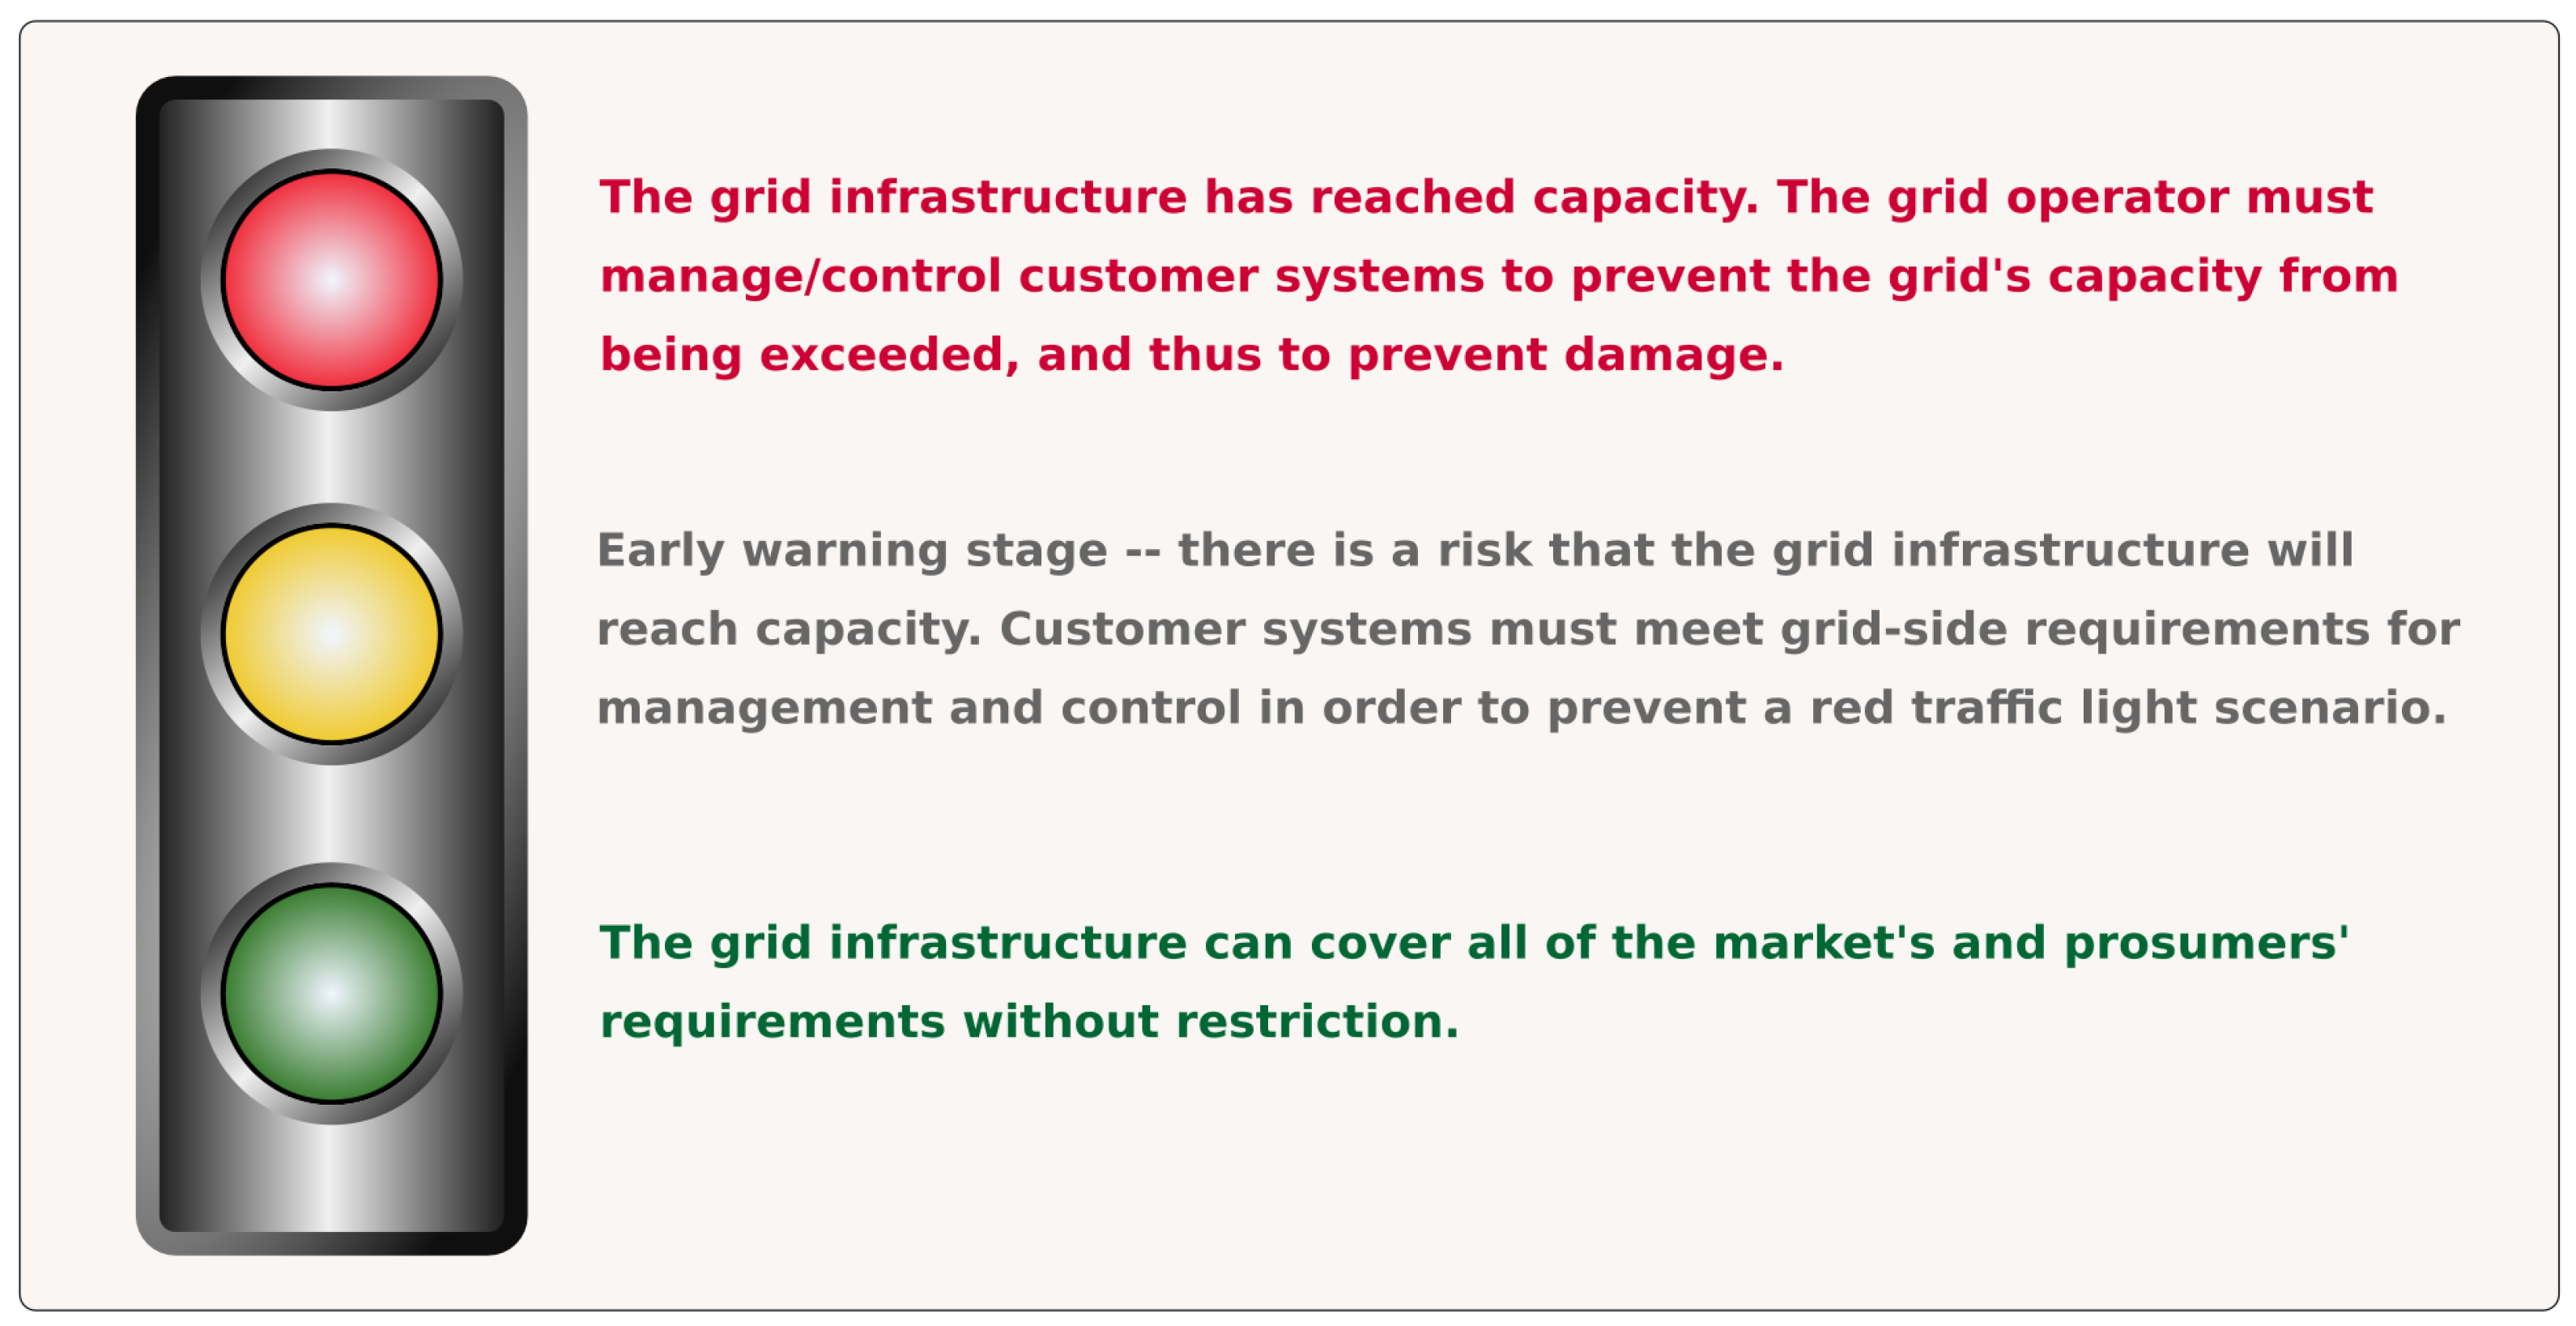
Green indicates that all market-based energy management processes can be implemented without restriction. No critical grid situations exist.
Amber indicates a potential or actual, yet not critical, capacity shortage in the defined grid segment. Customer systems should adapt their consumption or generation to the needs of the grid in order to prevent a red light state.
Red indicates that grid stability is compromised and that the grid operator has to act to prevent damage to grid resources and also to assure supply security and safety.
Depending on the traffic light colour, certain rules apply for the interaction of the entities that act according to the relevant market roles they play in the energy system, such as supplier, generator, storage facility operator or the statutory regulated BRP and grid operator role [
33]. The green phase (market phase) persists in today’s power grid and only in rare extreme situations does it suddenly switch to red (grid phase) [
33]. New is the amber state that is intended to prevent red states as much as possible. Recommendations and an outlook on expected future needs are provided in [
32]. According to [
26], different interpretations and recommended responses for the amber state persist.
To be implemented in practice, the grid load, i.e., feeder and connected DER states, need to be monitored constantly. Achieving that requires a huge investment, because today the LV grid is commonly only sparsely monitored. A great deal of manual work and time is required to install widespread monitoring along thousands of feeders per grid operator. In addition, the interaction and means of communication need to be defined among market participants and grid operators. Smart energy systems and solutions will heavily depend on this interaction and the associated rules of engagement.
3.4. Meta Signalling Merging Market and Grid Area
The grid TLS, persisting in Germany when discussing flexibility needs since 2011, aims to integrate energy market stakeholders in the mitigation of expected congestion according to the measures enforced by German law, i.e., § 13 EnWG. The signal shall be set by the responsible grid operator based on technical criteria, individually for each economic independent grid segment: every feeder, each of the medium voltage distribution grids and also independently for the interconnecting high voltage transmission grids. It shall be used for both short-term as well as persisting congestion management [
34].
Green traffic light indicates the market phase, where no critical grid conditions constrain the energy transfer across the electric grid. All eligible energy services can be used and executed without restrictions. The self-regulation mechanisms of the free market shall yield the most competitive energy supply to all customers. Financial incentives shall be used to optimally utilise volatile RES, while the grid operator shall monitor and route the energy flows, as appropriate. Balancing is achieved by using all kinds of reserve energy sources, commonly controlled across the balancing group by the locally responsible TSO/BRP.
Red traffic light indicates the grid phase, where grid stability and operational safety is imminently endangered. To avert failure propagation and potential cascading effects that eventually lead to a widespread grid failure (blackout), the local grid operator shall use the own grid equipment (e.g., breakers to drop off less critical feeders or critical feed-in) and where possible also local customer assets (directly controllable generation, storage systems or loads of size) to instantly mitigate and eventually solve the problem as close to the source as possible. Stability needs to be fully regained, before the emergency state may be lifted. For the security of the energy supply, red states shall be rare and short and generally prevented.
Yellow traffic light introduces an intermediate phase, where the intelligent interaction of grid and market mechanisms, e.g., re-dispatching, can hopefully prevent an imminent red light state. Grid congestion, i.e., temporary bottlenecks in distribution and transmission capacities, shall be considered and managed jointly. Safety of supply has to be maintained (no drop-offs), but optional services and products shall be used to stabilise the situation and not to optimise profits. The grid operator will use contractually provided flexibility from generators, consumers and storage facilities, either directly in accordance with individual agreements or indirectly through measures agreed with suppliers. The BRP and affected
Imbalance Settlement Responsible (ISR) parties [
35,
36] shall be included and informed to correctly distribute the incurred costs. Active customers can benefit from offering their flexibility for stability maintenance, i.e., their grid support will be rewarded in this phase.
The aims and intended mechanisms have been discussed for a long time. To the best knowledge of the authors, a realisation has not been reported or according reports were not made publicly accessible. It is possible that realisation concepts have not been developed and investigated yet. The signalling concept presented next could be a candidate to support realisation. However, the gap primarily addressed by the proposed TLS is the missing digital communication between local energy producers, the local DSO and their direct customers.
4. Signalling for Grid-Friendly Customers and Energy Communities
Based on the traffic light examples outlined above, we develop a traffic-light-like signalling approach intended to enable grid-friendly energy community operation. Active customers may evidently be addressed equally and are implicitly considered even if not explicitly mentioned.
Power delivery to a region is organised using assumed (empiric) daily power schedules (standard load profiles) scaled by the average demand of the respective customers to predict the expected demand. The true power demand at any time instance varies from day to day and, thus, deviates from the assumed schedule. Across many customers, the well-known central limit theorem projects normal distributed deviation from the assumed demand but only if the individual loads caused by the aggregated customers are statistically independent. Congestion occurs where the power flow reaches a level, over time and intensity, that cannot be handled regularly by the affected grid resources, i.e., when local or up-grid resources become overloaded.
The DSO operating and maintaining a grid section is responsible for mitigating critical situations concerning the resources managed and also to assure the security and safety of electricity supply.
Figure 5 shows the required and potential actions of a DSO with respect to different traffic light colours. Depending on the cause of the current issue, e.g., violation of the upper or the lower voltage limit, the DSO is expected to respond accordingly. Which actions a DSO may and can execute depends on the situation awareness and the available control capabilities. Both are commonly determined by regional regulations and policies on how DSOs are allowed or even forced to respond to supply issues and how they have to assure supply safety and security in general. A core requirement is securing the supply for critical infrastructures as long as possible.
The entities potentially affected by DSO actions, being all customers in the region including active customers and energy communities, will also prepare themselves for DSO actions in the case that they become aware of the grid state, meaning that they are equally informed about the current traffic light colour, as shown in
Figure 6. They may take preparatory actions to ready their appliances for impending DSO actions, e.g., power disconnection or generation curtailment. In addition, they may confine their grid load to reduce the local volatility.
To calm the grid load further, active customers may empower the DSO to directly control parts of their generation assets and energy appliances, i.e., they can offer their flexibility as an ancillary service for an adequate reimbursement. However, if grid safety relevant ancillary services are offered, the seller has to assure that a promised generation and/or load change can actually be executed. If no assurance can be provided, the value of the offer may be considered minor. Commonly, the compensation for not delivering what has been offered exceeds by far the revenue from offering in the first place.
In general, active customers and communities, like all customers, will utilise available resources as carelessly as they are allowed to. In case the traffic light shows green, all the entities’ EMSs can operate freely, meaning selfish, independent and focused on the entities’ profit and well-being, maximising comfort and profitability. To prevent expectable critical situations, individual EMSs may also introduce proactive control using the local entity internal knowledge on planned (scheduled) load and production cycles as wel as learned grid state behaviour patterns, i.e., typical grid state progression sequences and timing. The still selfish intention of performing individual grid state prediction is to reduce the risk and potential frequency of red-light situations with all the associated negative effects to cope with. Related tasks are listed on the left in
Figure 7. On the right, we find expected responses of an EMS on behalf of the system user, e.g., an energy community or active customer.
The most effective feature that a local EMS provides is temporal load limiting and shifting. In response to a traffic light changes, loads can be adjusted ex post only. Within an energy community, individual EMSs can perform ahead of time load balancing by coordinating predicted local loads and supplies to optimally make use of local resources. Along with this supply–demand matching task, red-light prevention shall also be considered a prominent objective. Maximising the minimum headroom between the locally predicted grid voltage and the statutory upper and lower voltage limits is a straightforward approach to lessen the probability for red-light situations. Staying actively away from limits shrinks the likelihood to violate a limit just because of the inevitable uncertainty that results from the in detail rather unpredictable individual demand and the volatility of local RES generation.
Optimal utilisation of local RES and energy distribution among the members of an energy community does not necessarily correlate with supporting the local grid operation. Introducing signalling, like the proposed TLS, shall enable a more cooperative and more situation-aware control of local assets and resource sharing. How the flexibility of energy community members and active customers can be characterised and aggregated in general, e.g., to jointly respond to a changed grid state, is presented in [
37].
When the grid situation is green, the energy community, its members, and active customers are free to perform as they please, within regulations, i.e., as usual. During red light periods, the local DSO shall be empowered to directly control the local power production and demand, transparently and evidently without buffering or trading the controlled energy flows to gain profit, i.e., strictly restricted to temporal grid stabilisation. In a yellow light phase, the prime objective of all stakeholders shall be returning to a green grid state with minimal restrictions on the individual energy customers’ freedom to make use of different energy services. Common customer needs shall be entirely fulfilled, only the added freedom and extra capacities made available locally for bilateral energy exchange among peers, shall be curtailed in order to return to a green grid state as quickly as possible.
The intended responsive tasks of different energy system entities that shall contribute to the stability and safety of the local distribution grid are summarised in
Table 2. Active customers, including members of energy communities that can control some appliances and assets, are expected to cooperate actively. They shall restrict their power insertion and draining to limits
that are considerably lower than their
determined physically by their access-point fuses. The restriction shall apply more or less instantly, when the traffic light changes from green to yellow.
Such a load cap increases the headroom available for the grid operator to mitigate most of the power level issues that likely cause a yellow state. This automated, instantaneous, initial, grid-friendly response, shall at least postpone further degradation of the grid state from yellow to red. Even if this first response does not prevent a subsequent red state by itself, it will provide the grid operator with more time to counteract, and thereby the number and duration of red light situations will be drastically reduced to the benefit of all. In general, the responses to state changes shall be pre-planned to best perform the tasks mentioned in
Table 2.
Table 3 lists a selection of possible preparatory tasks to be performed by the different entities involved.
Grid-friendly energy community actions can be beneficial also in the green state in the case that these reduce the likelihood to leave the green state where energy communities and their members can operate freely to maximise their benefits. The local DSO may grant cooperative energy community members some extra access capacity to distribute energy among peers in exchange for their support on maintaining grid health. However, trust is required to qualify for serving the public good. A seamless monitored, transparent, reliable, certified and ultimately admissible execution of power and energy management and control tasks is mandatory. This may be implemented on the community level, but the actual execution needs to be performed reliably by shared as well as privately owned and operated assets.
Prepare alternative asset behaviours for different grid states: To exploit temporarily unused grid capacities, peer-to-peer energy transfers shall consider the current grid state (green/yellow/red) communicated by the local DSO. Accordingly, the transfers can be more, less, or not at all aggressive concerning the stress posed on different segments of the local grid. A TLS, such as the one proposed, can enable this differentiation, if provided section wise and given the local DSO has sufficiently granular grid monitoring installed. In that case, energy communities and active customers can effectively help to improve both the local grid stability and the utilisation of local grid resources and connected RES.
In case no signals on the grid state can be provided by the local DSO, the energy community may still attempt to be grid-friendly by monitoring the supply quality (Voltage,
) at the members’ access points and predicting the grid state [
38]. Capable smart meters might provide this information in real time, otherwise, customer-owned power quality meters need to be installed behind the meter to perform synchrophasor measurement. Theoretically, if a sufficient share of the local energy customers participate in local energy communities with power quality assessment, these may sell the gained information to the local DSO not having the required means to perform the distributed power quality monitoring down to the last detail.
The approaches to integrate end-customer flexibilities in the stabilisation of the local grid are manifold. Identifying the optimal method depends on the local situation and how many from the plethora of interrelated parameters are accessible to predict the local, grid-segment relevant, demand and supply. Many recent research activities focus on machine learning, i.e., model predictive control, deep neural networks and reinforcement learning, to name the most prominent. A selection of very recent approaches to utilising local flexibilities and performing hierarchic balancing can be found in [
7,
8].
5. Discussion
The global energy system is in a state of flux caused by the essential transition toward 100% RES. Related changes demand much care and step-by-step implementation because both civilisation and the economy depend on a stable and seamless energy supply. Adding more detailed grid state monitoring and a simple versatile signalling scheme is a first step. Sector overarching information is the key to integrated smart decision making in a scalable distributed control regime. The proposed TLS is yet a meta concept that outlines selected tasks and options to be considered for realisation. However, instantaneous power quality metrics, i.e., voltage and phase angle, are complex and not easily understood by some stakeholders, e.g., many customers. They are also conceptually difficult to aggregate and interpret for entire regions and grid sections. Traffic lights can be easily aggregated applying the “most critical signal dominates” rule. It may be surprising, but simple rules and tools can effectively control complex (swarm) systems very efficiently. In addition, history has shown that simple solutions often have the better chances for success than complex ones. One reason is versatility, others are ease of understanding and the simple realisation of the underlying mechanism.
When to signal which colour to which customer segment and assets group is a complex decision. Broadcasting the same signal to all may cause a response cascade and consequential control oscillation. Addressing a specific group may trigger an insufficient response if too few respond too weakly, or vice versa excessively, if too many respond too heavily. How to specify the colour thresholds is intentionally left to the parties that need to host more RESs in their systems. Only the DSOs have the detailed information on the local situation required to set the regional thresholds for optimal feeder and grid segment utilisation. The Advanced Metering Infrastructure (AMI) operator has the information required to communicate idle RES capacities and could also provide predictions on expectable volatility at different aggregation levels. Whether information will be provided is a regulatory matter because in many places these players directly report to public authorities.
Regarding energy demand control, i.e.,
demand response (DR) schemes and
demand side management (DSM) attempts, it is important to first know the aim and which part of the energy system shall be primarily addressed: a particular energy market, the grid operation or customer behaviour and environmental impact. In practice, these are not entirely decoupled, and many mechanisms, available and needed in the near future, address particular parts. DR based on energy price signals is clearly market centric and focuses on the customer behaviour. Performing DSM may respect environmental aspects, but commonly economic interests prevail and are required to facilitate the financial investment in enabling technology. Where the intention is to maximise the utilisation of RES, we need to differentiate whether the focus is on utilising intermittent local RES capacity in the neighbourhood, meaning in the responsibility area of the local DSO, or on using RES in general, connected anywhere to the transnational power grid operated by a TSO. The latter is achieved via the day-ahead and intra-day energy markets, where systems, like the examples presented in
Section 3.2, could be applied. The former is more demanding, it requires direct just-in-time information on the state of locally available RES and on the idle grid capacities. For these the presented examples from
Section 3.3 as well as the TLS proposed in
Section 4 may be used.
In
Table 4, we attempt to compare the features and aims of different TLS proposals, including grid codes as base-line. The aims listed in the first column refer to: (1) whether the current availability of RES can be considered, (2) if the energy supplier can profit, (3) if grid operation is supported, (4) if customer needs are considered, (5) if signals can be targeted at specific DER/customer groups, (6) if the TLS can be focused on scalable regions, (7) if the TLS allows individual responses per DER/customer, (8) whether other (similar) signals can be considered in parallel, e.g., multi-supplier regime ready, and (9) whether the TLS is capable of supporting increased RES hosting capacity.
Finally, please note that MeRegio is purely driven by intra-day price prediction. Supporting RES usage is based on the presumption that low prices result from ample RES capacities only. In regions where this is not true, a different basis needs to be used to define the colour signals. Similarly difficult is the interpretation of the study results provided for the other TLS approaches; none includes a generic proof. Therefore, the assessments shown are intuitive and not solid. Scientific rigour demands to reassess them for the actual environment and demand composition scenario, i.e., case-to-case. Hybrid approaches are typically designed on a meta level as the example presented in
Section 3.4 shows. These affect more the applied energy system operation objective than the individual behaviour, though the latter shall somehow follow the state dependent adjustment and dynamic prioritisation of diverging objectives.
5.1. Integration in the Temporally Separated Control of the Common Energy System
A core question is the signal and response timing. In a red light phase, the DSO interaction should be deterministic to enable stable control loops. Operation technology (OT) communication channels and procedures are required to achieve that. During yellow and green light phases, the response times are less critical, such that common information technology (IT) communication means and protocols suffice. Whenever the traffic light switches from green to yellow or yellow to red, the local adjustments shall be achieved as soon as possible to best prevent further deterioration of the situation. The response times within different traffic light phases relate (a) to the timing required for safe grid management during a red light phase and (b) the energy market related timing during yellow and green light phases.
The distributed customer side asset management, which shall be enabled by the proposed TLS, adds to the existing management and control mechanisms and does not replace them. The first-order response of connected production assets to grid state deviations in terms of frequency and voltage shall remain regulated in the respective grid codes; only extended by the flexibility to apply different parameters, schemes and thresholds in response to different traffic light phases.
Second order reserve power is inserted as ordered by the BRP, calling on assured reserve capacities available on demand. The customer side response to traffic light changes may reduce the required reserve volumes but commonly not all and not with sufficient reliability to replace reserve power provisioning entirely. However, in respect to reserve power, traffic lights could be used to indicate whether sufficient reserve capacity is regionally available to cope with predicted local deviations and second-level requests. A red light could indicate that all the assured reserve is in use, a green light when it is entirely available and yellow if partly occupied. If customer assets respect these signals and trigger an according confinement of demand and supply volatility, an integrated, sector overarching, fully distributed reserve capacity versus load volatility management may be achieved.
In addition to the availability of reserve power, we need to consider the timing of possible actions and responses, as sketched in
Figure 8, for an exemplary sudden generation capacity loss that causes a severe frequency drop. Instantly, the inertia of synchronous rotating masses levels short term deviations. Next, within a few seconds, the automatically triggered first-order reserve capacities become active and level out any persisting imbalance via the individual responses in respect to grid codes. Depending on the current traffic light, this first-order response can be more or less heavy. Within minutes, managed by the BRP often being the regional TSO, secondary reserves take over the burden, relieving the first-order reserve capacities and restoring normal operation conditions, which typically relates to regaining yellow light.
To reduce the cost of prolonged supply–demand mismatches on the energy market, third level reserves may be invoked to end the mismatch and release all reserves, commonly known as re-dispatching task. The assets used to take over are best described as power-on-request sources, where some negotiation may take place prior activation. Common response times are in the area of thirty minutes to three hours. The intra-day spot market can serve as a source for tertiary reserve capacity. Price-triggered DR schemes, including aggregators and industry customers that participate in the intra-day energy market, target on selling tertiary reserve energy. A specific traffic light system may be used to indicate available asset flexibilities and idle transmission capacities. Such tertiary on-request mechanisms are commonly implemented on the market level.
A perfectly cellular grid will perform the balancing cell-by-cell, at least as far as physically possible. However, a closed energy market per cell will not solve all issues internally. Help from neighbouring cells shall distribute the risk. To share reserves across cells, a solution to distinguish which cell can take how much burden in providing and transferring reserve power to its neighbours is required beyond cell boundaries [
40]. That requires awareness of the grid state across an entire cell and for each feeder branch that may be used to provide or transfer reserve power. Based thereon, neighbouring cells can be kept informed, e.g., using a simple TLS indicating the relevant utilisation. As already mentioned above, the same traffic light signal can facilitate responses on different levels, i.e., market and grid wise, in parallel.
5.2. Barriers on Realising Domain and Sector Overarching Signalling
Several barriers to implementing and using TLSs that could enable a better utilisation of distribution capacities, result from the required partial inversion of the control paradigm, away from the puristic supply-follows-demand strategy to a more proactive grid state responsive, fine-tuning of local demands across domains beyond the traditional sectoring. Main issues result from tradition, e.g., existing policies and legacy control concepts, as well as concerns about scalability and economics:
Lack of monitoring systems at the LV grid level (smart meters, power quality monitoring etc.) due to their huge number and deployment cost.
Exaggerated resilience, security and reliability policies (regulatory stipulations) designed for major industries equally imposed on minor private stakeholders.
Regulatory uncertainties (ambiguous legislation) concerning the actual engagement of end-customers in new and existing energy markets.
Entities more focused on protecting their profits than supporting political, societal and ecological aims toward reaching a win–win situation.
Missing end-customer awareness of the potential profits that may be gained from direct engagement in energy markets and on the aligned risks.
Focus on engaging few large-scale end-customers, i.e., industries, due to their high flexibility potential, instead of the in total far more powerful millions of household customers with their comparably small flexibility potential each.
Demand for unattainably accurate forecasting solutions and perfectly realistic system models required to reliably avoid all issues imaginable, i.e., the exaggerated expectation that prediction errors can be infinitely minimised.
Expectation of a perfectly assured economically profitable business case for DSOs that validates the extension of the LV level monitoring systems (i.e., demand for zero investment risk justified by the fact that the customers pay for it).
Capable smart meters could provide the required distributed monitoring. However, a comprehensive deployment of useful hardware has not yet happened. A quick refurbishing process is needed to enable smart decisions taken by smart meters toward cooperative demand management. Price signals are the natural means to communicate market wishes, whereas traffic-light-like signals appear more appropriate to communicate distribution grid-related, easy to understand information. Both are provided and needed to influence local decisions (system friendliness) of smart customers and flexible energy consumers.
Adding DR opportunities and smart DSM behind-the-meter shall be closely monitored to quickly identify behaviours and regulations that contradict the energy transition aim. A plurality of regulatory sandboxes is needed to effectively learn how to optimise the individual response to grid and market-based TLS-like signals. Sector overarching vision and open-minded learning is needed to determine the optimal energy transition support considering both customer preferences and connection point constraints, equally. Equally challenging is the decision on how to choose the colour switching thresholds because these depend on the local grid characteristics, e.g., section topology, capacity reserves and the local tap changing options. Individual studies demonstrate potentials but neither the limits nor general applicability. However, without grid state signalling such as the proposed, the new active customers and energy communities will not be able to be economic and grid-friendly at the same time.
6. Conclusions
Grid-state consideration in the local decision making by smart appliances appears to be an urgently needed addition to the centralised, market centric, mostly day-ahead settled, aggregation-based approaches. The latter can cover predictable volatility but not the local small-scale instabilities introduced by millions of distributed renewable sources. Traditional reserves, such as fast adjustable bulk electricity generation and large-scale balancing reserves (e.g., pump-storage power plants), are evidently needed to cover daily and seasonal effects but appear oversized and far away to compensate short-term effects of local wind gusts and occasional clouds passing over PV equipped roofs in the realm of a single LV grid.
The first control instances are the grid codes. Adjusting their impact follows when the disturbance persists and with a sectional effect that is triggered by changing the local grid-traffic-light signal. Local balancing is the pristine topic of micro-grids. Connected to the grid, the influence and response of higher grid levels relaxes the balancing challenge. However, the impact of minor local deviations on grid levels still should be confined locally. To enable a more flexible and dynamic use of distributed resources, we proposed a simple, homogeneous, still versatile and adaptable, easy to implement state signalling, where the term ’state’ indicates ’health’ as for a living organism. For example, the currently available relative headroom to handle predictable load variance in terms of voltage deviation and thermal load (i.e., losses) might be considered as the state the traffic-light-colour is referring to. What the colours actually refer to is secondary as long as the response of the signal recipients matches the intended reaction. To achieve the required overarching cooperation of involved systems, both the provisioning of traffic light signals and the responses shall be standardised and covered by regional regulations.
How to best perform the traffic light switching needs to be evaluated case-by-case and may, for example, be achieved by recurring reinforcement learning. How environmental characteristics influence the threshold setting also needs to be studied. Recommendations on how to configure traffic light systems to achieve certain targets are also pending. First, the signalling itself, the transport of the traffic light signal and the required state monitoring, need to be conceptually available and agreed across vendor, stakeholder and even some silo boundaries in a co-creation process before proceeding toward a detailed evaluation. The scientific and the engineering community is invited to contribute ideas, strategies and solutions, i.e., to take up the idea of the proposed TLS and investigate how versatile it is (or is not). We and our project partners, including the Smart Grids Austria technology platform, will promote, contribute, realise and evaluate the openly proposed sector overarching concept presented in this article in ongoing as well as upcoming national and international research and development projects.


