1. Introduction
Crude oil prices and investor sentiment is crucial for our economic development. Crude oil, as a core source of energy, is essential for the global economy. Oil price fluctuations affect a country’s economic development and social stability through various channels. For instance, increase in oil prices results in the increase in production cost of goods and services, leading to further inflation, and affect social stability and consumer confidence. Existing works mainly explore the impact of crude oil price on macroeconomic variables, such as gross domestic product [
1,
2,
3,
4], the consumer price index [
5,
6], inflation [
7,
8,
9], interest rate [
10,
11], financial cycle [
12], stock market [
13,
14,
15,
16,
17,
18], investments [
19], unemployment [
20], economic policy uncertainty [
21,
22], and so on. Boubaker and Raza [
16] employed a multivariate autoregressive moving average generalized autoregressive conditional heteroskedasticity corrected Dynamic Conditional Correlation (VARMA-GARCH-cDCC) model and wavelet multiresolution analysis to investigate the spillover effects of volatility and shocks between oil prices and the BRICS stock markets at different time horizons. Their results manifested that oil price and stock market prices are directly affected by their own news and volatilities and indirectly affected by the volatilities of other prices and wavelet scale. However, oil price fluctuations also affect microeconomic activity, such as stock pricing [
23], consumption [
24,
25,
26], investor concern [
27,
28,
29], investor sentiment [
30,
31,
32], and so on. For instance, crude oil prices may influence investor sentiment through both the real economy and the stock market. Investor sentiment is a belief about future cash flows and investment risks. On the one hand, oil price shock impacts macroeconomic, thus affects investors’ confidence and sentiment towards their economic activities. On the other hand, fluctuations in the price of crude oil have an effect on the stock market. The fluctuation of the stock market affects the decision making of investors and leads to the change of investor sentiment. Therefore, fully understanding the relationship between crude oil prices and investor sentiment is crucial for our economic development.
Although a number of studies have focused on the relationship between crude oil price and investor sentiment, there is no consensus about the nexus between oil price and investor sentiment. The nexus between oil prices and investor sentiment is complex. Firstly, crude oil price exerts effects on investor sentiment. On the one hand, crude oil price exerts positive effects on investor sentiment. Li and Ouyang [
33] used the investor sentiment index based on the China Securities Investor Protection Fund Corporation’s monthly survey and employed Bayesian inference structural vector autoregression (SVAR) model to investigate the impact of structural oil price shocks on China’s investor sentiment. They found that oil supply shocks and consumption demand shocks exert positive influence on China’s investor sentiment, the effects of which are mainly transmitted by affecting investor’s confidence in Chinese economic fundamentals and the international economic environment. Decomposing the real price of crude oil by SVAR model, KILIAN and PARK [
34] explore the impacts of crude oil demand and supply shocks on the real crude oil price. Their results showed that demand or supply shocks for crude oil contributed to U.S. real stock returns. On the other hand, crude oil price exerts negative impacts on investor sentiment. Employing a SVAR model, Ding et al. [
35] investigated the contagion effect of international crude oil price fluctuations on Chinese stock market investor sentiment. Their results implied that the international crude oil price negatively affect Chinese stock market investor sentiment and the average contagion delay 8 months. He, Zhou, Xia, Wen, and Huang [
31] constructed individual investor sentiment by using data from the American Association of Individual Investors. They revealed that oil prices exert negative impacts and significant long-run and short-run asymmetric effects on individual investor sentiment.
Secondly, investor sentiment plays a role in crude oil price. Based on monthly, weekly, and daily data from 1986 to 2016, Qadan and Nama [
36] used parametric and nonparametric methods to reveal that investor sentiment has a significant impact on oil prices. Yao, Zhang, and Ma [
27] constructed a proxy for investor attention in crude oil market by aggregating the Google search volume index (GSVI) and employ SVAR model to investigate the impact of investor attention on WTI crude oil price. They found that investor attention have a significant and negative impact on WTI crude oil price between January 2004 and November 2016. Choi et al. [
37] used weekly actual position data during 1996–2006 from the COT report to study whether actual position-based investor sentiment is useful in predicting price movements in crude oil. They found that investor sentiments have an insignificant influence on futures price movements in subsequent periods. In addition, some literature forecast crude oil price based on text and web-based sentiment. For instance, Zhao et al. [
38] proposed a new hybrid oil price forecasting model based on web-based sentiment analysis. They found that a quasi-linear relationship exists between oil price and web text sentiment. Li et al. [
39] also proposes a novel crude oil price forecasting method based on online media text mining. Wu et al. [
40] believed that the social media information can reflect oil market factors and exogenous factors, and their study implied that social media information contributes to forecasting oil price, oil production, and oil consumption.
Thirdly, an interaction between crude oil prices and investor sentiment was proven. From the perspective of both the time and the frequency domains, Ye, Hu, He, Ouyang, and Wen [
32] employed wavelet coherence analysis to investigate the interaction between crude oil prices and investor sentiment. Their results indicated that crude oil prices lead investor sentiment and the co-movement between crude oil prices and investor sentiment change with time and frequency. Apergis, Cooray, and Rehman [
30] employed a quantile regression method to find a statistically significant association between oil and natural gas prices and investor sentiment. In addition, He and Zhou [
41] analyzed the interaction between oil price shocks and investor sentiment by constructing linear and nonlinear causality approach, time-varying parameter (TVP) VAR model and NARDL model. Their results indicated that oil-specific demand shock exerts a positive effect on investor sentiment over time, and has positive and asymmetric effects on investor sentiment in the short-run. However, oil supply shock or aggregate demand shock have an insignificant impact on investor sentiment. Furthermore, He, Zhou, Xia, Wen, and Huang [
31] employed Hiemstra and Jones test, the Diks and Panchenko test, and the TVP-SVAR model to investigate the interaction between crude oil prices and individual investor sentiment. Their results showed that bidirectional nonlinear Granger causality exists between crude oil prices and individual investor sentiment, and the interactions between them are time-varying. Under extreme shocks, Wang et al. [
42] explored the causality between the crude oil futures market and investor sentiment by introducing an extended Granger causality approach in the time and frequency domains. They found that the crude oil futures market and investor sentiment show dynamic causality at different frequencies. Additionally, the extreme shock-related causal linkages from the frequency perspective indicate that short-term causality performs better than medium- and long-term causality.
To summarize, a branch of literature has focused on the relationship between crude oil prices and investor sentiment, and has achieved some interesting results. However, there are several aspects worthy of further study. On the one hand, the heterogeneous dynamic correlation and its lead–lag relationship between various crude oil price shocks and investor sentiment in the time and frequency domain yet to be investigated. On the other hand, the asymmetric dynamic correlation and its lead–lag relationship between crude oil price and investor sentiment under different trends of crude oil price has not been explored.
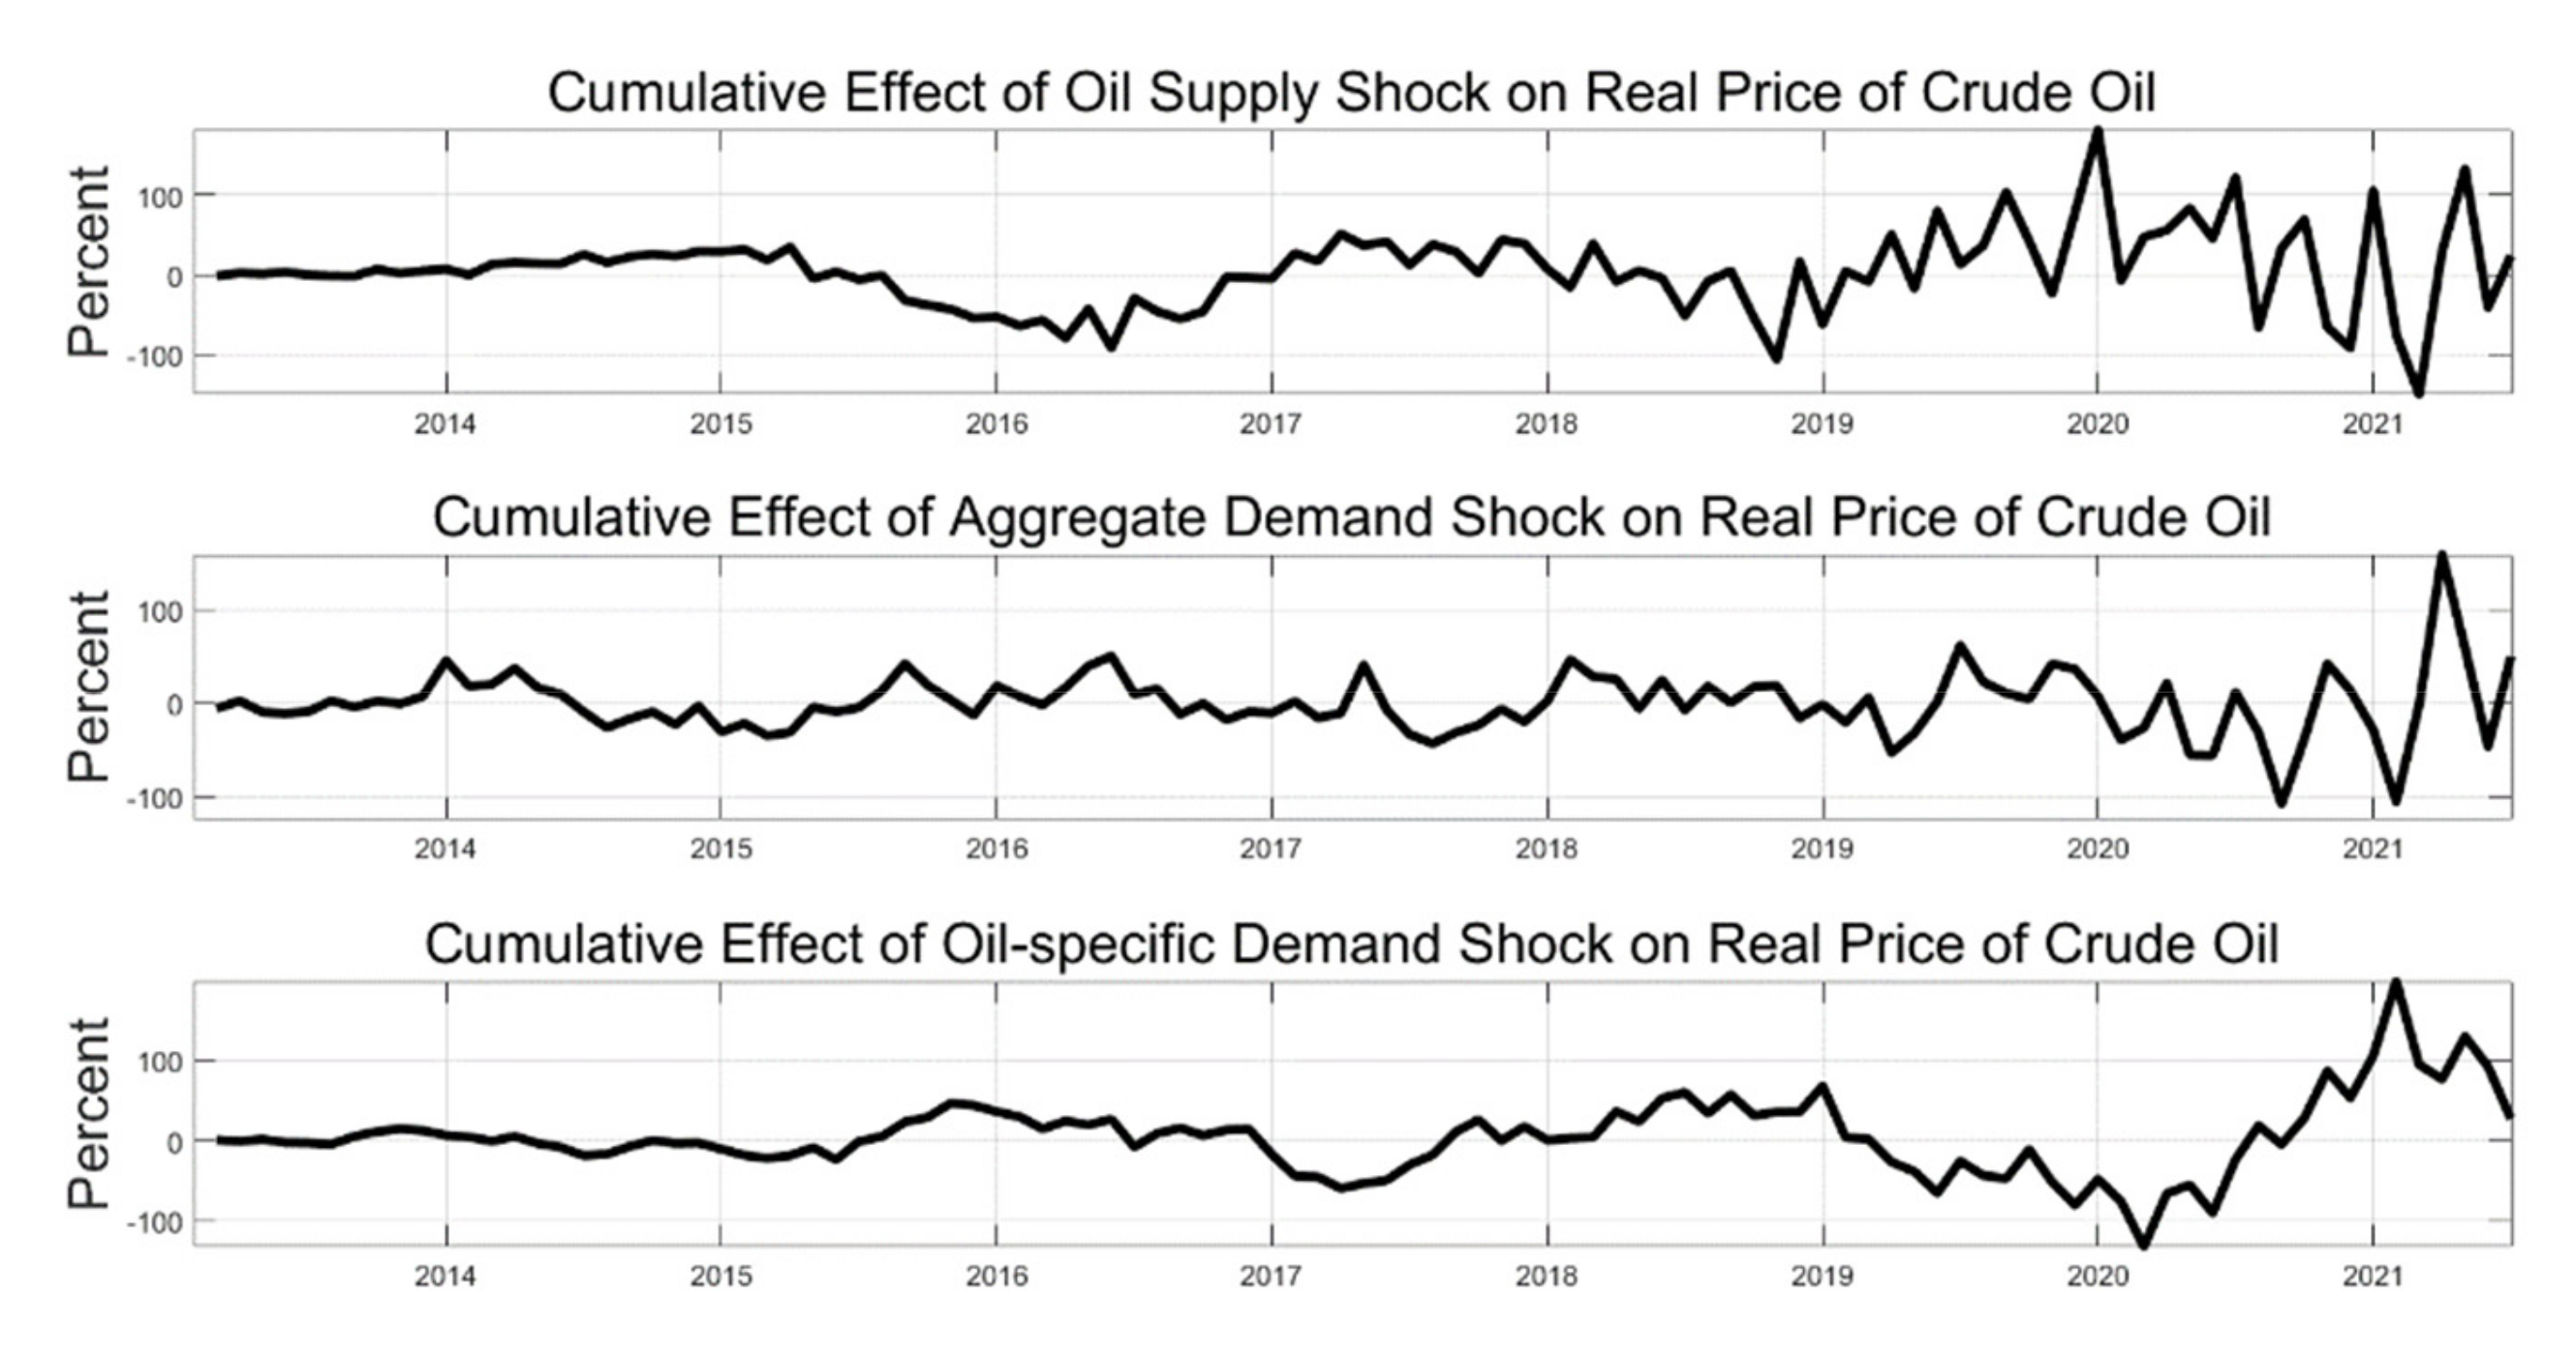
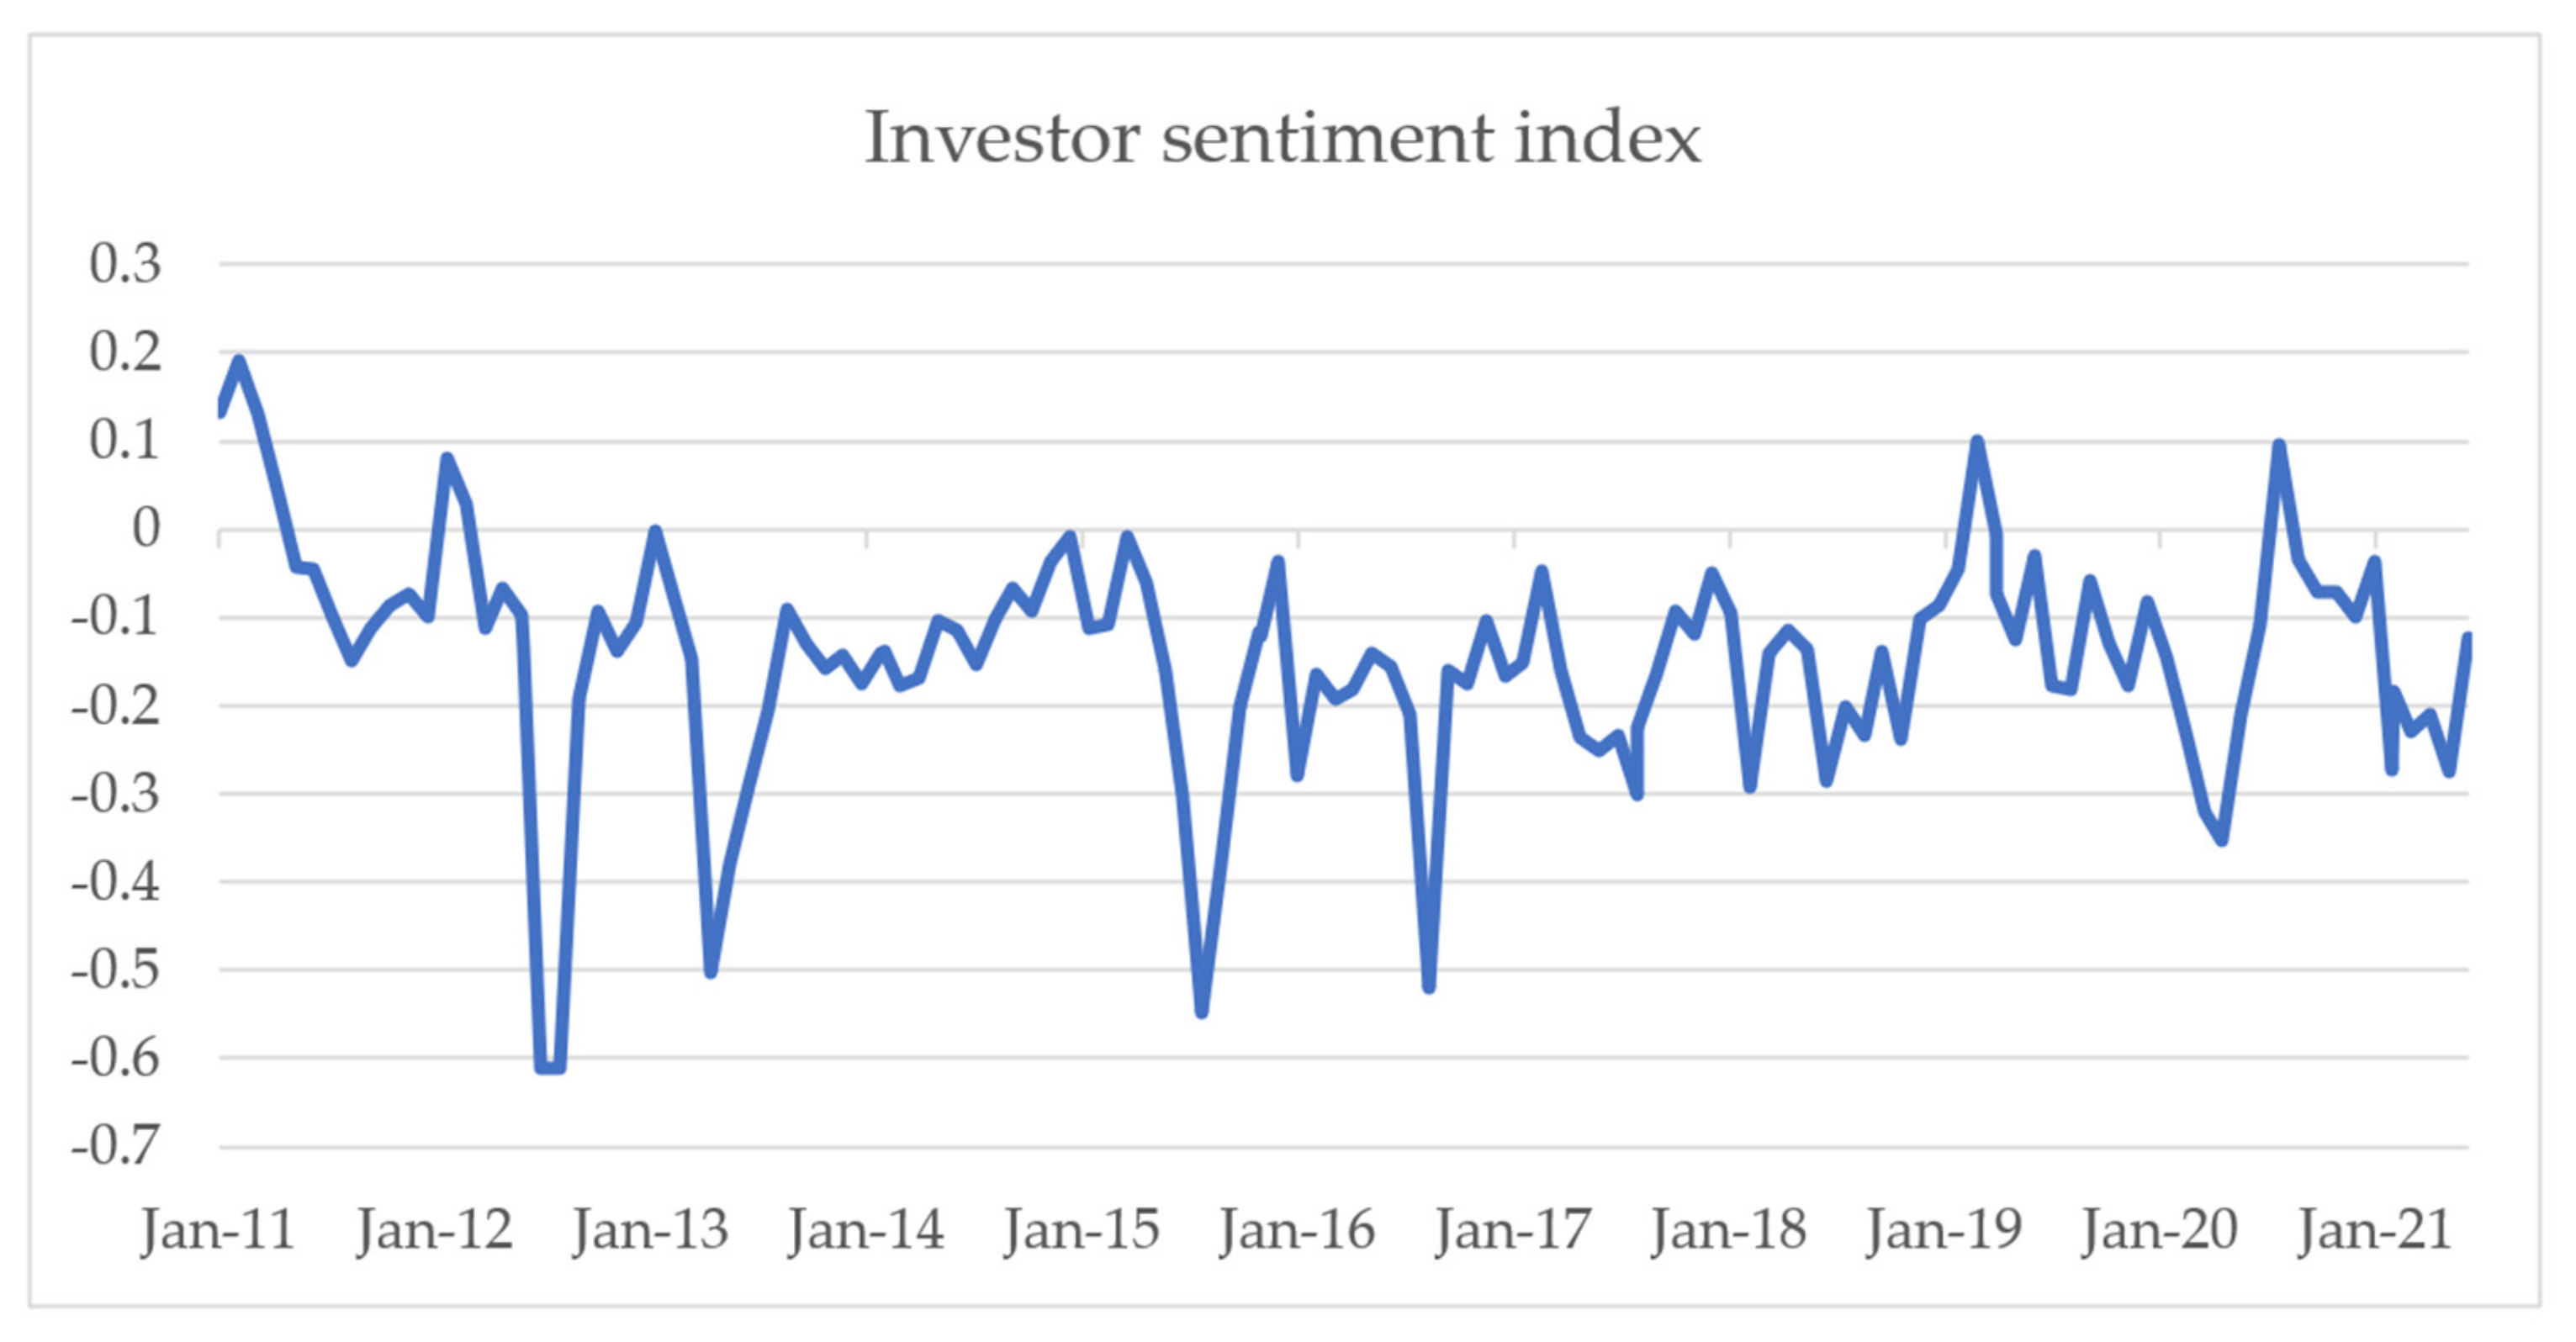
In this paper, we take a fresh look at the dynamic relationship between crude oil prices and investor sentiment. First, this paper exploits a web crawler to construct a Chinese investor sentiment index. The structure vector autoregression model is then utilized to decompose the crude oil price shocks into three oil price shocks, namely crude oil supply shocks, aggregate demand shocks, and oil-specific demand shocks, respectively. Finally, this paper employs the wavelet coherence analysis to study the dynamic correlation between oil price (shocks) and investor sentiment in the time and frequency domain, and further explore the asymmetric dynamic correlation between them in the time and frequency domain under different trends of oil price.
Based on these, this paper yields several main conclusions. First, heterogeneous dynamic correlations and lead–lag relationships exist between crude oil price (shocks) and investor sentiment over different time and frequency domains. In addition, there are asymmetric dynamic correlations and lead–lag relationships between crude oil price (shocks) and investor sentiment under different trends of crude oil price.
The contribution of this paper is to extend the literature on the dynamic relationships between the crude oil price and investor sentiment. On the one hand, our analysis helps shed light on the heterogeneous dynamic correlation between crude oil price shocks and investor sentiment in the time and frequency domain in China. Additionally, the results imply that dynamic correlation and its lead–lag relationship between various crude oil price shocks and investor sentiment in the time and frequency domain in China are heterogeneous. On the other hand, we complement the literature on the dynamic correlation and its lead–lag relationship between crude oil price shocks and investor sentiment by taking a systematic look at asymmetry under different trends of crude oil price. In our monthly observations from January 2011 to June 2021, we find the asymmetry dynamic correlation and its lead–lag relationship between crude oil price shocks and investor sentiment under different trends of crude oil price.
The remainder of this paper is organized as follows. We begin in
Section 2, by providing a conceptual framing for our empirical approach. To do so, we introduce the wavelet coherence analysis method and the methods used to decompose the crude oil price and measure investor sentiment. Then, we describe our data. In
Section 3, we establish the basic results described above, focusing on heterogeneous dynamic correlation between crude oil prices and investor sentiment. In
Section 4, we present our empirical results on the asymmetric dynamic correlation between crude oil prices and investor sentiment under different trends of oil price.
Section 5 concludes.
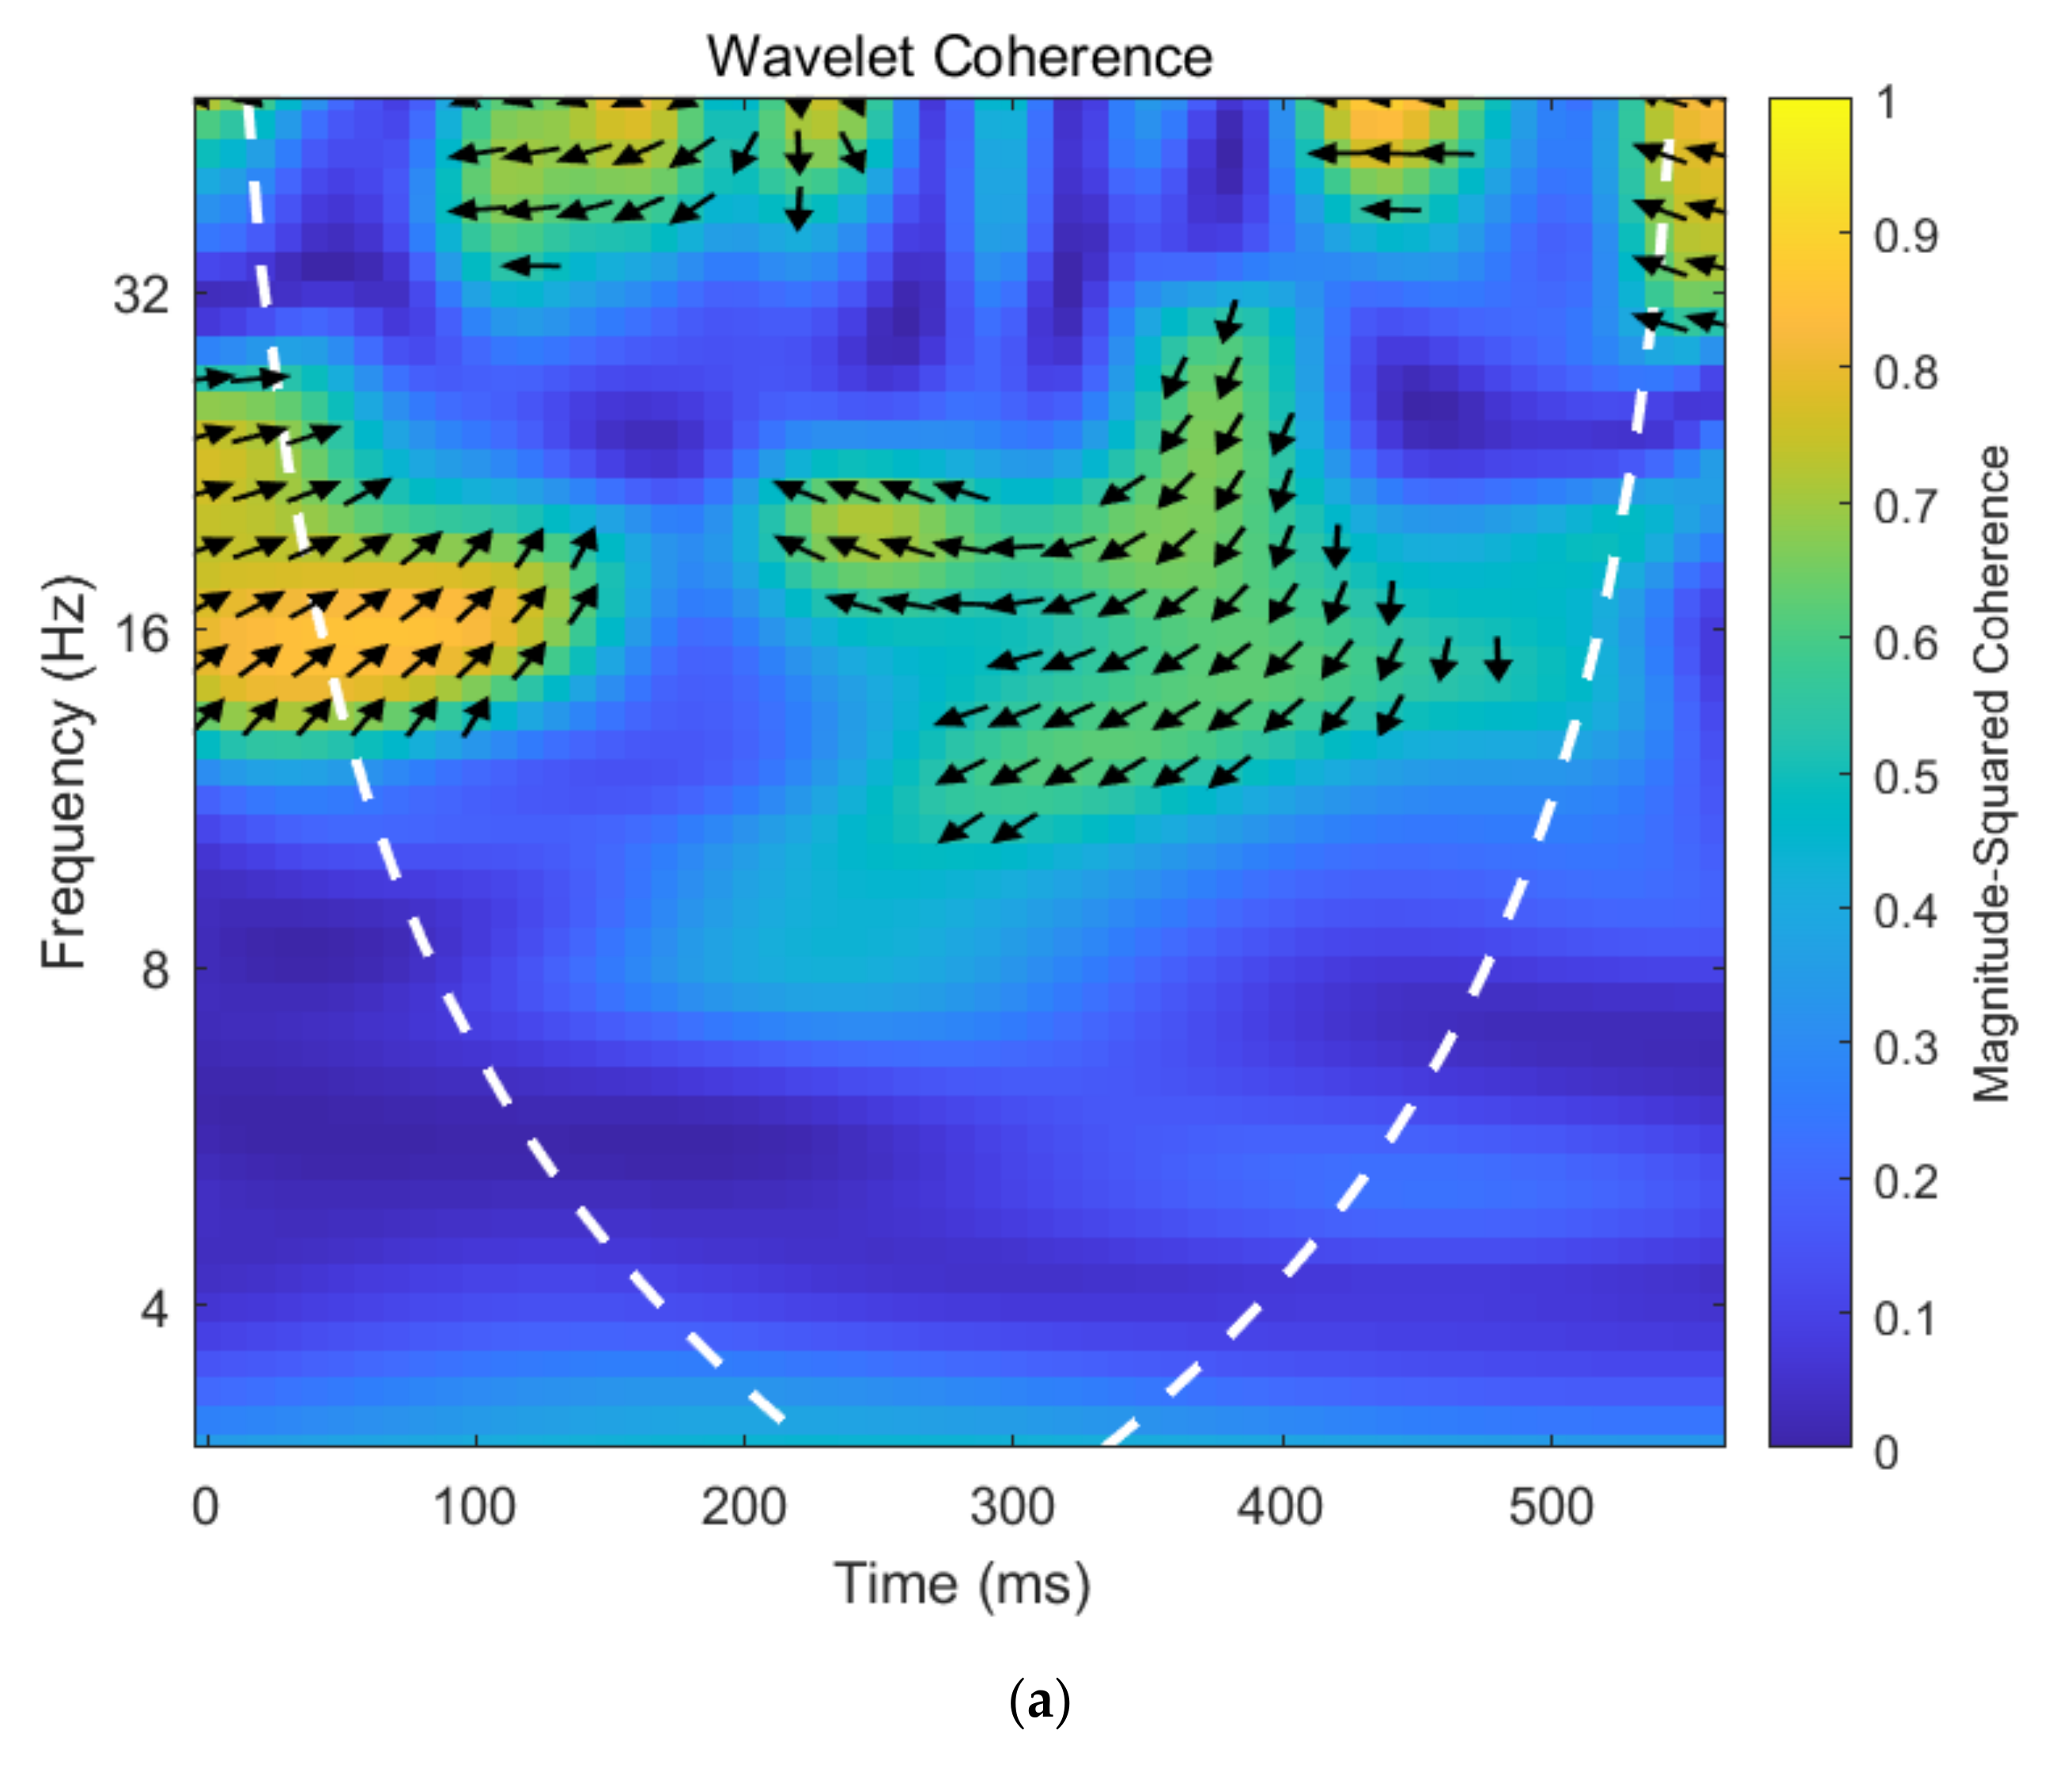
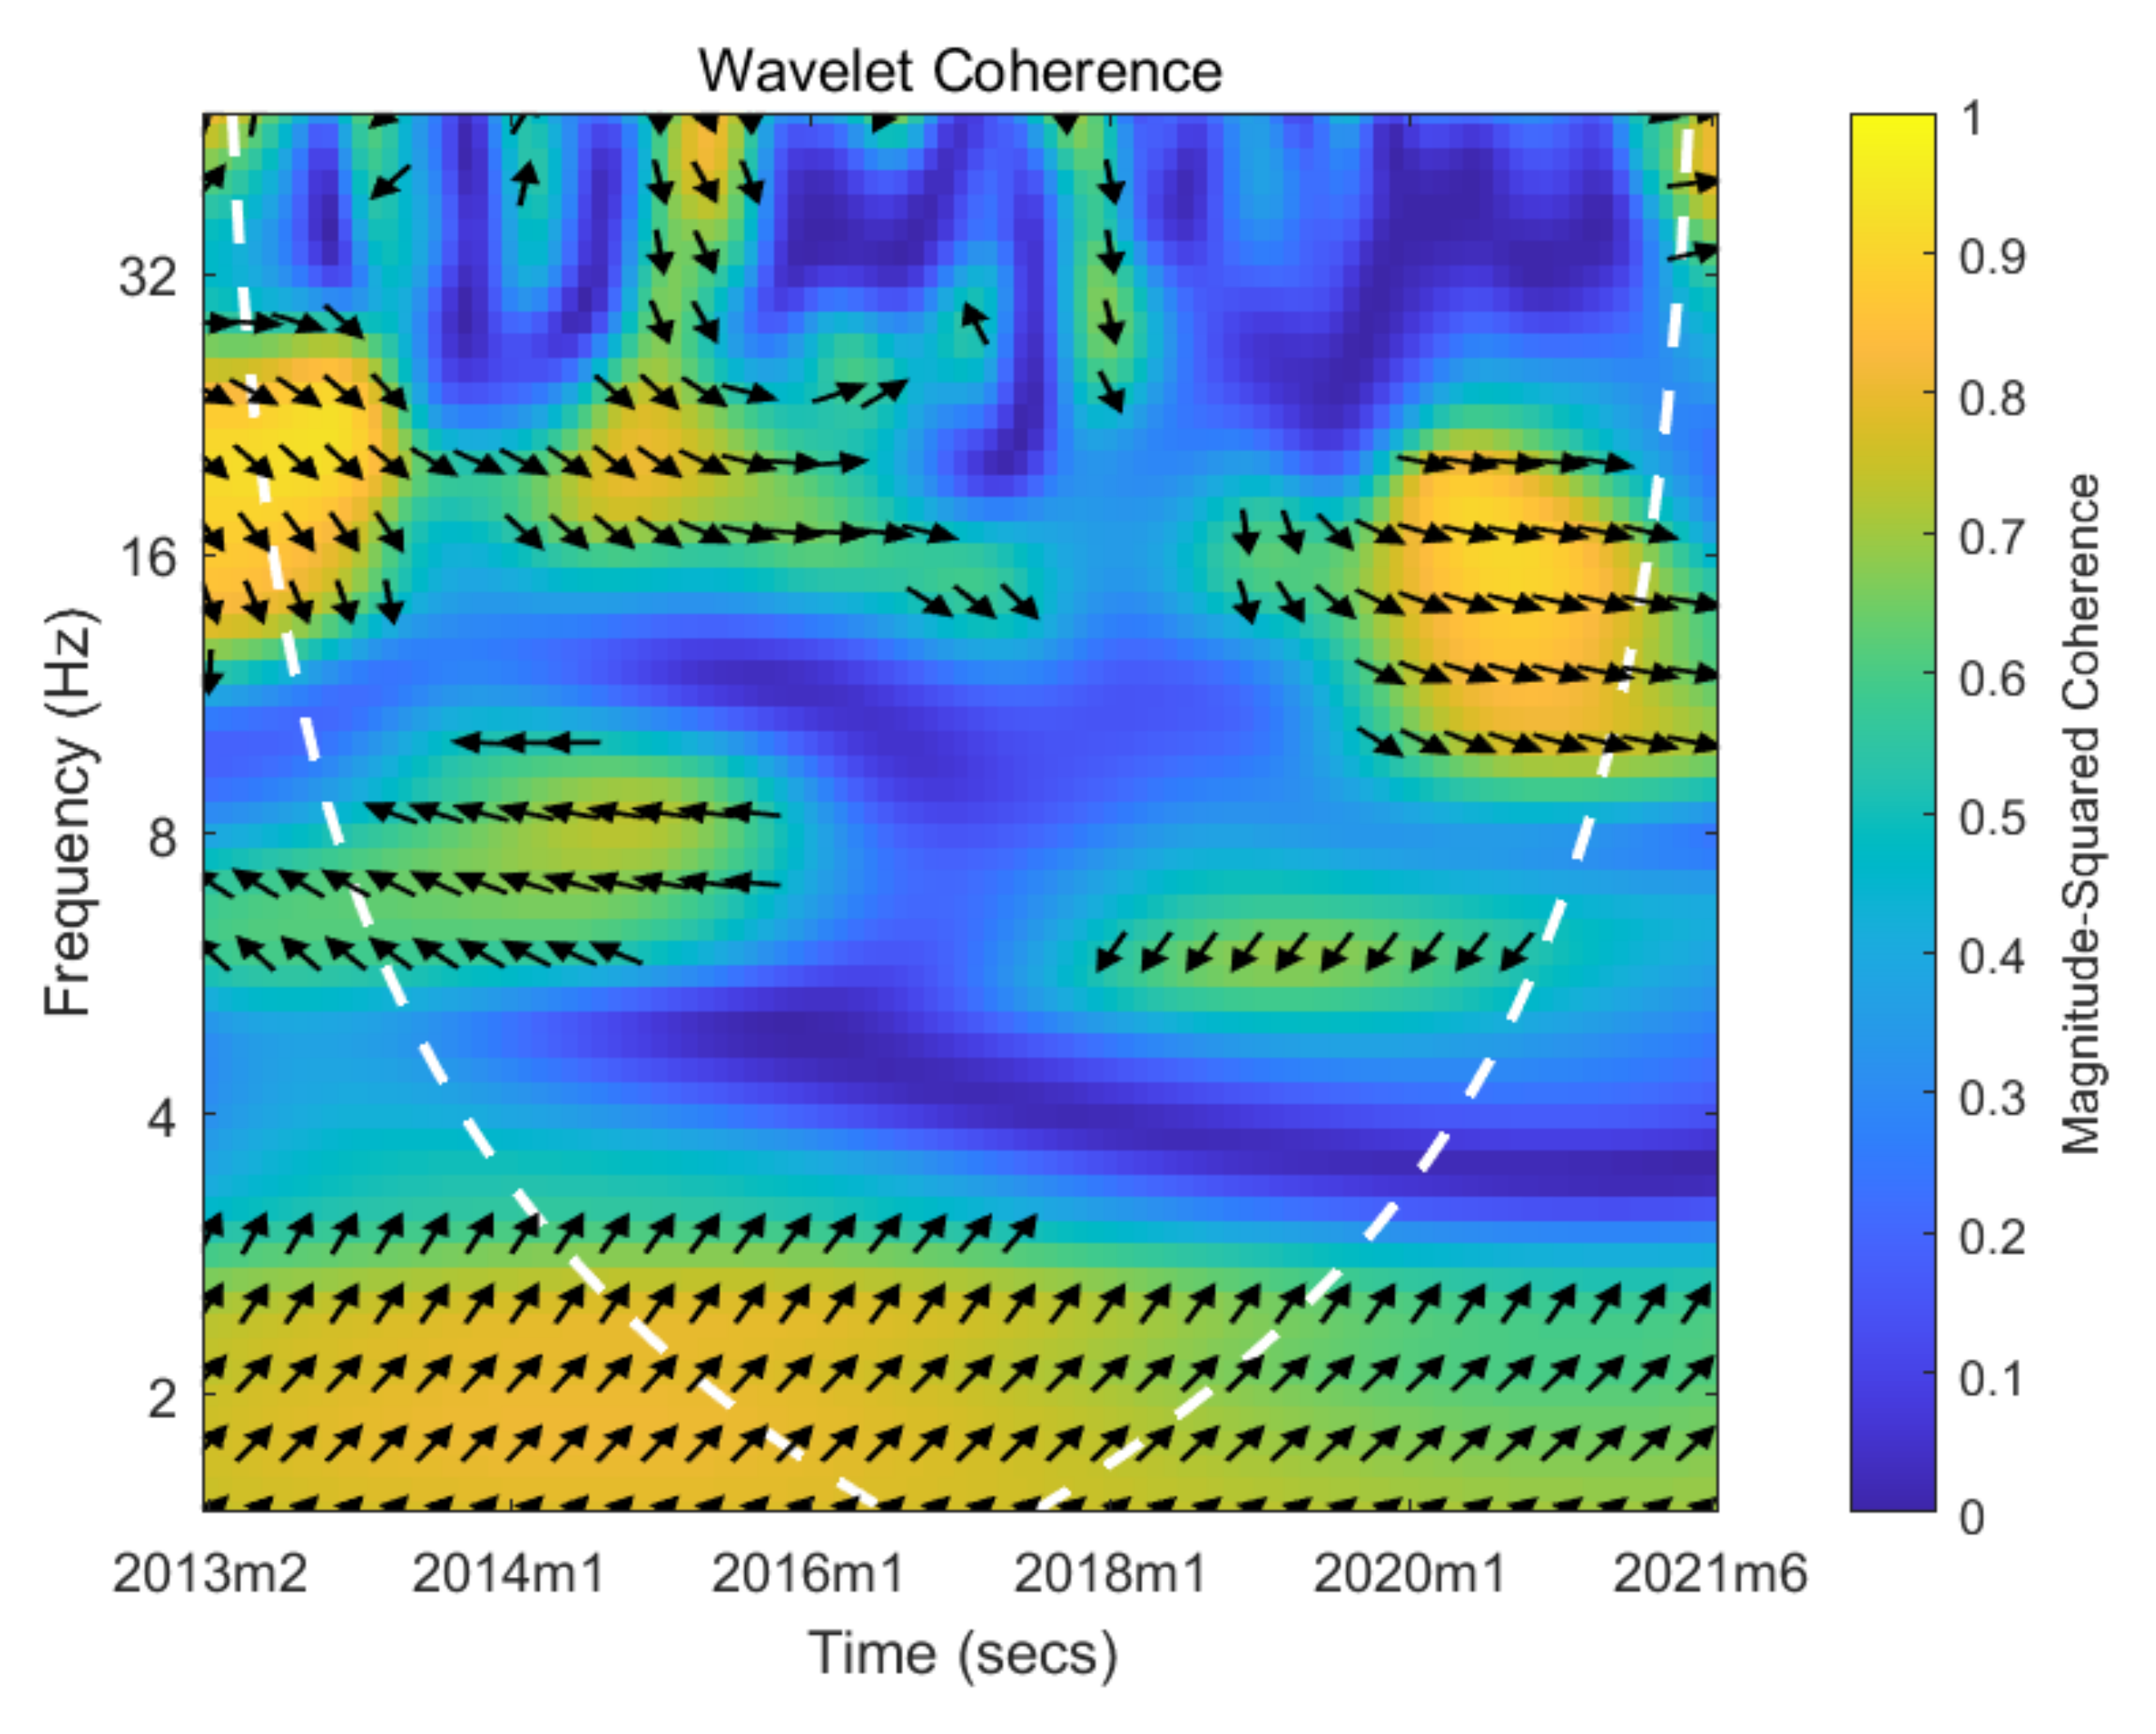
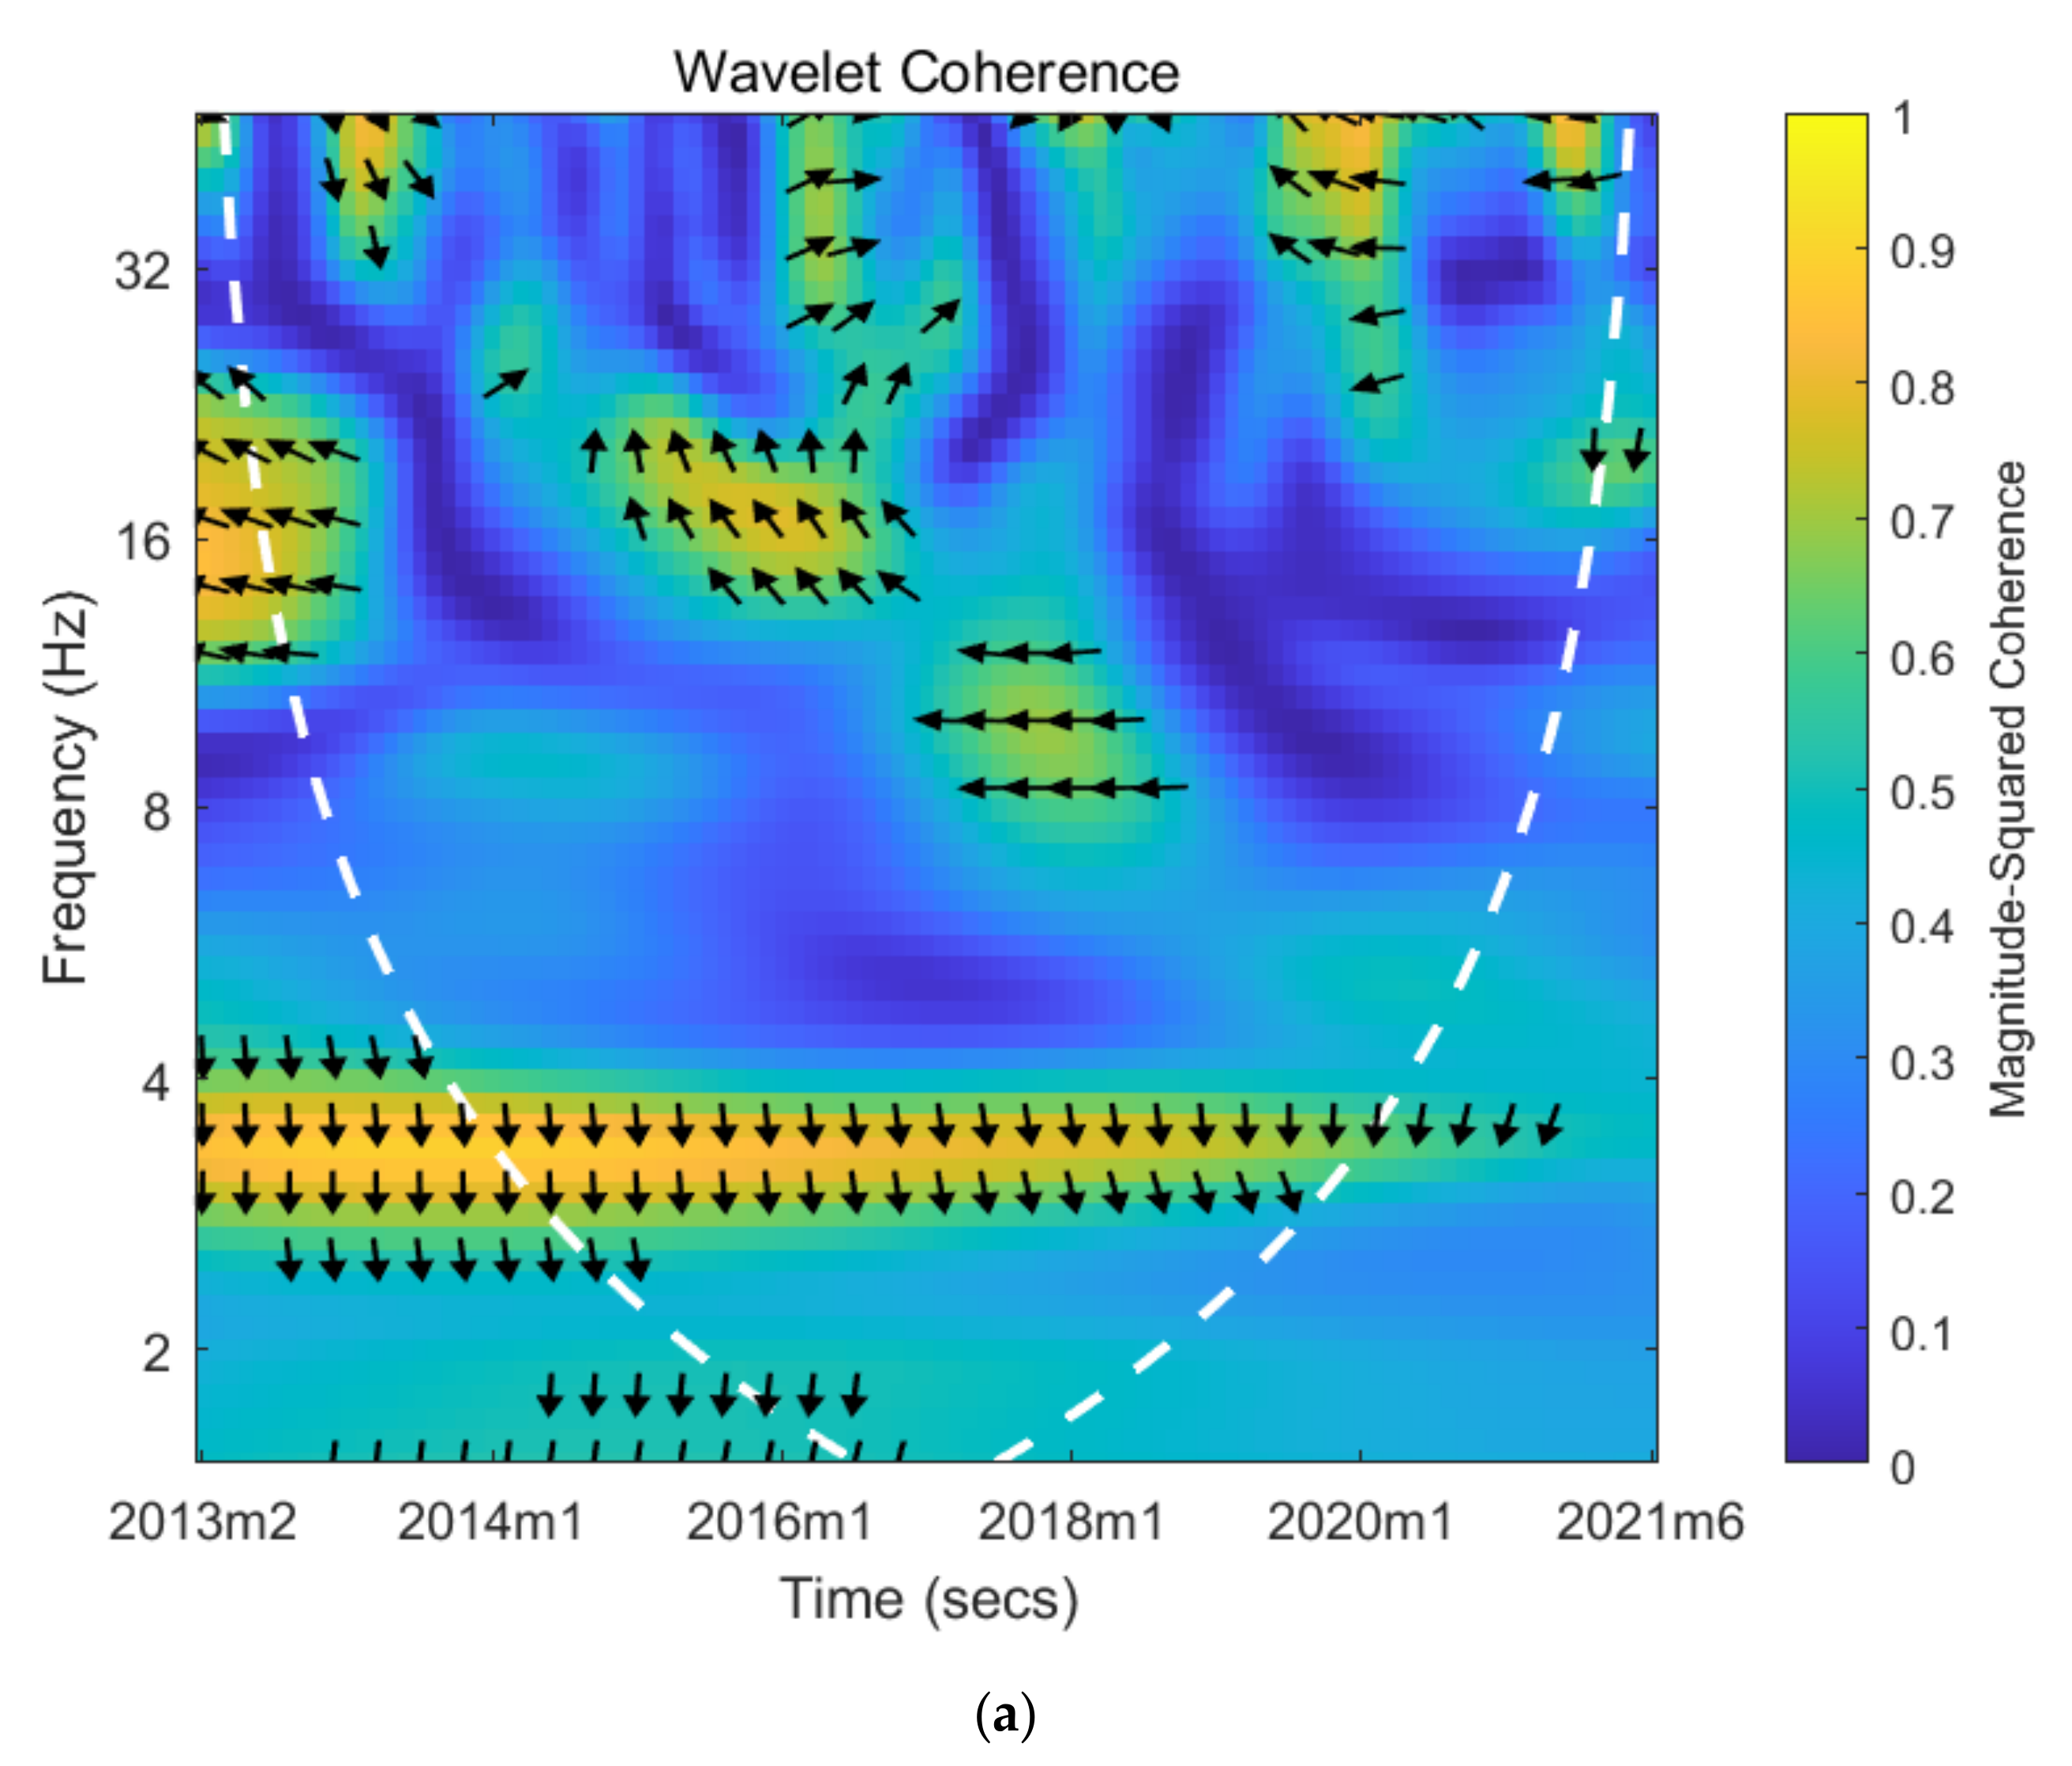
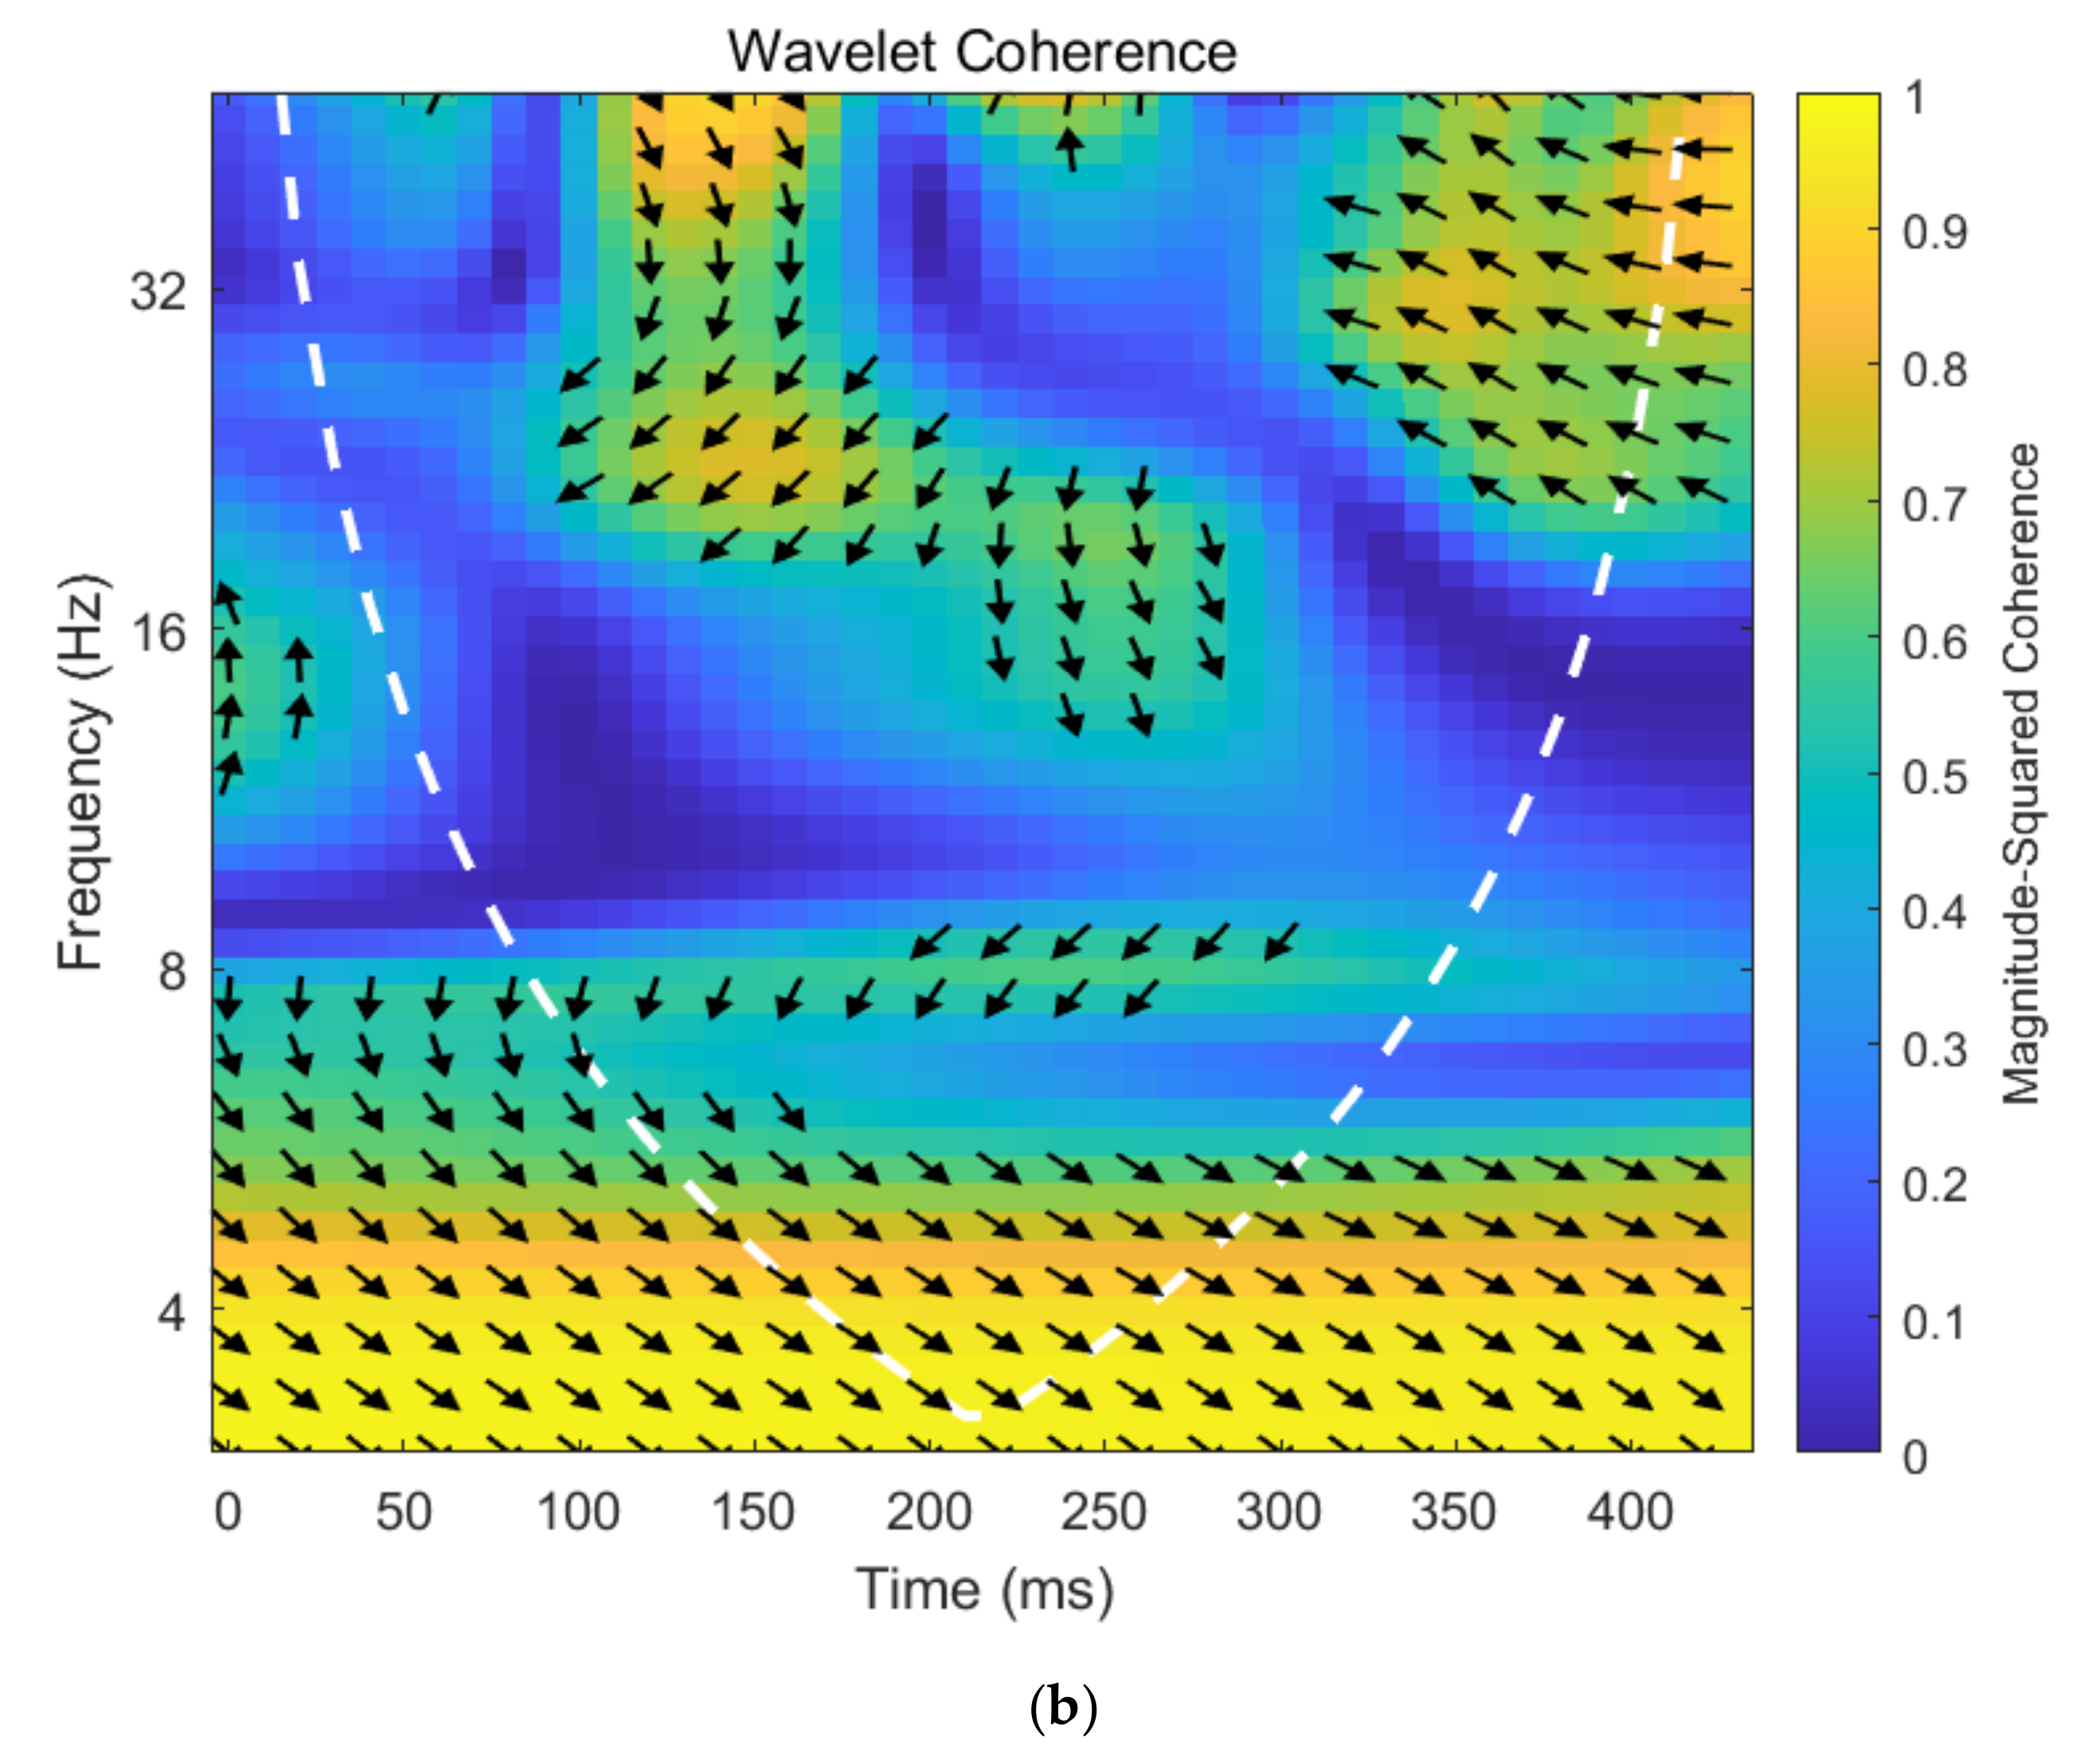
4. Asymmetric Dynamic Correlation between Crude Oil Prices and Investor Sentiment under Different Trends of Oil Price
In this section, we attempt to further explore the asymmetric dynamic correlation between crude oil prices (shocks) and investor sentiment under different trends of crude oil price. The period is divided into the up and down period on the basis of trends of crude oil price. First, we attempt to investigate the asymmetric dynamic correlation between crude oil prices and investor sentiment under different trends of oil price. Then, we further investigate the asymmetric dynamic correlation between crude oil price shocks and investor sentiment under different trends of oil price.
Figure 5 plots the wavelet coherency map between crude oil prices and investor sentiment under different trends of crude oil.
Figure 5a presents the wavelet coherency map of crude oil prices and investor sentiment when the crude oil price rises, while
Figure 5b exhibits the wavelet coherency map of crude oil prices and investor sentiment when the crude oil price falls.
Asymmetric dynamic correlation exists between crude oil prices and investor sentiment under different trends of crude oil price.
Figure 5 intuitively shows the wavelet coherency map of crude oil prices and investor sentiment under different trends of crude oil price. From the top of
Figure 5a, most of the arrows pointing left imply a negative relationship between crude oil prices and investor sentiment at high frequency during periods of rising oil prices. However, at the bottom of
Figure 5a there is a small coherence coefficient, which manifest that no significant dynamic correlation between crude oil prices and investor sentiment at the relatively low frequency during periods of rising oil prices. In addition, most of arrows point to the right in
Figure 5b, which provides us with evidence that crude oil prices are positively related to investor sentiment during periods of falling oil prices. In short, dynamic correlation between crude oil prices and investor sentiment under different trends of crude oil price is asymmetric.
The lead–lag relationship between crude oil price and investor sentiment under different trends of crude oil price is also asymmetric. First, the arrows in the significant area at the top of
Figure 5a mostly point to lower left, which demonstrate that crude oil prices lead investor sentiment at the relatively high frequency during periods of rising oil prices. However, the arrows at the bottom of
Figure 5a demonstrate that there is no co-movement between crude oil prices and investor sentiment at the relatively low frequency during periods of rising oil prices. Second, most of arrows point to upper right at the bottom of
Figure 5b, which indicate crude oil prices lead investor sentiment at the relatively low frequency during periods of falling oil prices. Moreover, most of arrows point to upper left and lower right at the top of
Figure 5b, which imply that the phase change in investor sentiment is ahead of crude oil prices at the relatively high frequency during periods of falling oil prices. All in all, the lead–lag relationship between crude oil price and investor sentiment is asymmetric under different trends of crude oil price.
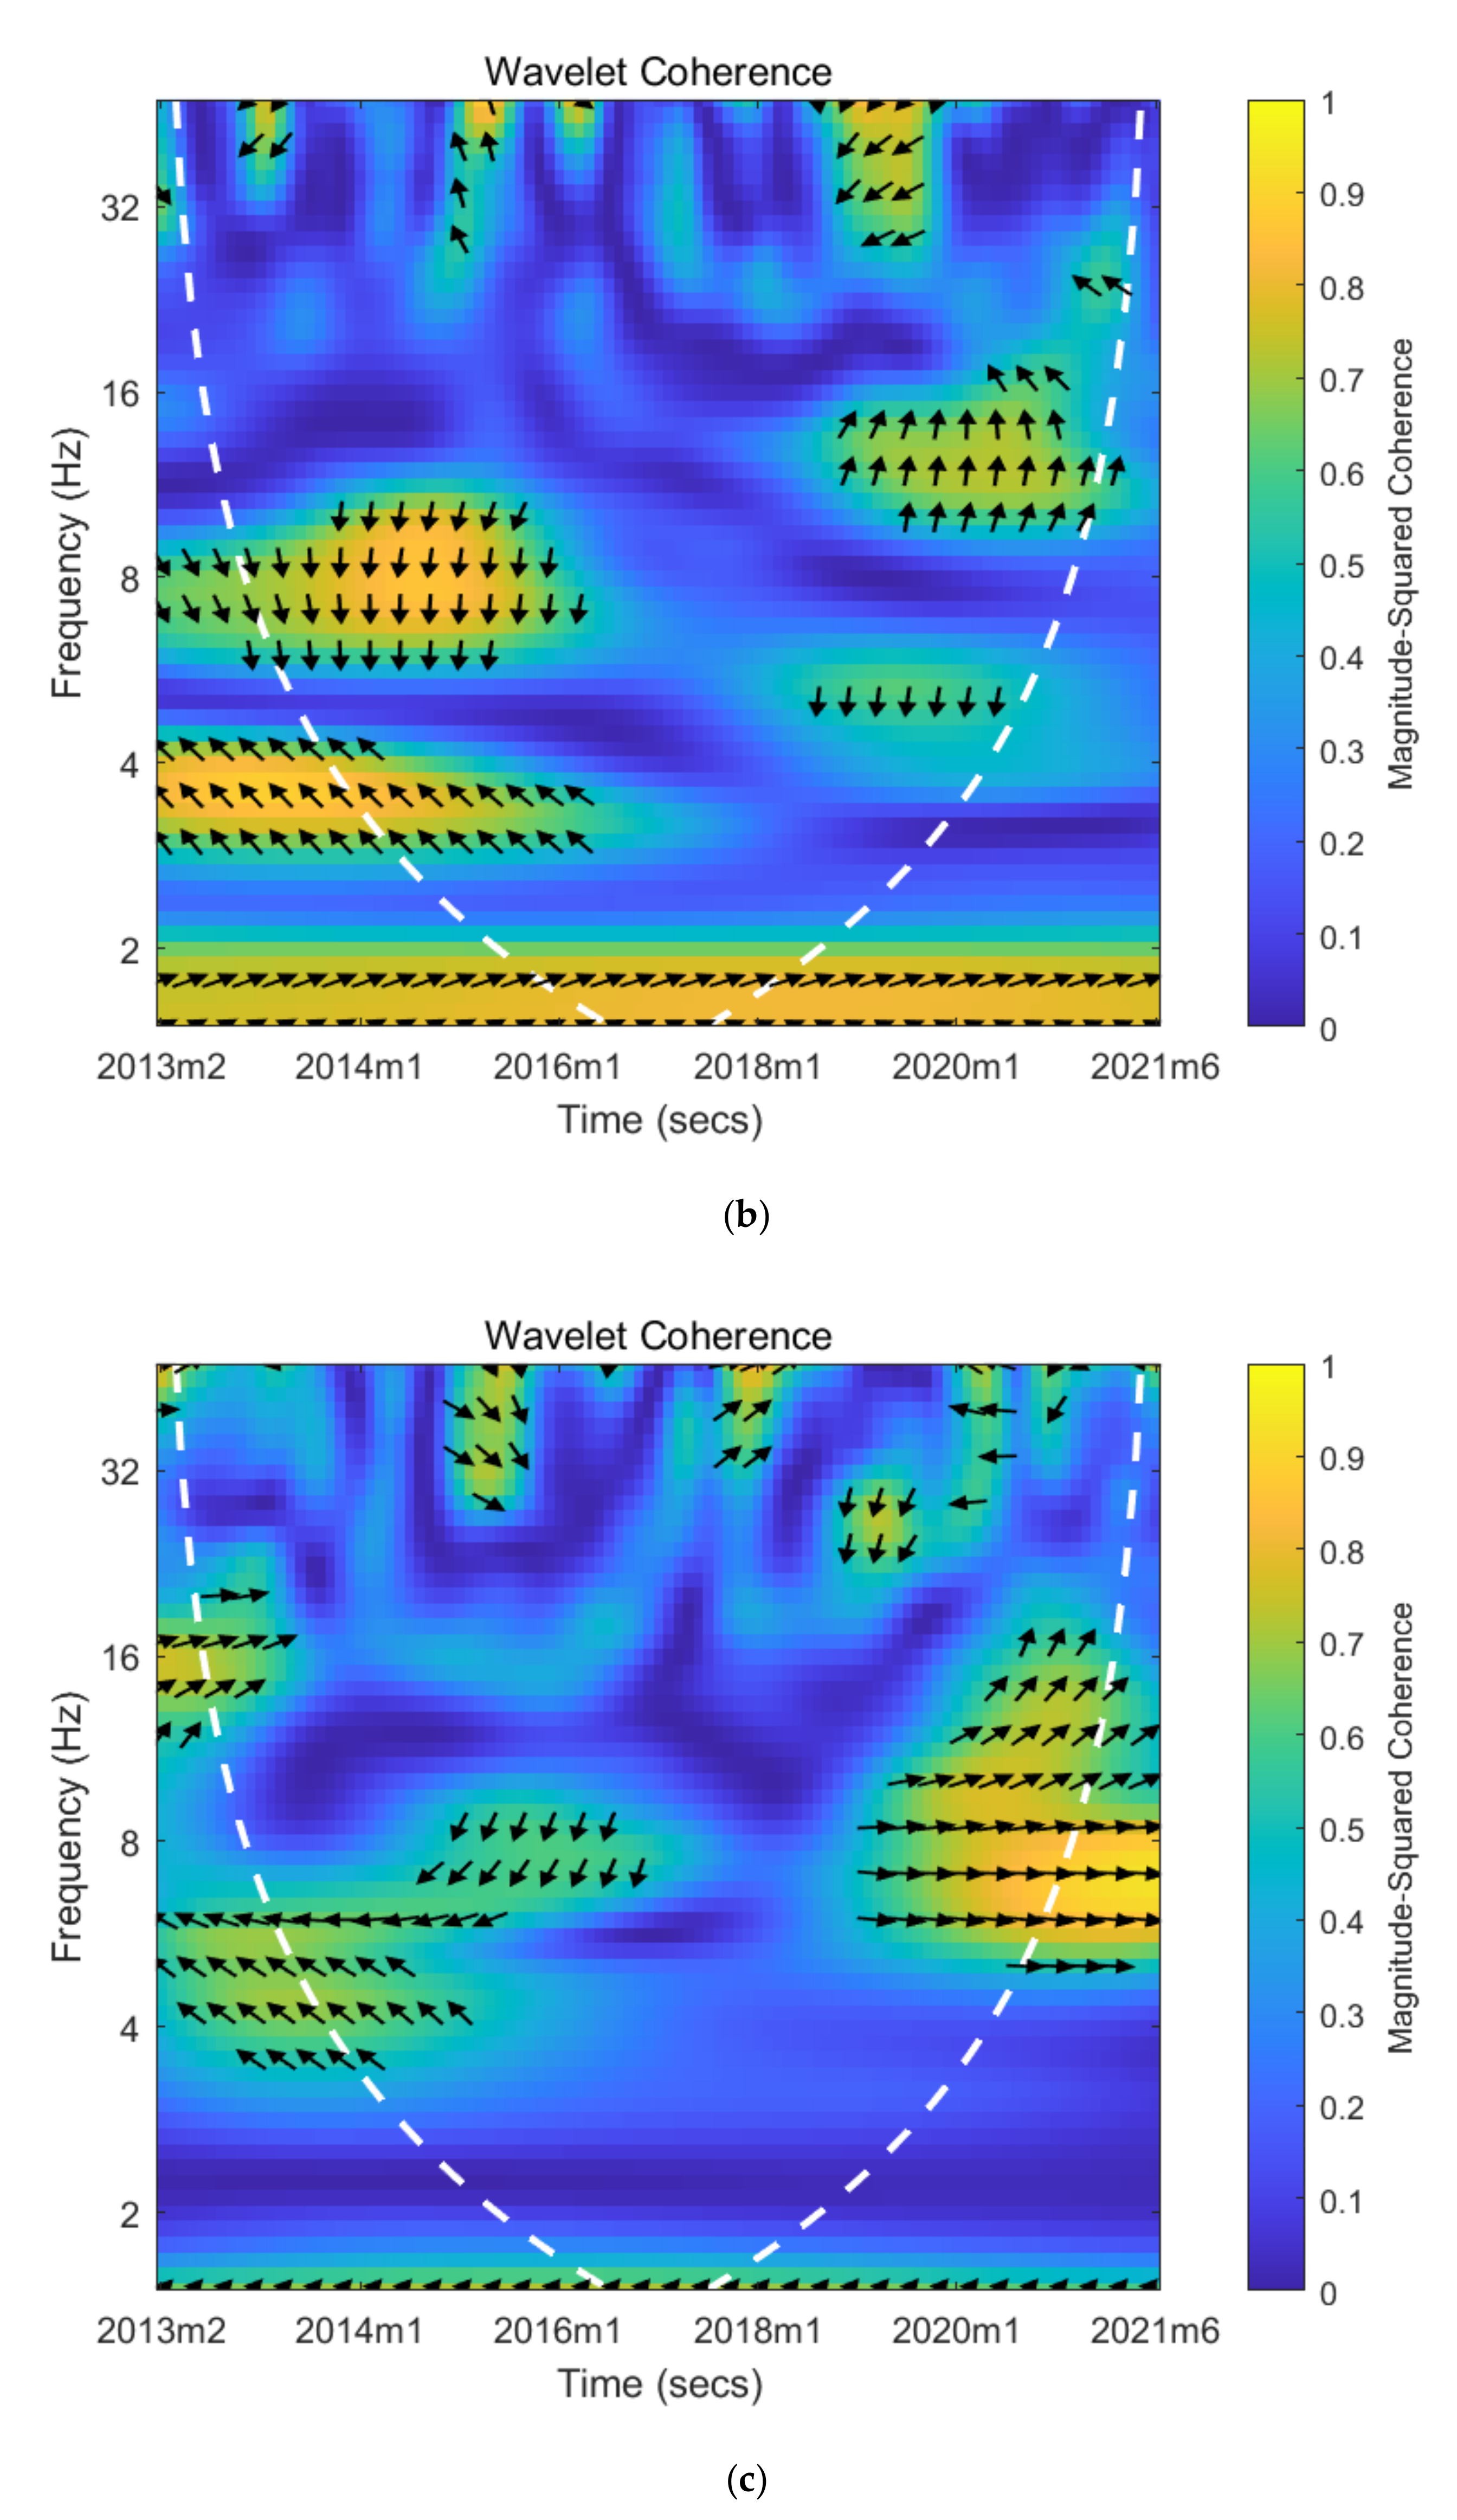
Figure 6 plots the wavelet coherency map between oil supply shocks and investor sentiment under different trends of crude oil.
Figure 6a presents the wavelet coherency map of oil supply shocks and investor sentiment when the crude oil price rises, while
Figure 6b exhibits the wavelet coherency map of oil supply shocks and investor sentiment when the crude oil price falls.
Asymmetric dynamic correlation exists between oil supply shocks and investor sentiment under different trends of crude oil price.
Figure 6 plots the wavelet coherency map of oil supply shocks and investor sentiment under different trends of crude oil price. First, from
Figure 6a, we can see a large blue area, the coherence coefficient between oil supply shocks and investor sentiment is very small, which indicated that the dynamic relationship between oil supply shocks and investor sentiment is not significant during periods of rising oil prices. Second, arrows at the bottom of
Figure 6b point to the right, manifesting that oil supply shocks are positively related to investor sentiment at a relatively low frequency during periods of falling oil prices. The arrows at the top of
Figure 6b point to the left, indicating that oil supply shocks are negatively related to investor sentiment at a relatively high frequency during periods of falling oil prices. In conclusion, the dynamic correlation between oil supply shocks and investor sentiment are asymmetric under different trends of crude oil price.
The lead–lag relationship between oil supply shocks and investor sentiment under different trends of crude oil price are also asymmetric. First, the insignificant area in
Figure 6a shows no co-movement between oil supply shocks and investor sentiment during periods of rising oil prices. Second, most of the arrows point to the upper left and lower right at the top and bottom of
Figure 6b, this demonstrates that the phase change in investor sentiment is ahead of oil supply shocks during periods of falling oil prices. Given the above, the lead–lag relationship between oil supply shocks and investor sentiment are asymmetric under different trends of crude oil price.
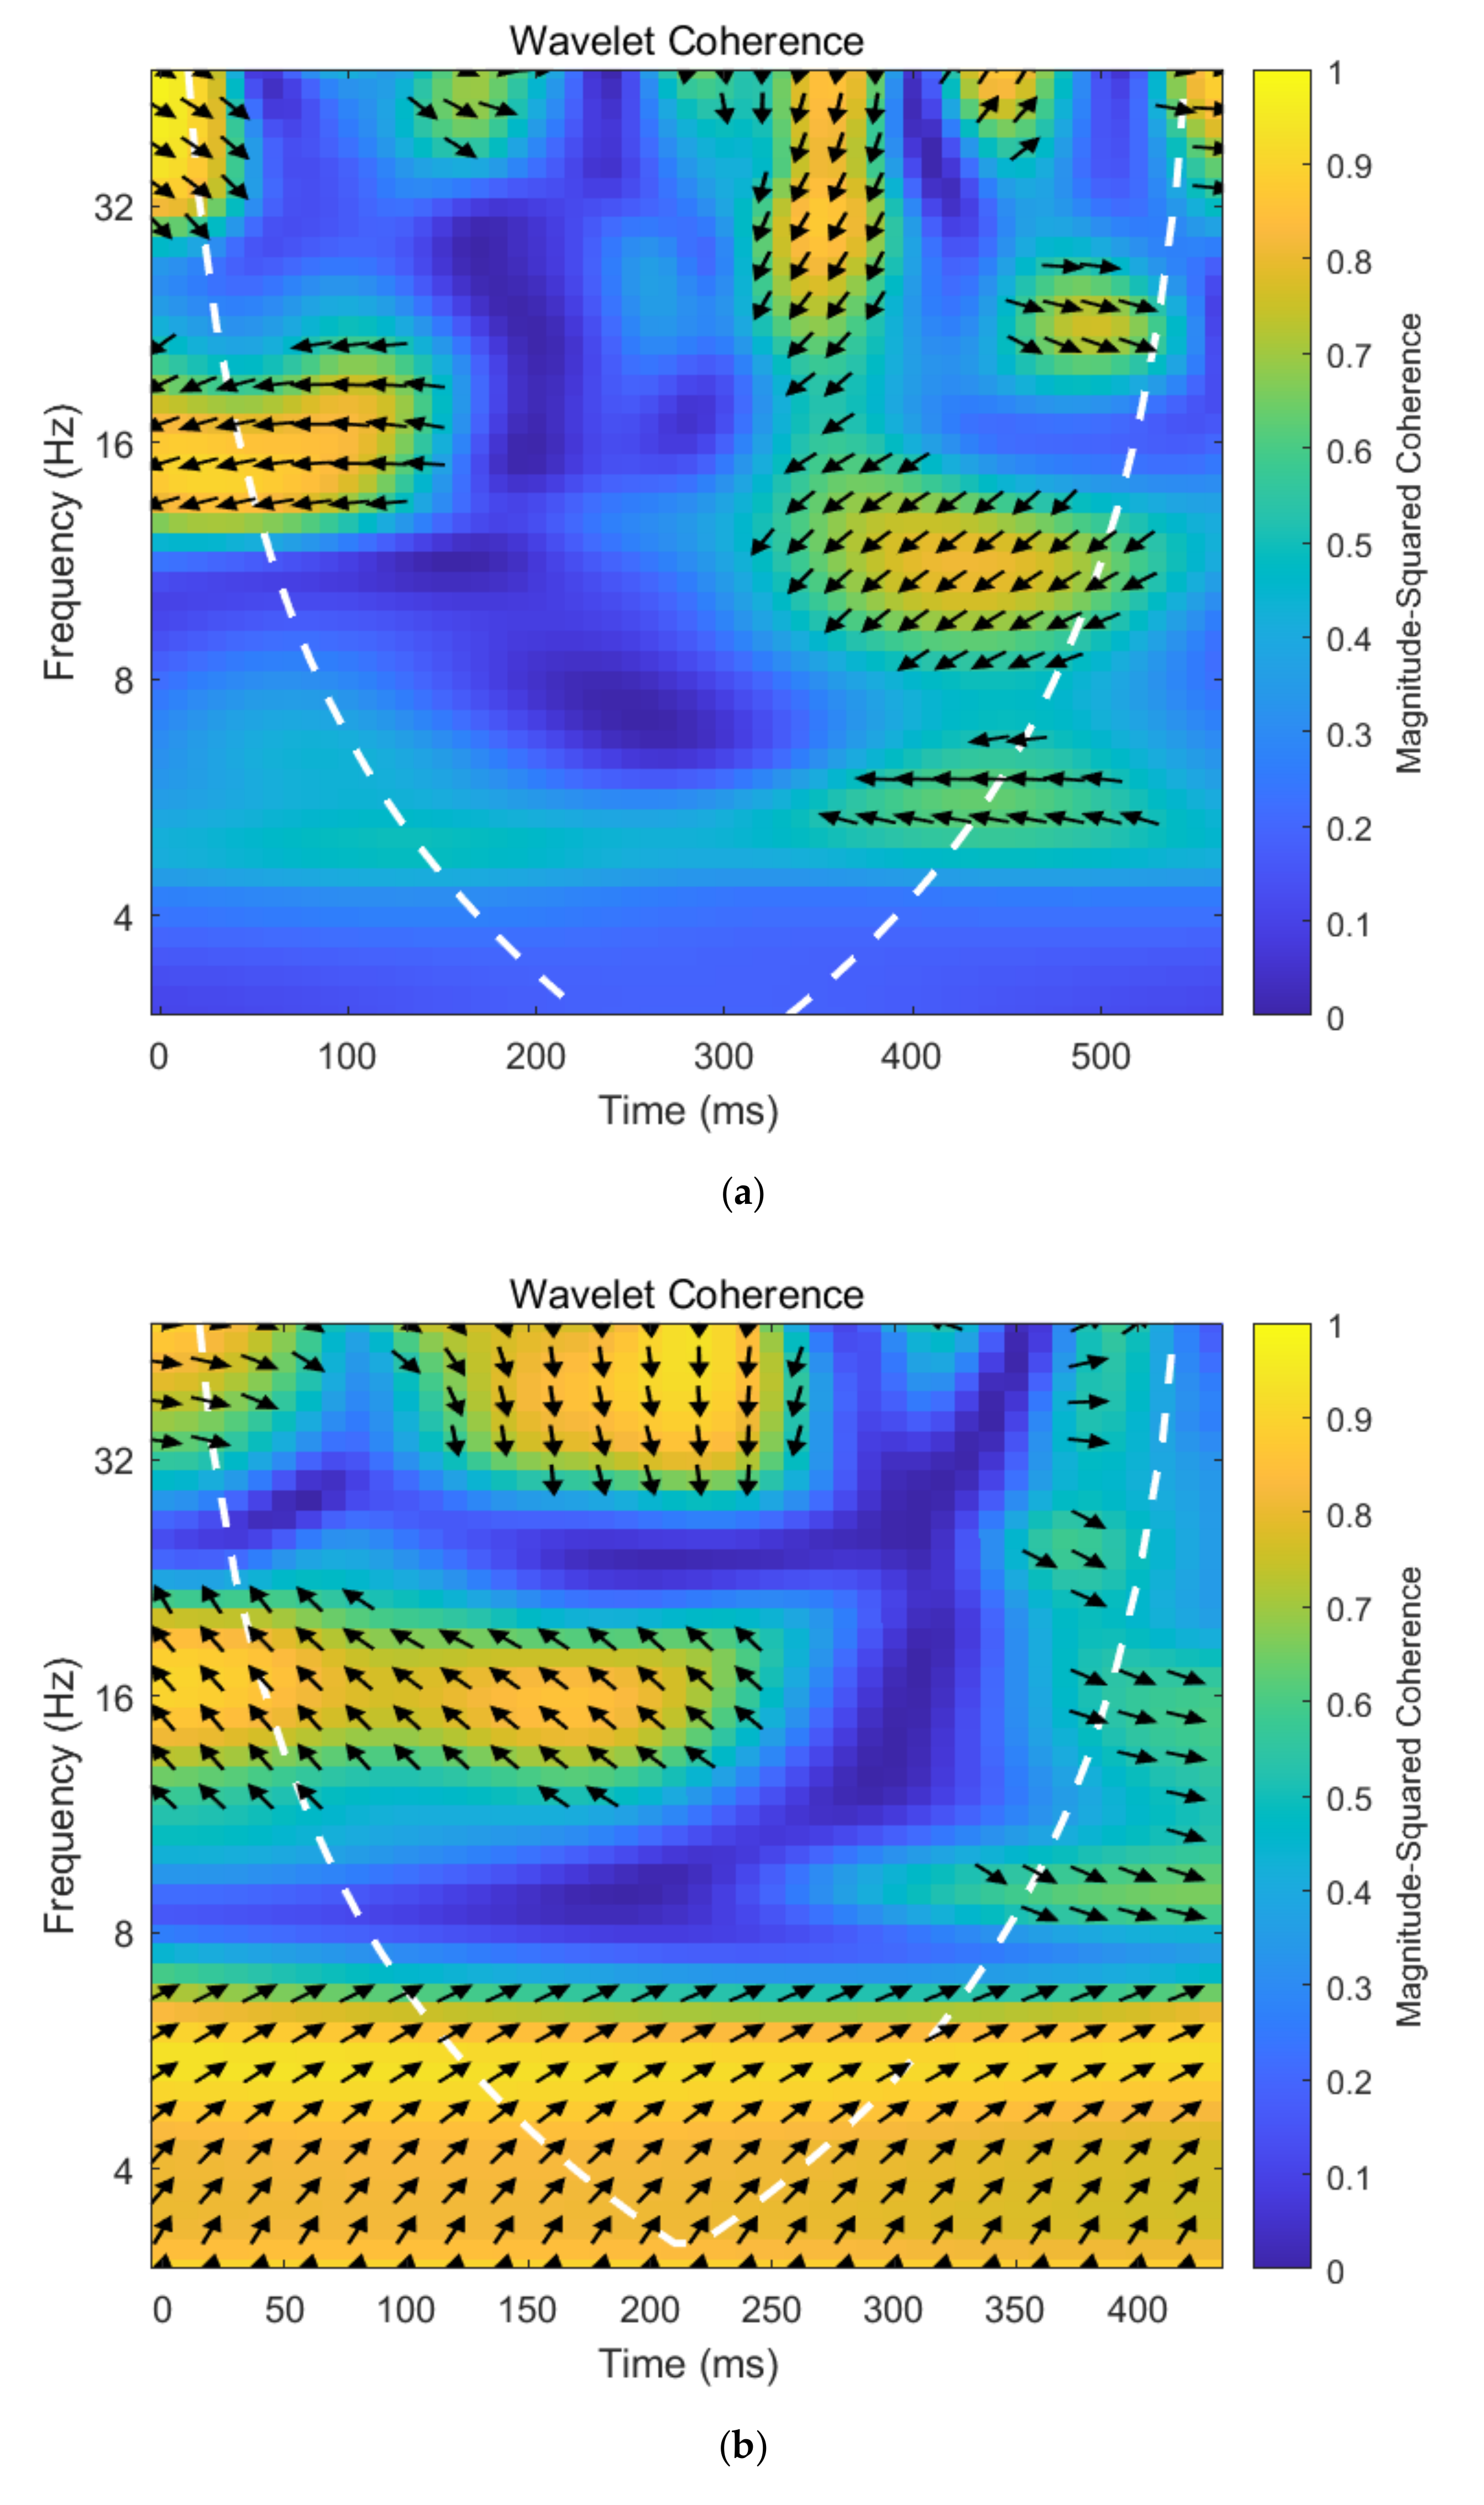
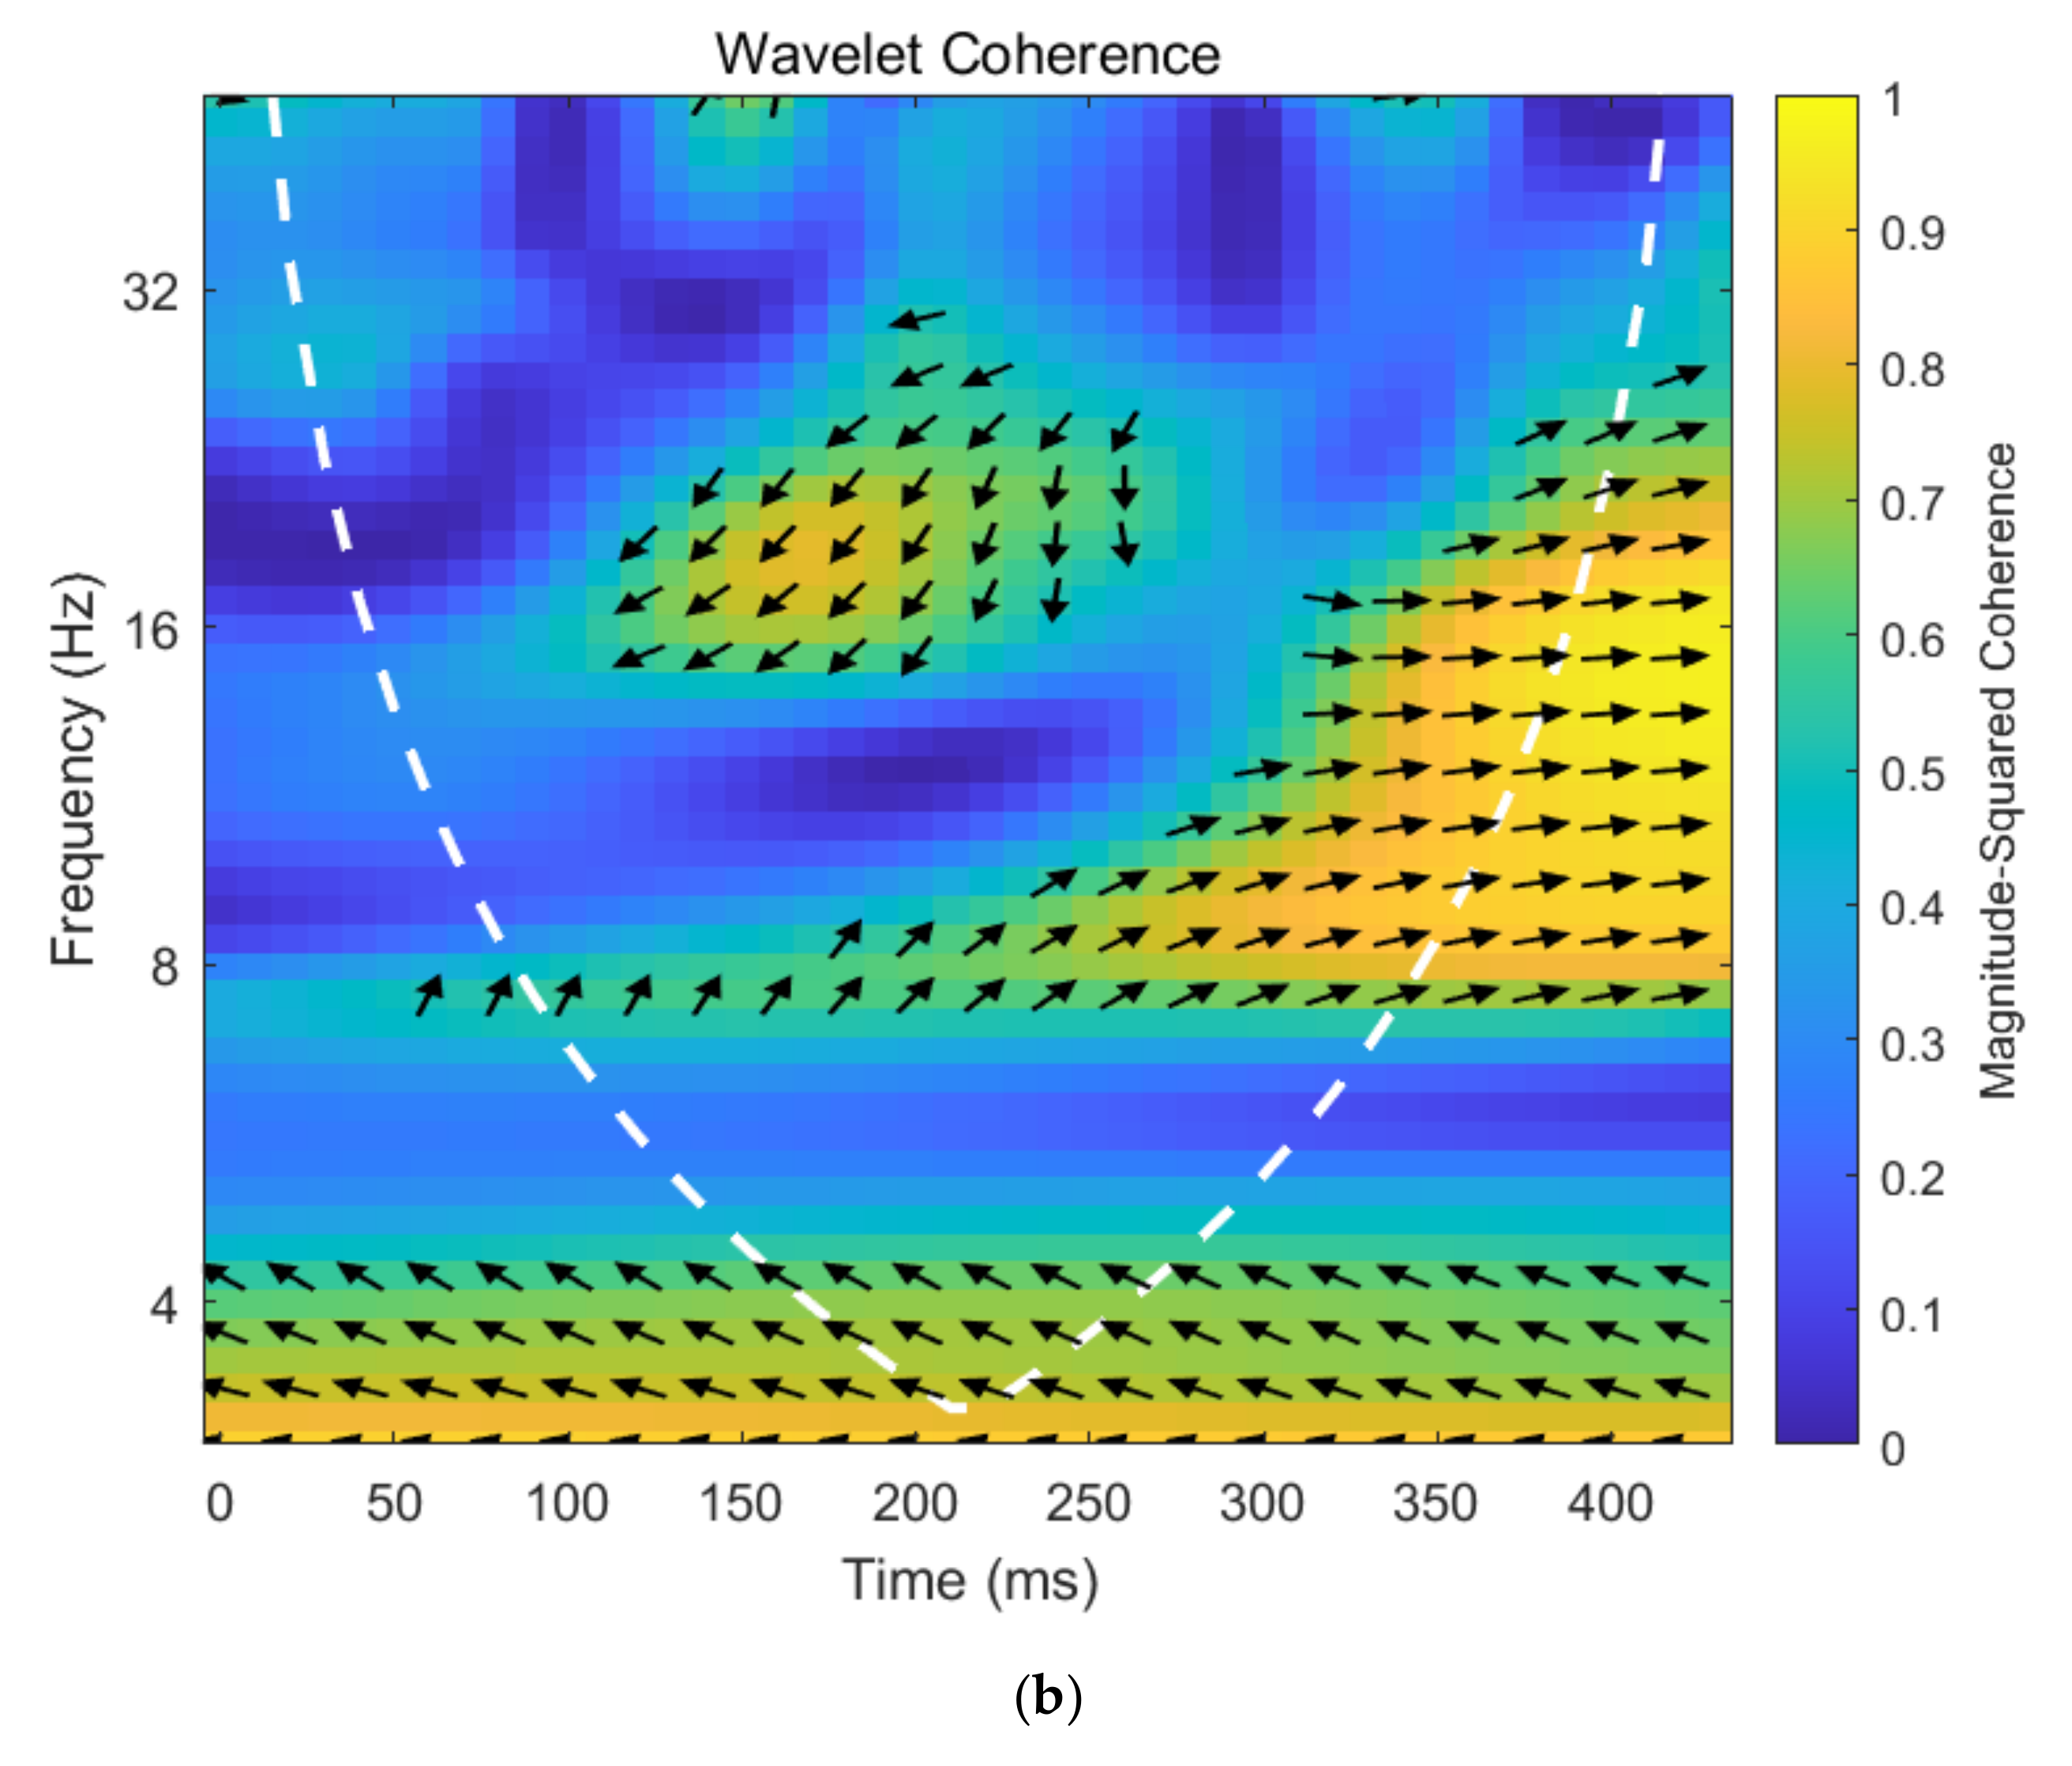
Figure 7 plots the wavelet coherency map between aggregate demand shocks and investor sentiment under different trends of crude oil.
Figure 7a presents the wavelet coherency map of aggregate demand shocks and investor sentiment when the crude oil price rises, while
Figure 7b exhibits the wavelet coherency map of aggregate demand shocks and investor sentiment when the crude oil price falls.
Asymmetric dynamic correlation exists between aggregate demand shocks and investor sentiment under different trends of crude oil price.
Figure 7 draws the wavelet coherency map of aggregate demand shocks and investor sentiment under different trends of crude oil price. First, at the middle of
Figure 7a, most of the arrows point to the left and show the negative correlation between aggregate demand shocks and investor sentiment during periods of rising oil prices. Second, from
Figure 7b, it is easy to see that the coherence coefficient between aggregate demand shocks and investor sentiment is very small, which demonstrates the insignificant dynamic relationship between aggregate demand shocks and investor sentiment during periods of falling oil prices. In brief, dynamic correlation are asymmetric between aggregate demand shocks and investor sentiment under different trends of crude oil price.
The lead–lag relationship between aggregate demand shocks and investor sentiment under different trends of crude oil price are also asymmetric. First, most of the arrows point to the lower left at the middle of
Figure 7a, this indicates that aggregate demand shocks lead investor sentiment during periods of rising oil prices. Second, the insignificant area in
Figure 7b shows no co-movement between aggregate demand shocks and investor sentiment during periods of falling oil prices. In short, the lead–lag relationship between aggregate demand shocks and investor sentiment are asymmetric under different trends of crude oil price.
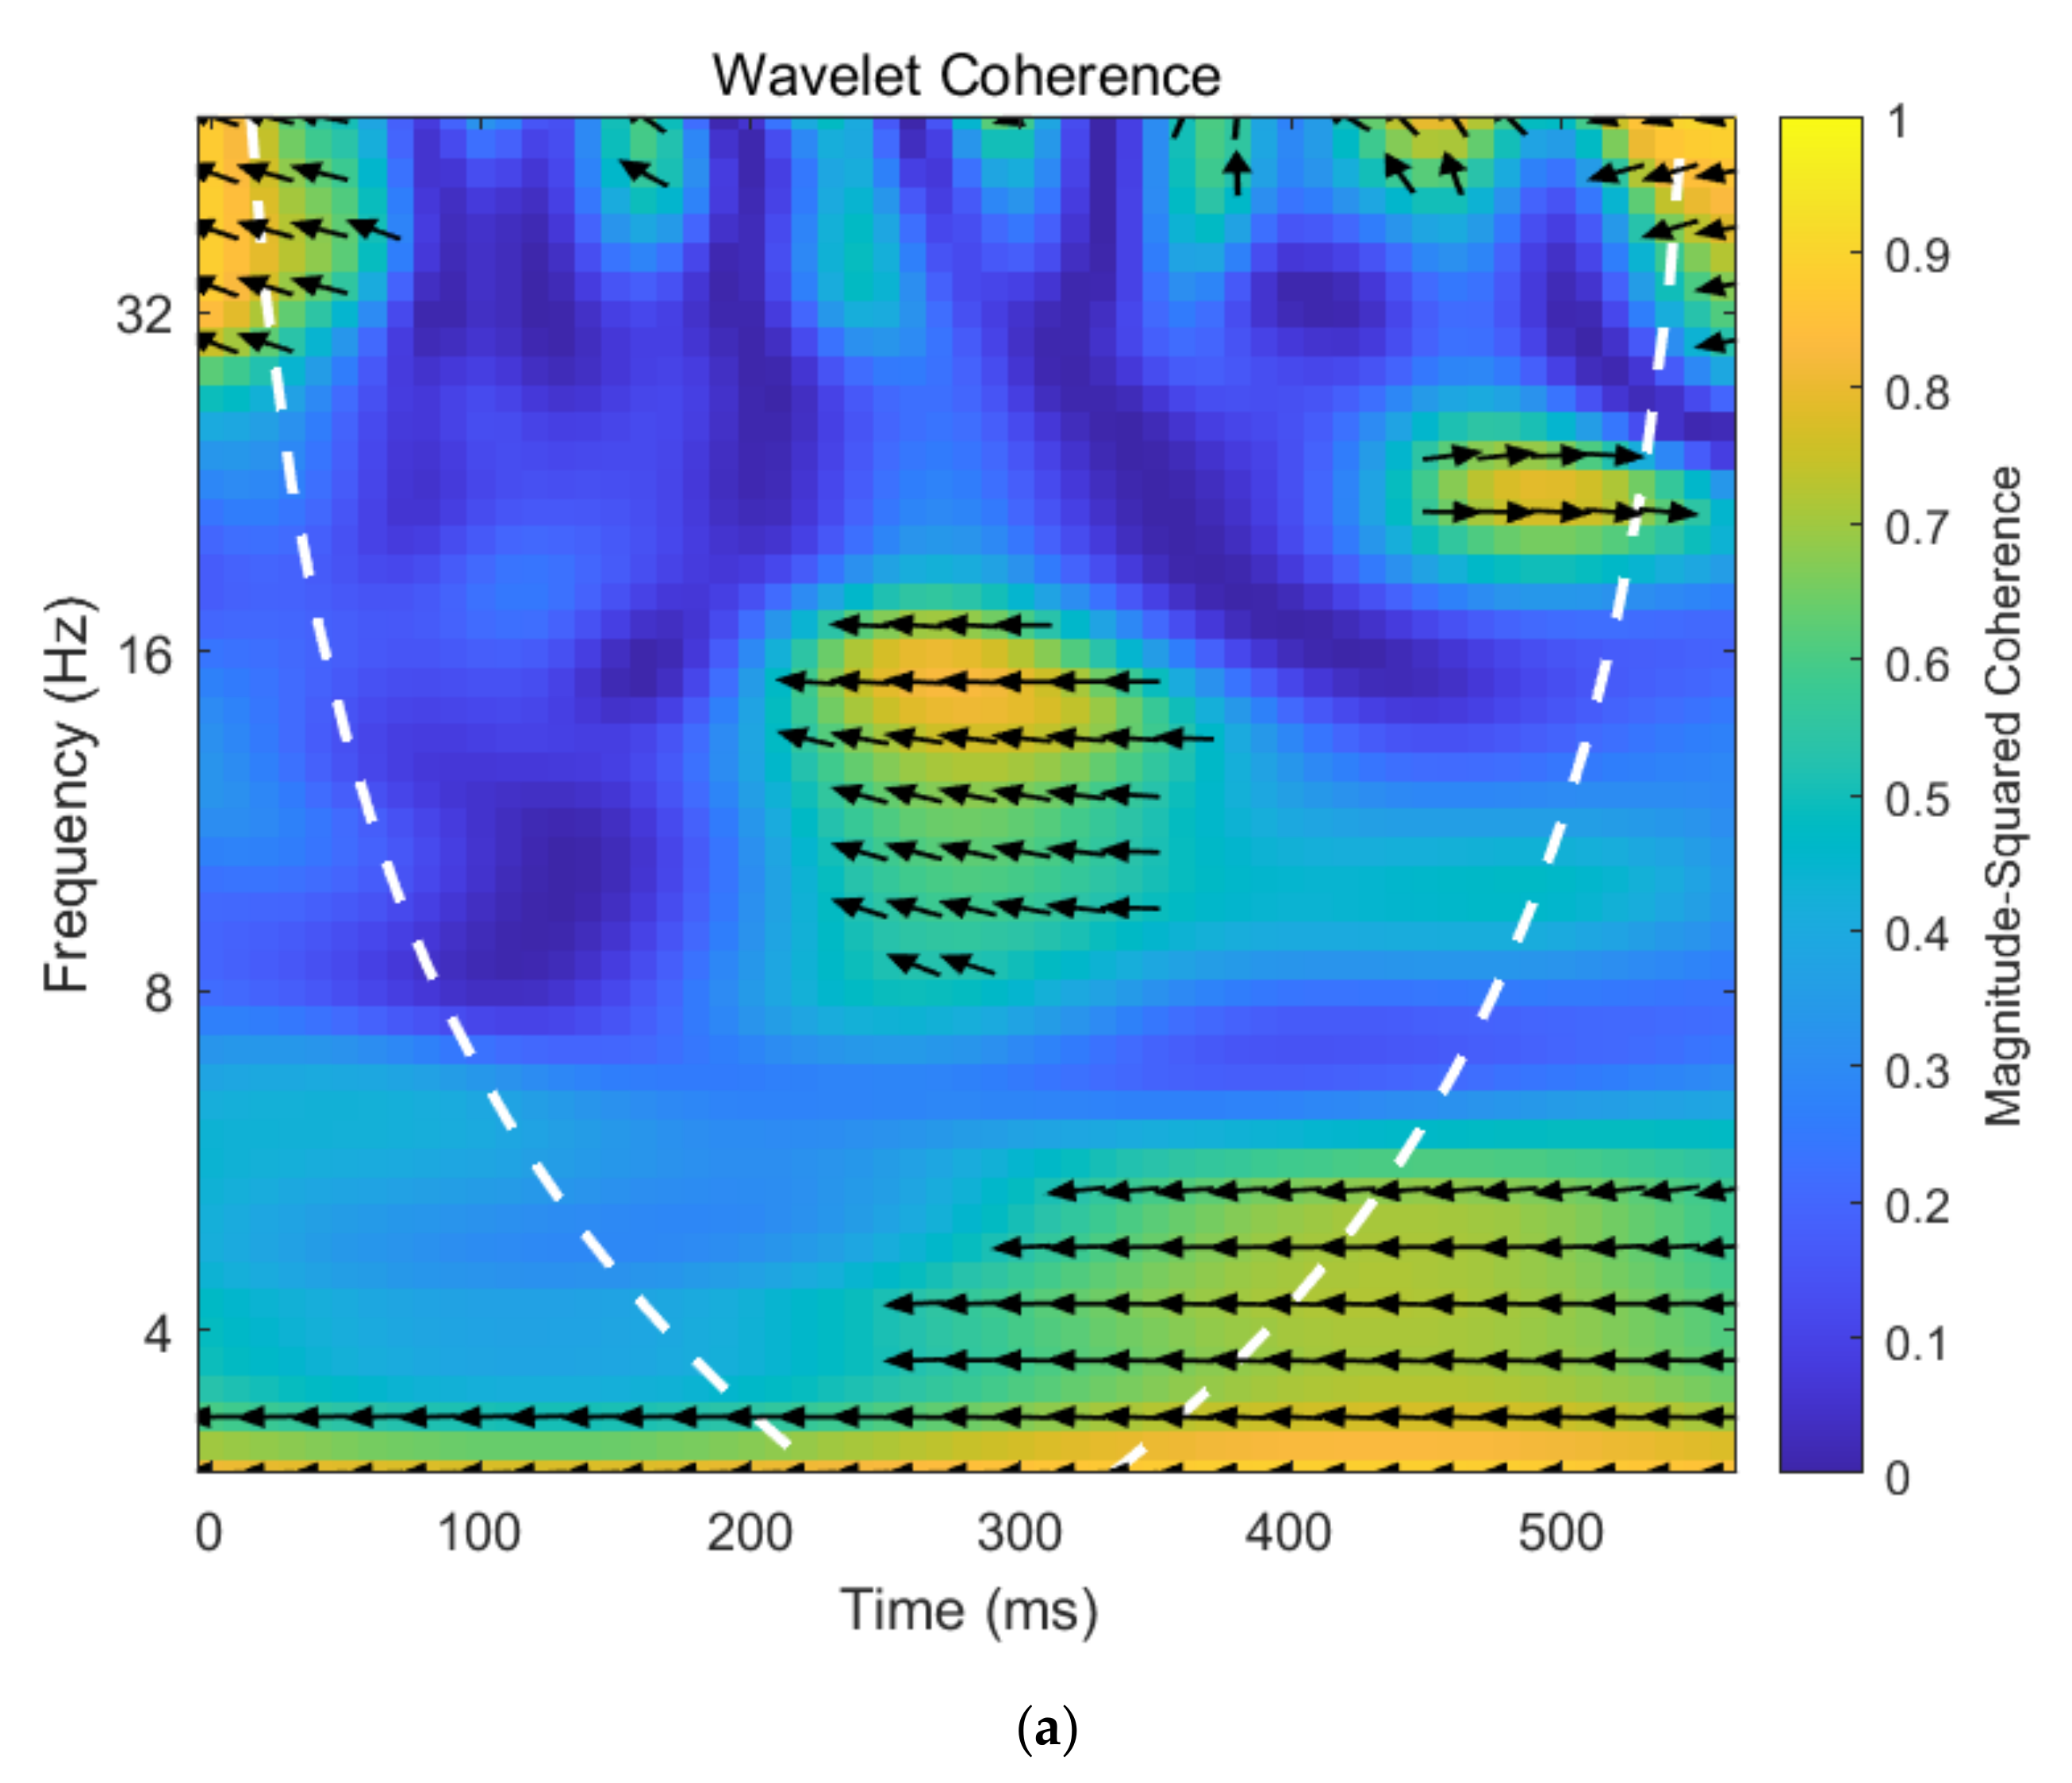
Figure 8 plots the wavelet coherency map between oil-specific demand shocks and investor sentiment under different trends of crude oil.
Figure 8a presents the wavelet coherency map of oil-specific demand shocks and investor sentiment when the crude oil price rises, while
Figure 8b exhibits the wavelet coherency map of oil-specific demand shocks and investor sentiment when the crude oil price falls.
Asymmetric dynamic correlation exists between oil-specific demand shocks and investor sentiment under different trends of crude oil price.
Figure 8 plots the wavelet coherency map of oil-specific demand shocks and investor sentiment under different trends of crude oil price. First, from
Figure 8a, the coherence coefficient between oil-specific demand shocks and investor sentiment is rarely significant. This indicated that dynamic relationship between oil-specific demand shocks and investor sentiment is almost insignificant during periods of rising oil prices. Second, most of arrows point to right in
Figure 8, which indicating that oil-specific demand shocks are positively related to investor sentiment at middle frequency during periods of falling oil prices. In conclusion, dynamic correlation is asymmetric between oil-specific demand shocks and investor sentiment under different trends of crude oil price.
The lead–lag relationship between oil-specific demand shocks and investor sentiment under different trends of crude oil price are also asymmetric. First, weak co-movement between oil-specific demand shocks and investor sentiment was found from
Figure 8a during periods of rising oil prices. Then, most of arrows point to upper right in
Figure 8, demonstrating oil-specific demand shocks lead investor sentiment at middle frequency during periods of falling oil prices. To summarize, the lead–lag relationship between oil-specific demand shocks and investor sentiment are asymmetric under different trends of crude oil price.
5. Conclusions
This paper attempts to extend the literature on heterogeneous and asymmetric dynamic correlation between crude oil price (shocks) and Chinese investor sentiment. On the one hand, we shed light on the heterogeneous dynamic correlation between crude oil price shocks and investor sentiment in the time and frequency domain in China and yield heterogeneous results. On the other hand, we complement the literature on the dynamic correlation and its lead–lag relationship between crude oil price shocks and investor sentiment by taking a systematic look at asymmetry under different trends of crude oil price. Based on data from February 2013 to June 2021, this paper first utilizes web crawler to construct Chinese investor sentiment index. The SVAR model is then used to decompose the crude oil price shocks into crude oil supply shocks, aggregate demand shocks, and oil-specific demand shocks. Finally, the wavelet coherence analysis is employed to explore the heterogeneous dynamic correlation between crude oil price (shocks) and investor sentiment in the time and frequency domain, and the asymmetric dynamic correlation between them under different trends of crude oil price. The conclusion can be drawn as follows:
On the one hand, heterogeneous dynamic correlations and lead-lag relationships exist between crude oil price (shocks) and investor sentiment over different time and frequency domains. Specifically, first, crude oil price is positively correlate to investor sentiment and their lead–lag relationships are heterogeneous at different frequency. Second, the dynamic correlation between various crude oil prices shocks and investor sentiment are heterogeneous. Oil supply shocks positively correlate with investor sentiment and aggregate demand shocks negatively correlate with investor sentiment, while dynamic correlation between oil-specific demand shocks and investor sentiment is insignificant. Thirdly, the lead–lag relationship between different oil price shocks and investor sentiment at various frequency are heterogeneous. For instance, investor sentiment lead oil supply shocks at the low frequency, aggregate demand shocks lead investor sentiment, and crude oil prices lead oil-specific demand shocks in the middle frequency.
On the other hand, asymmetric dynamic correlations and lead–lag relationships exist between crude oil price (shocks) and investor sentiment under different trends of crude oil price. Specifically, first, there is a negative dynamic relationship between crude oil prices and investor sentiment and crude oil prices lead investor sentiment at high frequency and insignificant dynamic correlation and no co-movement at the relatively low frequency during periods of rising oil prices, while crude oil prices are positively related to investor sentiment during periods of falling oil prices. Crude oil prices lead investor sentiment at the relatively low frequency and investor sentiment leads crude oil prices at the relatively high frequency during periods of falling oil prices. Second, insignificant dynamic relationship and no co-movement exists between oil supply shocks and investor sentiment during periods of rising oil prices, while oil supply shocks are positively and negatively related to investor sentiment at relatively low and high frequency, respectively, and investor sentiment leads oil supply shocks during periods of falling oil prices. Third, aggregate demand shocks are negatively correlated to investor sentiment and aggregate demand shocks lead investor sentiment during periods of rising oil prices, while there is insignificant dynamic relationship and no co-movement between aggregate demand shocks and investor sentiment during periods of falling oil prices. Forth, there is almost insignificant dynamic relationship and weak co-movement between oil-specific demand shocks and investor sentiment during periods of rising oil prices, while oil-specific demand shocks are positively related to investor sentiment and the former leads the latter at middle frequency during periods of falling oil prices.
These conclusions provide a more detailed exhibition of the heterogeneous and asymmetric dynamic correlation between crude oil price (shocks) and Chinese investor sentiment. Our study yields some important implications. First, policies that seek to decrease the risk in the crude oil futures market should consider different shocks of crude oil, given the heterogeneous and asymmetric dynamic correlation between crude oil price (shocks) and Chinese investor sentiment. Additionally, investors should fully consider the impact of crude oil prices and shocks based on the conditions of different crude oil shocks and different trends of crude oil, and then adjust the portfolio strategy or decision making in time to reduce investment risk.
However, this paper is not without limitations. For instance, we ignore the heterogeneous influence of crude oil price fluctuations on the investment behaviors of Chinese investors and global investors. A first direction for further research would be to explore the dynamic co-movement relationship between crude oil prices, as well as oil price shocks and investor sentiment or investment behaviors in different countries and compare the potential similarities and differences in the dynamic co-movement relationship. Furthermore, it could be another valuable area that introducing event study methodology to analyze the relationship between crude oil price (shocks) and investor sentiment [
56].


