Article

Influence of the Car Movable Aerodynamic Elements on Fast Road Car Cornering

1
Institute of Aeronautics and Applied Mechanics, Warsaw University of Technology, 00-665 Warszawa, Poland
2
Institute of Micromechanics and Photonics, Warsaw University of Technology, 02-525 Warszawa, Poland
3
Institute of Automatic Control and Robotics, Warsaw University of Technology, 02-525 Warszawa, Poland
*
Author to whom correspondence should be addressed.
Energies 2022, 15(3), 689; https://doi.org/10.3390/en15030689
Submission received: 11 December 2021 / Revised: 29 December 2021 / Accepted: 8 January 2022 / Published: 18 January 2022
(This article belongs to the Special Issue Future of Road Vehicle Aerodynamics)

Abstract

:
In the case of road cars, road safety is the primary factor. The geometry of high-speed road cars has no regulatory restrictions. In addition to the high engine power and effective shape, they can use various types of additional movable aerodynamic elements to adjust their aerodynamic characteristics to the road conditions. Based on the geometry of a two-seater prototype of such a vehicle, a numerical analysis of the influence of a number of additional movable aerodynamic elements on its aerodynamic characteristics was performed. Several of them were installed on the prototype. An electronic system recording a number of motion parameters of the entire car body and some of its movable elements installed on the body was designed and built. The system has been adapted to program the motion of additional aerodynamic elements according to the set algorithms of their activation, temporarily changing the aerodynamic characteristics of the car. An experimental study of the effect of changes in the aerodynamic characteristics of the prototype on its dynamic properties during a drive through a test road section was carried out. It was shown to what extent an average driver can increase the safe speed of the curve of the road using the possibilities of moving aerodynamic elements installed on it.

Graphical Abstract

1. Introduction

A road vehicle or vehicle component streamlining during curved motion is a relatively new problem. Most work has focused on the front aerodynamic components of race cars with exposed wheels. In this configuration, the effects of non-uniform distribution of both values and directions of inflow on the front inverted wing are most apparent.
Many results of both experimental and numerical work of cornering vehicles are published.
The experimental work is conducted mainly in basins, and the model under study moves in a given manner. The paper by Keogh et al. [1] summarizes the current state of the art in methods for analyzing curved track motion. It discusses various experimental and numerical techniques used to model flow around objects moving along curved trajectories. In the paper by Keogh et al. [2], an interesting wind tunnel solution with a moving measurement space was presented. In work by Nakashima et al. [3], results of measurements performed in a pool with a controlled motion of the Ahmed model during a turn were presented. In the next work of Nakashima et al. [4], the motion of a car through a curve was studied experimentally in a water tunnel and numerically. The authors assumed that the curved motion of the vehicle could be treated as the superposition of circular motion with rotation about the center of gravity and rectilinear motion with oblique body alignment. The oblique positioning was shown to affect the generated lateral force and yaw moment significantly. The oblique alignment may be due to the consideration of different drift angles of the wheels. The paper by Okada et al. [5] presents the results of numerical analyses of the local vehicle moves along a meandering track using a simple bicycle model of vehicle dynamics validated by comparison with the results for steady-state curved motion of towing tank experiments. The steady-state curved motion was divided into a yawing motion about the vehicle’s center of gravity (CG) and a side-slip motion of the CG. It was then assumed that the steady-state curved motion’s aerodynamic lateral force and the yawing moment could be expressed by superimposing linear expressions of the yawing motion parameters and the side-slip motion parameters, respectively. Patel et al. [6] present the results of experimental studies and numerical calculations of transient flow and edge vortex generation in the area behind the front wing edge plates under straight ahead, curved, and side-slip motion conditions. Differences in the structure of the vortices formed are shown.
The papers based on numerical calculations present computational methods and examples of their use for simulating curved vehicle motion.
A very interesting paper by Nara et al. [7] presents a new computational method called ALE (arbitrary Lagrangian–Eulerian), based on a local computational region’s motion for solving the F1 vehicle streamlining during complex maneuvers on a test track.
In the work of Watanabe and Matsuno [8], a description of the moving computational area method and its use to calculate the passage of a C-shaped turn is presented. The paper by Jossefsson et al. [9] presents a methodology for simulating the streamlining of an object moving through a curve using the moving reference frame method. In the work of Keogh et al. [10], the streamlining of an inverted wing was computed in four configurations to demonstrate the differences in flow structure. Typically, the front wing is offset forward, so its transverse axis (along the span) does not intersect the focal point of the curved motion. The wing is positioned at some angle to the inflow direction. Relative to the straight-line motion of the wing, both the drag force and the lift force for the simulated rotation of the wing were found to be the same. There was a minimal increase in lateral force. More significant changes were observed in the moment values. The pitching moment remained the same. On the other hand, there was a significant tilting moment towards the outside of the turn and a deflection moment of small value towards the outside of the turn. A change in the trailing edge vortex structure was also noticeable.
In the paper by Okada et al. [11], a presentation of road test results was made, and in the paper by Tsubokura et al. [12], a description of the method and computational results of vehicle streamlining during on-road maneuvers was given. In the paper by Roberts [13], experimental and numerical results of a front wing with body section and without front wheels at an oblique inflow representing inflow conditions during cornering were presented. Meandering motion was modelled by sinusoidally changing the displacement, yawing, and slip angles. The differences occurring between the streamlining of the reference vehicle and the modified vehicle were presented. The work of Keogh et al. [14] contains an analysis of the front wing behavior during cornering. Significant influence of oversteer and understeer characteristics was indicated. The analysis focused on one element.
One of the few works dedicated to aerodynamic elements mounted at the rear of the car body is the work of Gogel and Sakurai [15]. This work analyzed the behavior of the rear flap with several endplate solutions. After adding grommets to the endplates, this final configuration was more efficient than the base case, losing only 6.4% of downforce during yaw compared to 9.6% loss in the base case.
Road test results are a separate area of knowledge about vehicle motion in curves.
The effect of aerodynamic loads on the front and rear axles of a vehicle on its stability during fast cornering is discussed in the work of Winkelmann [16]. The author presented interesting results of a sports car movement analysis during fast road curve driving. He showed how important it is to balance the vehicle’s front and rear axle loads aerodynamically, especially at higher speeds. In the practice of road vehicle construction, it is extremely difficult to obtain a vehicle shape that does not generate an aerodynamic lift force at the expected low aerodynamic drag. A small advantage of lift force at the rear axle leads to dramatic vehicle behavior. More general but very relevant information on the front and rear axle aerodynamic load distributions of cars on different types of tracks are presented in the work of Katz [17], indicating the need for much stronger rear axle loading with increasing average track speed. Equally interesting information on the practical behavior of fast vehicles on the track is given in the publication by Dominy and Dominy [18]. The authors present interesting conclusions. The minimum lap times are obtained for 55% rear axle load, which on slow corners (R = 25 m) is associated with the occurrence of understeer characteristics (−1 deg) and oversteer characteristics (1 deg) on fast corners (R = 100 m). The results were from the period when the classical ground effect was used in designs. In the work of Dominy [19], the effect of aerodynamic axle loads on the dynamic characteristics of the F1 car is shown. Attention was paid to tire drift angles. It was pointed out that the understeer characteristics of the car appear when the rear axle load exceeds 60%. The idea of oblique front wings, which is an attempt to solve the problem of non-uniform distribution of velocity and its direction occurring during curved driving, was presented by Lin and Papadopoulos [20]. In the work of Broniszewski and Piechna [21], the MRF method was used and validated to simulate the transient braking process of a vehicle.
The problem of generating lateral forces is not popular.
The work of Savkoor and Chou [22] considered the possibility of using a movable vertical stabilizer placed at the rear of the vehicle to generate lateral aerodynamic forces improving the performance of the vehicle dynamics control system. In 2018, a movable rear wing on a Zenvo car appeared [23,24] (see Figure 1). The work of Kurec and Piechna [25] presented the possibility of generating lateral aerodynamic forces by movable lateral aerodynamic elements. A patent application [26] for a vehicle geometry that generates lateral aerodynamic force and a description and results of a project [27] based on this patent. Kurec at al. [28] presented numerical and experimental investigation of the rear wing divided into two parts and potentially generating also side force. The work of Piechna [29] provides a comprehensive review of methods for controlling a variety of moving aerodynamic components to improve vehicle comfort, maneuverability and cornering safety.
Additional inertial forces act on a vehicle travelling in a curve. All external forces acting on the vehicle must be balanced by forces generated at the tire/road interface. Tire adhesion coefficients are limited, so additional lateral and longitudinal forces can be augmented by aerodynamic forces that do not generate inertial forces. These forces can be used directly, as in the case of aerodynamic braking, or indirectly by increasing the wheel pressure on the pavement, resulting in increased forces transmitted by the tire at road contact.
In this study, the generation of aerodynamic wheel downforce and the direct generation of aerodynamic lateral forces are considered. Under normal driving conditions, with no tire slippage, transverse inertial forces occur during road curves. This paper focuses on modelling the flow around the vehicle during curved driving and analyzing the aerodynamic forces generated in this case and how they differ from straight-ahead driving.
The first part of the paper is devoted to searching for the geometry of additional aerodynamic elements that can be applied in the case of a prototype sports car.
The second part of the paper analyses results of numerical simulations of selected aerodynamic solutions.
The third part of the paper presents the results of testing a sports car with additional aerodynamic elements during road curving.
This paper deals with the study of the effect of asymmetric flow around a sports car with several moving aerodynamic elements characterized by local asymmetric flow structure.

2. Materials and Methods

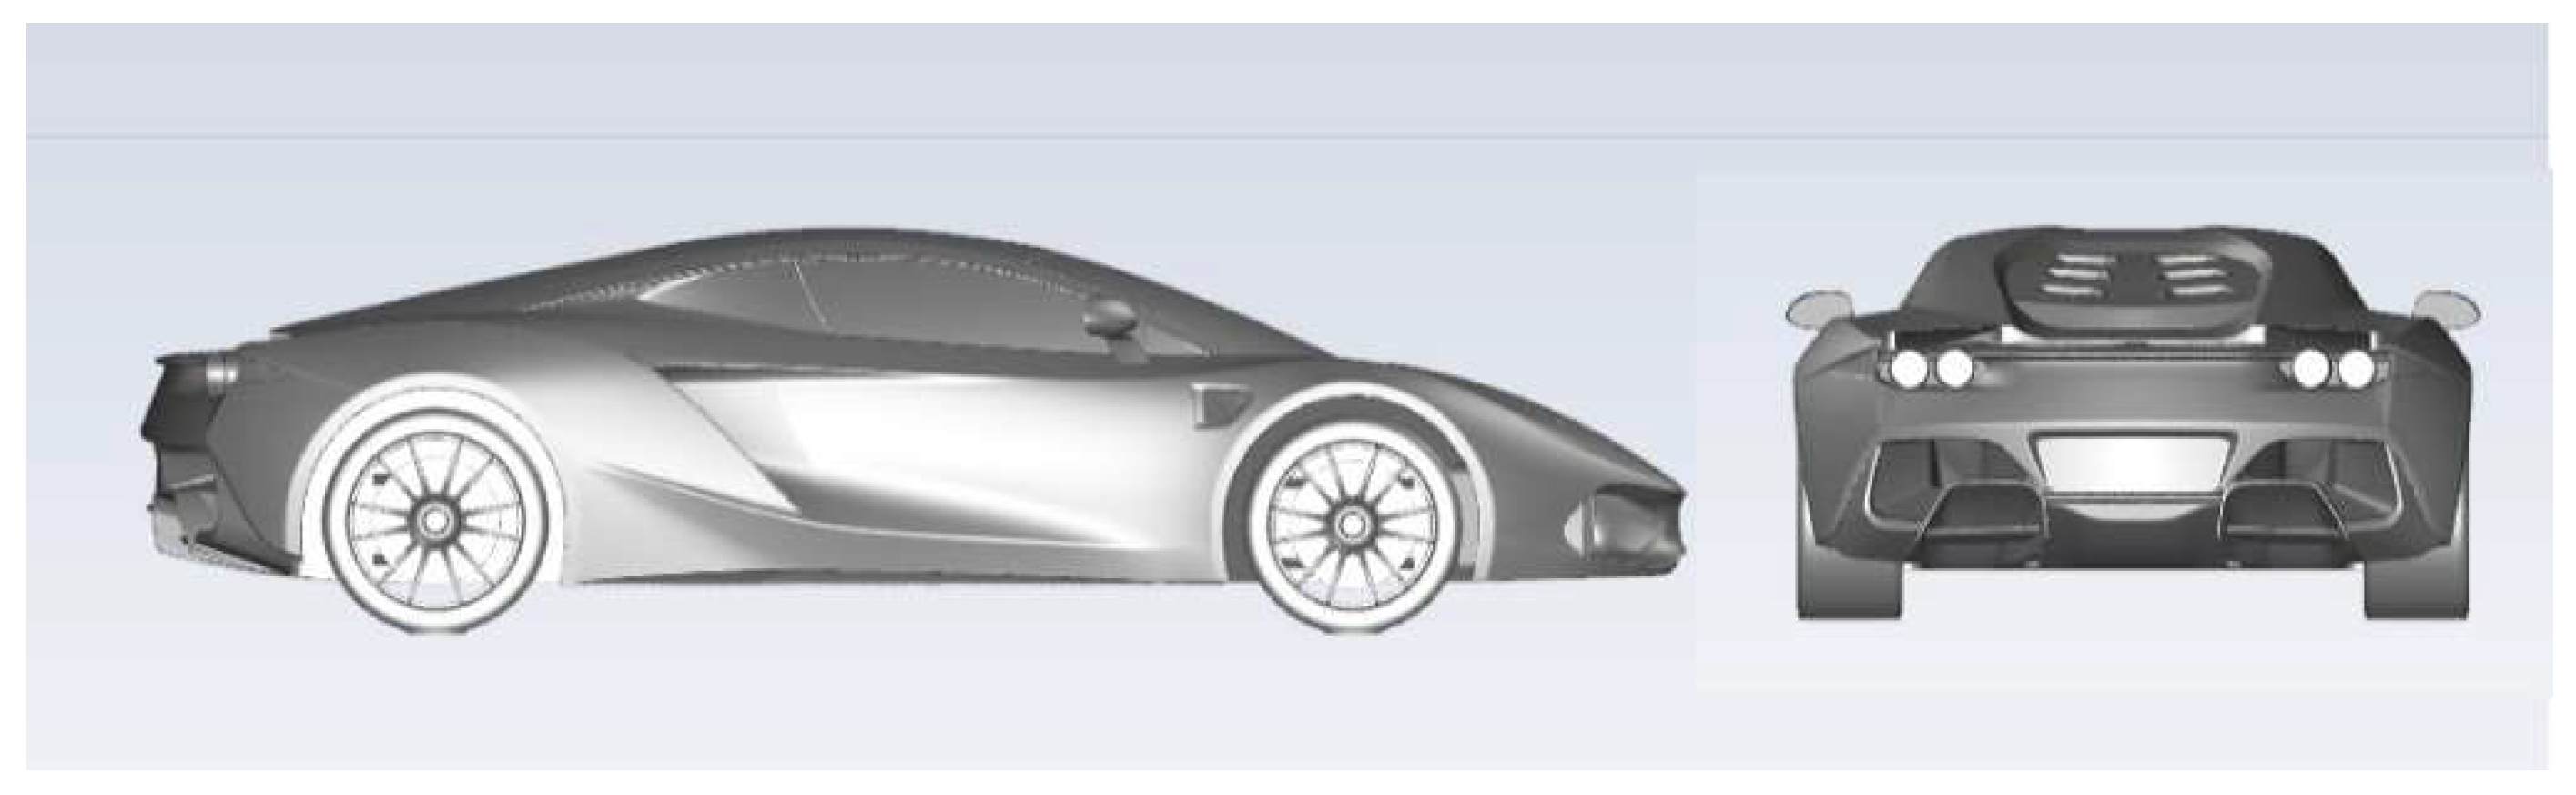
2.1. Object of Study

The object of activities presented in this paper was a prototype of Arrinera Hyssarya supercar shown in Figure 2. The work lasted since 2008, with details of its geometry evolving over time. For various reasons, not all ideas were realized. In the example of the considered geometric changes, we wanted to show their influence on the aerodynamic properties of the car during fast cornering.

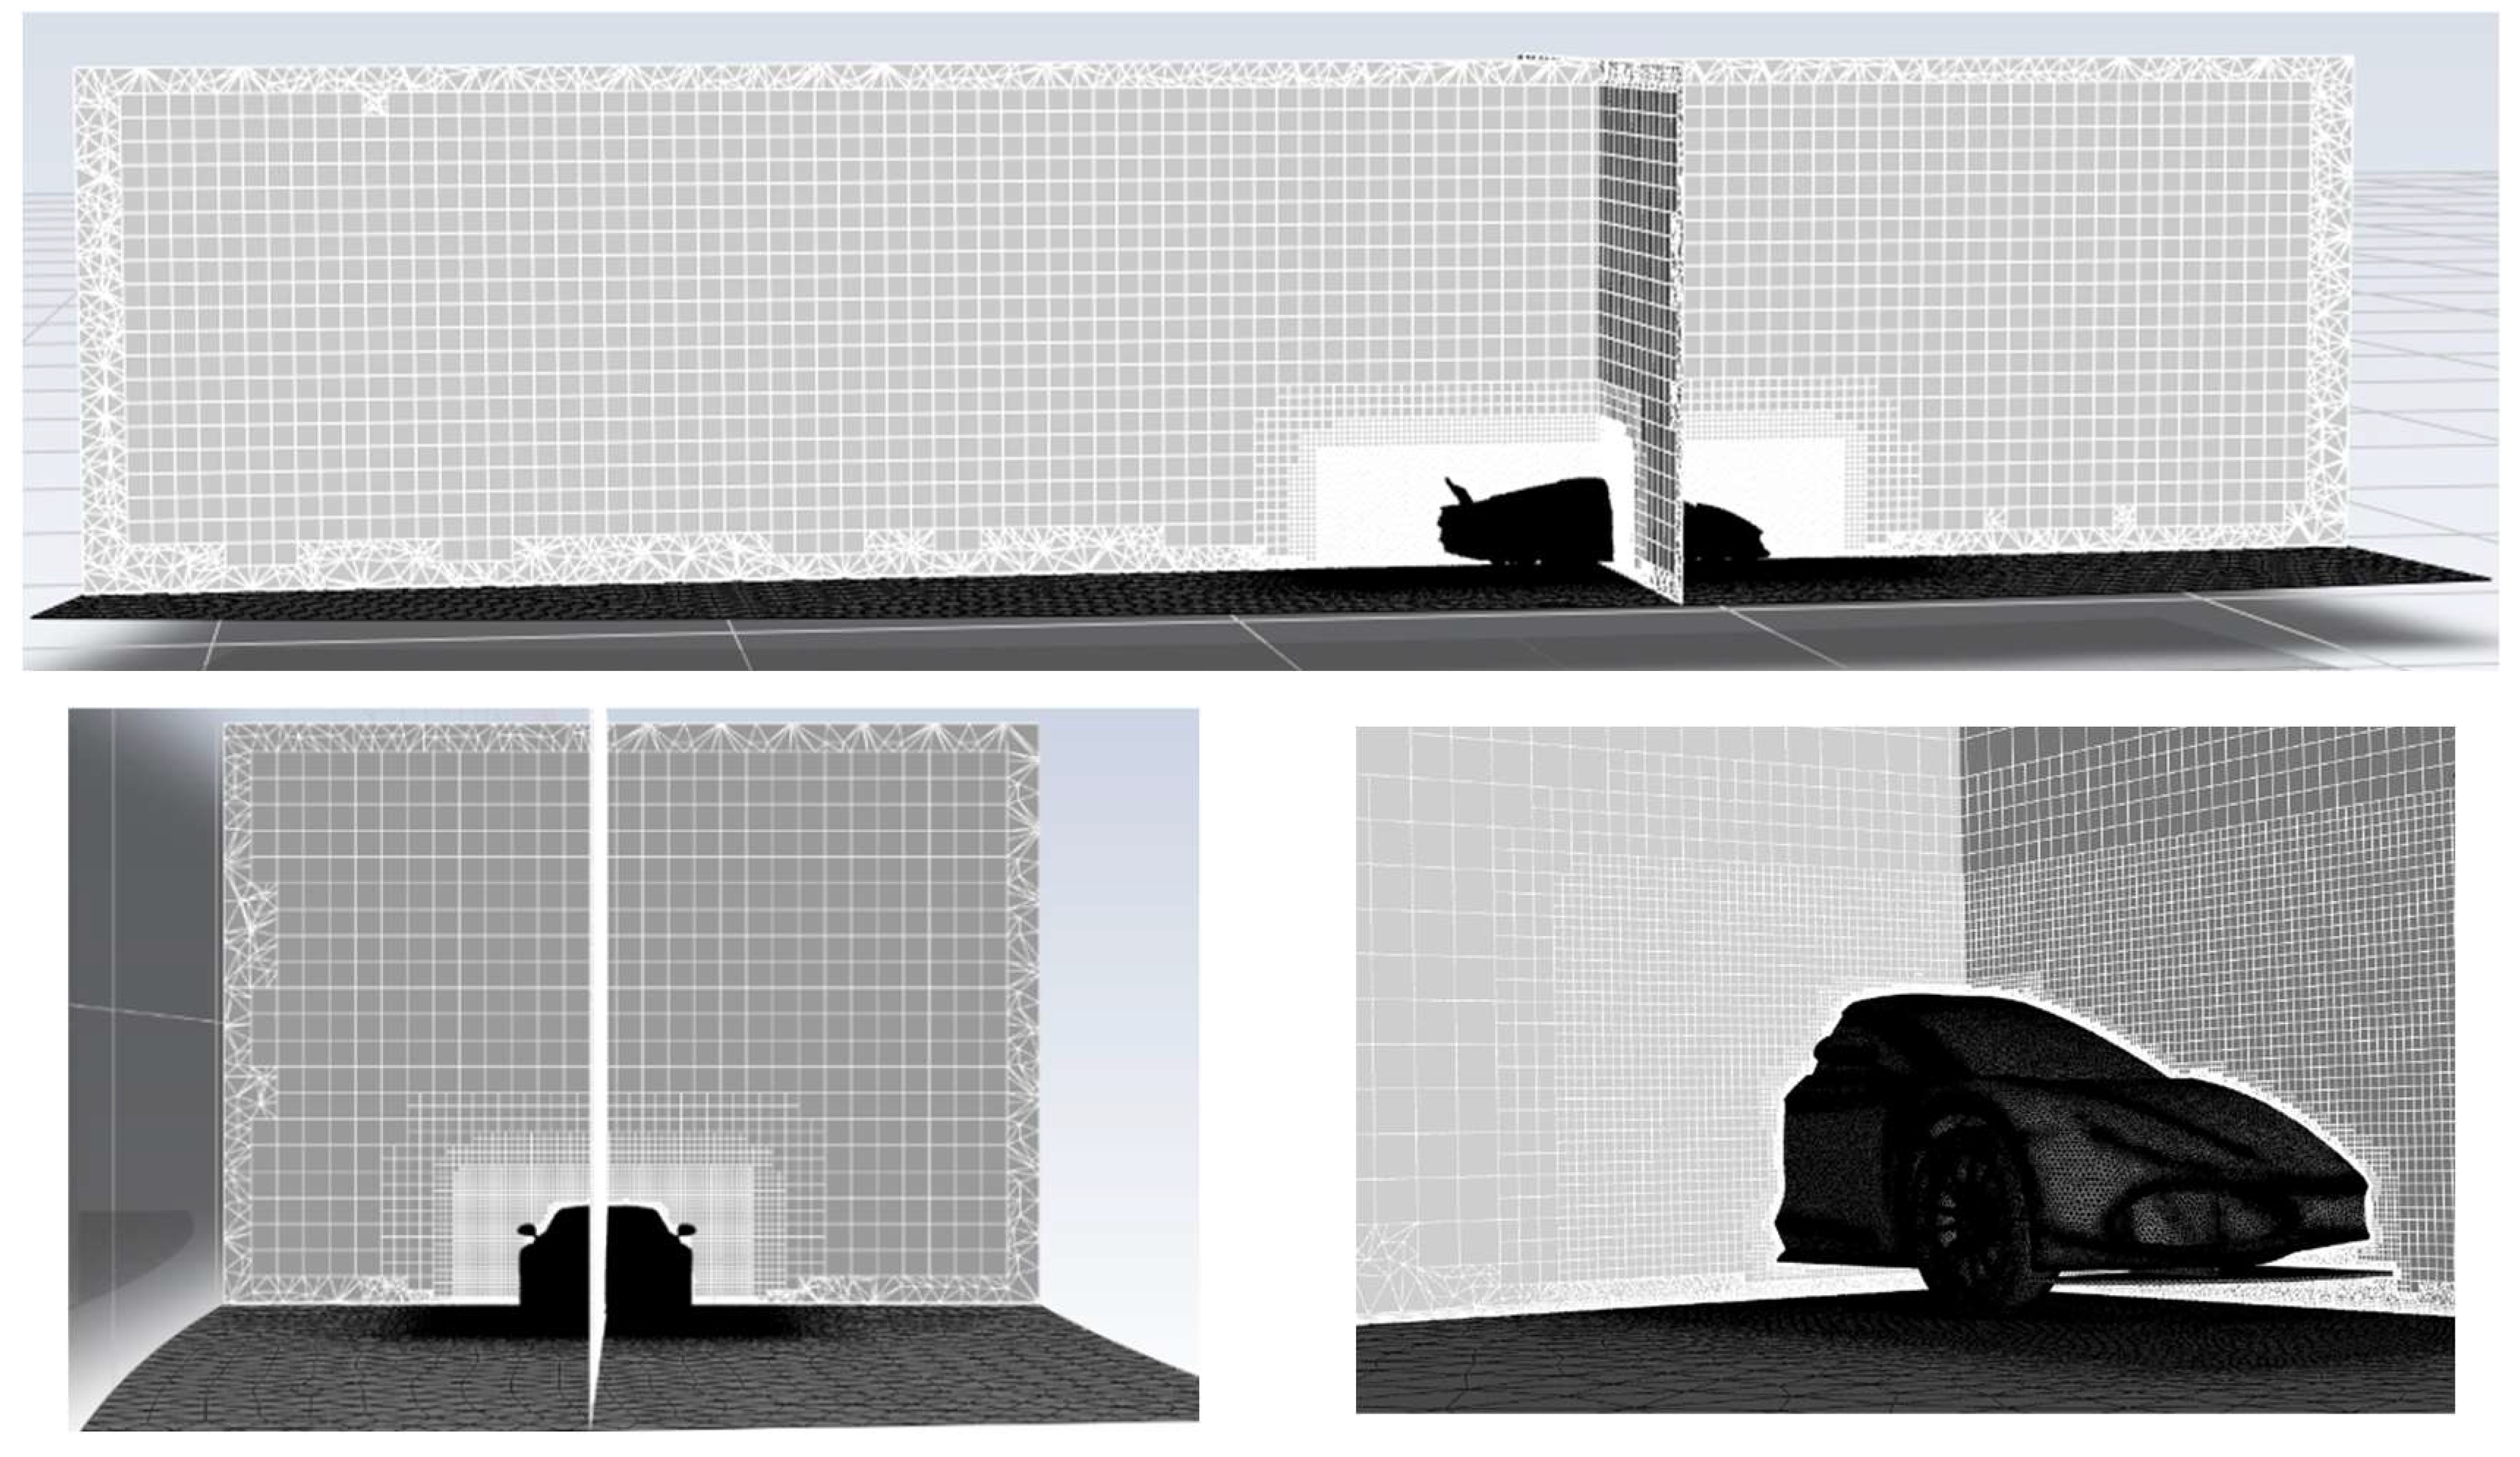
2.2. Simulation Domain and Calculation Method

Numerical simulations were conducted on a real scale object in the orthogonal-wall and curved design area with dimensions shown in Figure 3 and Figure 4.
For the analysis of vehicle movement on a curved track, the natural geometry of the calculation domain is the curved area shown in Figure 3. However, curved motion calculations were also performed in the orthogonal area (Figure 4). In both cases, a slightly modified moving reference frames (MRF) technique was used to simulate the car’s motion. This technique involves using stationary grids and superimposing the conditions of a moving reference system representing a moving vehicle on the entire computational domain. For the arc domain, the boundary conditions were a velocity inlet on the wall in front of the vehicle, a symmetry condition on the side and top walls, and a pressure outlet condition on the wall behind the vehicle. For the cuboid domain, the velocity inlet condition was applied on the face and sidewalls, the symmetry condition on the top wall, and the pressure outlet condition on the wall behind the car. In both cases, zero velocity was assumed in the velocity inlet condition, and zero velocity on the bottom wall type represented a road. With the MRF technique and such given boundary conditions, a situation was simulated in which the vehicle moves along a curved track with a given velocity relative to still air and a stationary roadway (in absolute coordinate system). The rotation of the wheels was simulated by superimposing on the wheel surfaces the velocities resulting from their rotation (see Wang et al. [30]).
The velocity inlet boundary conditions were given a turbulence level of 5% and a turbulence spatial scale of 0.005 m.
The MRF technique was used in earlier work by the authors Broniszewski and Piechna [21] to model a car’s transient braking process, and the numerical model used was verified by track tests.
Various meshing techniques were used. The most common technique used was the overset mesh technique which allowed for effective changes of additional aerodynamic elements.
Individual meshes for the car body and additional aerodynamic elements were generated and later superimposed on each other. Used overset mesh technique connects fluid zones by exchanging the interpolated cell data in the overlapping regions. Due to that, the additional element meshes could be freely translated and rotated in the computational domain. Considering the number of simulations, the overset mesh method significantly reduced model preparation time.
Meshes were mainly generated in Fluent Meshing. The relatively uniform surface mesh was applied to the car body. Poly-hexcore algorithm was chosen for the volume mesh. The cell size of the additional elements mesh was selected to match the size of the background mesh of the car domain (see Figure 5).
The boundary layer mesh was designed to fit the wall function approach. It consisted of 5 elements with growth rate of 1.2 and a constant first layer height of 1.3 mm on the car body to achieve y+ in the range of the logarithmic layer (Figure 6).
The results of the grid sensitivity test are shown in Figure 7.
The numerical model was prepared with the use of ANSYS Fluent software. Different software versions have been used. Pressure-based solver, implicit formulation and least squares cell-based option for calculating gradients were chosen for all the studied cases. The coupled pseudo-transient scheme was applied for pressure-velocity coupling. Second-order spatial discretization for pressure and momentum was set.

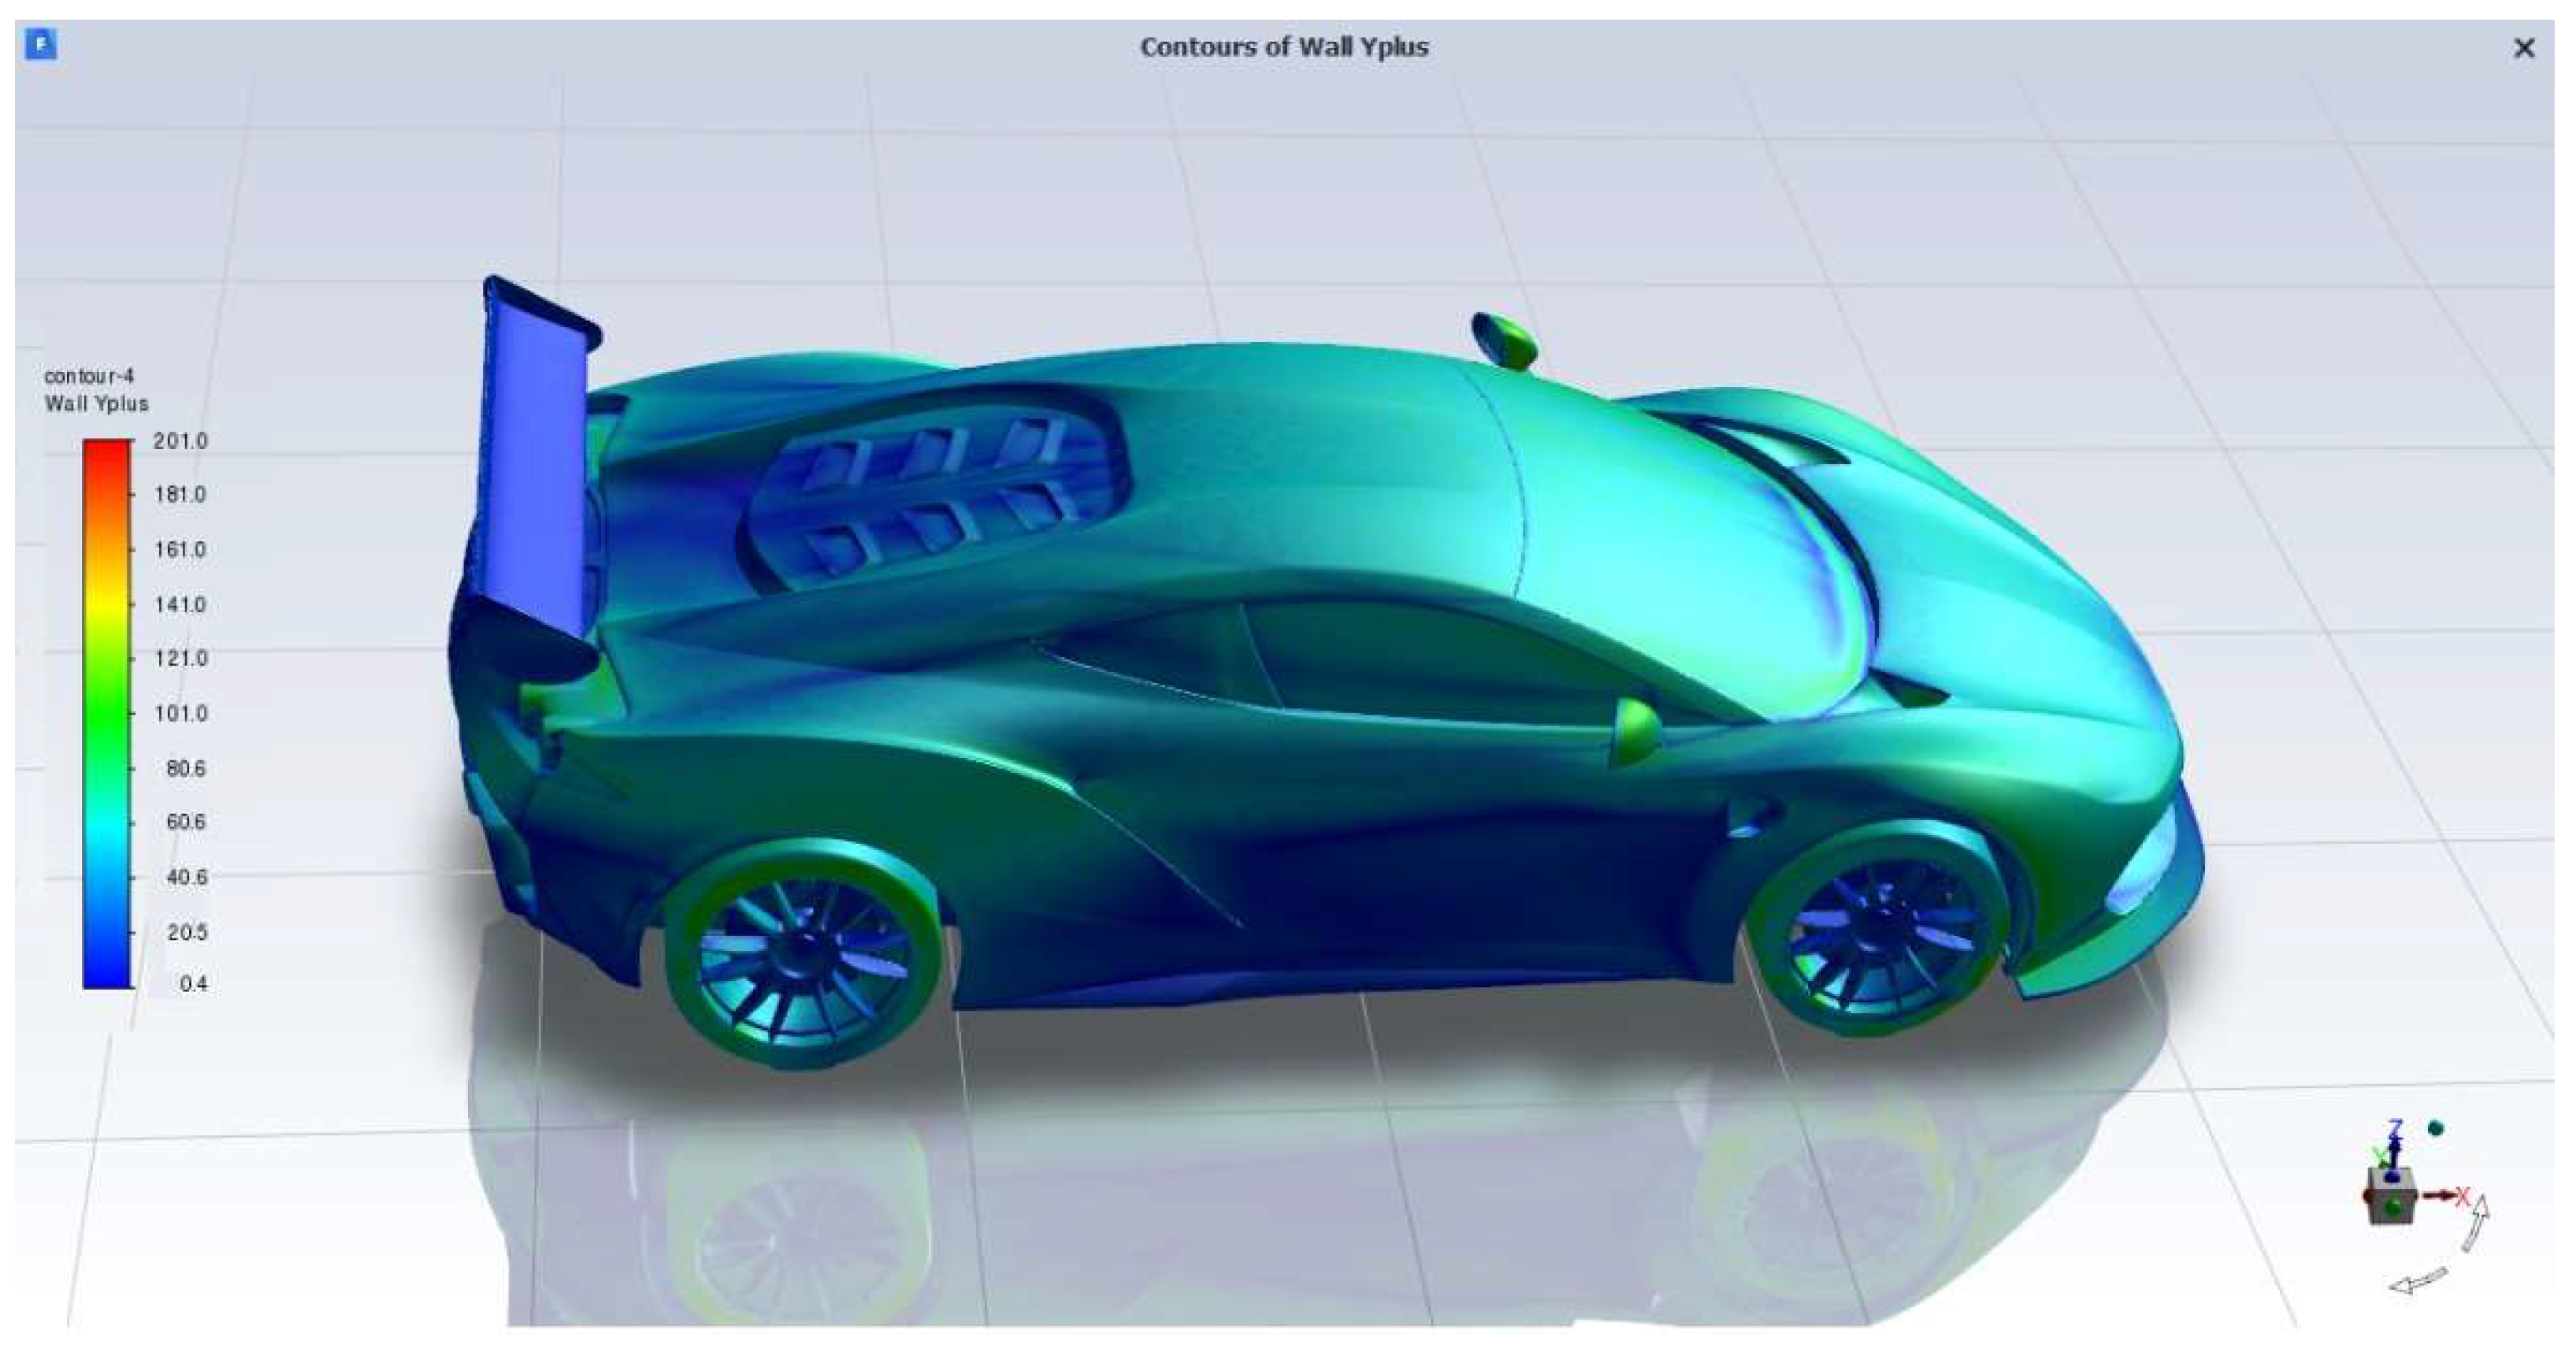
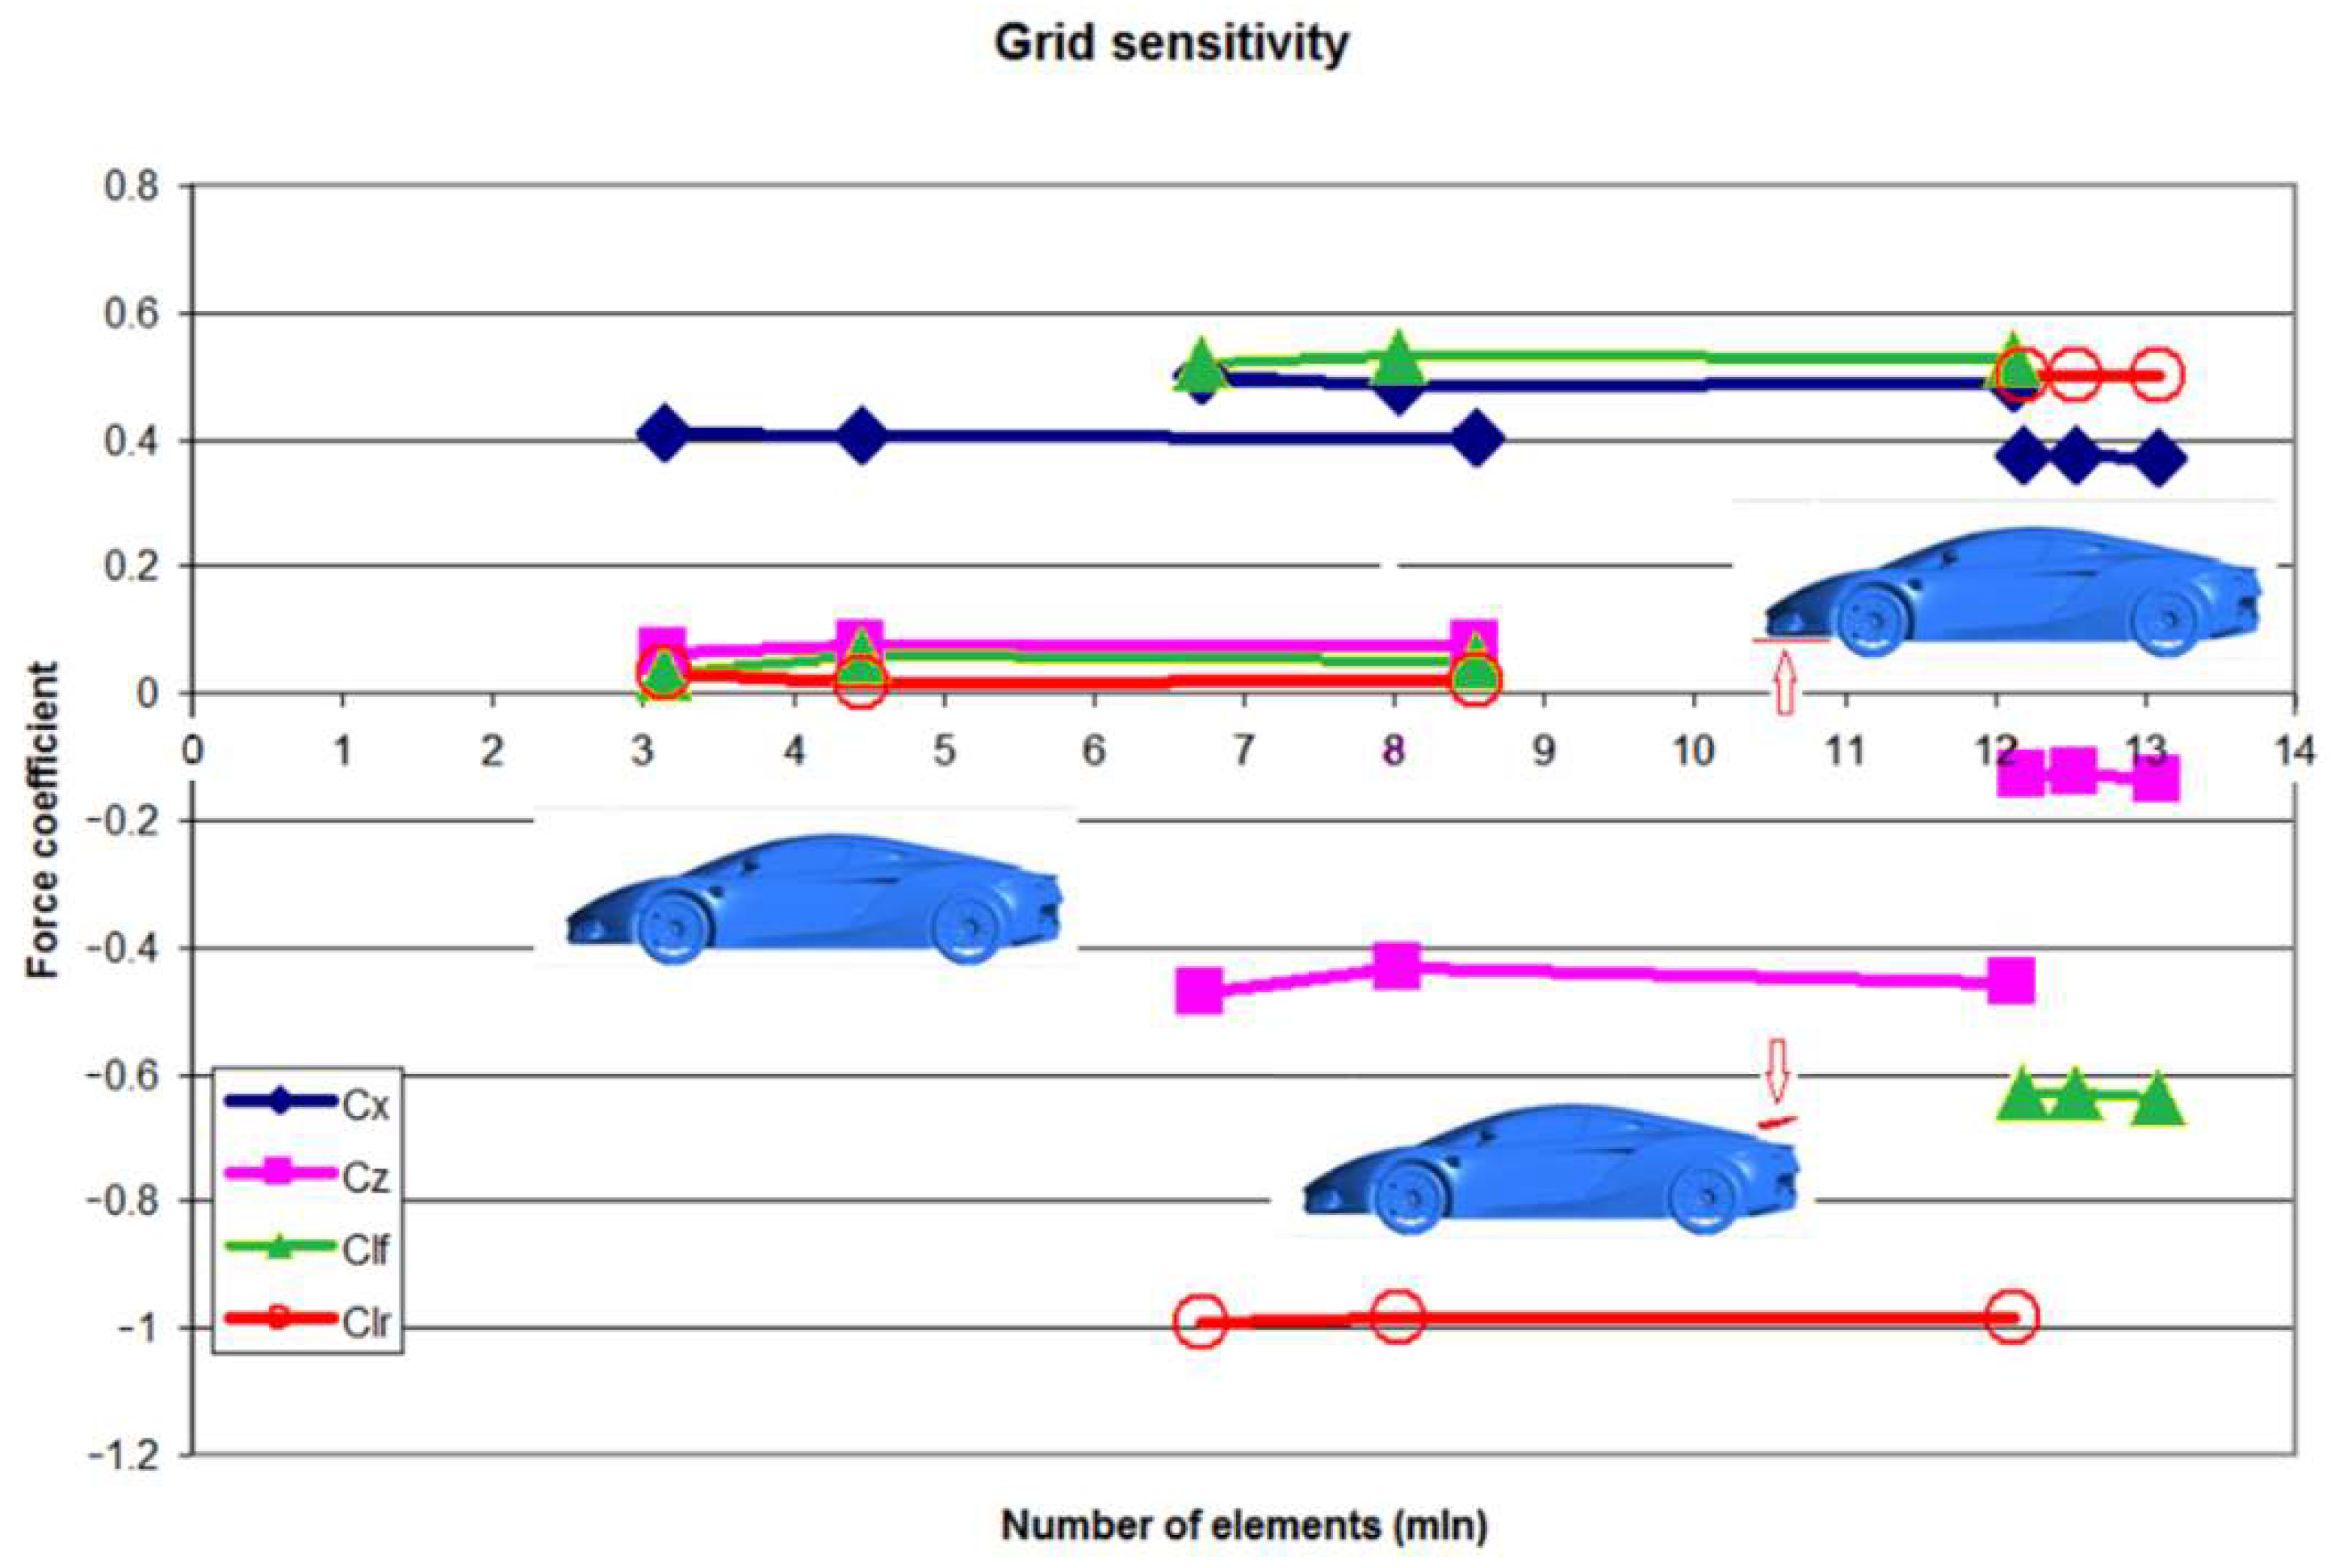
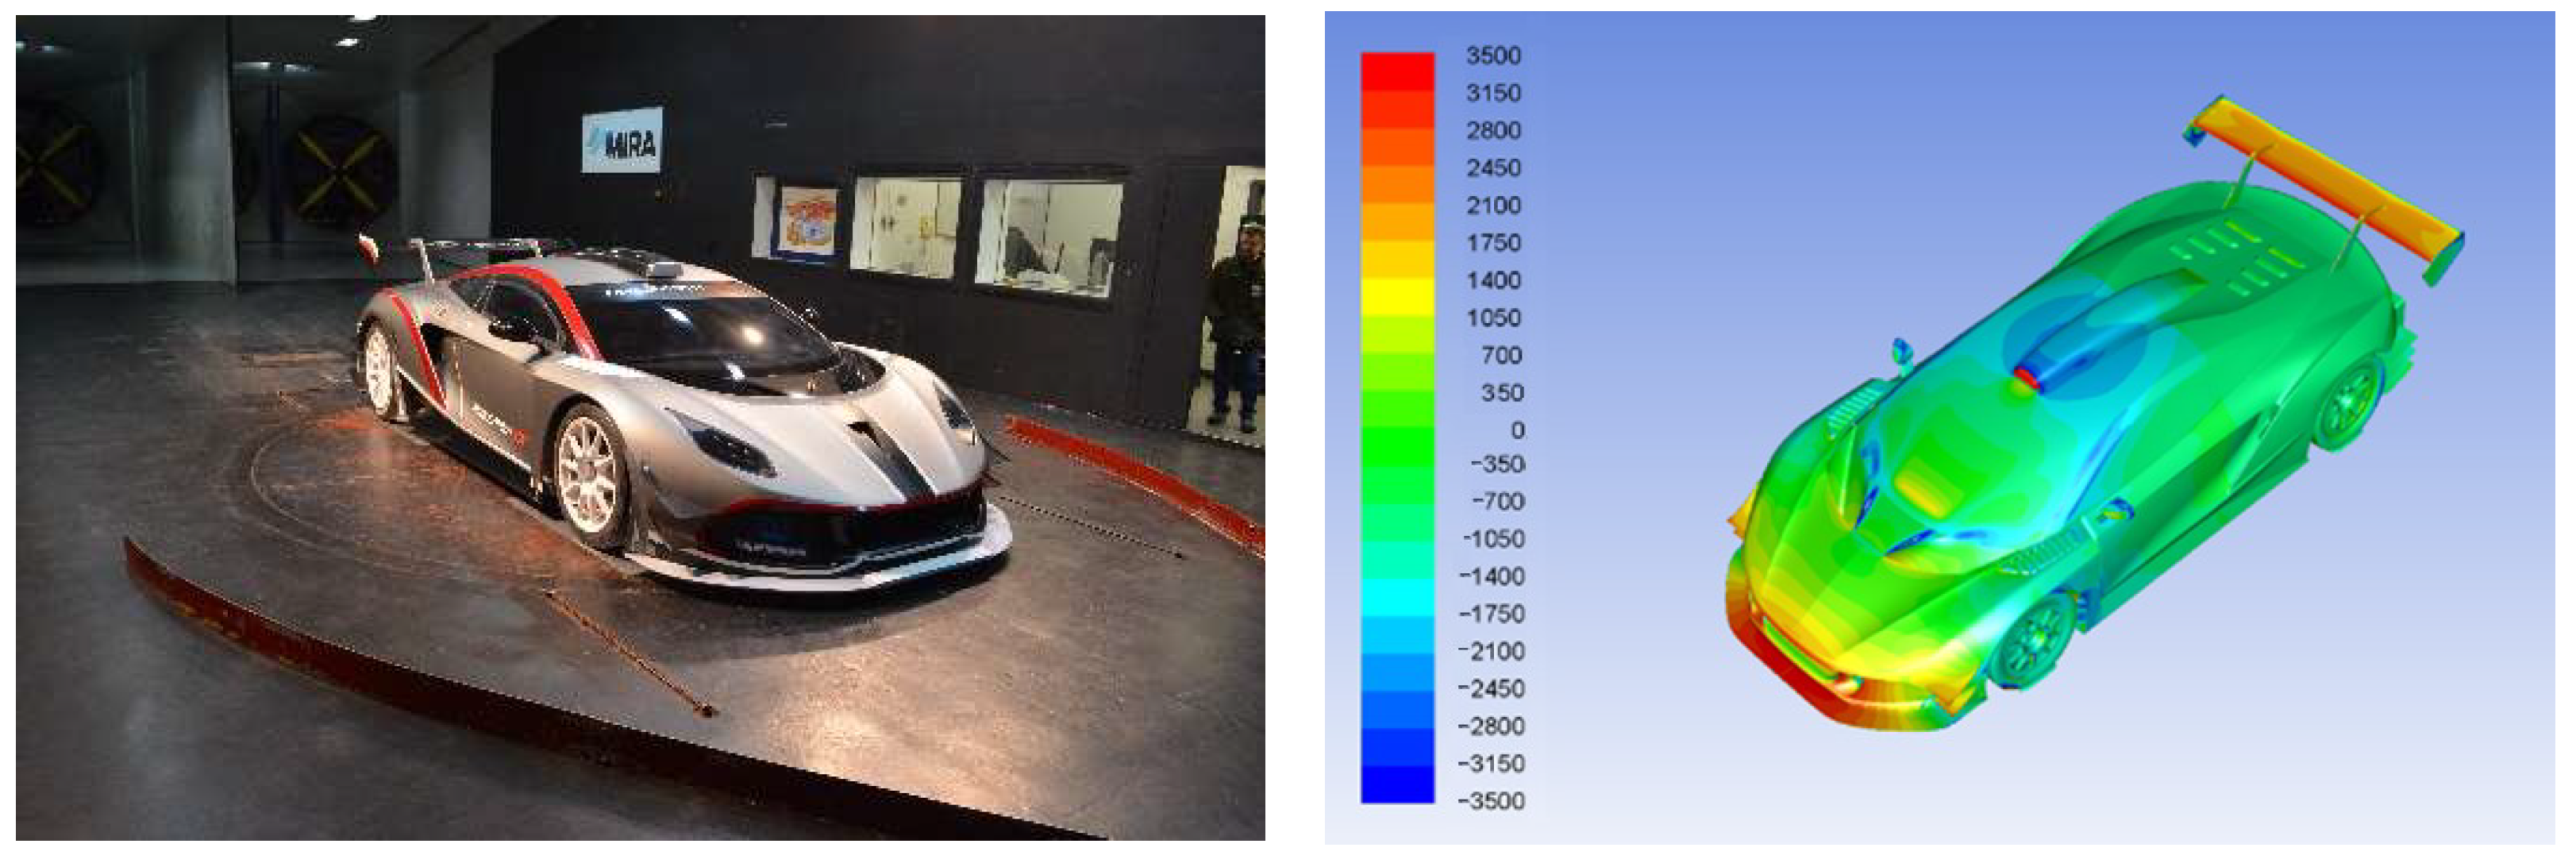
2.3. Validation of the Numerical Model

The numerical model was validated by comparing the results of tunnel tests of one version of the prototype. The numerical model of the racing version of the prototype car with different cooling system design and geometry, different engine air intake, large front splitter and canards, and large rear wing was verified compared with experimental data obtained in the MIRA wind tunnel. A compliance of drag coefficient of 3.8% and lift coefficient of 6.5% was obtained. Calculations showed slightly less drag and slightly higher aerodynamic downforce compared to the experiment. For comparison, in a study by Zhang et al. [31] experimental results were compared with numerical simulation results of a highly detailed sedan vehicle model for different turbulence models: the most popular RANS (Realizable k-epsilon, Abe-Kondoh-Nagano, k-omega SST, V2F) and hybrid models (SST, DDES, IDDES), observing differences in the calculated drag coefficients ranging from 1.3–13.8% error compared to experiment, with the smallest error value obtained (unexpectedly) for the RKE model.
Figure 8 shows a photograph of the prototype GT version of the prototype car and the body pressure distributions obtained from CFD calculations.

3. Results and Discussion

3.1. Performance Analysis of Selected Additional Aerodynamic Elements

Before incorporating some aerodynamic elements into the prototype under construction, a preliminary analysis of possible solutions was carried out before incorporating some aerodynamic elements.
Classical inverted wing, booster plate under it, splitter under the front part of the body, wing tilted to the side were considered. Szudarek and Piechna [32] presented the effect of a wide range of possible inverted wing positions on the aerodynamic characteristics of a car.
Earlier research on the co-operation of the inverted wing with an additional element outside it—the booster plate described in the publication by Kurec et al. [24] suggested the possibility of a broader application of this solution. A numerical analysis of several versions of such a system placed on the Arrinera Hussarya car body was carried out. Several proposals of different shapes of booster plate were presented, and then one of them was chosen and tested in a wider range of wing attack angles. The additional booster plate’s geometry was chosen because its movements did not interfere with the wing or the system controlling its extension and angle of attack.

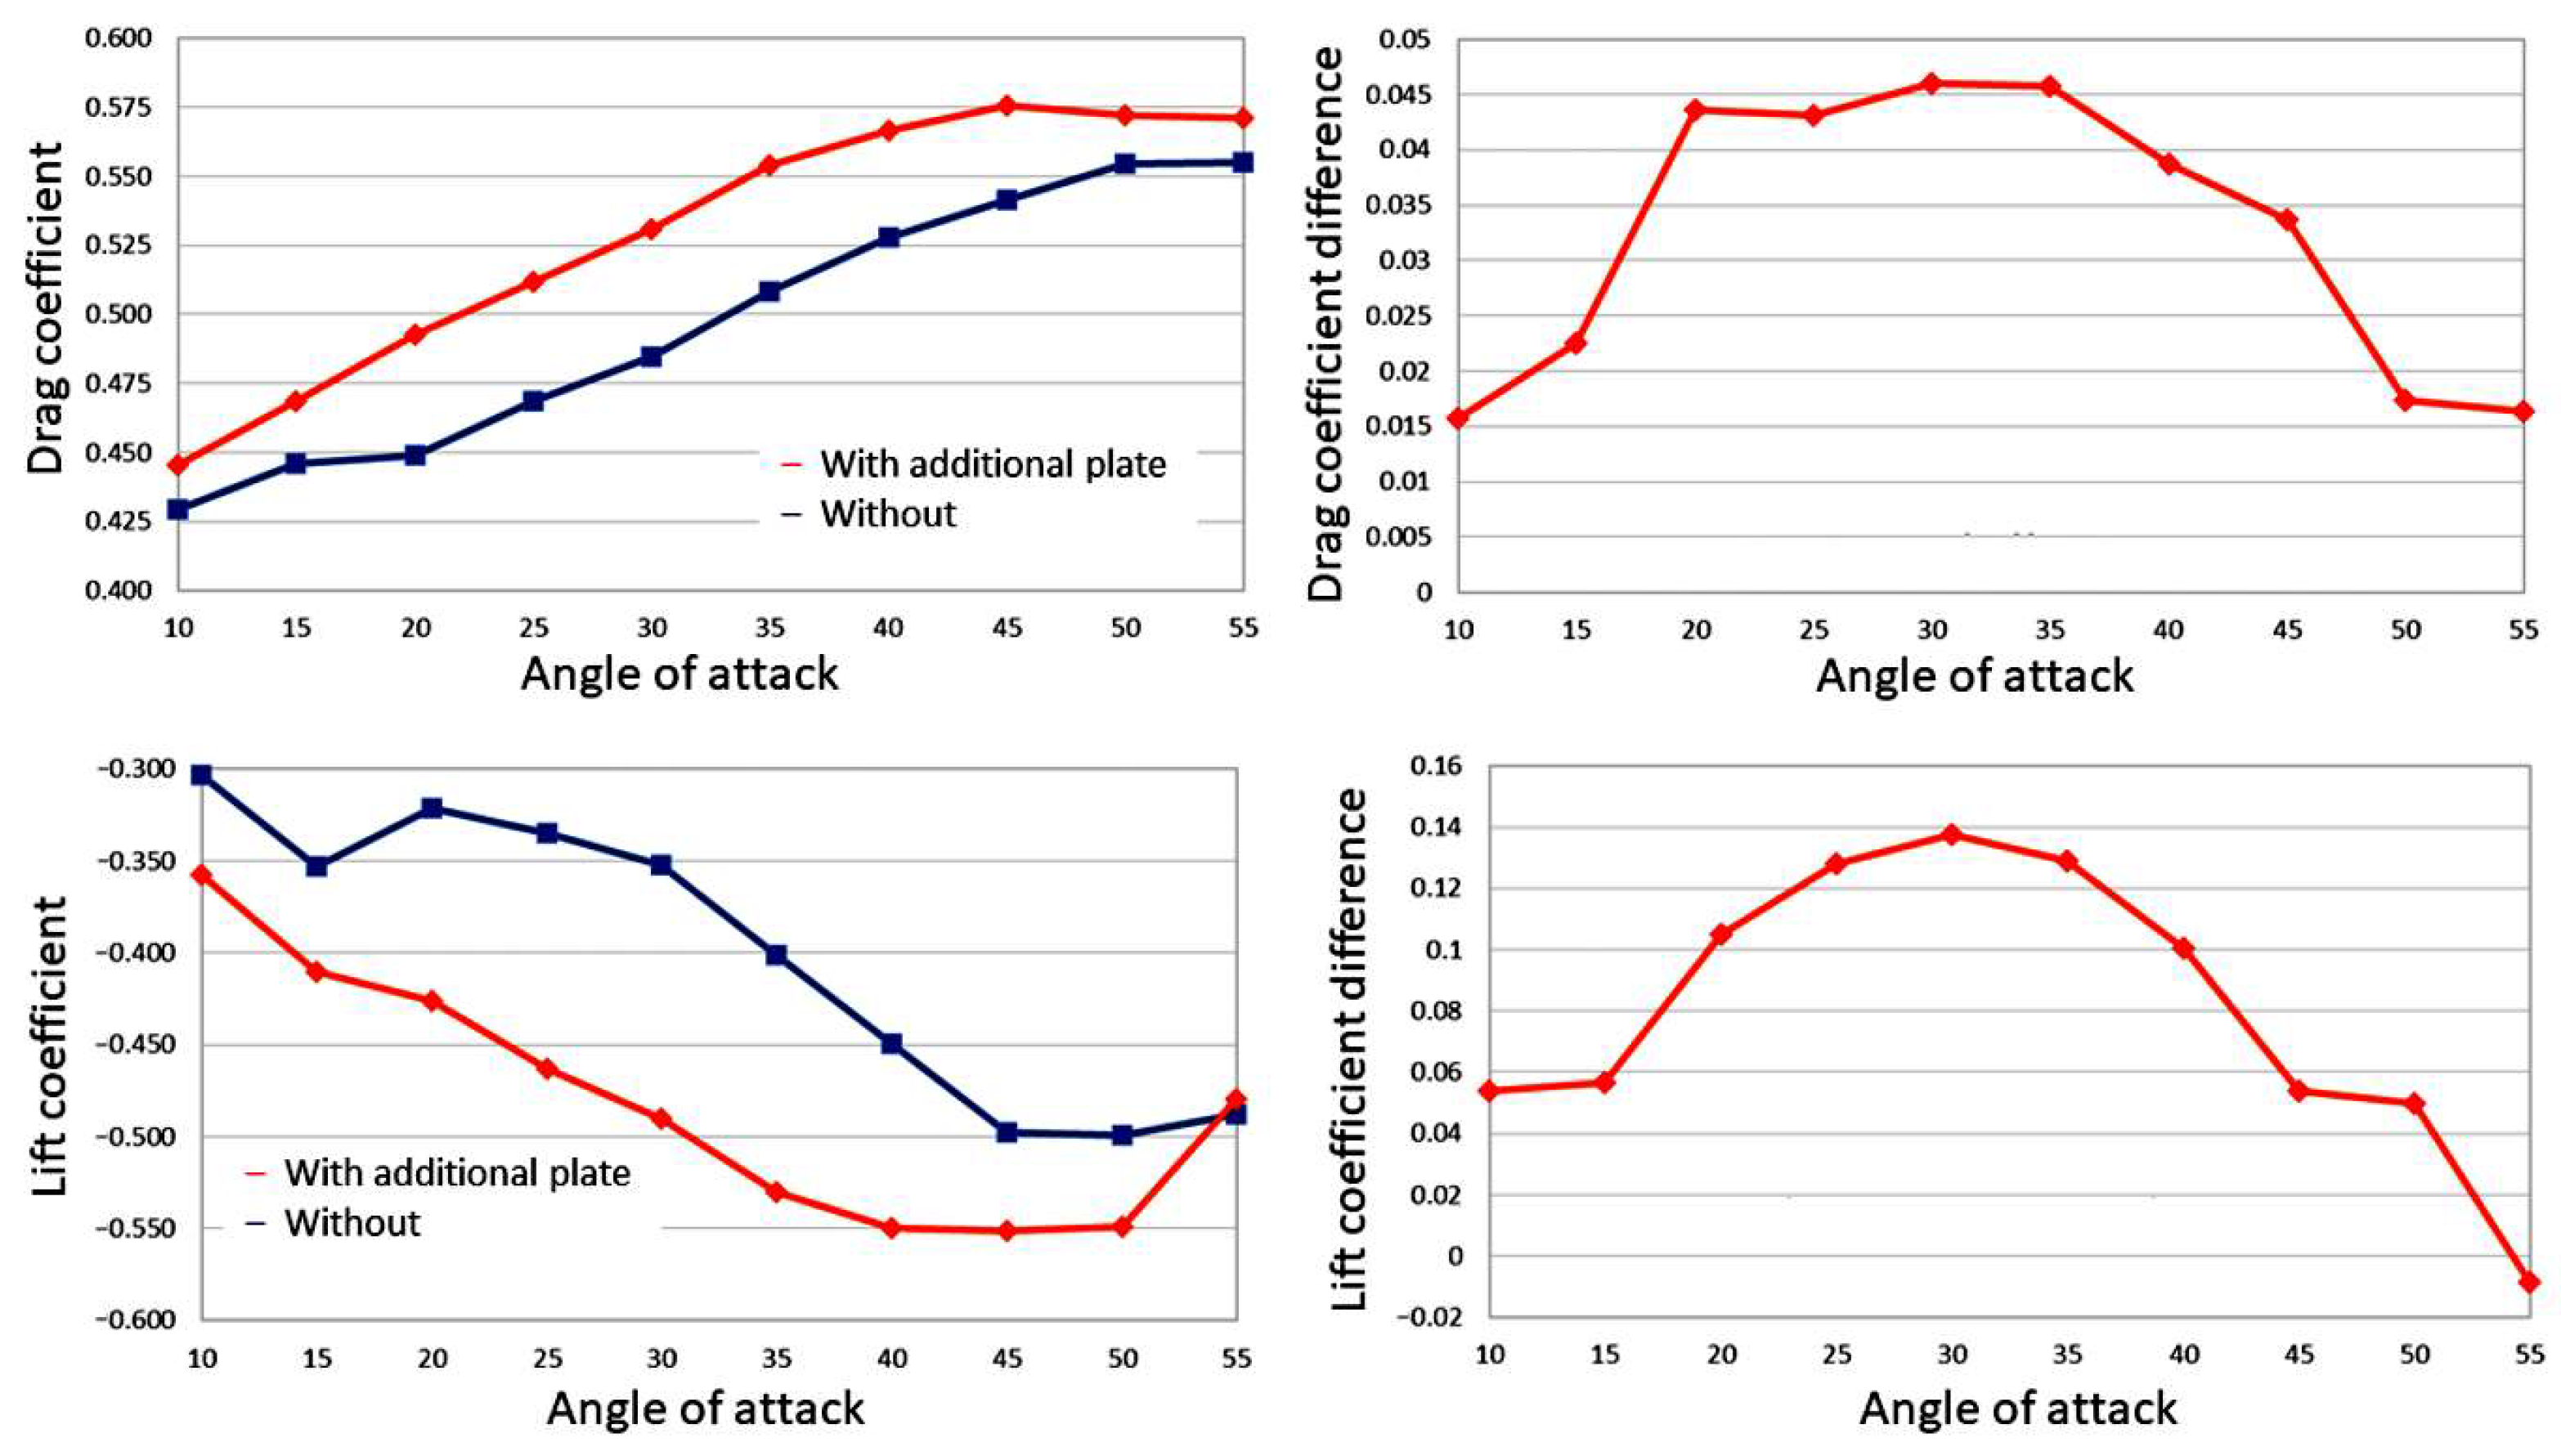
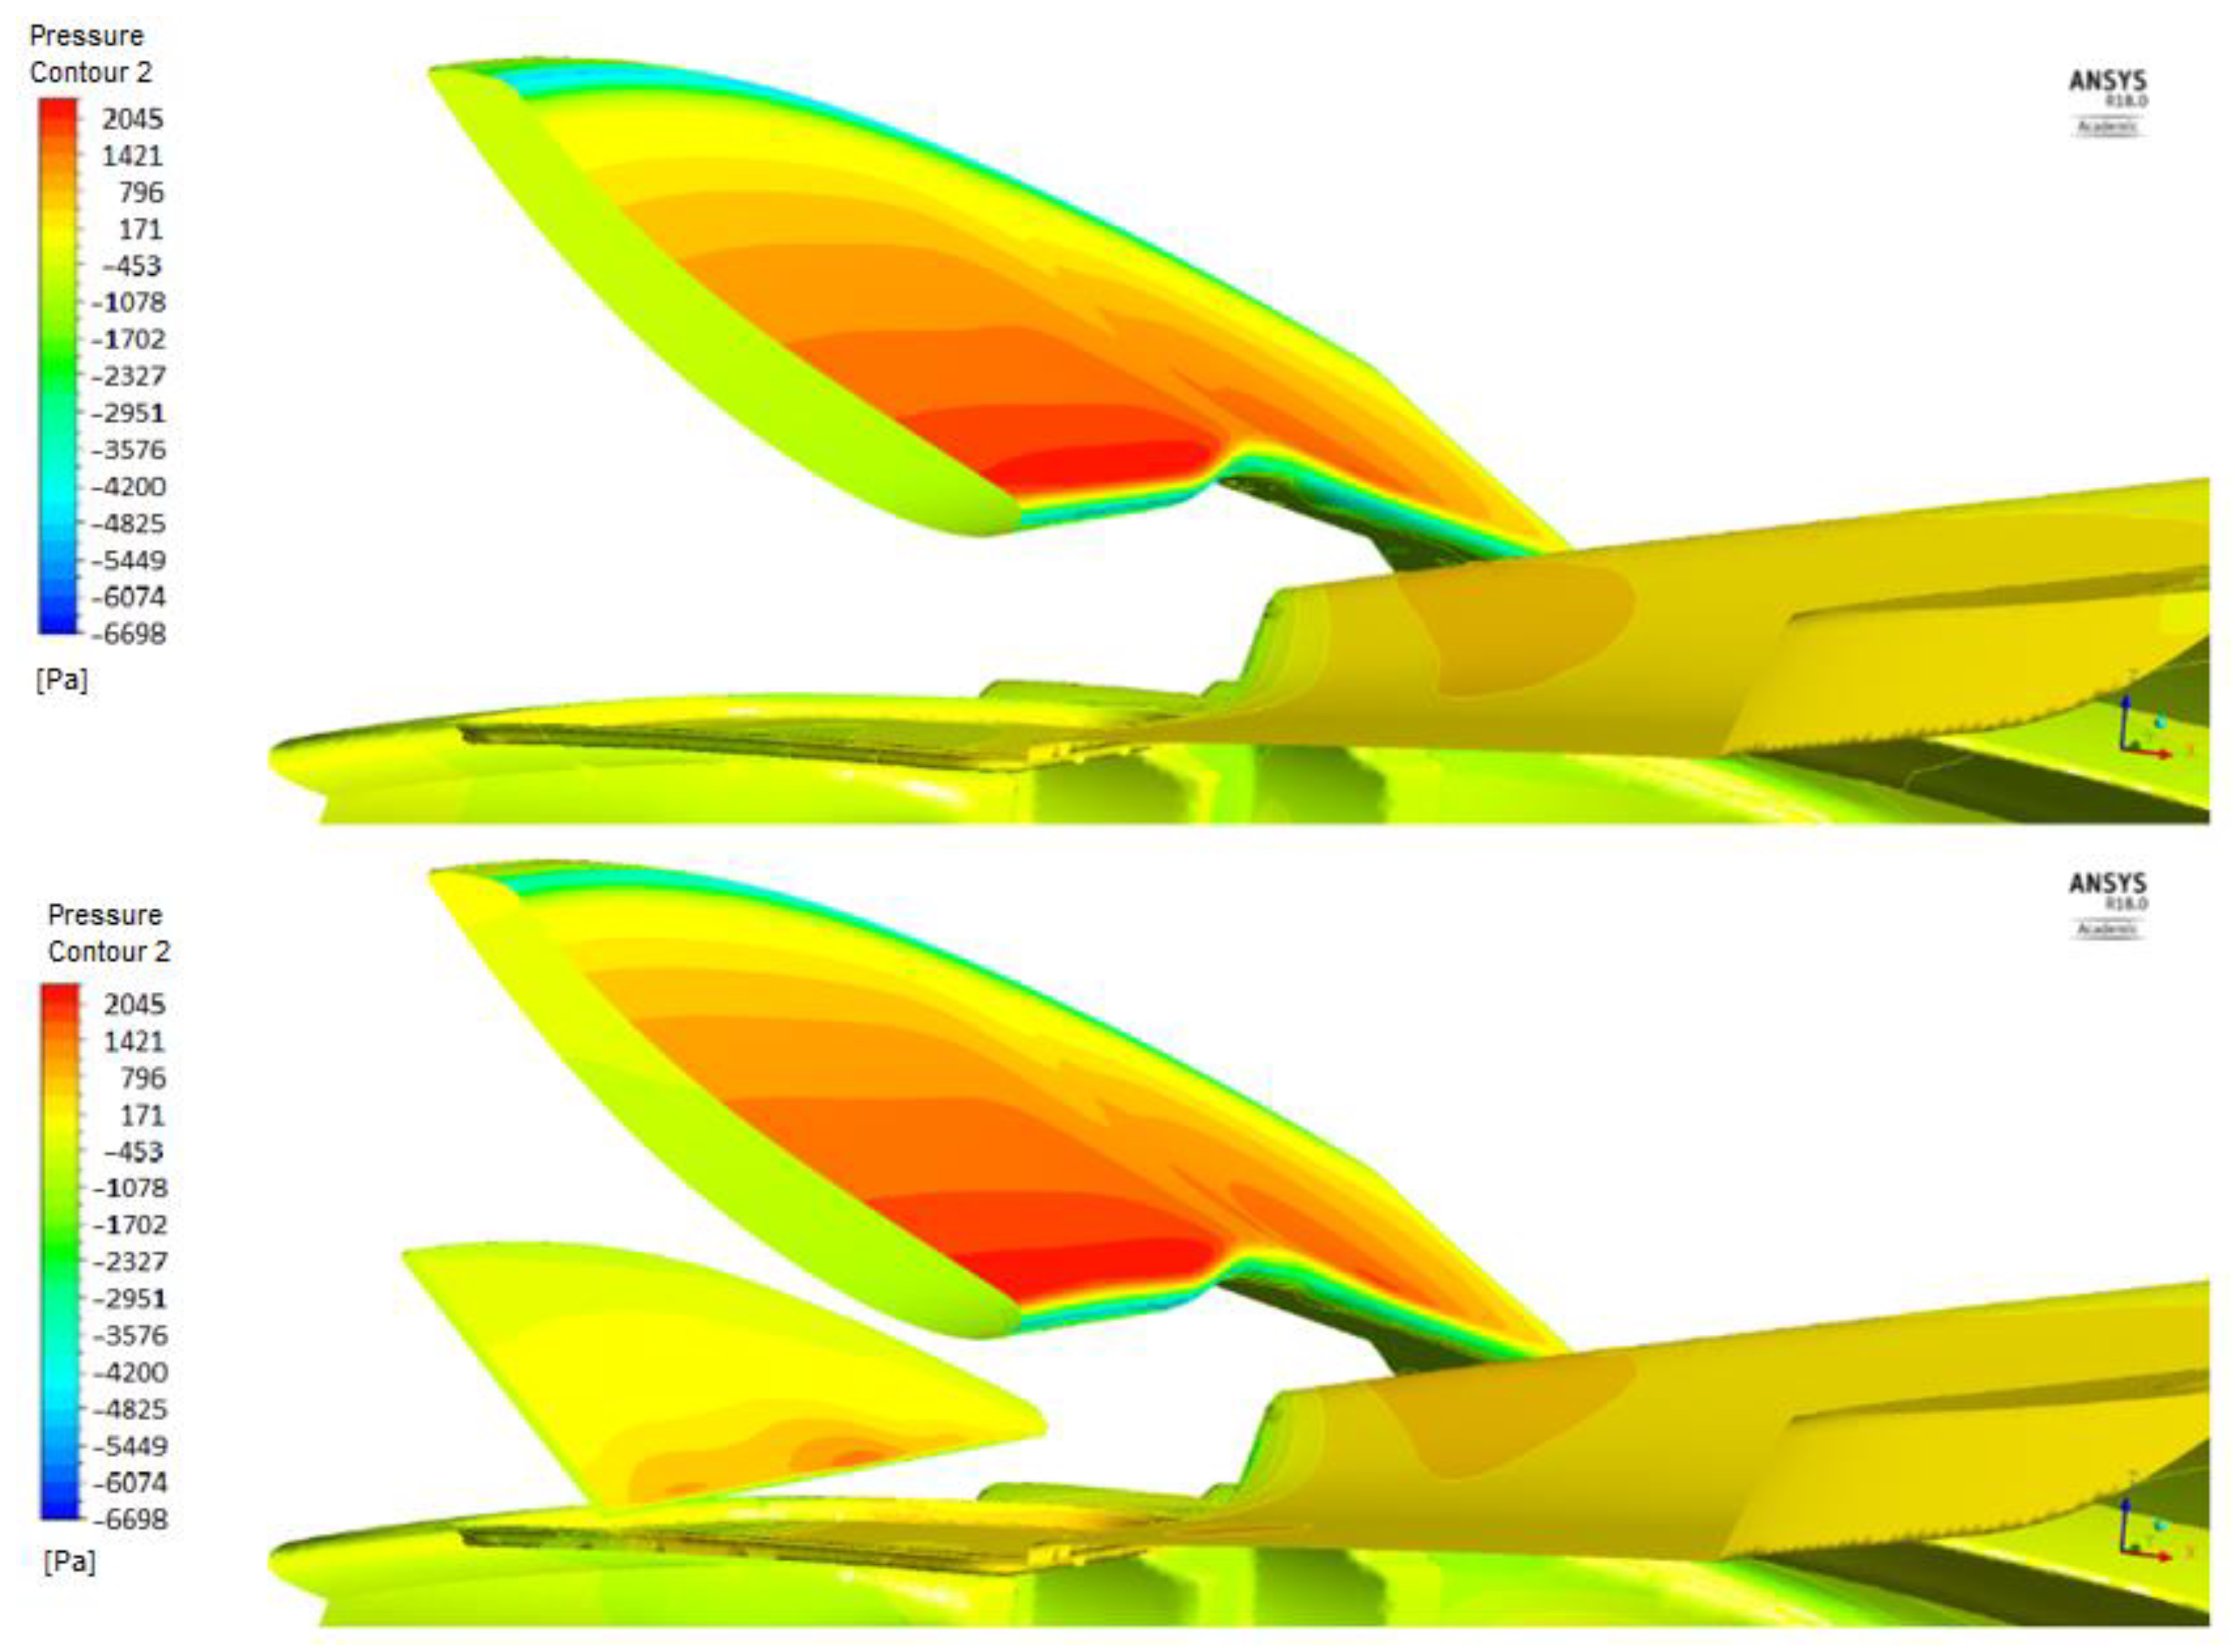
3.1.1. Additional Booster Plate for a Sports Car

In one version of the car, a section of the upper body was raised and rotated to act as a spoiler. Several versions of the booster plate were analyzed. One is presented in Figure 9. Figure 10 and Figure 11 show positions of the booster plate under the spoiler. In the plane of symmetry, the booster plate is less than 15 cm wide and is shaped to tuck under the laid spoiler (Figure 11). Aerodynamic characteristics of the car with the additional booster plate in the final variant are shown in Figure 12.
For each spoiler angle, the plate is also rotated so that flow is properly directed under the spoiler. Examples of spoiler and booster plate positions are presented in Figure 10.
The aerodynamic characteristics Cx and Cl of the car with the spoiler and with the additional booster plate as a function of the spoiler setting angle are shown in Figure 12.
In the diagrams (Figure 12), the angle specified as 10 degrees corresponds to the spoiler operation setting providing minimum aerodynamic drag, while the setting angle of 55 degrees corresponds to generating maximum aerodynamic drag during braking. The most remarkable differences occur for a 30 degree position angle, and for this case, the visualizations are shown. The maximum difference in downforce coefficients between the two cases is 0.14. From the graphs, it can also be read that a similar drag coefficient as for the pure spoiler during braking occurs for the spoiler with the booster plate at an angle of 20 degrees less (35 instead of 55 deg), giving at the same time a greater aerodynamic downforce.
Pressure distribution on the spoiler and booster plate are shown in Figure 13. Comparison of the flow structure (pressure and velocity distribution) is depicted in Figure 14.

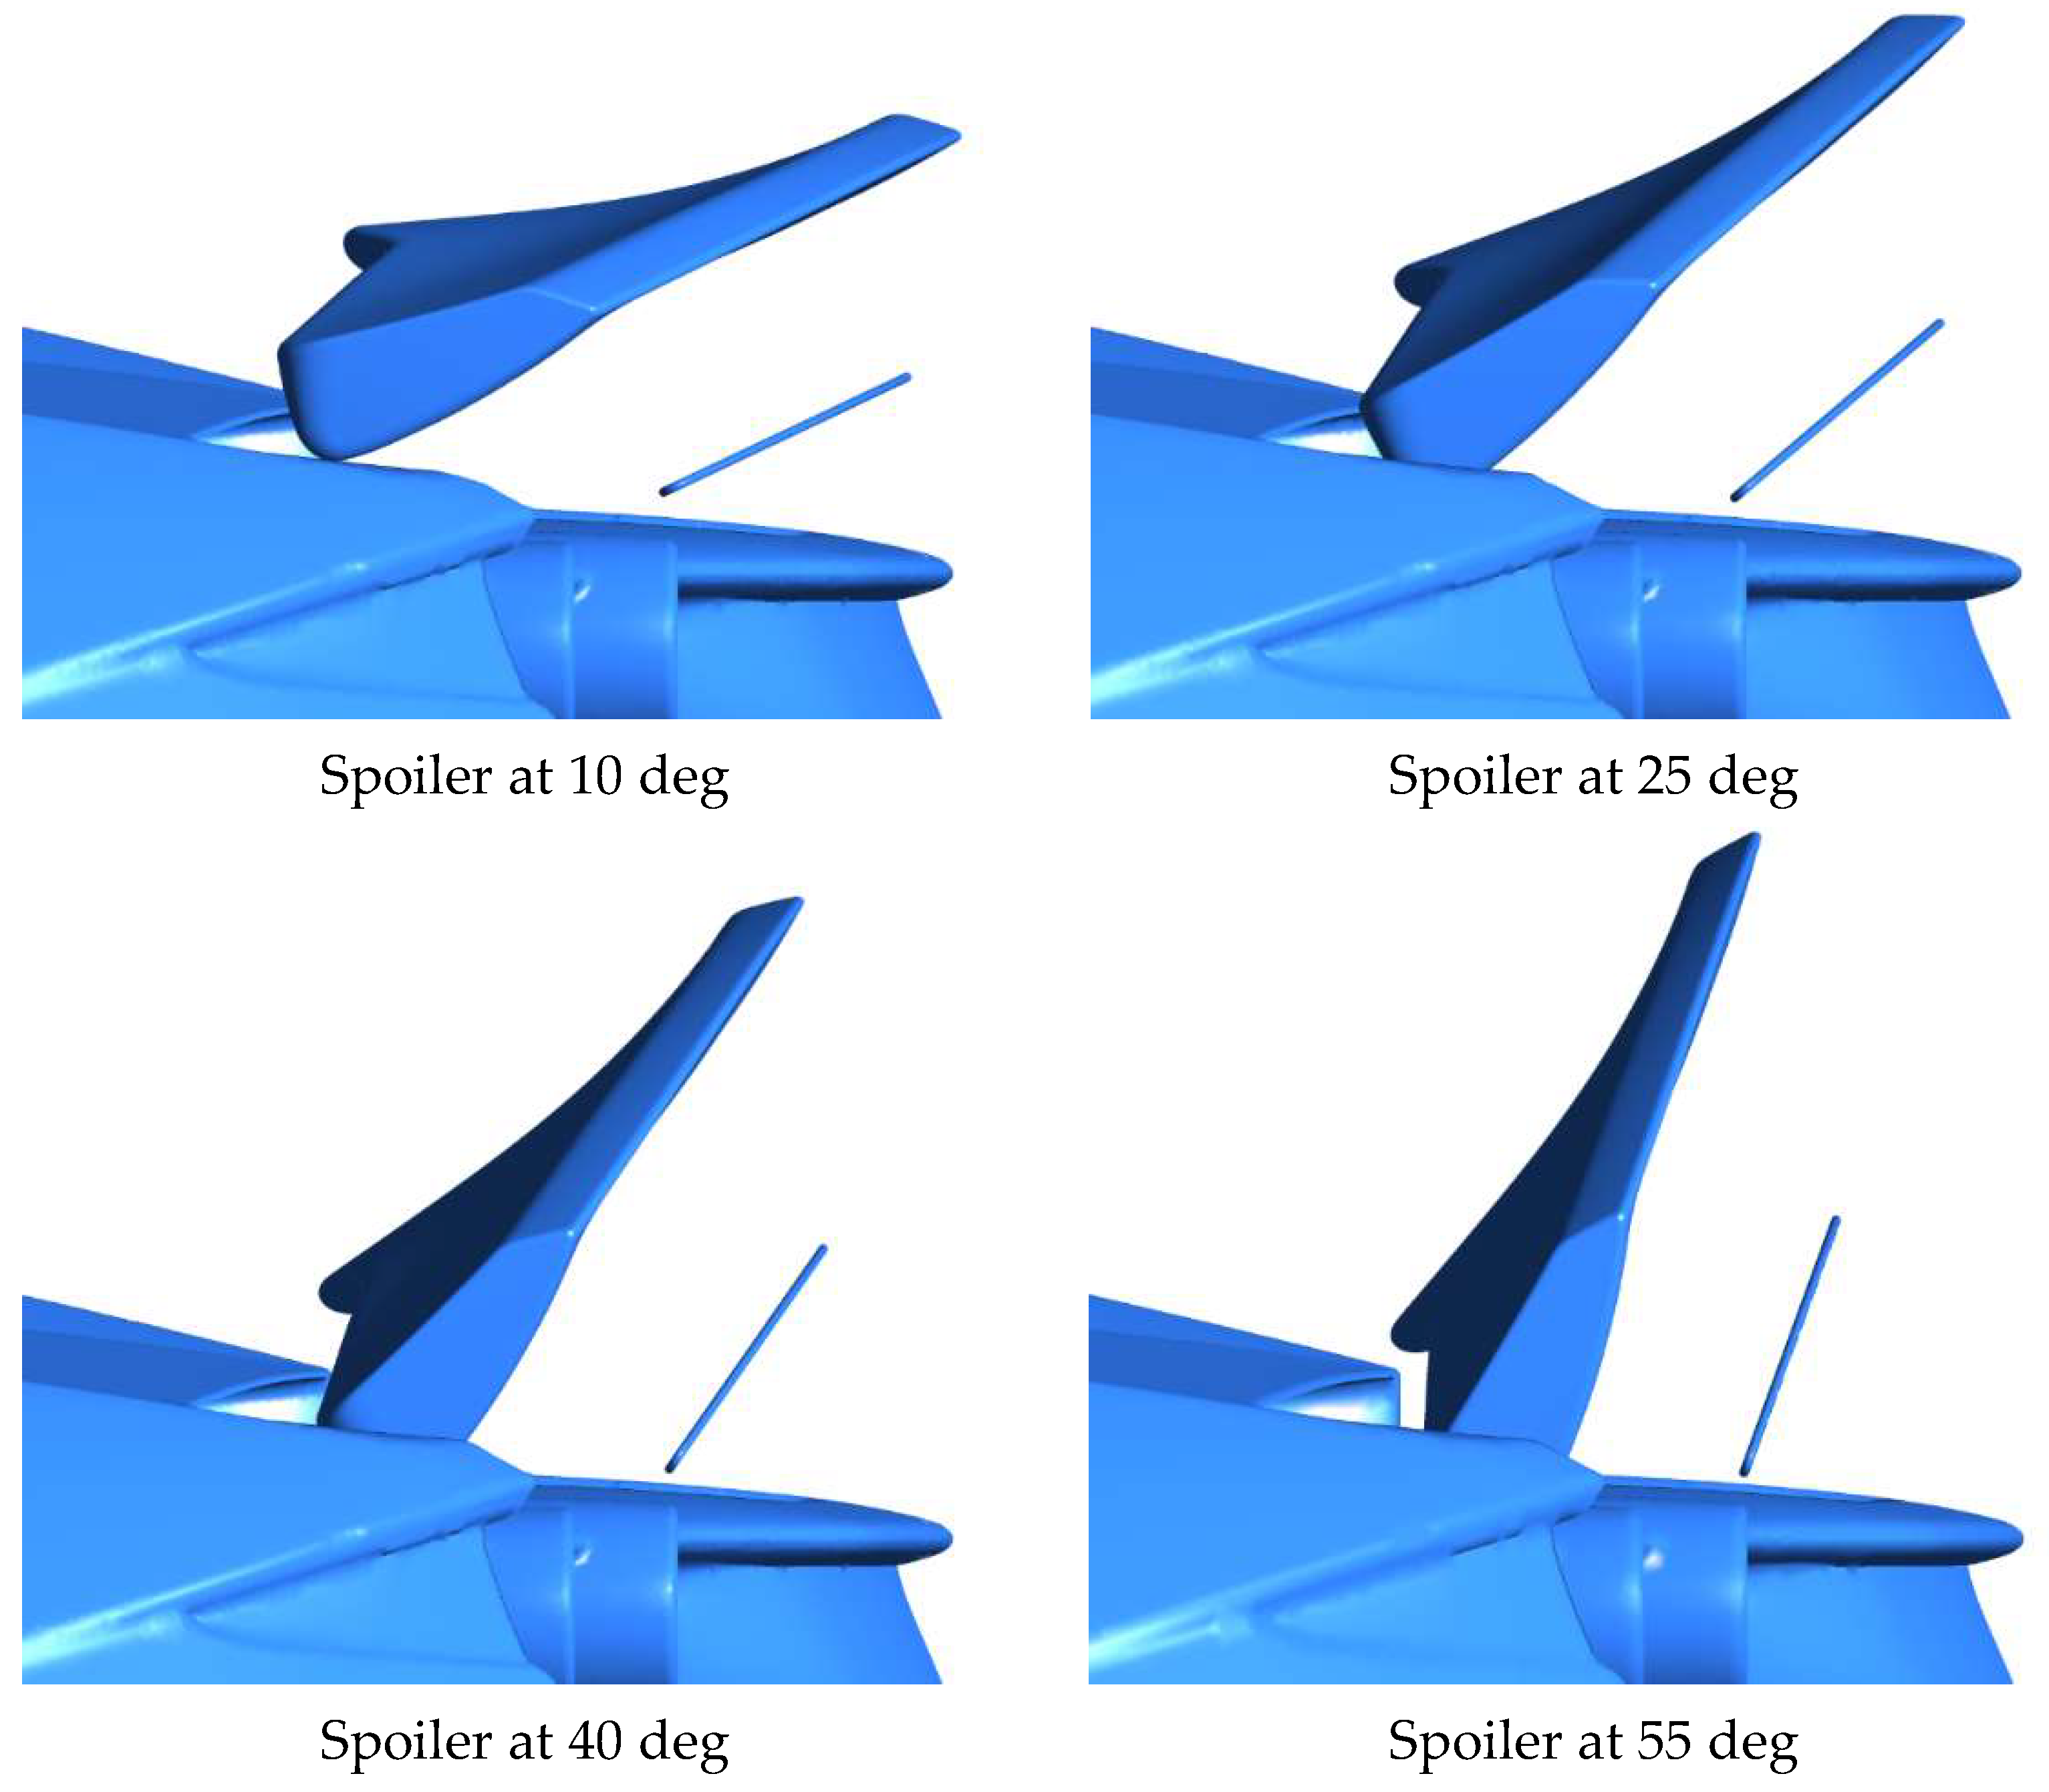
3.1.2. Spoiler with Pull-Out Gurney Flap, 3 cm High

The Gurney flap is considered a simple and effective solution for obtaining additional lift or downforce if the increase in aerodynamic drag of this solution can be accepted.
Figure 15 shows a rather unusual solution for such a flap.
Figure 16 shows the pressure and velocity distributions around the spoiler without the Gurney flap and with the flap extended when the spoiler is set at 10 degrees.
Extending the Gurney flap resulted in changes in lift coefficient from −0.300 to −0.490 and aerodynamic drag coefficient from 0.430 to 0.512. Pull-up Gurney flap gave comparable downforce gains to the spoiler-only configuration in the braking setup (55-degree spoiler angle) and slightly lower values than the maximum downforce for the spoiler version (45-degree spoiler angle). There was also a significant increase in aerodynamic drag.

3.1.3. Splitter

Another additional element analyzed was the splitter located under the front part of the car body. The geometry shown in Figure 2 was taken as the initial geometry, without the rear spoiler and front splitter (Figure 17), with neutral aerodynamic characteristics (Table 1).
Parameters presented in Table 1 represent coefficients of aerodynamic forces and moments (Cx—drag coefficient, Cy—side force coefficient, Cz—lift coefficient, Cmx—roll moment coefficient, Cmy—pitch moment coefficient, Cmz—yaw moment coefficient, Czf—front lift coefficient, and Czr—rear lift coefficient).
The small lift coefficient of the body is mainly due to the action of the diffusers under the rear part of the body. Due to the high sensitivity of the flow in the diffuser channels to changes in the body’s distance from the ground, optimization of the diffuser channels was not addressed.

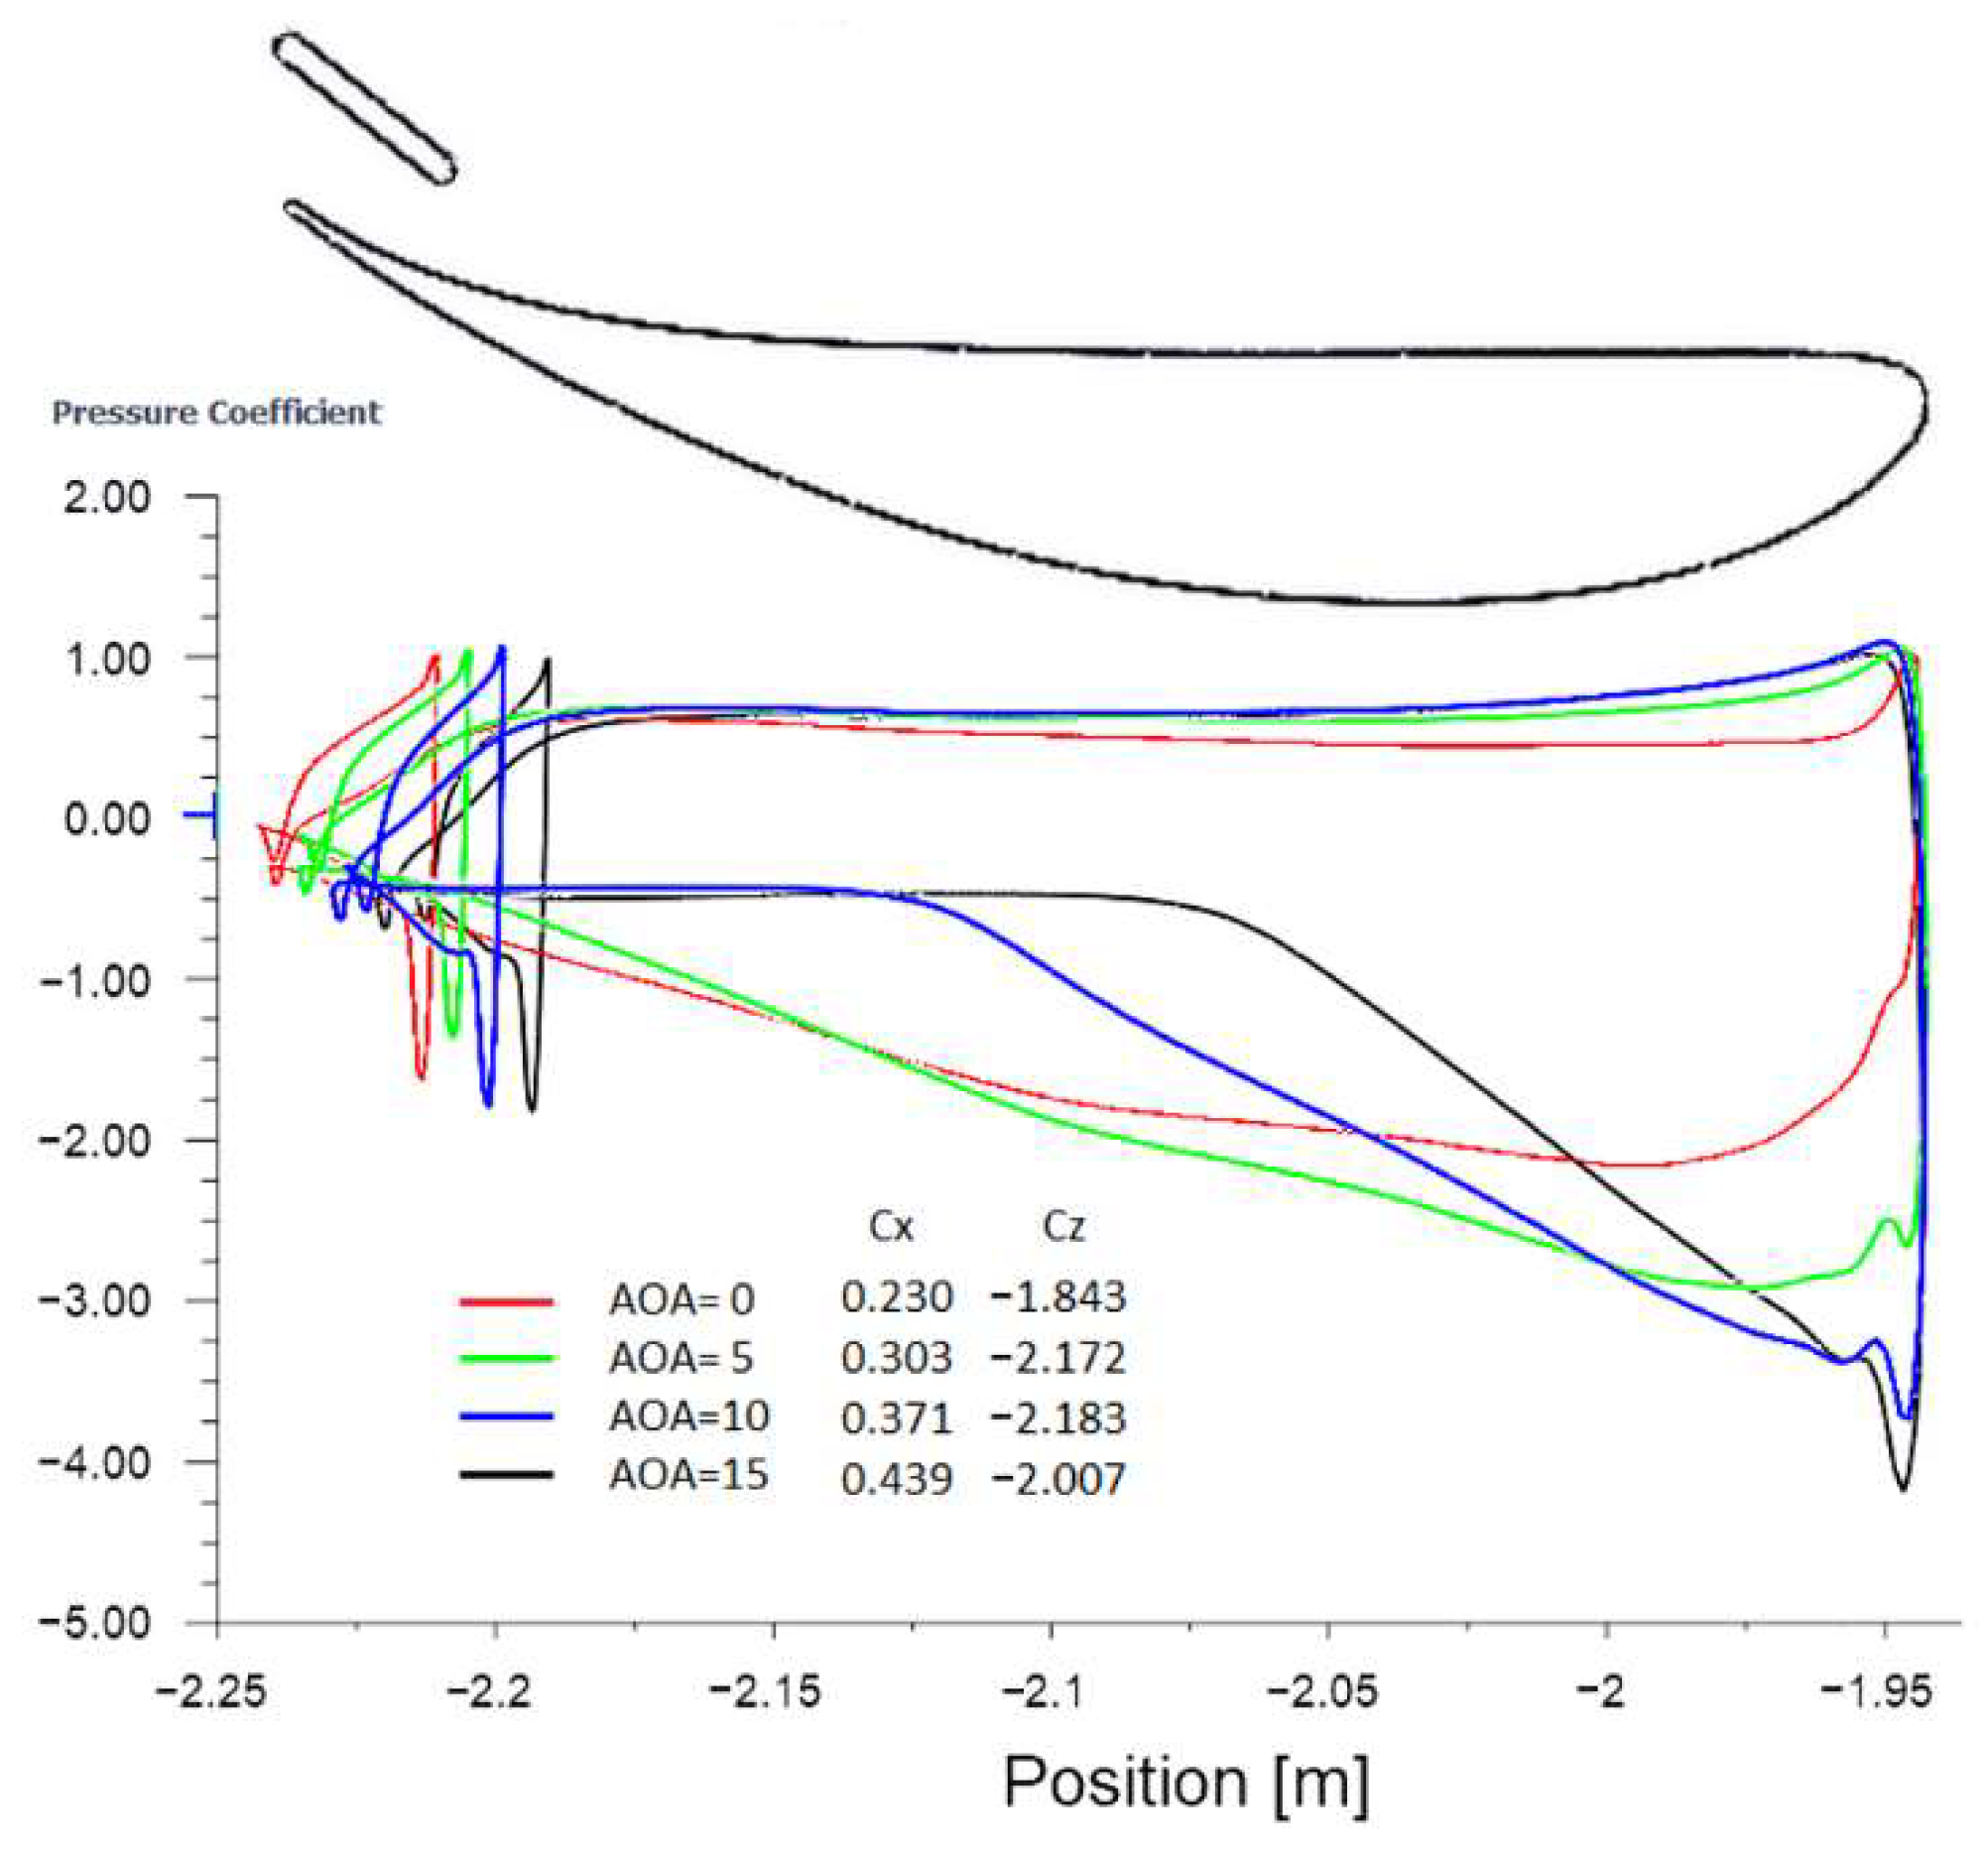
3.1.4. Separated Wing

Instead of the initially planned movable rear part of the body having more the character of a spoiler than a wing, during the numerical analysis was used a modified airfoil with an additional element above the end of the airfoil. The idea was to use a movable rotating Gurney flap with the axis of rotation in the middle of its chord. The goal was to minimize its moment of inertia, limiting its rotation rate.
Figure 18 shows the pressure distributions on the upper and lower surfaces of the airfoil for four angles of attack and the values of aerodynamic force coefficients -Cx (drag) and -Cz (lift) in the configuration with inactive Gurney flap.
Up to an angle of attack of 5 degrees, no flow detachment is observed. At angles of attack 10 and 15, there is a large flow detachment area on the airfoil’s underside.
Since the wing angles of attack up to 60 degrees were planned to occur in the aerodynamic braking configuration, it was necessary to find a means to improve the wing flow at larger attack angles.

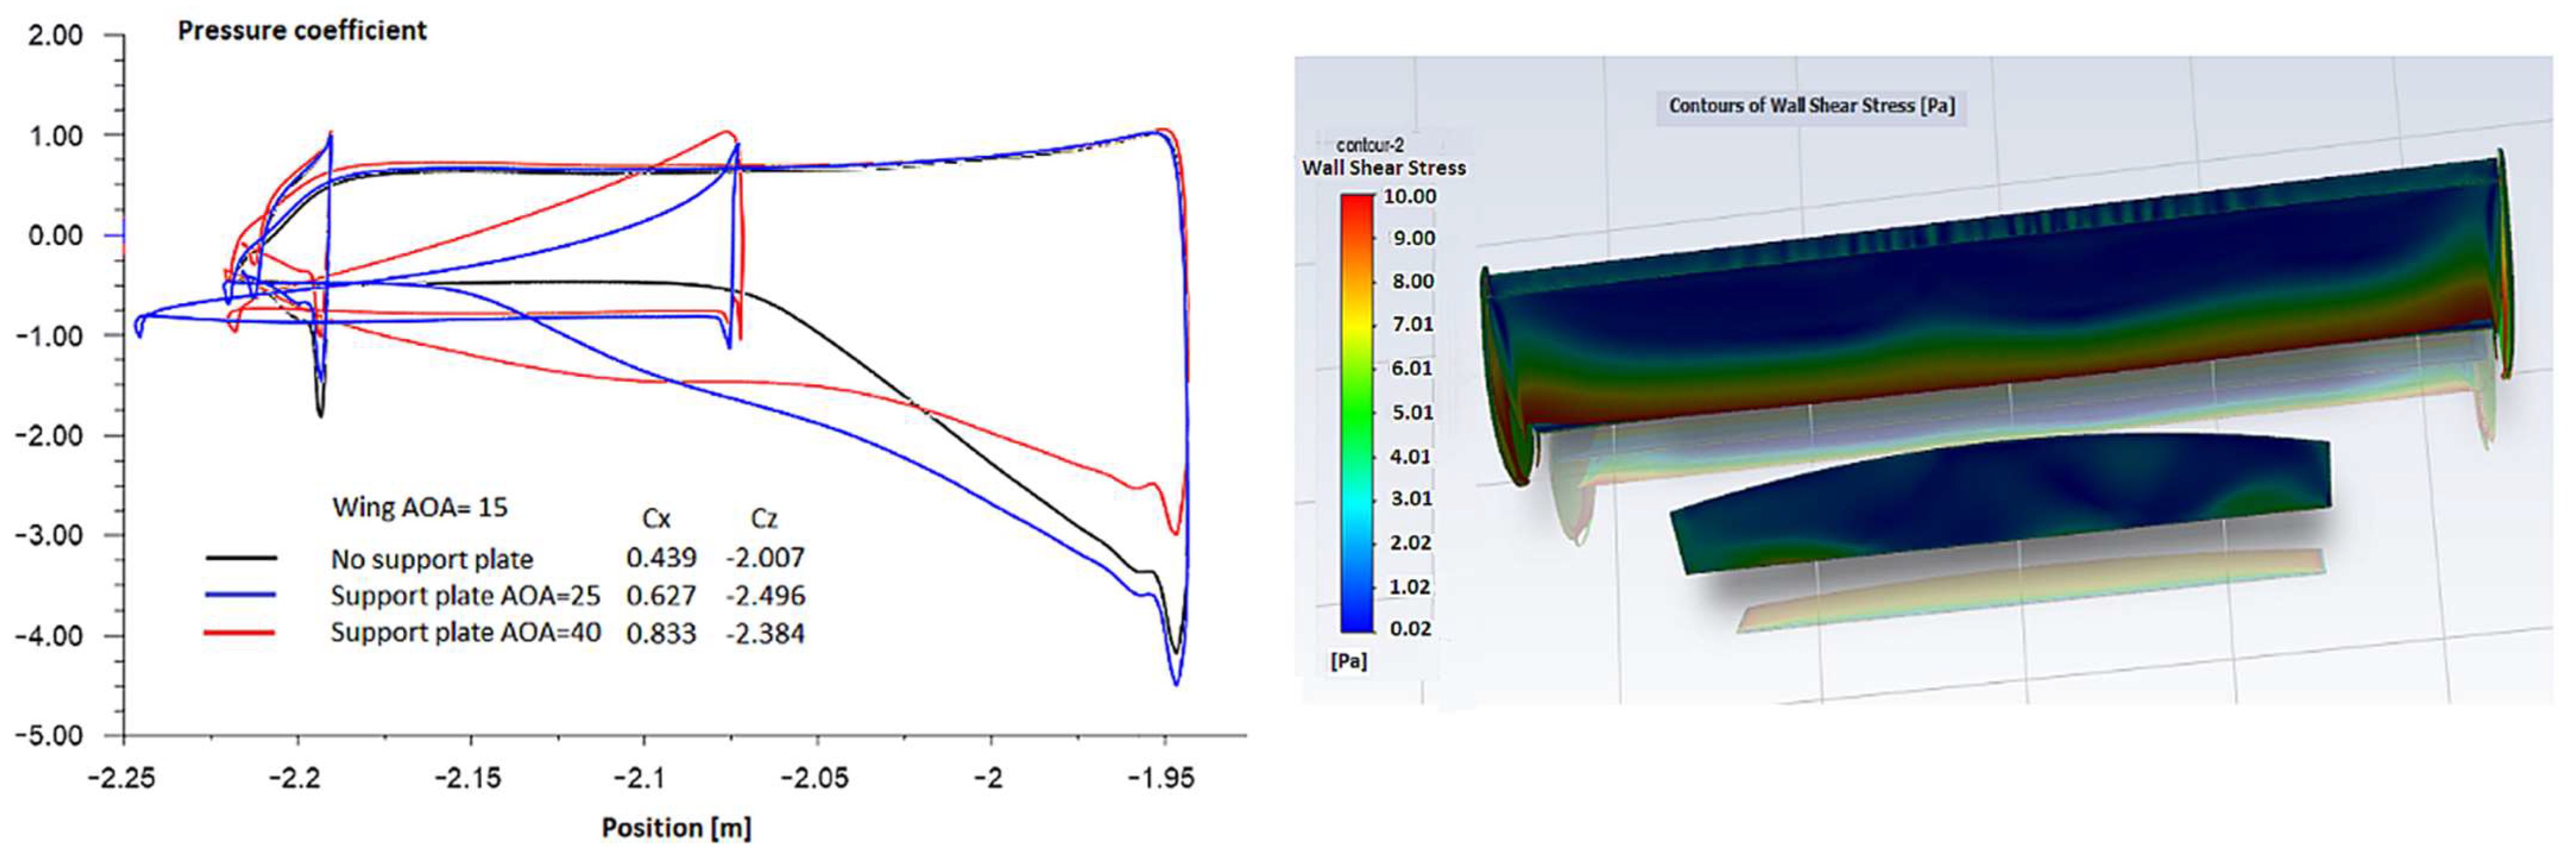
3.1.5. Separate Wing with Supporting Plate

A booster plate studied earlier was used to improve wing aerodynamic characteristics at higher angle of attack (AOA).
Figure 19 shows the pressure distributions on the upper and lower surfaces of the wing, the inactive Gurney flap and the booster plate at a wing angle of attack of 15 degrees. The figure also includes the aerodynamic drag coefficients, Cx, and lift force, Cz, values and the visualization of the pressure on the wing’s bottom surface and supporting plate. At the angle of attack of 15 degrees, the influence of the booster plate is visible. Setting it at 25 degrees shortens the flow separation area on the underside of the profile by two times, and at 40 degrees, there is no flow separation at all.
Of course, both elements will behave a bit differently in the vicinity of the car body.

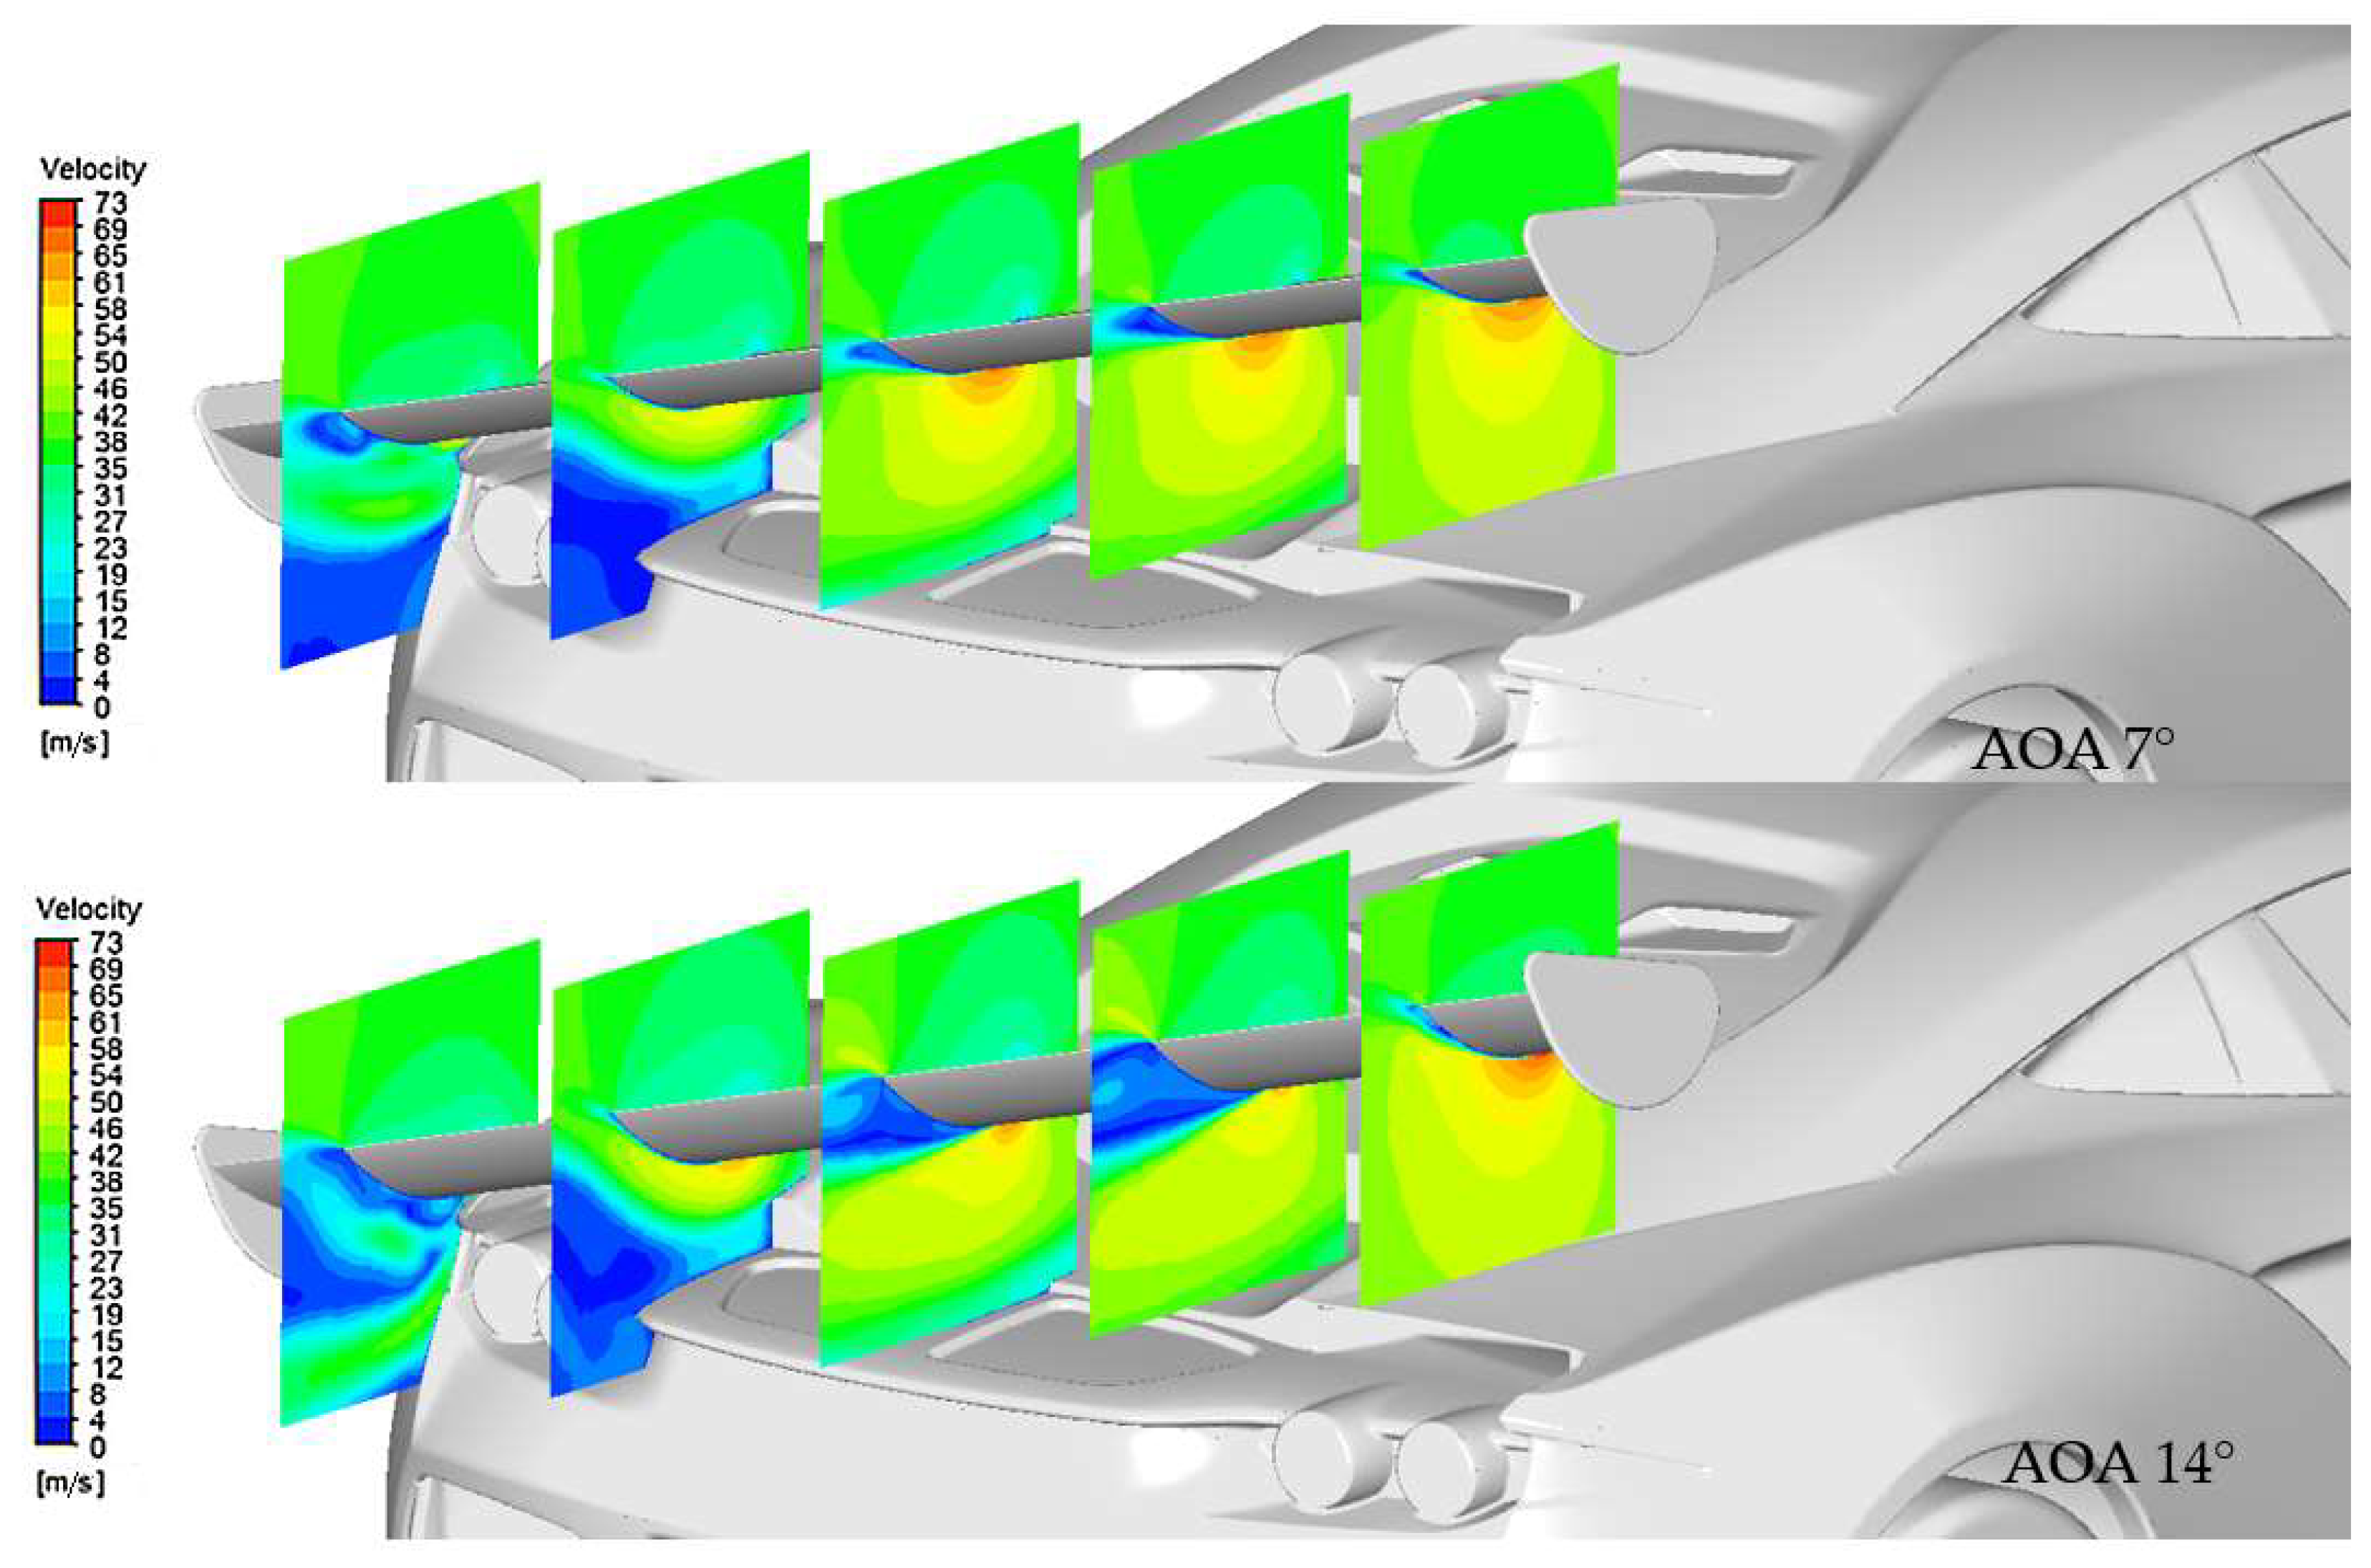
3.1.6. Wing Tilted to One Side

The behavior of components designed to generate lateral force was also analyzed. The component that was analyzed for its ability to generate lateral force was the rear wing. The wing was tilted to the side to generate downforce and lateral force. Numerical calculations showed that this was an effective method of generating lateral force, given the selection of an appropriate wing angle of attack. The effectiveness of the inclined wing will be greatly influenced by its angle of attack and profile characteristics.
When the pressure contours are considered, there is a negative effect of bringing the wing closer to the body—a decrease in vacuum values on the underside of the wing, especially compared to the upward part of the wing.
Table 2 shows the figures of forces and coefficients obtained at 30 m/s.
Figure 20 shows the pressure distributions on all surfaces of the car. For comparison purposes, a mirror image of the right side of the car is shown to represent the pressure distribution on the underside of the wing.
Figure 21 shows a comparison of the calculation results for two wing attack angles (7 and 14 degrees), while maintaining the same wing roll angle (15 degrees).
From the velocity contours shown on a number of longitudinal cross sections across the wing, it can be observed that for an angle of attack of 7 degrees the flow holds well to the wing, with a zone of detachment observable on the two middle cross sections, and a clear flow disturbance caused by the proximity of the body to the wing tip leaning over the trunk. At an angle of attack of 14 degrees, there is a very large detachment on the same two middle sections. The flow on the wing is strongly three-dimensional. As a result, the lateral forces are less than for a 7-degree angle of attack, and the downforce is slightly higher, with very comparable values.
Given the way the slanted airfoil is located, it is possible to increase its efficiency by taking advantage of its interaction with the body, e.g., by introducing additional flow deflection elements.
Table 3 contains numerical data of forces and coefficients obtained at velocity 30 m/s.

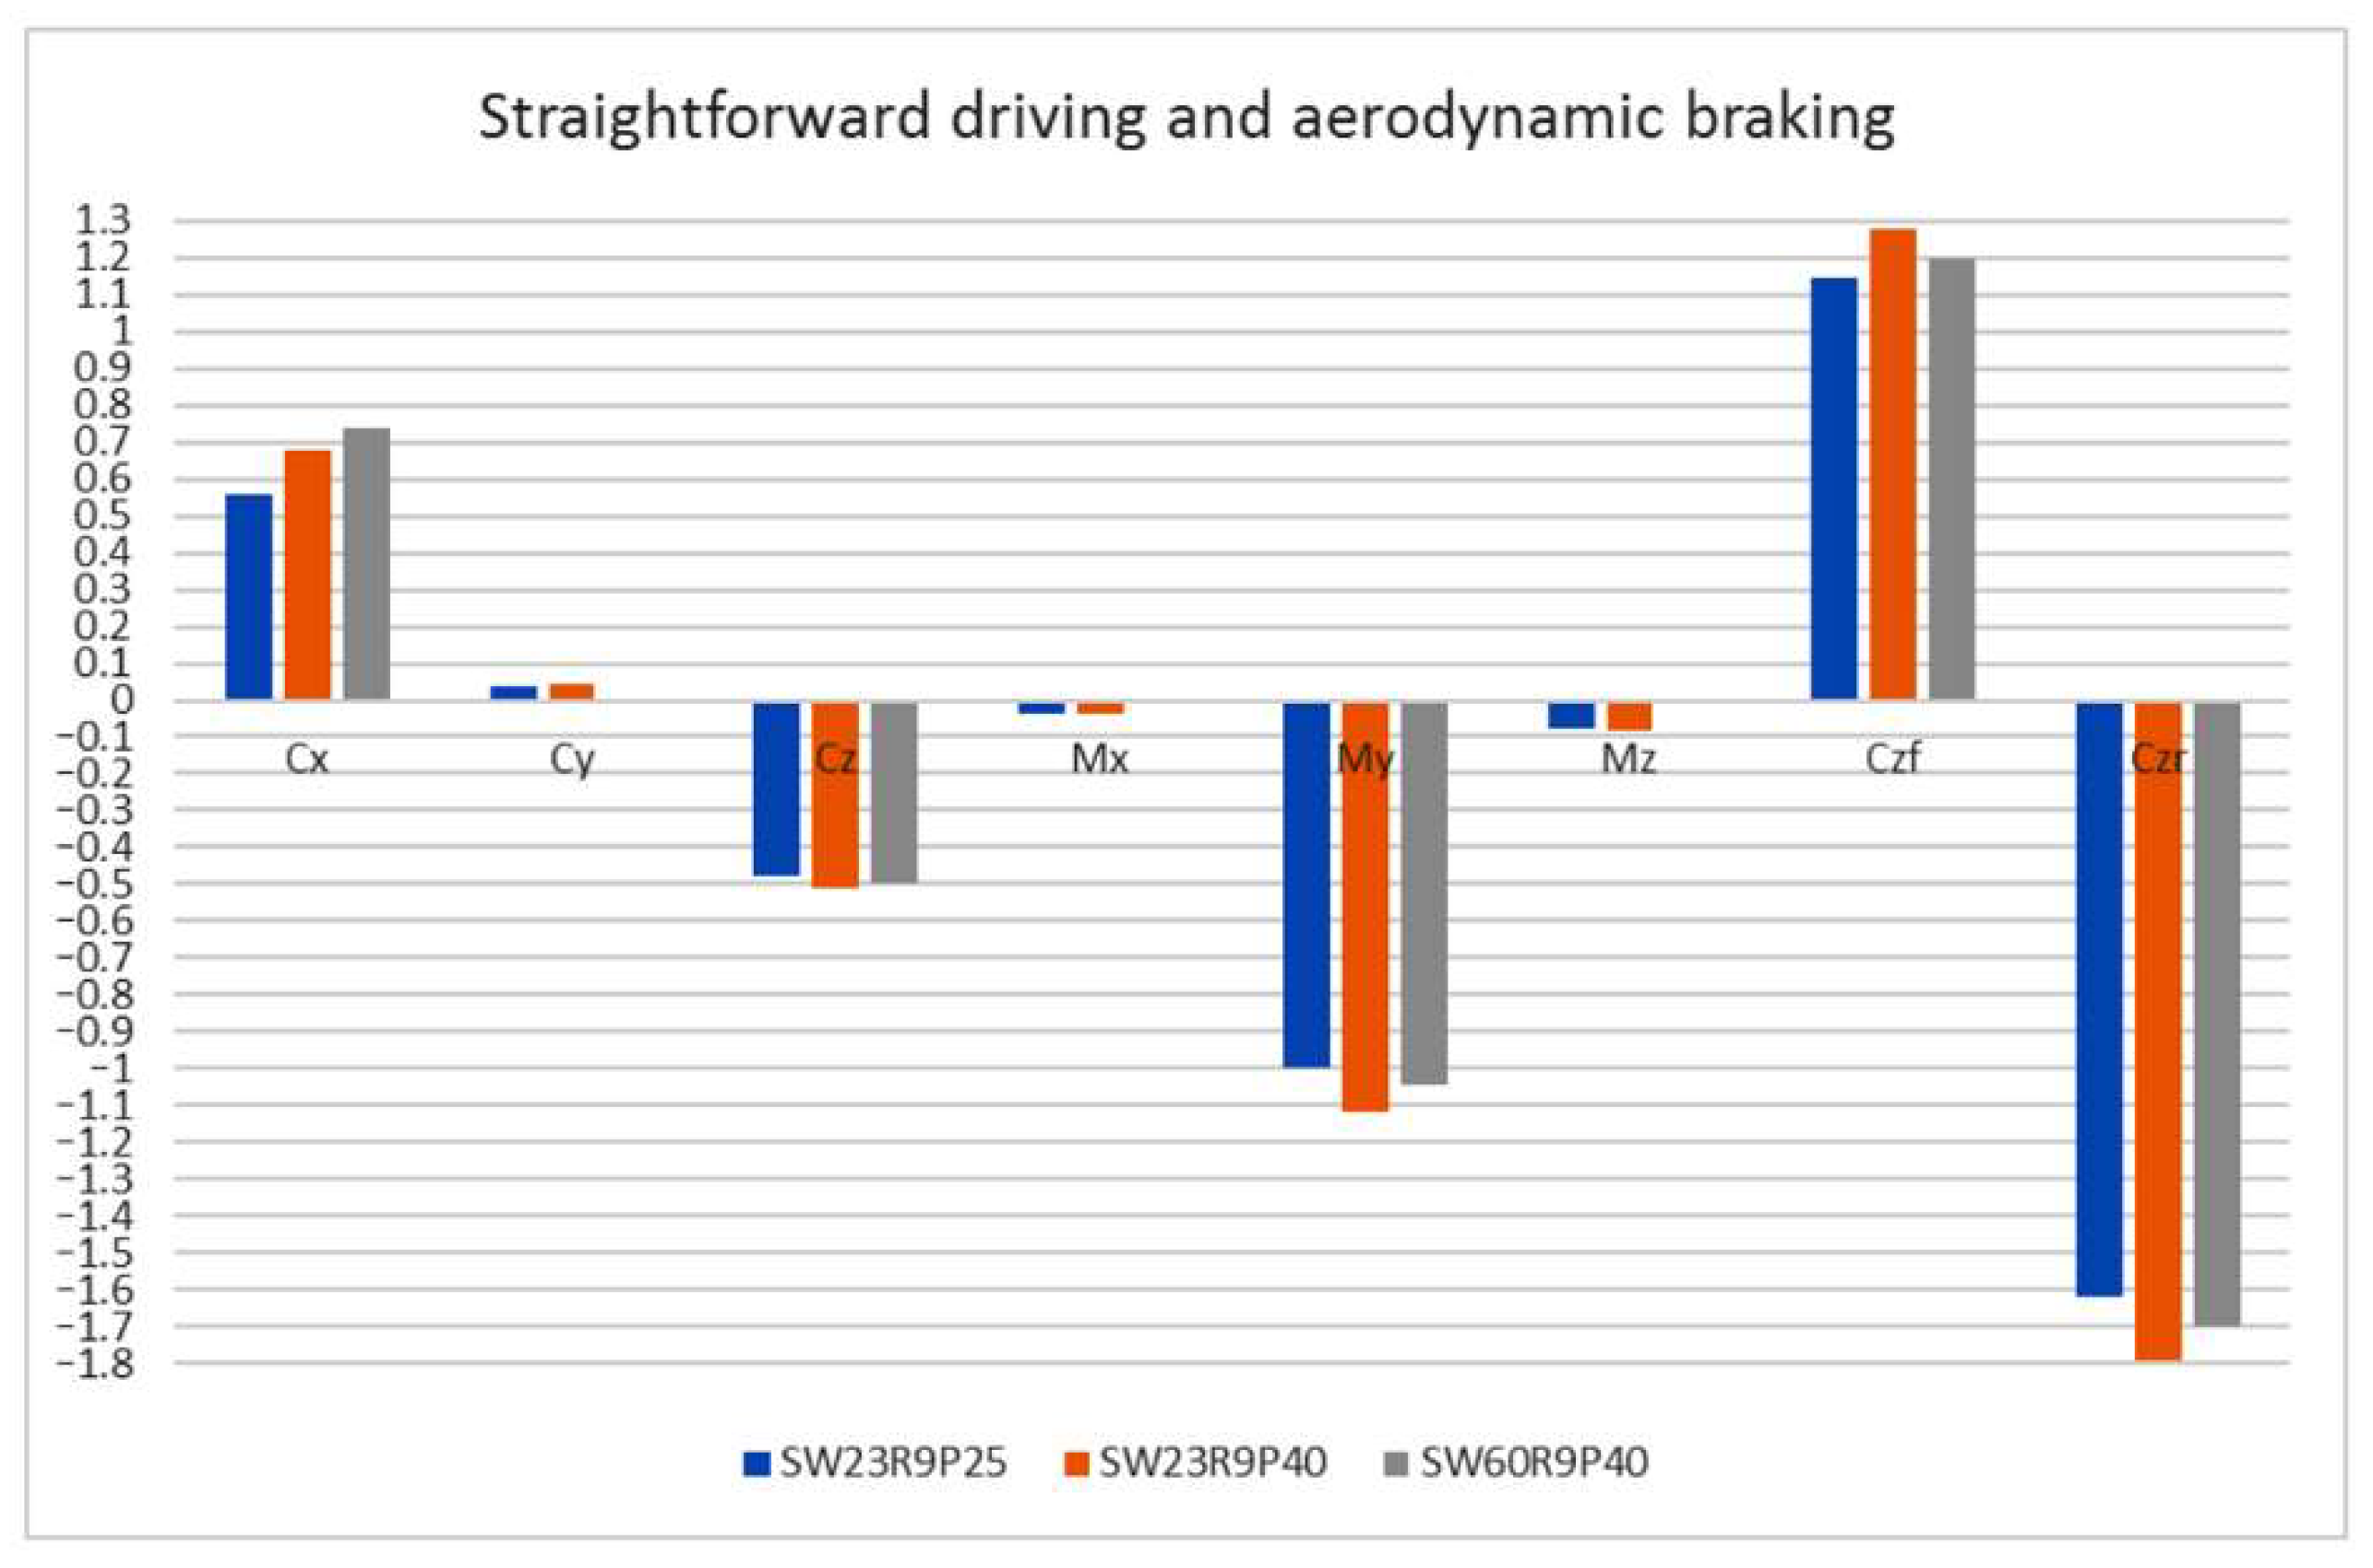
3.1.7. Straightforward Driving and Aerodynamic Braking

The movable wing, even in the 9-degree twisted position, can be rotated 60 degrees for use in aerodynamic braking. Figure 22 shows the pressure distributions on the car surface and the surface dimensionless parameter Q = 0.1 in the braking wing configuration.
Figure 23 shows the pressure distribution on the car without splitter and at different angles of attack of the wing. It can be seen that there are significant changes in the pressure values on the surface of the car in front of the wing.
Analyzing the pressure distribution lines one can see a change in the mode of action of the inverted wing with increasing its angle of attack. At a small angle of attack the wing, itself, generates the aerodynamic downforce, having only a slight effect on pressure distribution on the vehicle body. For a very large angle of attack, the downforce generated by the airfoil itself is much smaller, while a large area of increased pressure appears on the body in front of the airfoil, causing the downforce to be generated by the body. In the braking position, the wing, itself, generates little downforce, but this is compensated by increased pressure over a considerable area in front of the wing.
Additionally shown in Figure 24 are the aerodynamic force coefficient values for the three configurations of a side-tilted wing with a booster plate.

3.1.8. Moving Wheels
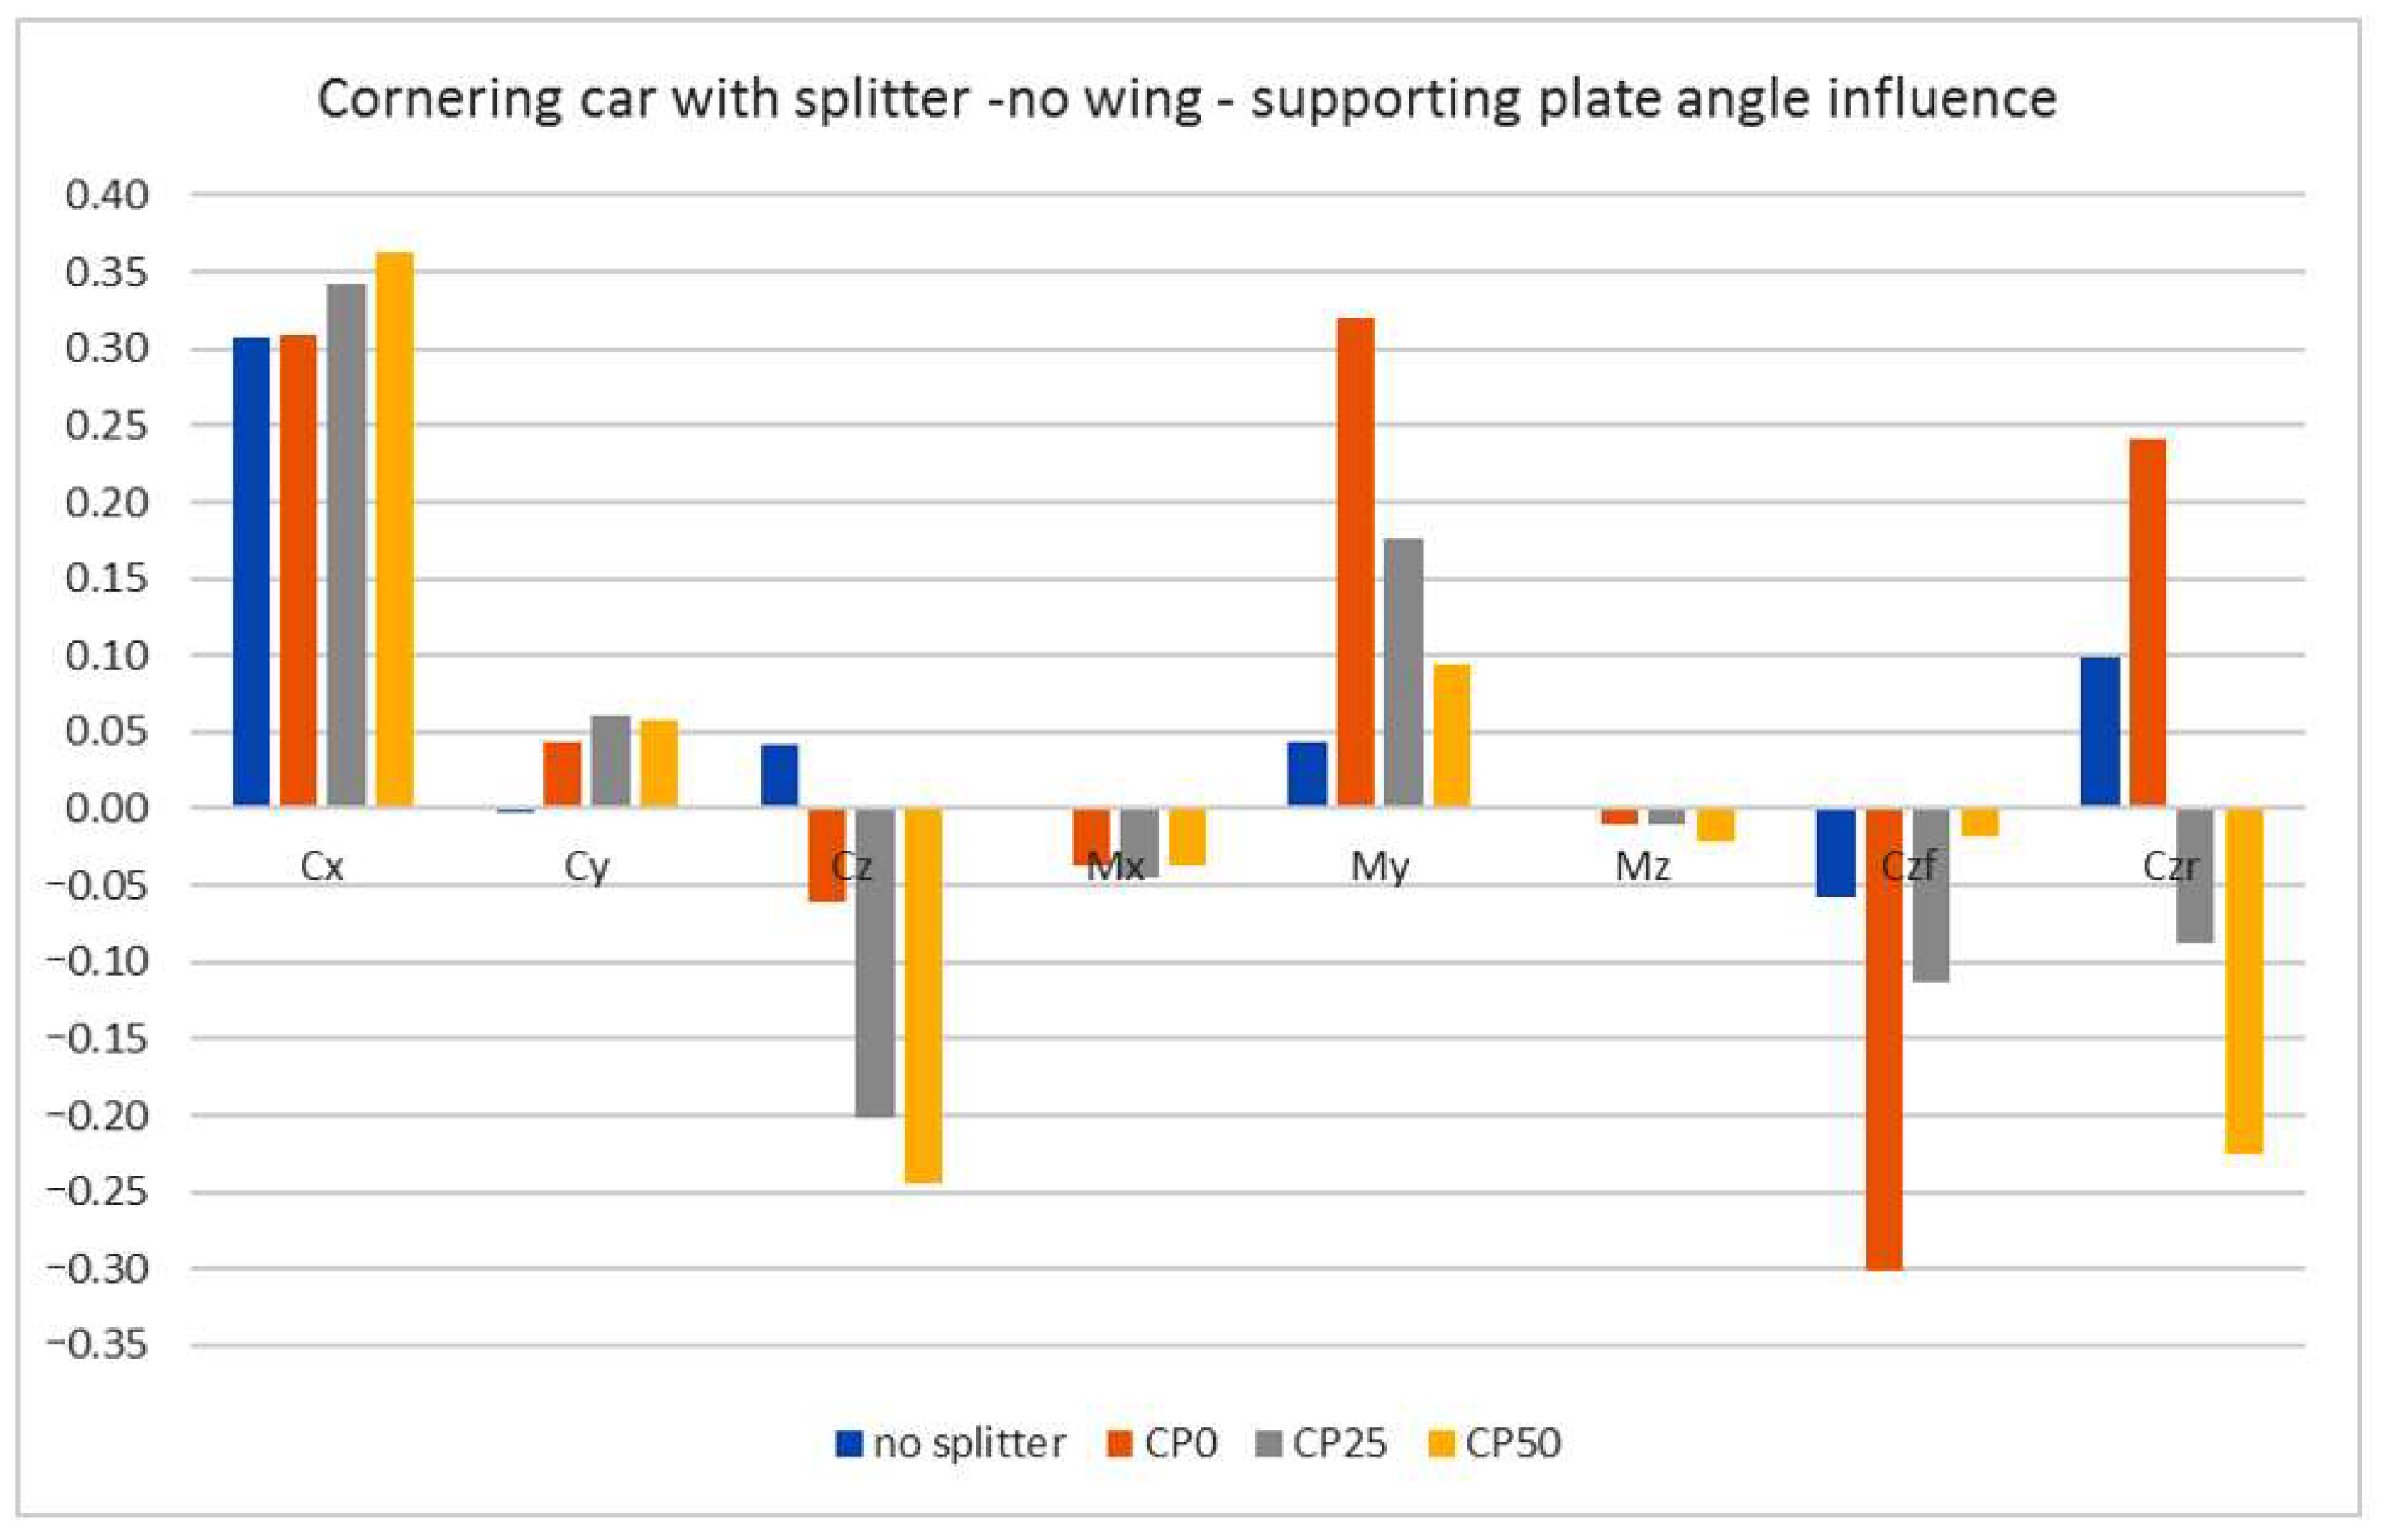
The effect of modeling moving wheels at higher values of aerodynamic downforce was checked. The rotation of the wheels was modeled by giving their surfaces velocity values derived from their rotational speeds. The rear wheels have a slightly larger diameter than the front wheels. The Table 4 shows the coefficient values obtained for the car in the following configuration: splitter, wing angle of attack 23 degrees, Gurney flap inactive, booster plate inclined at 40 degrees.
Similar analyses can be found in the work of Watanebe et al. [31]. They analyzed the impact of modeling wheel rotation on car aerodynamic characteristics.

3.2. Cornering Car

The MRF method discussed earlier was used to model the passage of a car on a curved road. Most of the simulations were conducted at a speed of 40 m/s on a curve with a radius of 90 m. The choice of these parameters was related to the planned road tests.
A few simulations of straight runs were also performed to compare them with curved runs.

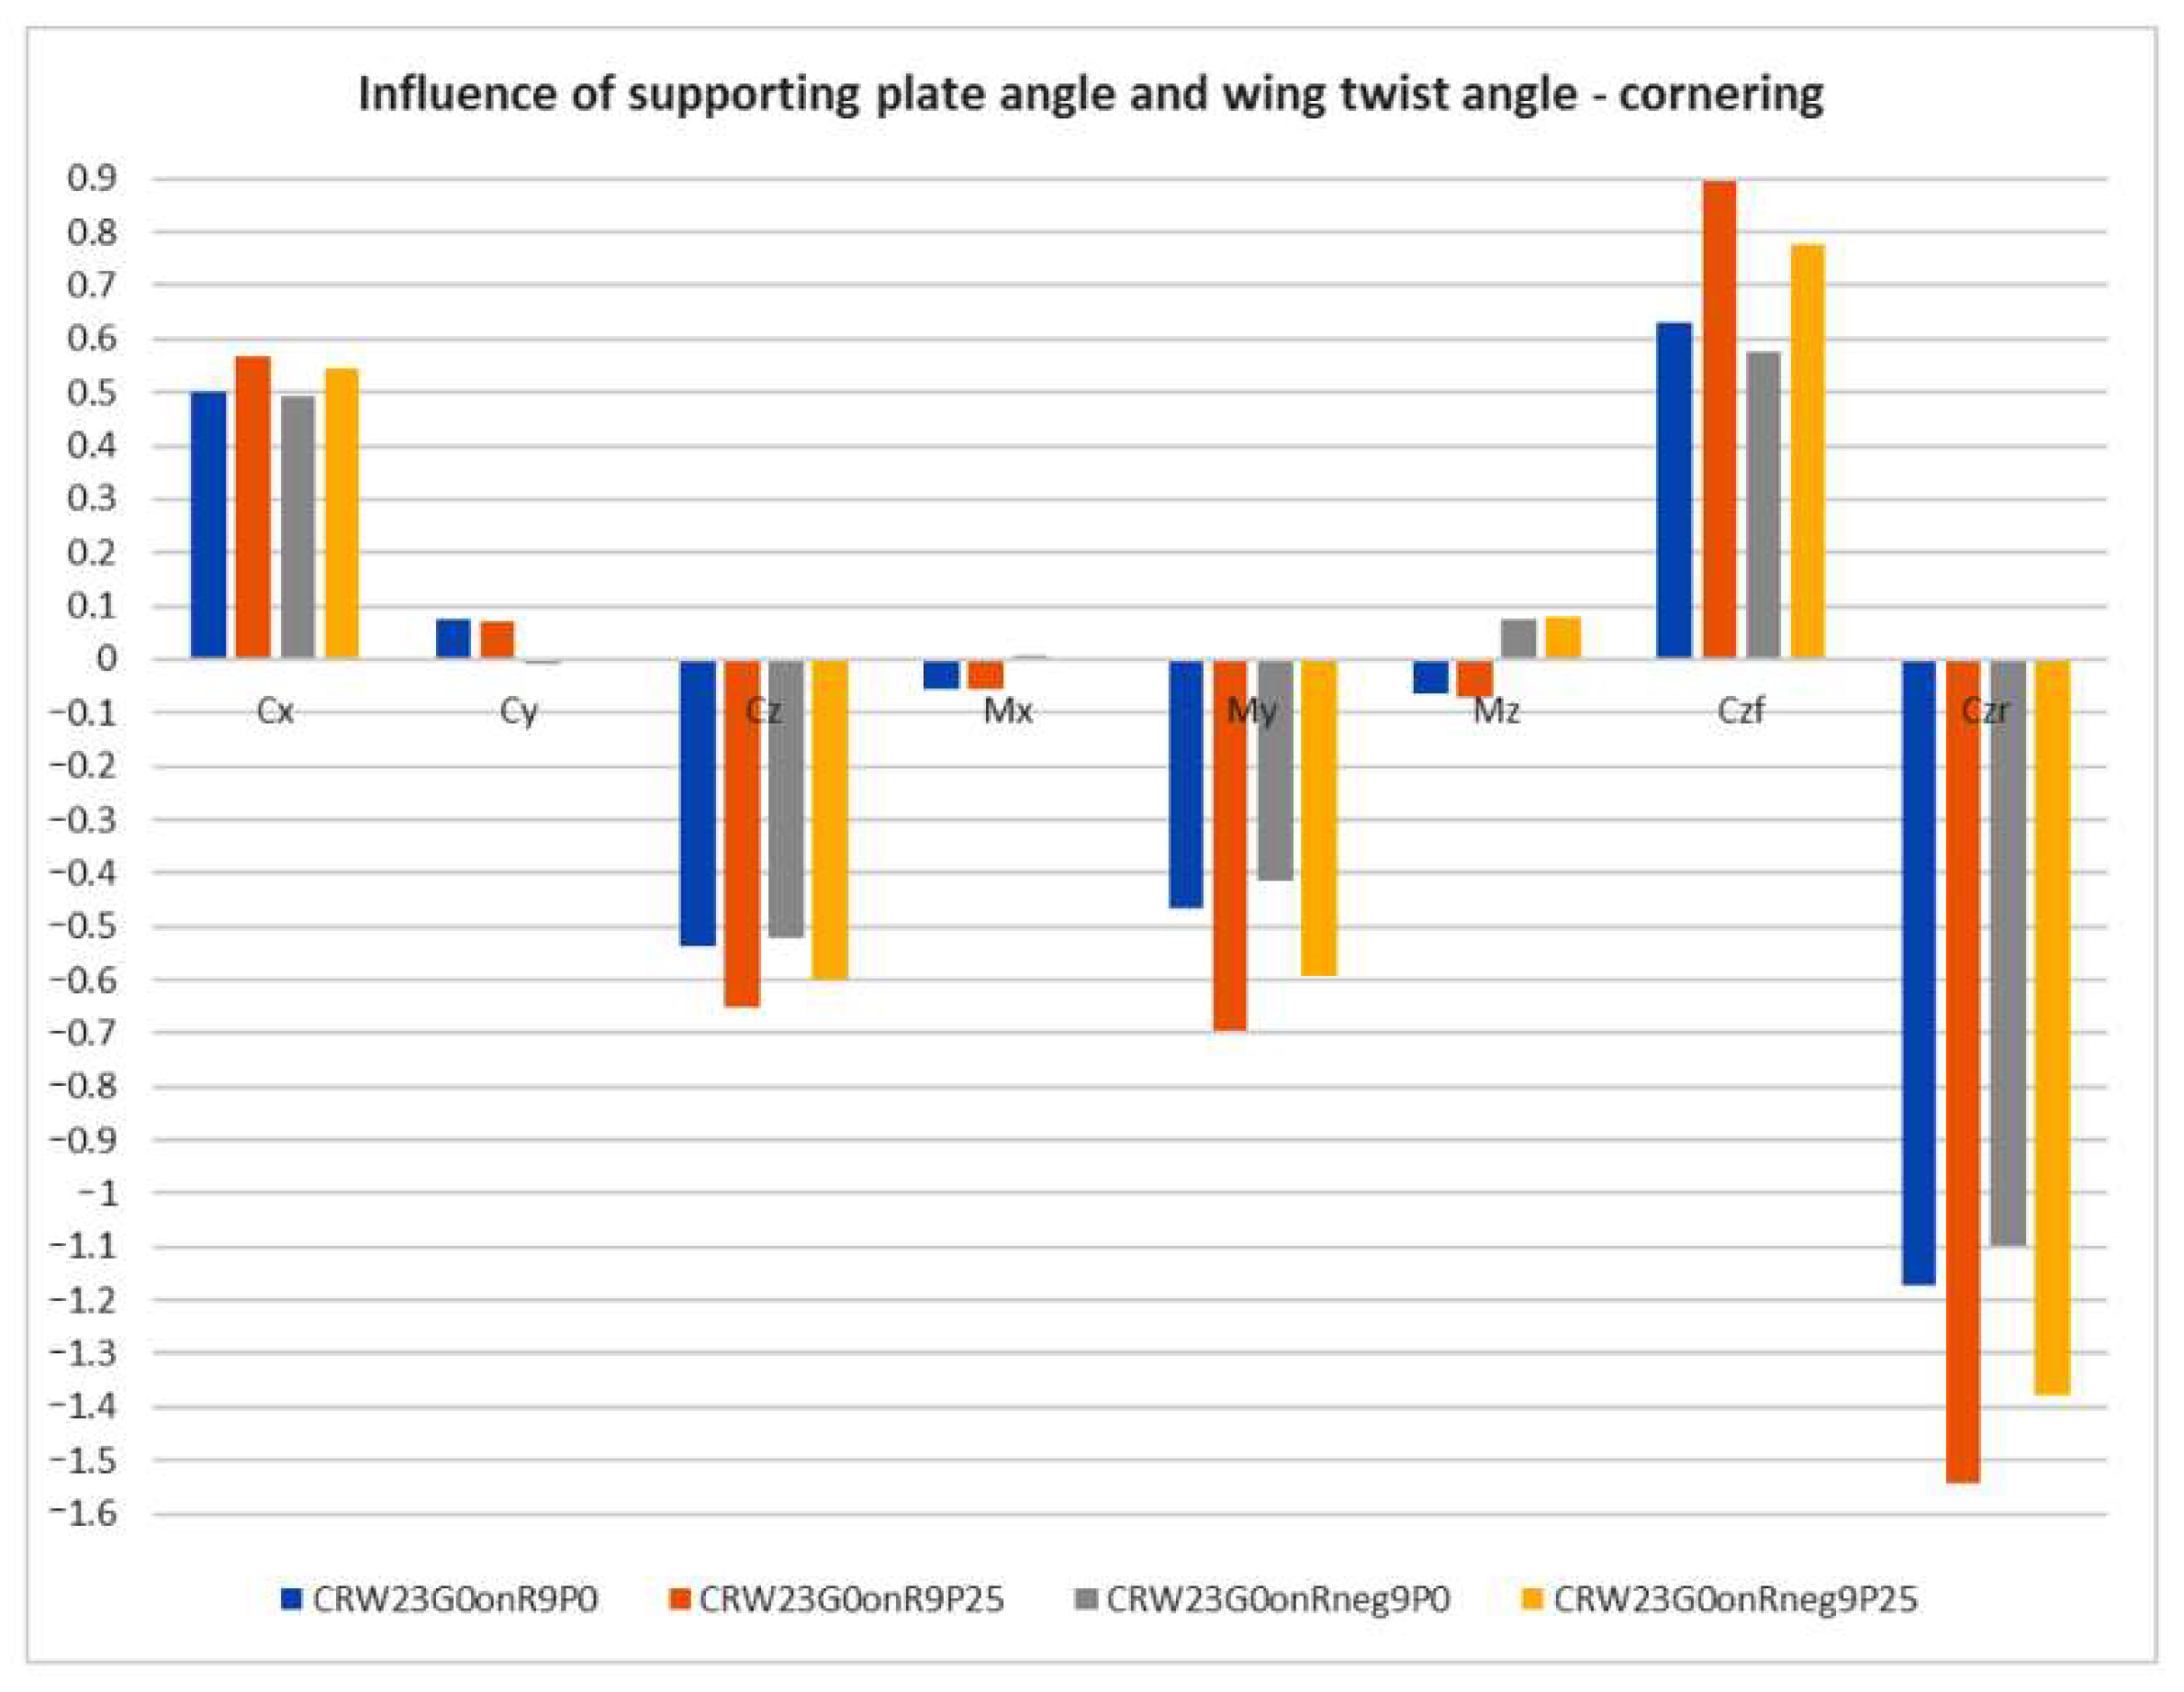
3.2.1. Cornering Car with Booster Plate Only

The first simulations were performed for the basic prototype version (no wings and no manifold). The booster plate is a relatively small component that can rapidly change its pitch angle. After placing it on the car model, its effect on the aerodynamic characteristics of the vehicle without wing was analyzed. Figure 25 shows the values of Cx, Cy, Cz, Mx, My, Mz, Czf, and Czr for four configurations:
  • Body without manifold;
  • Body with distributor and booster plate at 0 angle;
  • Body with distributor and booster plate at an angle of 25;
  • Body with distributor and booster plate at an angle of 50.
The use of the splitter significantly increased the aerodynamic body downforce, a slight increase in lateral force and body righting moment. An increase in the angle of the booster flap significantly changed the aerodynamic force distributions at the front and rear wheels. The aerodynamic downforce of the rear wheels increased at the expense of the downforce of the front wheels. The characteristics of the car changed from understeer to oversteer.

3.2.2. Cornering Car with Inverted Rear Wing

The downforce coefficients Cz achieved by car with splitter and with booster plate alone are of the order of 0.25 (Cz = −0.25). The use of an inverted rear wing over the vehicle allows for higher downforce values, but at the expense of changing its distribution among the axles. The rear axle downforce increases, but the front axle downforce decreases.
The rear wing should be tilted to the side so that a lateral force is applied to the inside of the curve. Figure 26 shows a comparison of the resultant forces for the curved ride and the two opposite wing positions. The wing in the correct position produces a small lateral force. In the opposite position, the lateral force drops to practically zero. Correct orientation of the angled wing generates a yawing moment in the understeer direction, and incorrect orientation in the oversteer direction. The small righting moment (relative to the longitudinal axis of the car) that occurs with a correct wing configuration disappears completely with an incorrect one.
Figure 27 shows the pressure distribution on the car and the iso-surface of the dimensionless parameter Q = 0.15.
The use of only the rear wing causes very strong pressure on the wheels of the rear axle at the expense of lifting the wheels of the front axle.
By analyzing the simulation results presented here, it can be seen that it is relatively easy to generate a large rear wheel downforce using an inverted wing and a small component such as a booster plate. The booster plate under the wing is a very effective additional moving aerodynamic element.

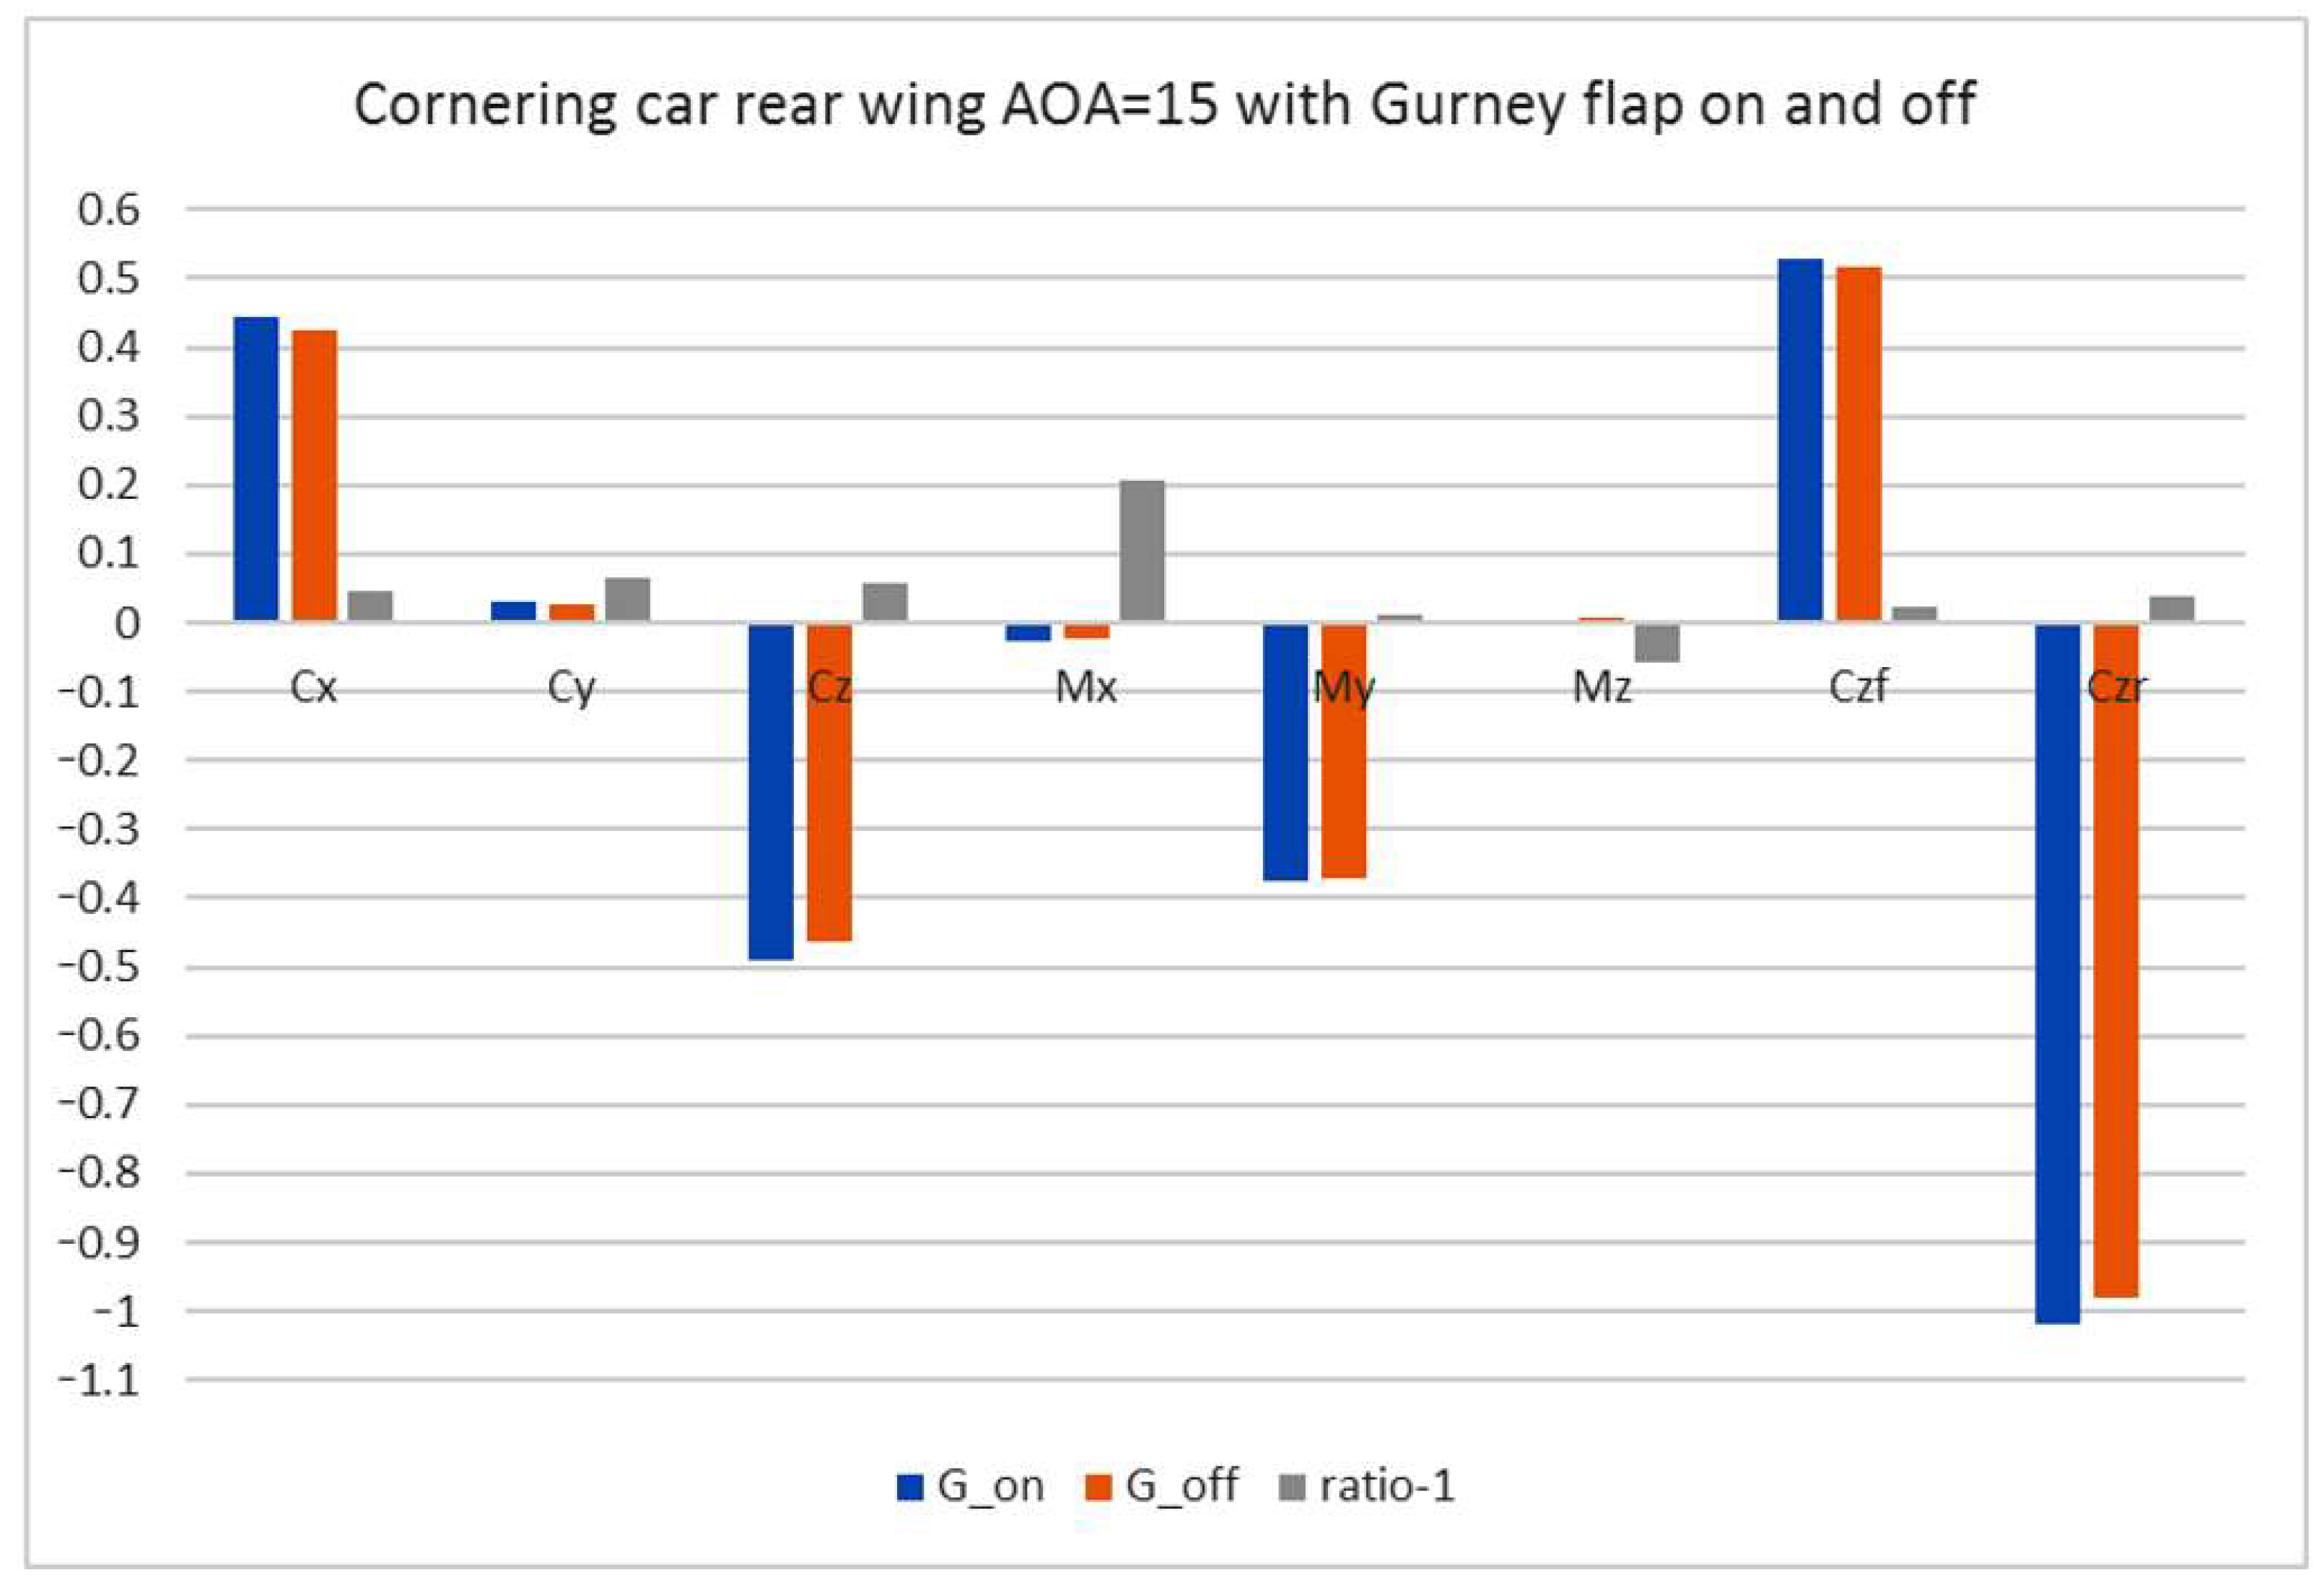
3.2.3. Cornering Car with Inverted Rear Wing and Switchable Gurney Flap

The effect of activating the Gurney flap on the aerodynamic characteristics of the car while negotiating a road curve is shown in Figure 28.

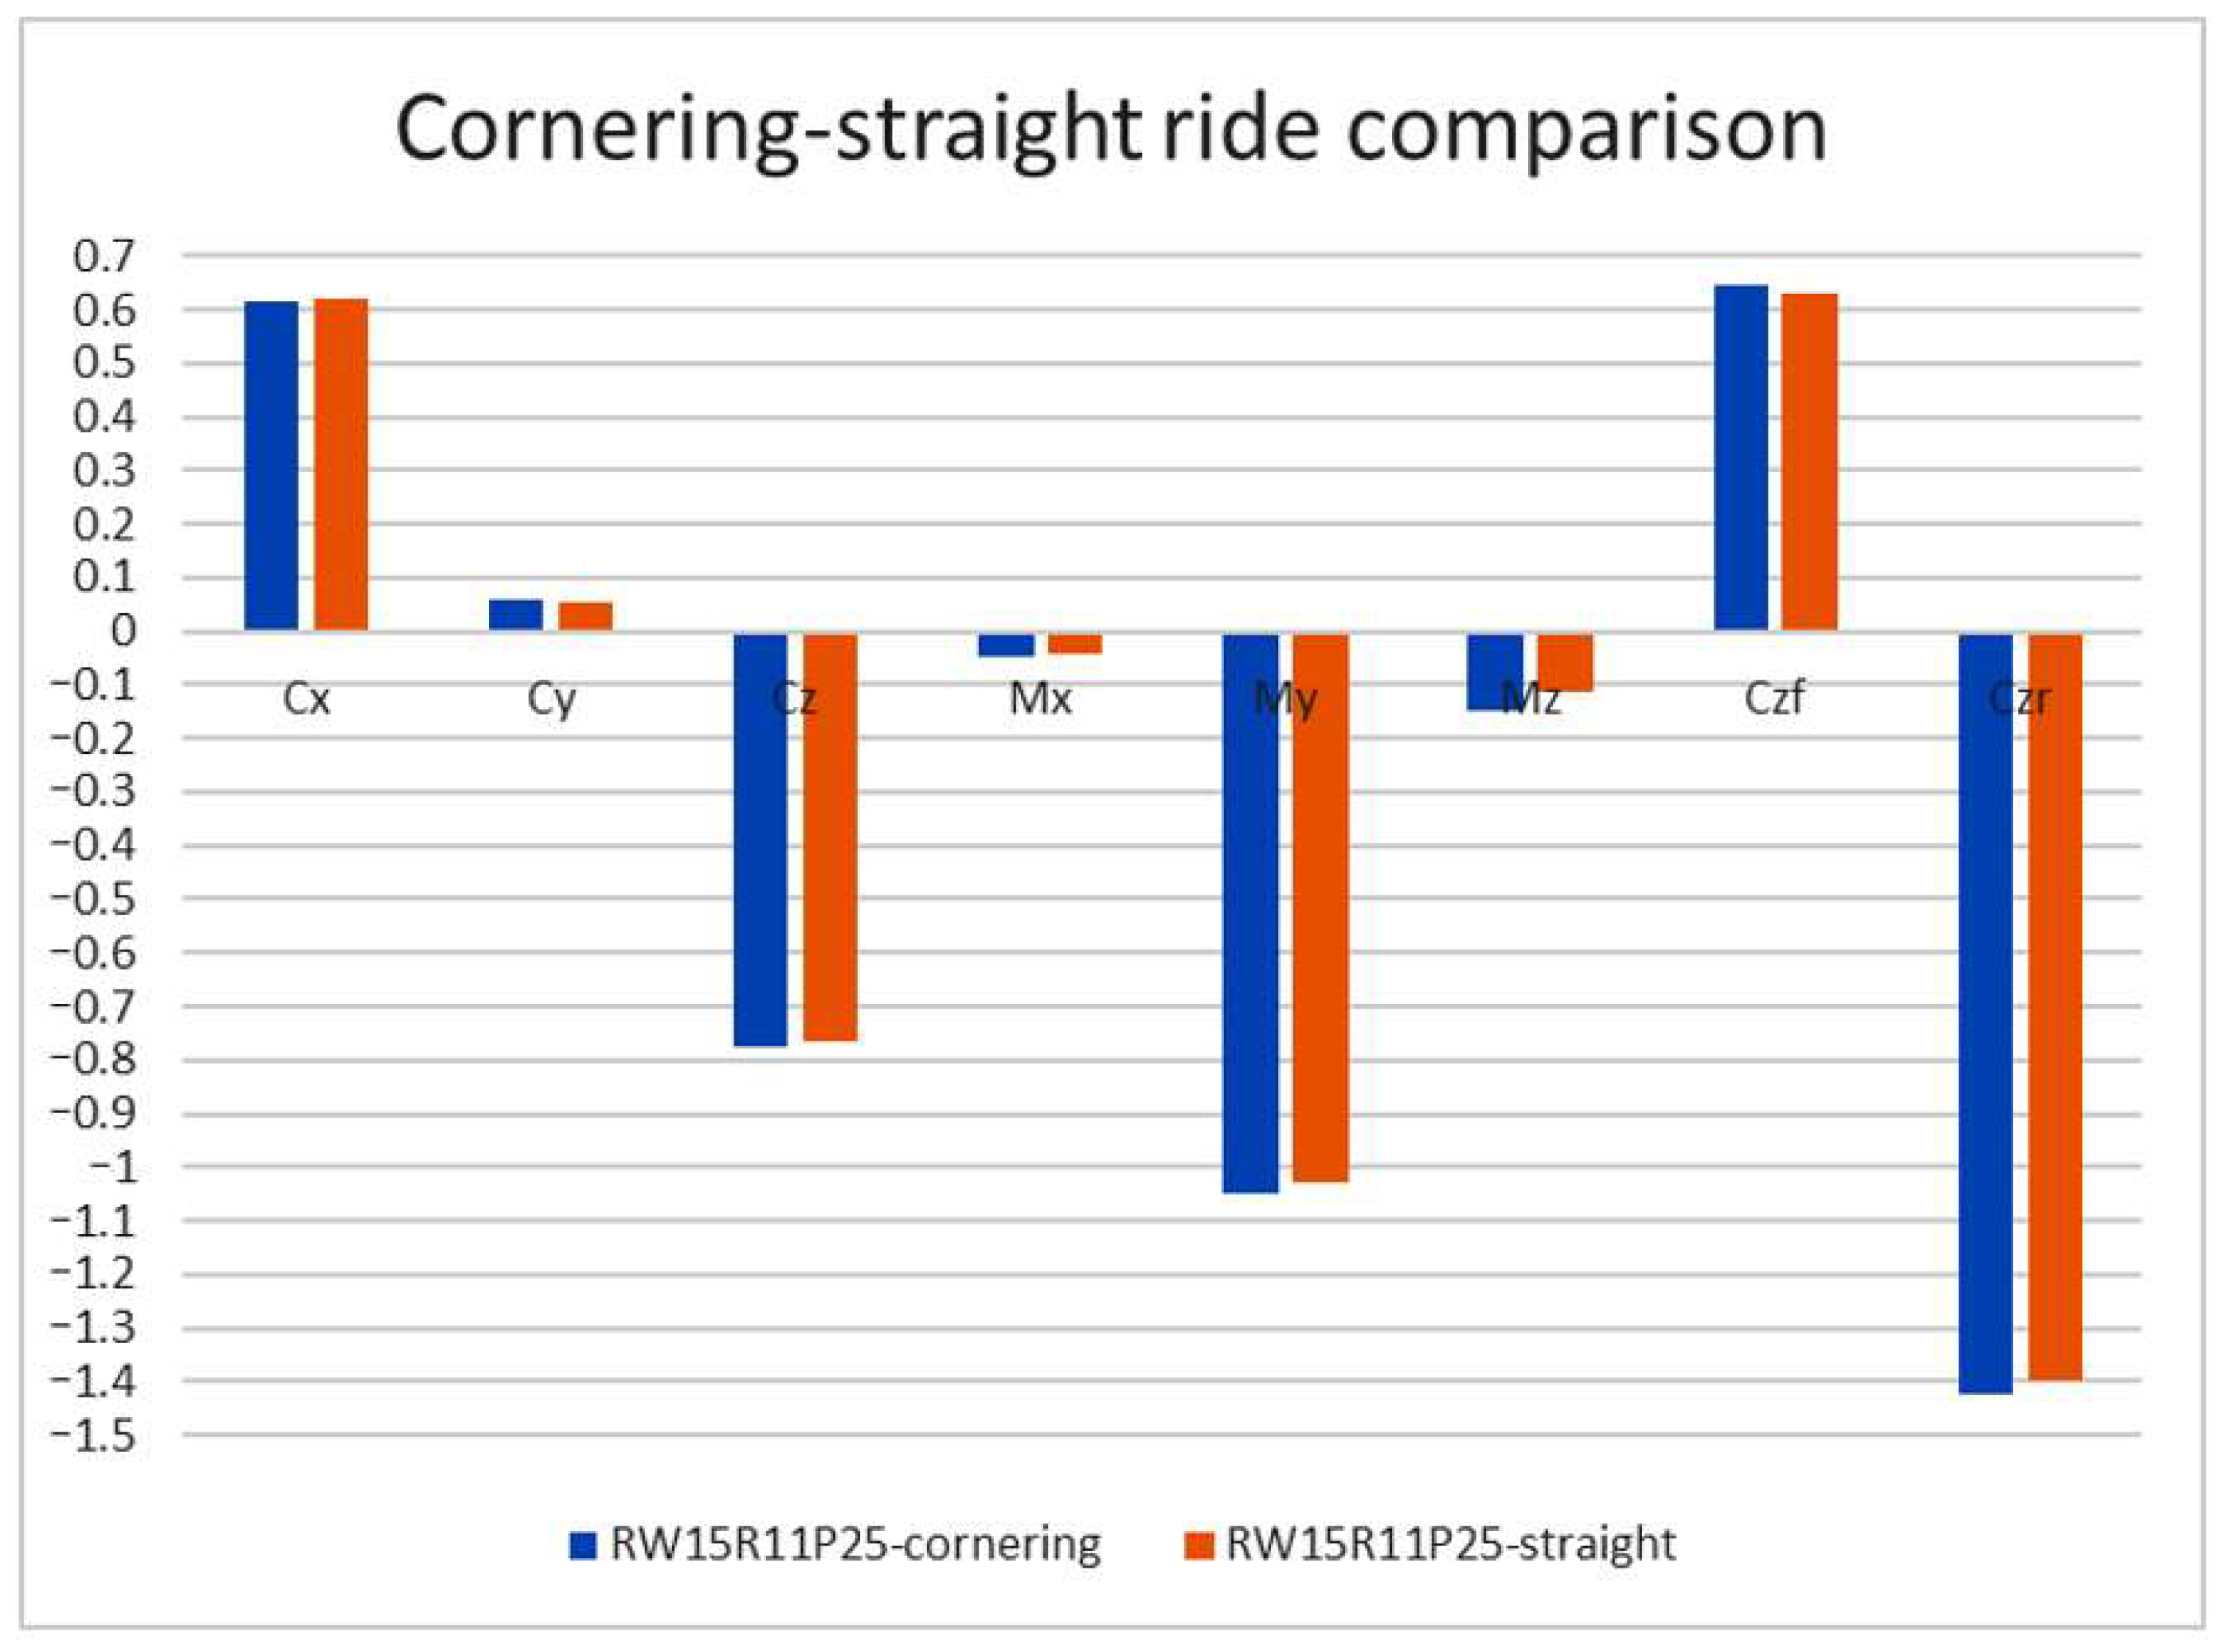
3.2.4. Comparison of Straight and Curved Driving

To demonstrate the differences in aerodynamic characteristics of a vehicle traveling straight and a vehicle traveling at 40 m/s on a 90 m radius curve, the results of simulated vehicle motion in the RW15R11P25 configuration—a vehicle with a rear wing with an angle of attack of 15 degrees inclined to one side by 11 degrees, and a backing plate angled at 25 degrees—were compared and shown in Figure 29.
It can be seen that the differences in the aerodynamic characteristics of the vehicle between straight and curved driving are not significant and varied.

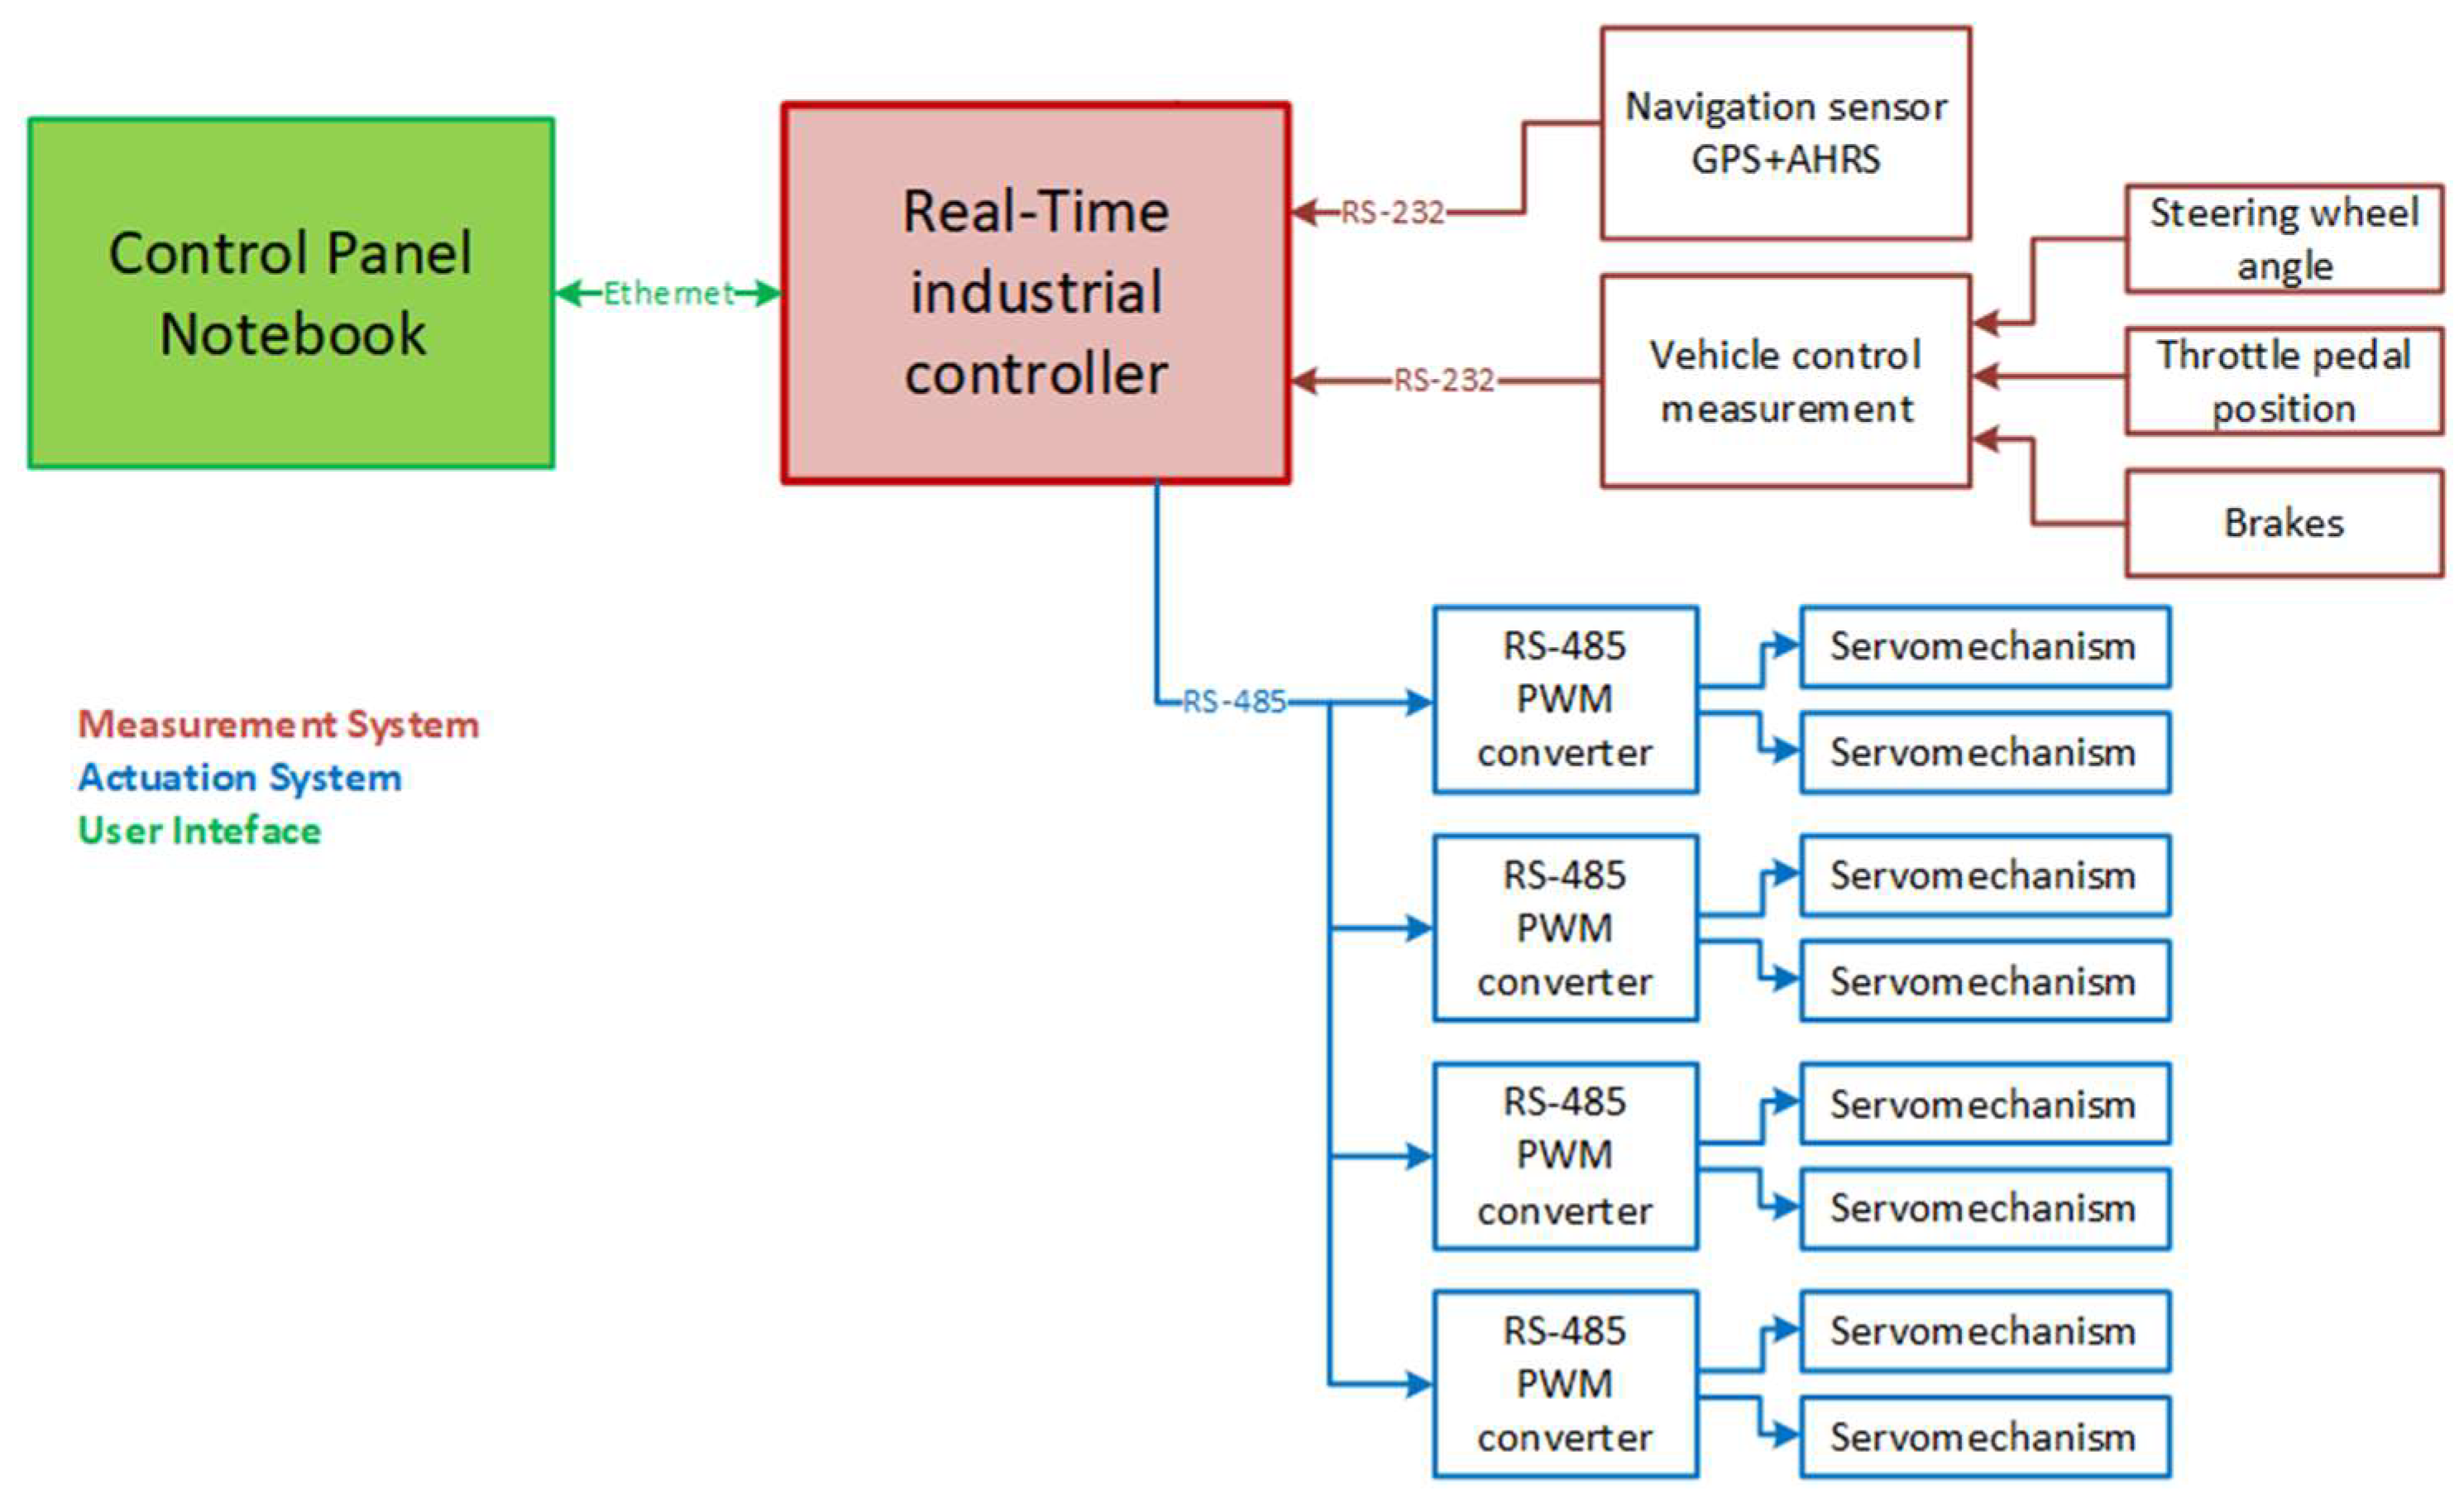
4. An Automated System for Vehicle Dynamic Data Acquisition and Control of Moving Aerodynamic Components

Practical realization of the cars’ aerodynamic surfaces control required development of a dedicated data acquisition and control system. Research type of the project forced using of a flexible, easy to modify system which could interface with various sensors and actuators. Another requirement was the immunity to EMC interference and vibration. For those reasons the whole system was designed and developed around National Instruments sbRIO-9627 industrial controller. Structure of the final version of the system is presented in Figure 30. Car state in terms of position, linear velocities, acceleration, angular rates, and attitude angles was measured using VectorNav VN-200 GPS aided Attitude and Heading Reference Sensor interfacing the system via RS-232C. Control of the car was measured via additional interface and included steering wheel angle, throttle pedal position and brakes state. Control signals generated by the system controller were sent to actuators (rotational servomechanisms and linear actuators) via RS-485 interface bus. Settings of the system controller parameters was possible using a notebook-based GUI. The controller was equipped with a memory card for logging all the required parameters during the tests at a rate of 100 Hz.
During the project three types of aerodynamic surfaces control were used: (1) manual, individual control of every surface, (2) presets of controls for the whole set of surfaces, and (3) automatic control. Manual control of each surface was used at the very beginning of the project to assess the effect of each surface on the behavior of the car. Preset configurations were used later to check how different configurations of many surfaces influence the dynamics of the car. The final tests were performed using the automatic control. In this mode several control laws were applied. The control laws took into account the actual car state (e.g., speed, turn rate, and acceleration) and the actual control of the car set by the driver. Based on all those signals, the aerodynamic surfaces were set to the particular position affecting behavior of the vehicle in the particular situation. For convenience, within the automatic mode there was also a kind of signals simulator developed which allowed for off-line tests of the system (e.g., without actual drive at high speed). In each control mode the signals for actuators were generated at a rate of 10 Hz.

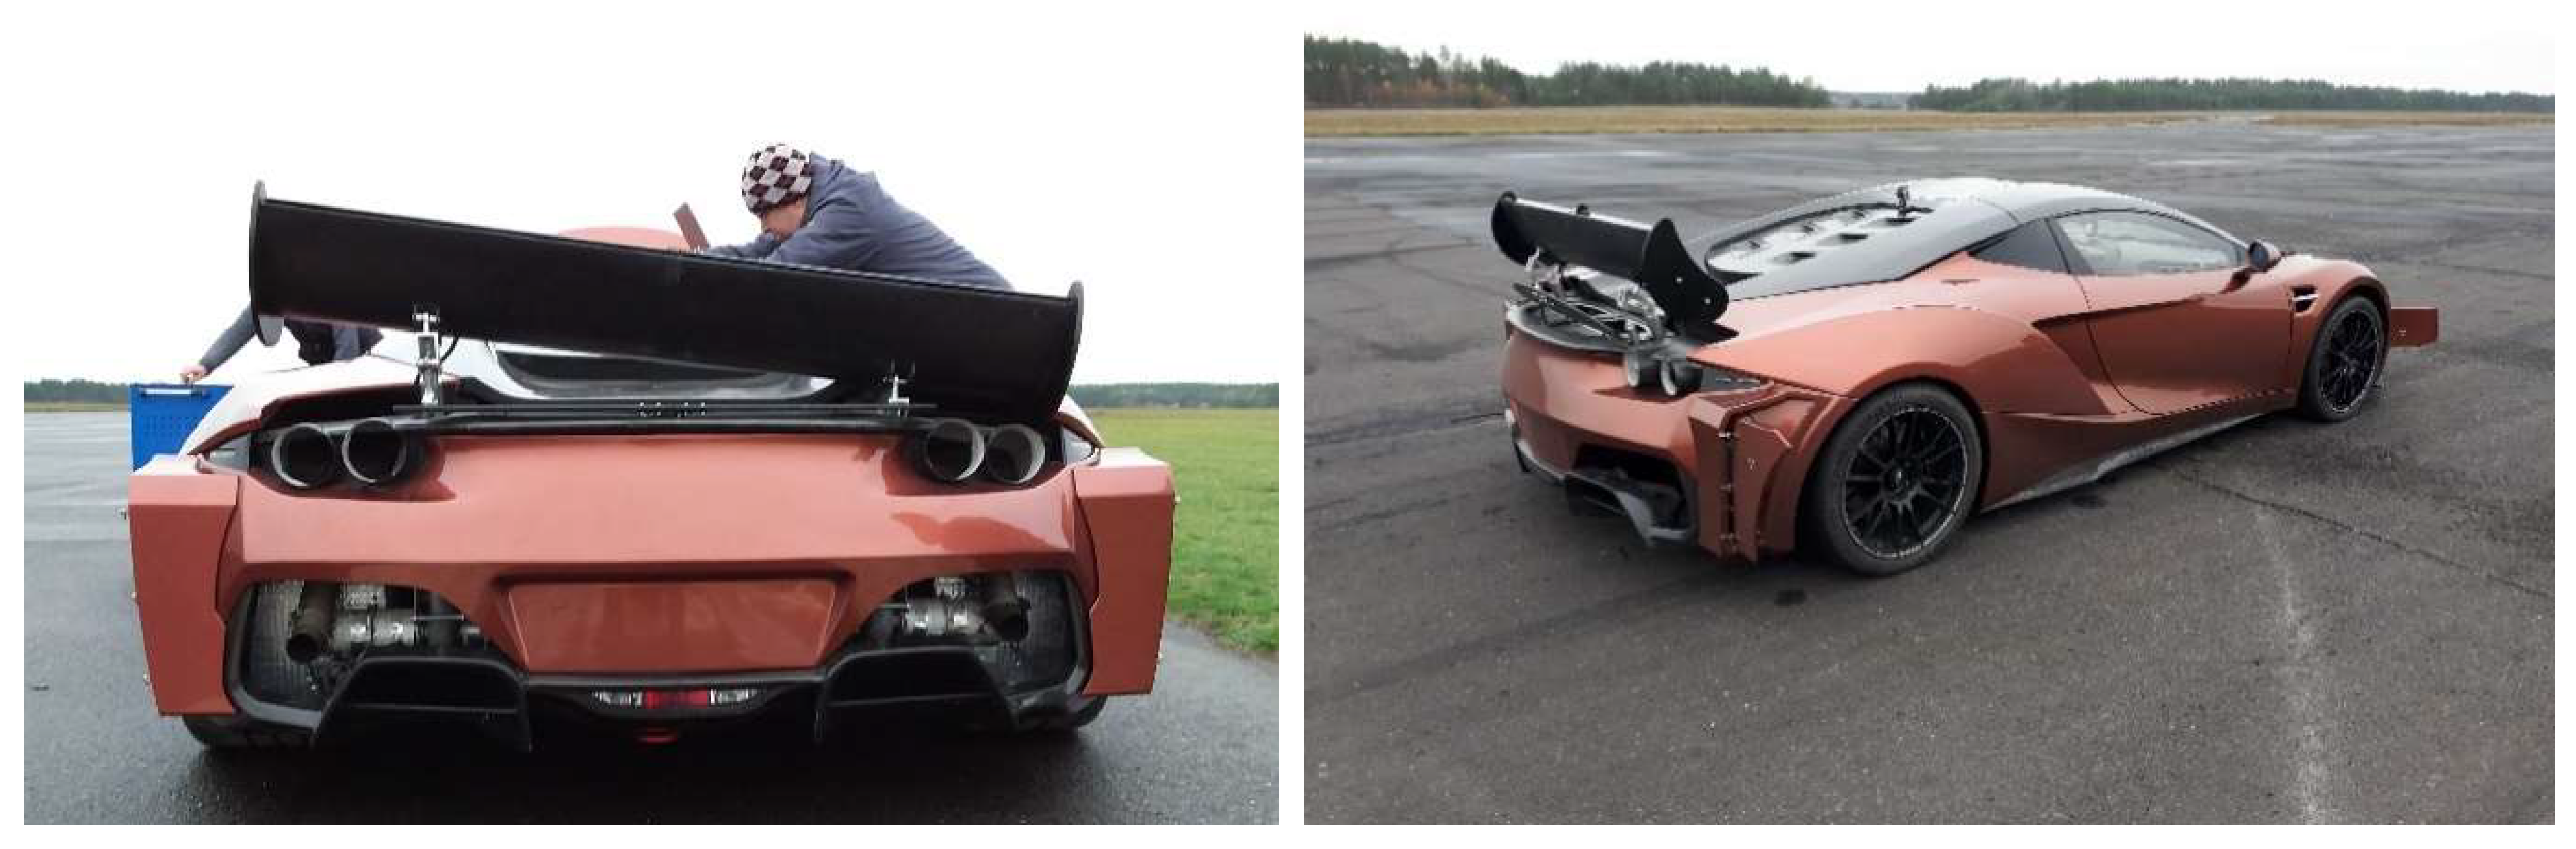
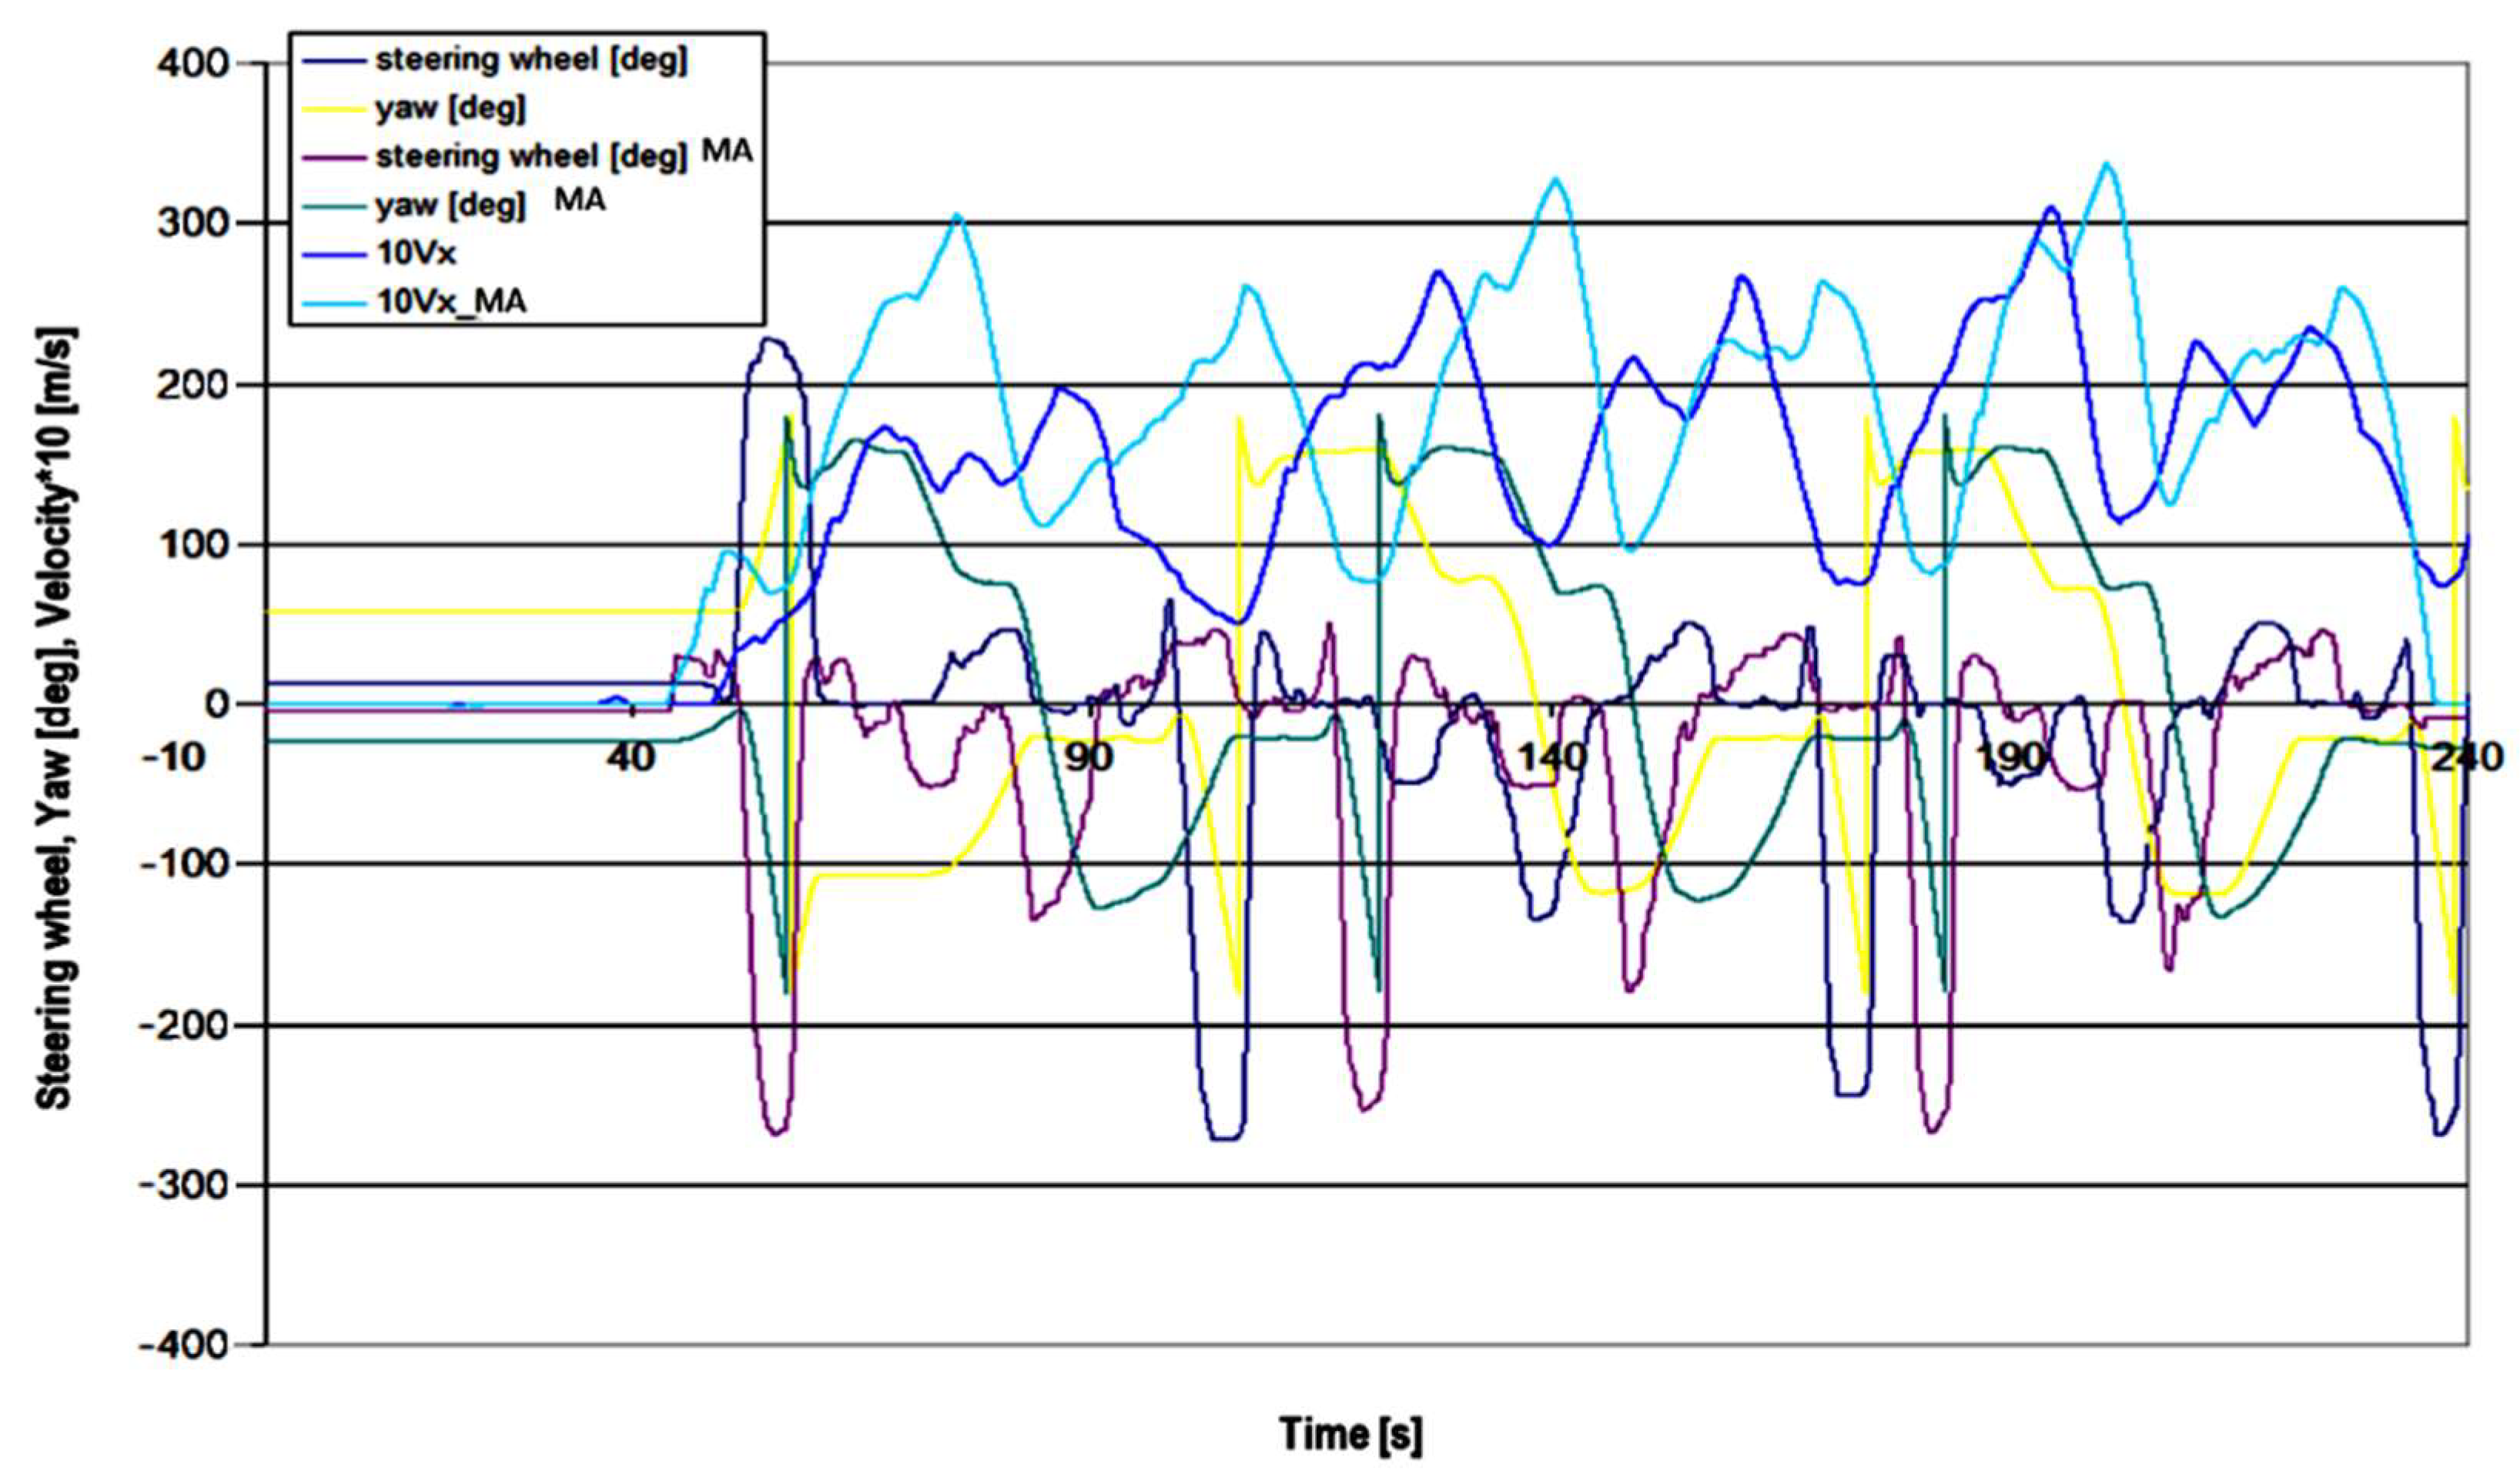
5. Vehicle Investigation at Runway

A series of preliminary tests were conducted on the airport roads. The subject of the tests was a prototype sports car. Arrinera Hussarya is a supercar developed by the Polish company Arrinera Automotive. The design work began in 2008, and the first test drives took place in 2011. The final design of the model was shown in 2014. The two-door coupe features rear-wheel drive and carbon fiber components, and under the hood is a 6.2-L Chevrolet 8-cylinder engine with 650 hp and 820 Nm of torque. Acceleration to 100 km/h is 3.2 s, 200 km/h is 8.9 s and top speed is electronically limited to 340 km/h. Thanks to the use of special steel, the body weight has been reduced to 1250 kg. Photographs of the car used during the tests are shown in Figure 31.
The analyzed designs of additional aerodynamic elements were partially realized on the test car. The most important of them are the splitter under the front part of the body, the rear wing with the possibility of extending it above the body, changing the angle of attack up to 60 degrees and leaning sideways by 9 degrees, switchable Gurney flap on the rear wing.
The exemplary test consisted of a series of activities:
  • Accelerating the vehicle on the narrow access road to the runway;
  • Making a left turn on the airport runway;
  • Braking, turning around, and entering the narrow access road;
  • Turning around at its end;
  • Making another pass.
The test driver had no experience in high-performance driving. Figure 32 shows a comparison of extreme cases. A comparison was made between driving with the minimum and maximum aerodynamic configurations (see Figure 32).
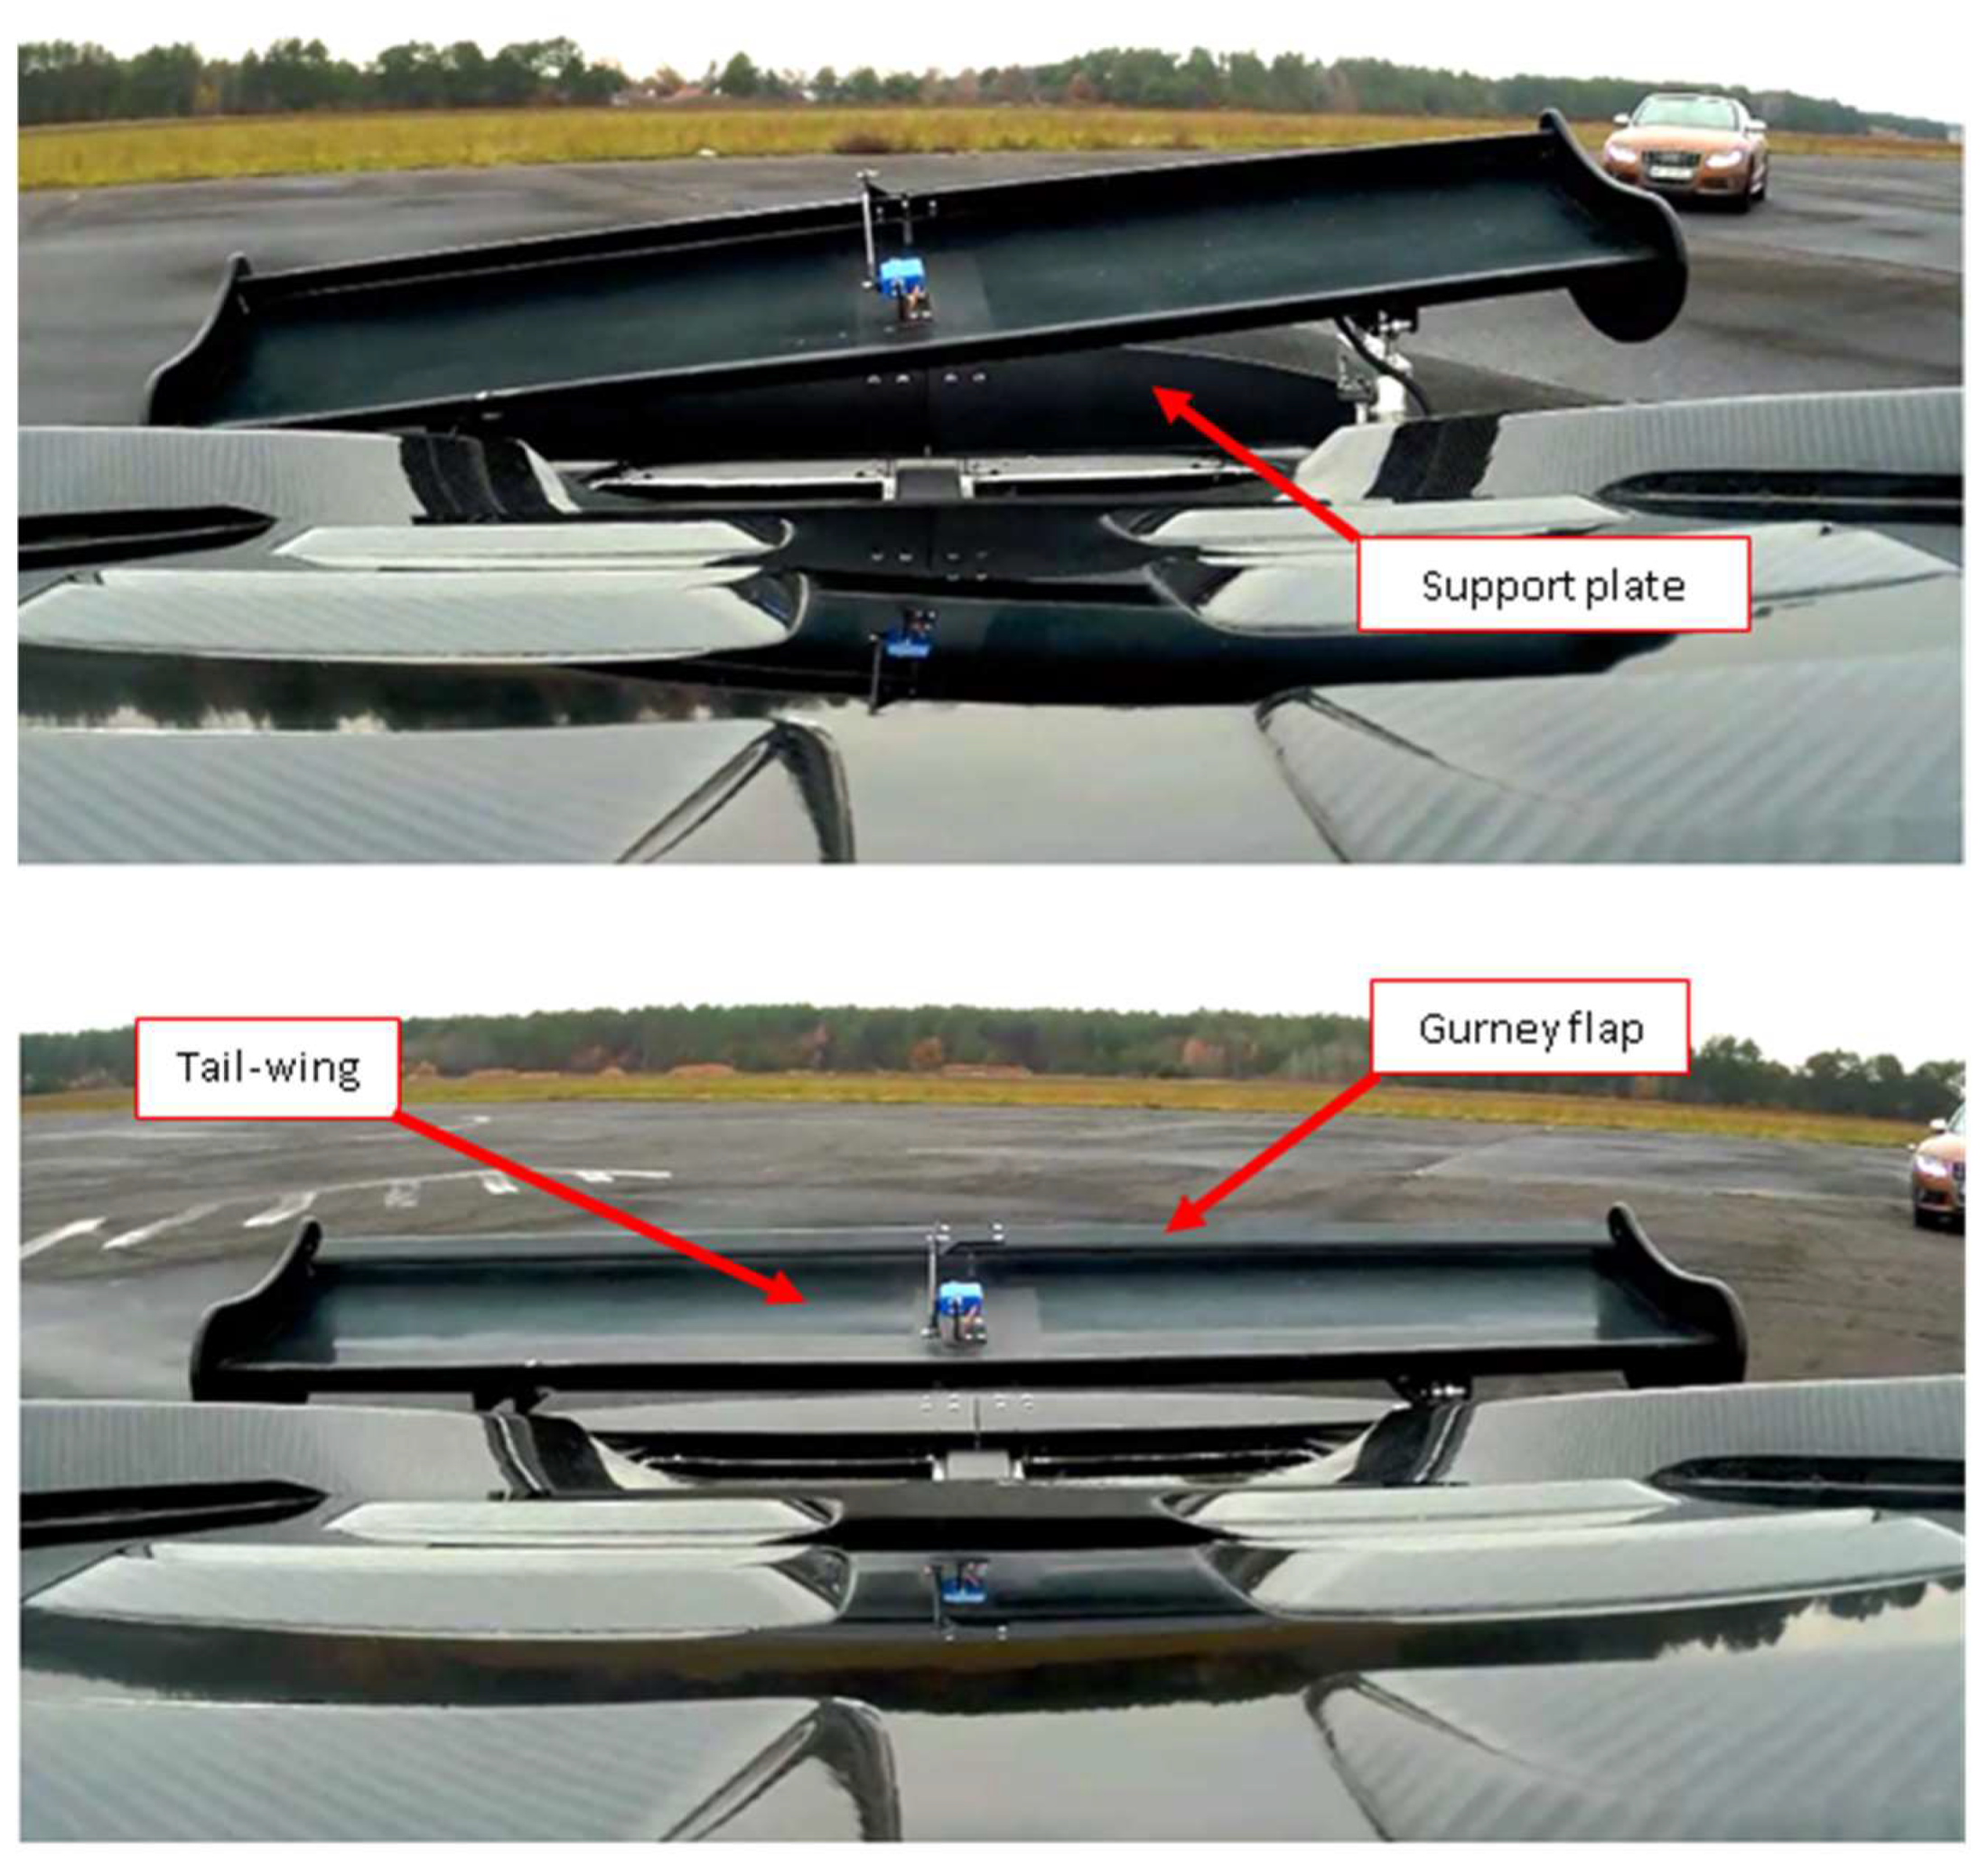
  • Tail-wing horizontal minimum angle of attack;
  • Support plate set to 0 (deg);
  • Gurney flap off.
Maximum aerodynamic configuration (see Figure 32 top):
  • Tail-wing inclined 9 (deg);
  • Tail-wing angle of attack 23 (deg);
  • Support plate set at 40 tail-wing.
Tests at higher speeds were conducted by running the aircraft through the intersection of the access road and the airport runway several times in series (Figure 33).
Several figures have been prepared to provide a clearer interpretation of the vehicle behavior under minimum and maximum aerodynamic effects. Figure 33 shows the recorded trajectories that are synchronized with the speed, direction of travel, and steering angle waveforms shown in Figure 34. The speed-time waveforms alone do not show all aspects of the vehicle and driver behavior. As can be seen by analyzing the steering movements in Figure 34, after the initial period of learning the vehicle behavior, the driver behaves identically (repetitively) in the third and fourth runs. When driving with fully active aerodynamic components, he drives at a higher speed than when the aerodynamic configuration is minimal following the same driving path.
To show the influence of aerodynamic elements more clearly, the recorded information was presented graphically in the form of g-g (transverse acceleration - longitudinal acceleration) plots. Figure 35 shows the relationship between the accelerations in the longitudinal and transverse directions while driving around a series of curves, including a test curve, with a vehicle with active and inactive aerodynamic elements. As can be seen, the accelerations locally reach values of 1 g during the deceleration phase and the acceleration phase during the test curve movement.
To better visualize the test results, transverse acceleration-velocity graphs were used. These allow an assessment of what lateral accelerations occur at what speeds. Figure 36 shows the relationship between lateral accelerations and the driving speed at which they occur. It can be observed that lateral accelerations are higher when driving a vehicle with fully active aerodynamic components than without it.
Examining the data in Figure 36, it can be seen that high lateral accelerations can occur at different speeds. Importantly, there are differences in lateral acceleration values and maximum speeds between successive passes of the vehicle without aerodynamic influence and with all aerodynamic components active. As can be seen, during testing, high lateral accelerations occur, both, during fast passes through the test curve and during dynamic turns at much lower speeds. It can be seen here that during return bends at speeds in the range of 60–70 km/h the driver obtained higher lateral accelerations leading to rear wheel slip. At these speeds he felt safe knowing that the skid would not cause damage to the car. At speeds above 100 km/h, the driver behaves much more cautiously. The grip coefficient of the tires on dry asphalt is 0.8, which corresponds to a maximum lateral acceleration of about 0.8 g. The test driver showed courage during dynamic cornering at speeds of 50–60 km/h, reaching and even exceeding the limit of adhesion, being cautious when taking fast test curves (Figure 36). Reading from the graph (Figure 36) the maximum speeds corresponding to the accelerations of the adhesion limits of the tires, the following values are obtained:
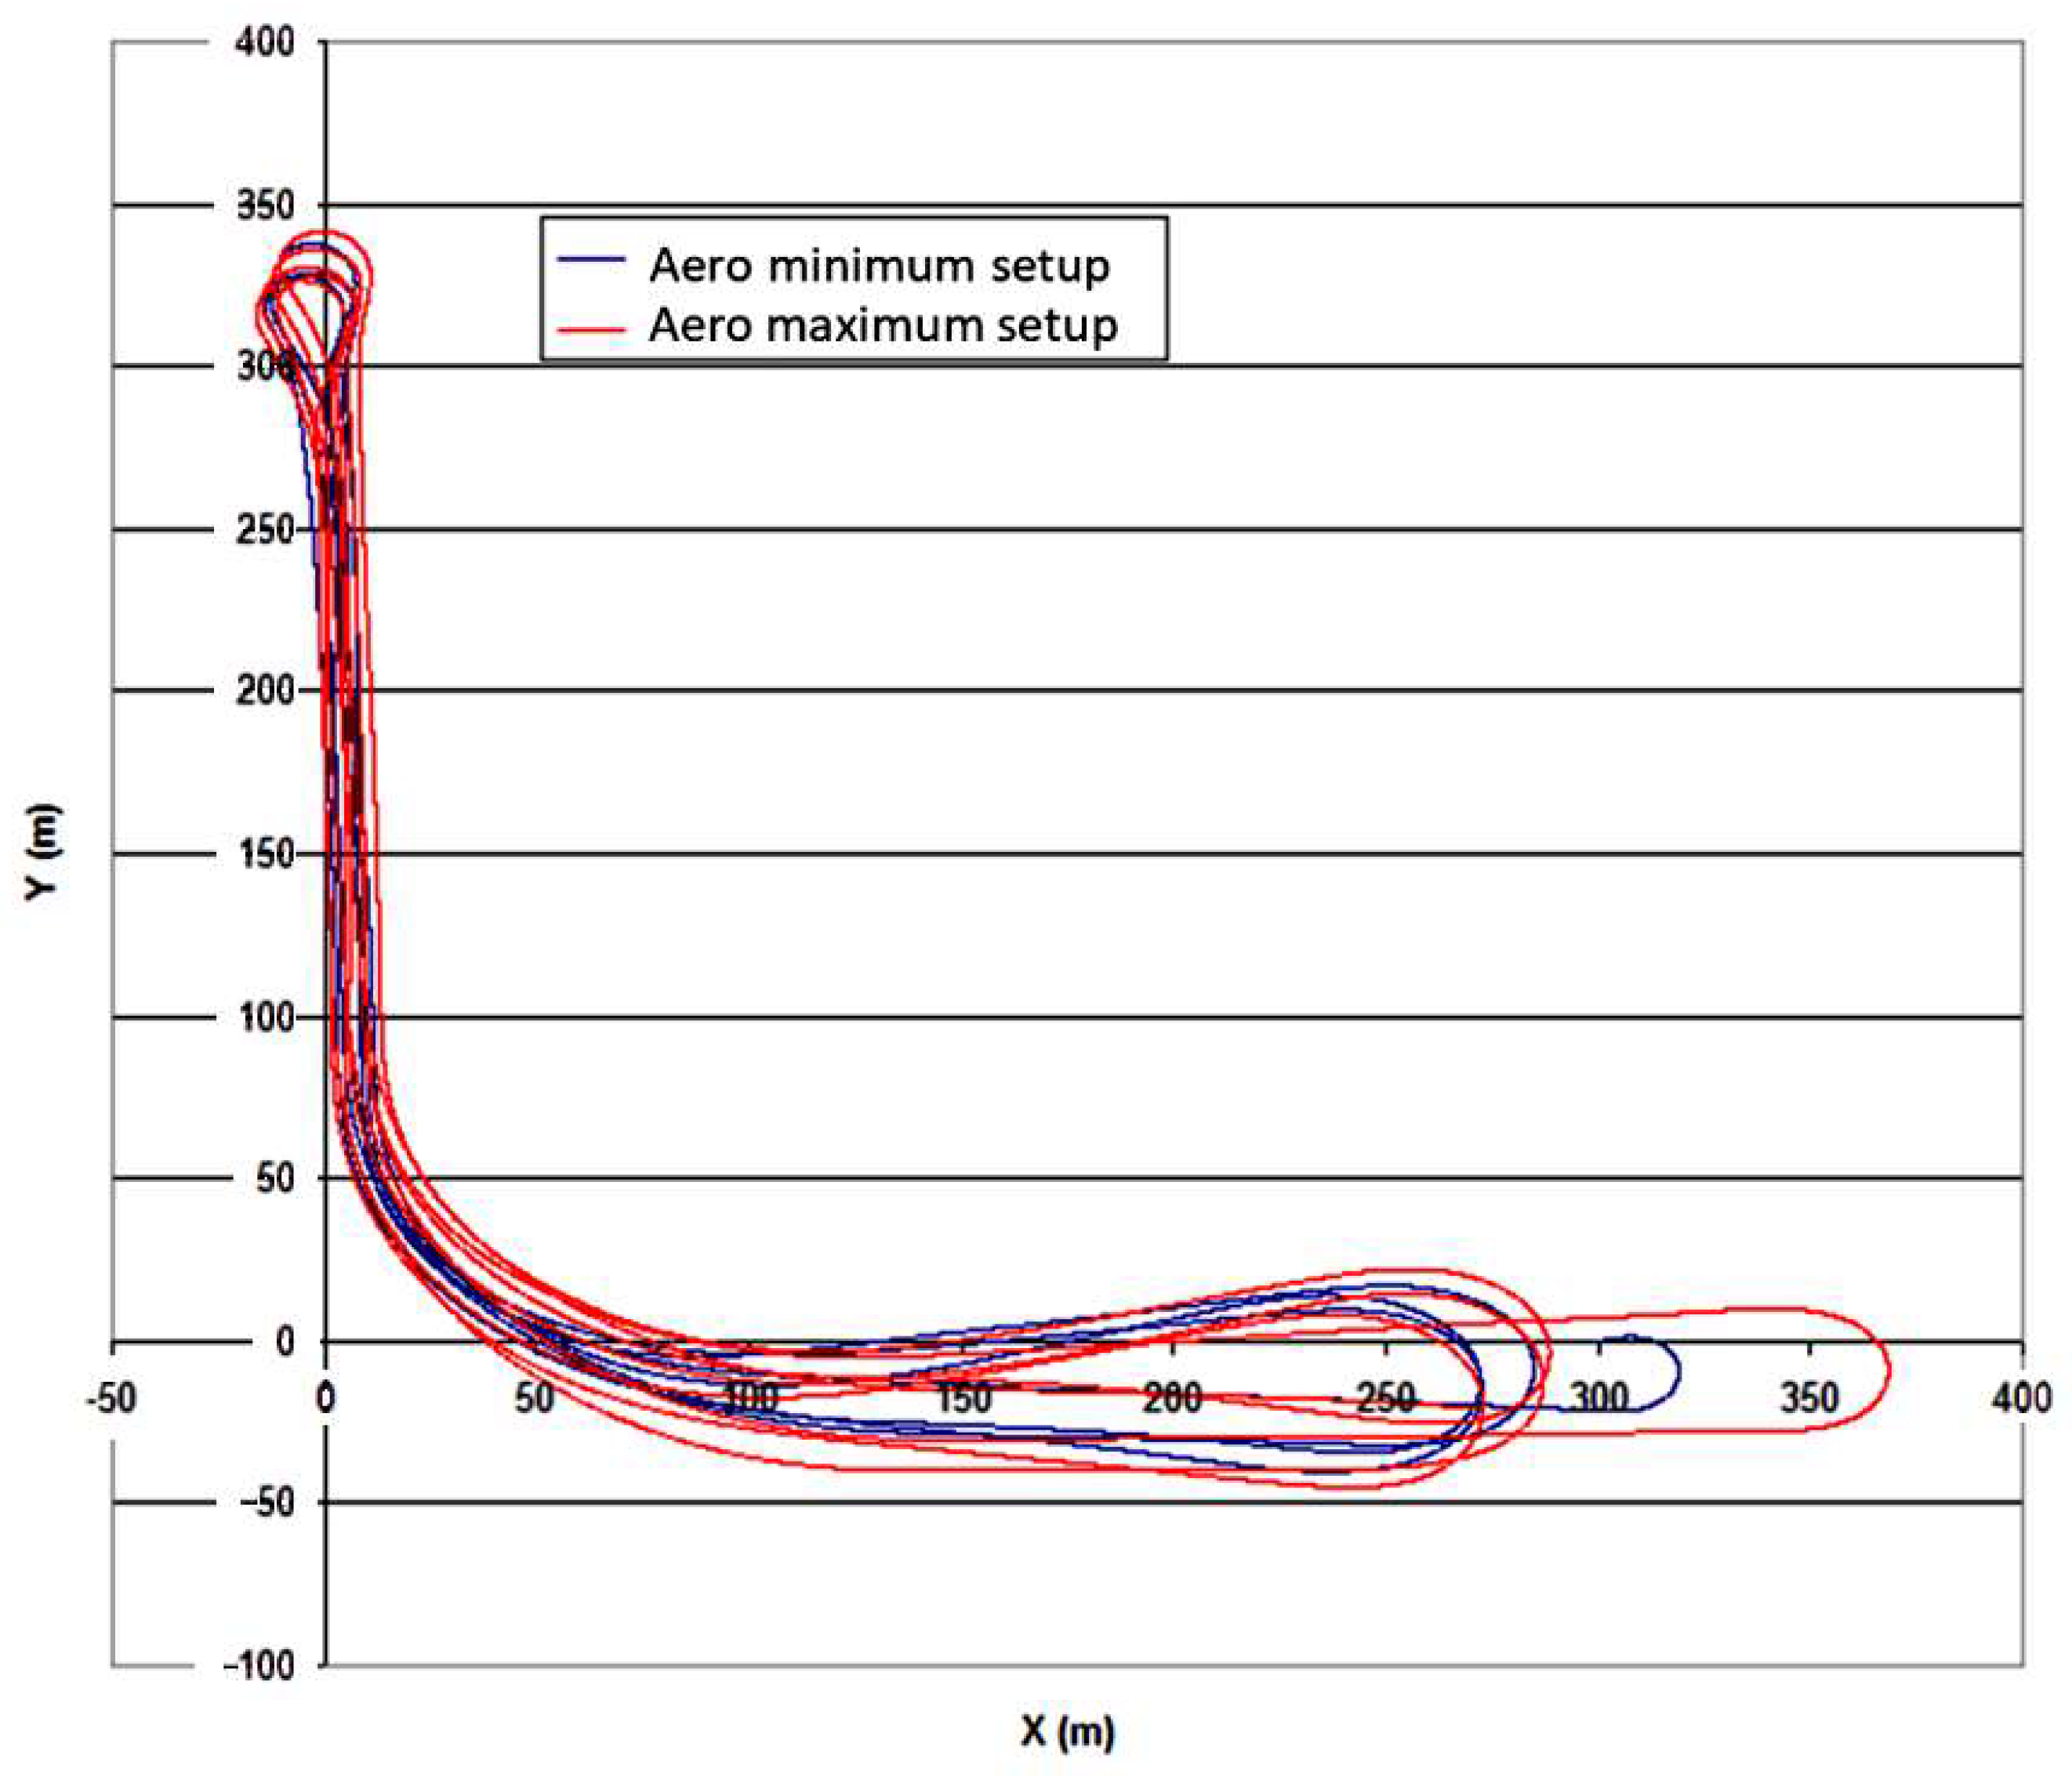
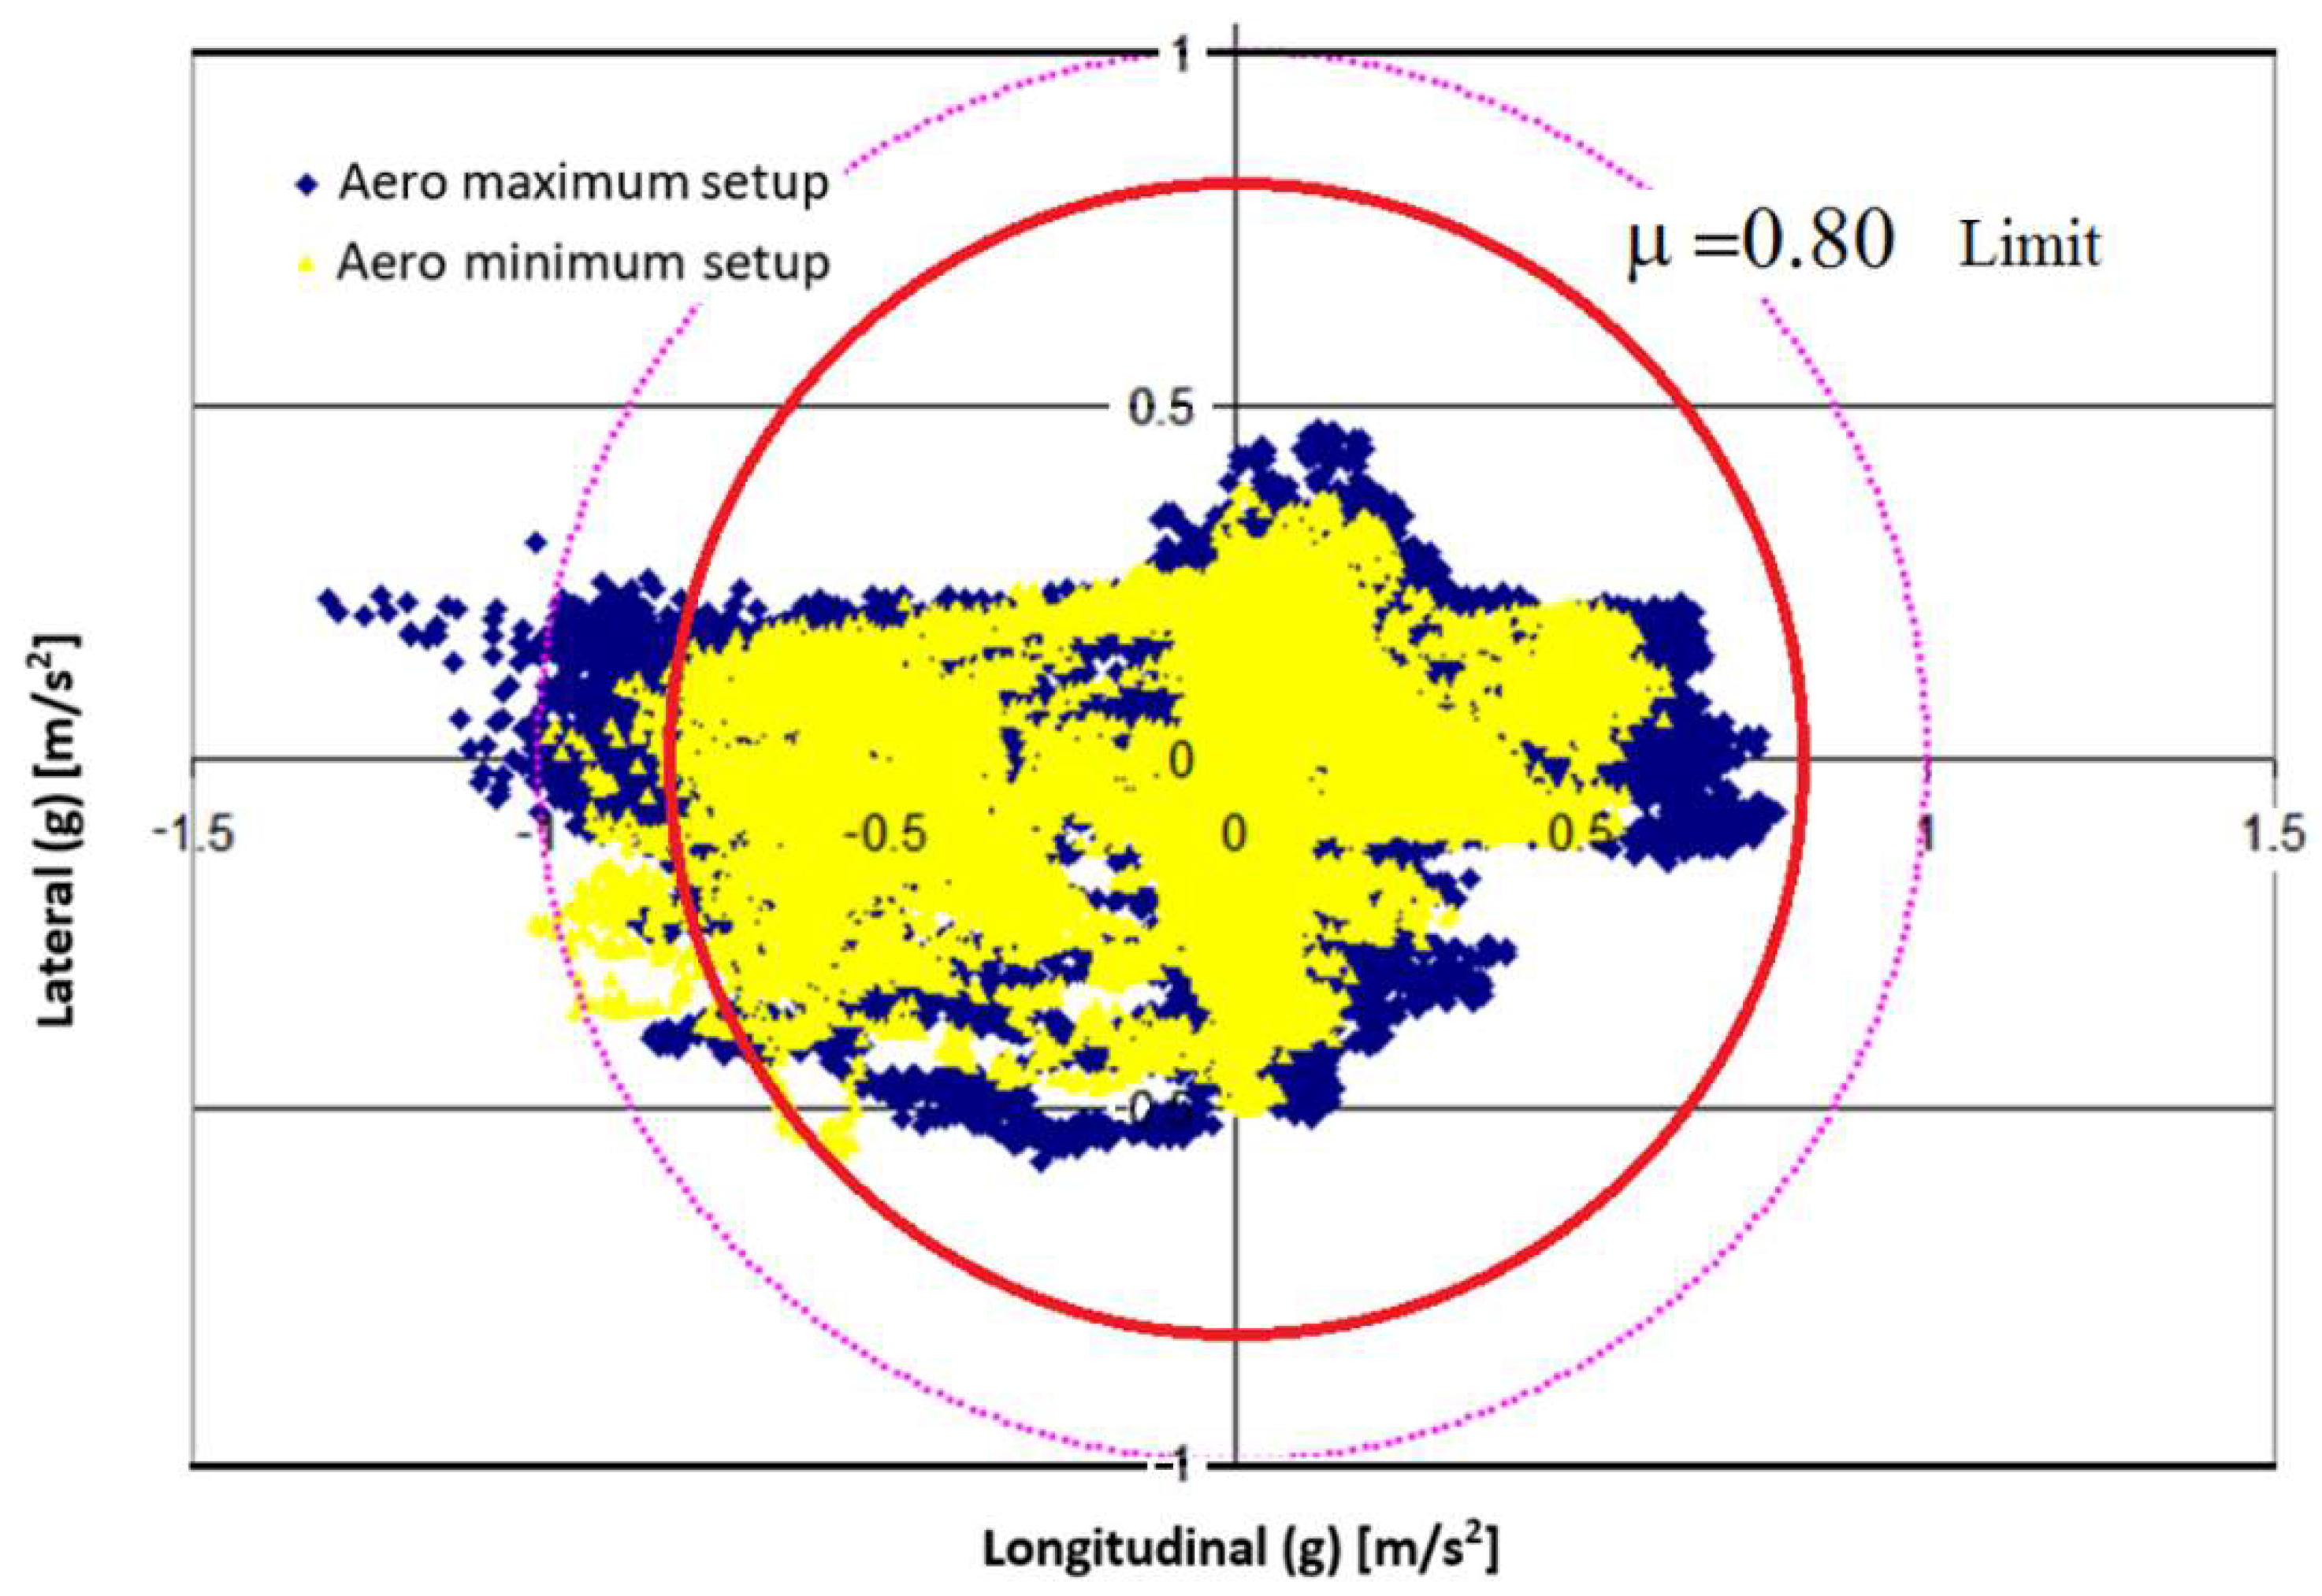
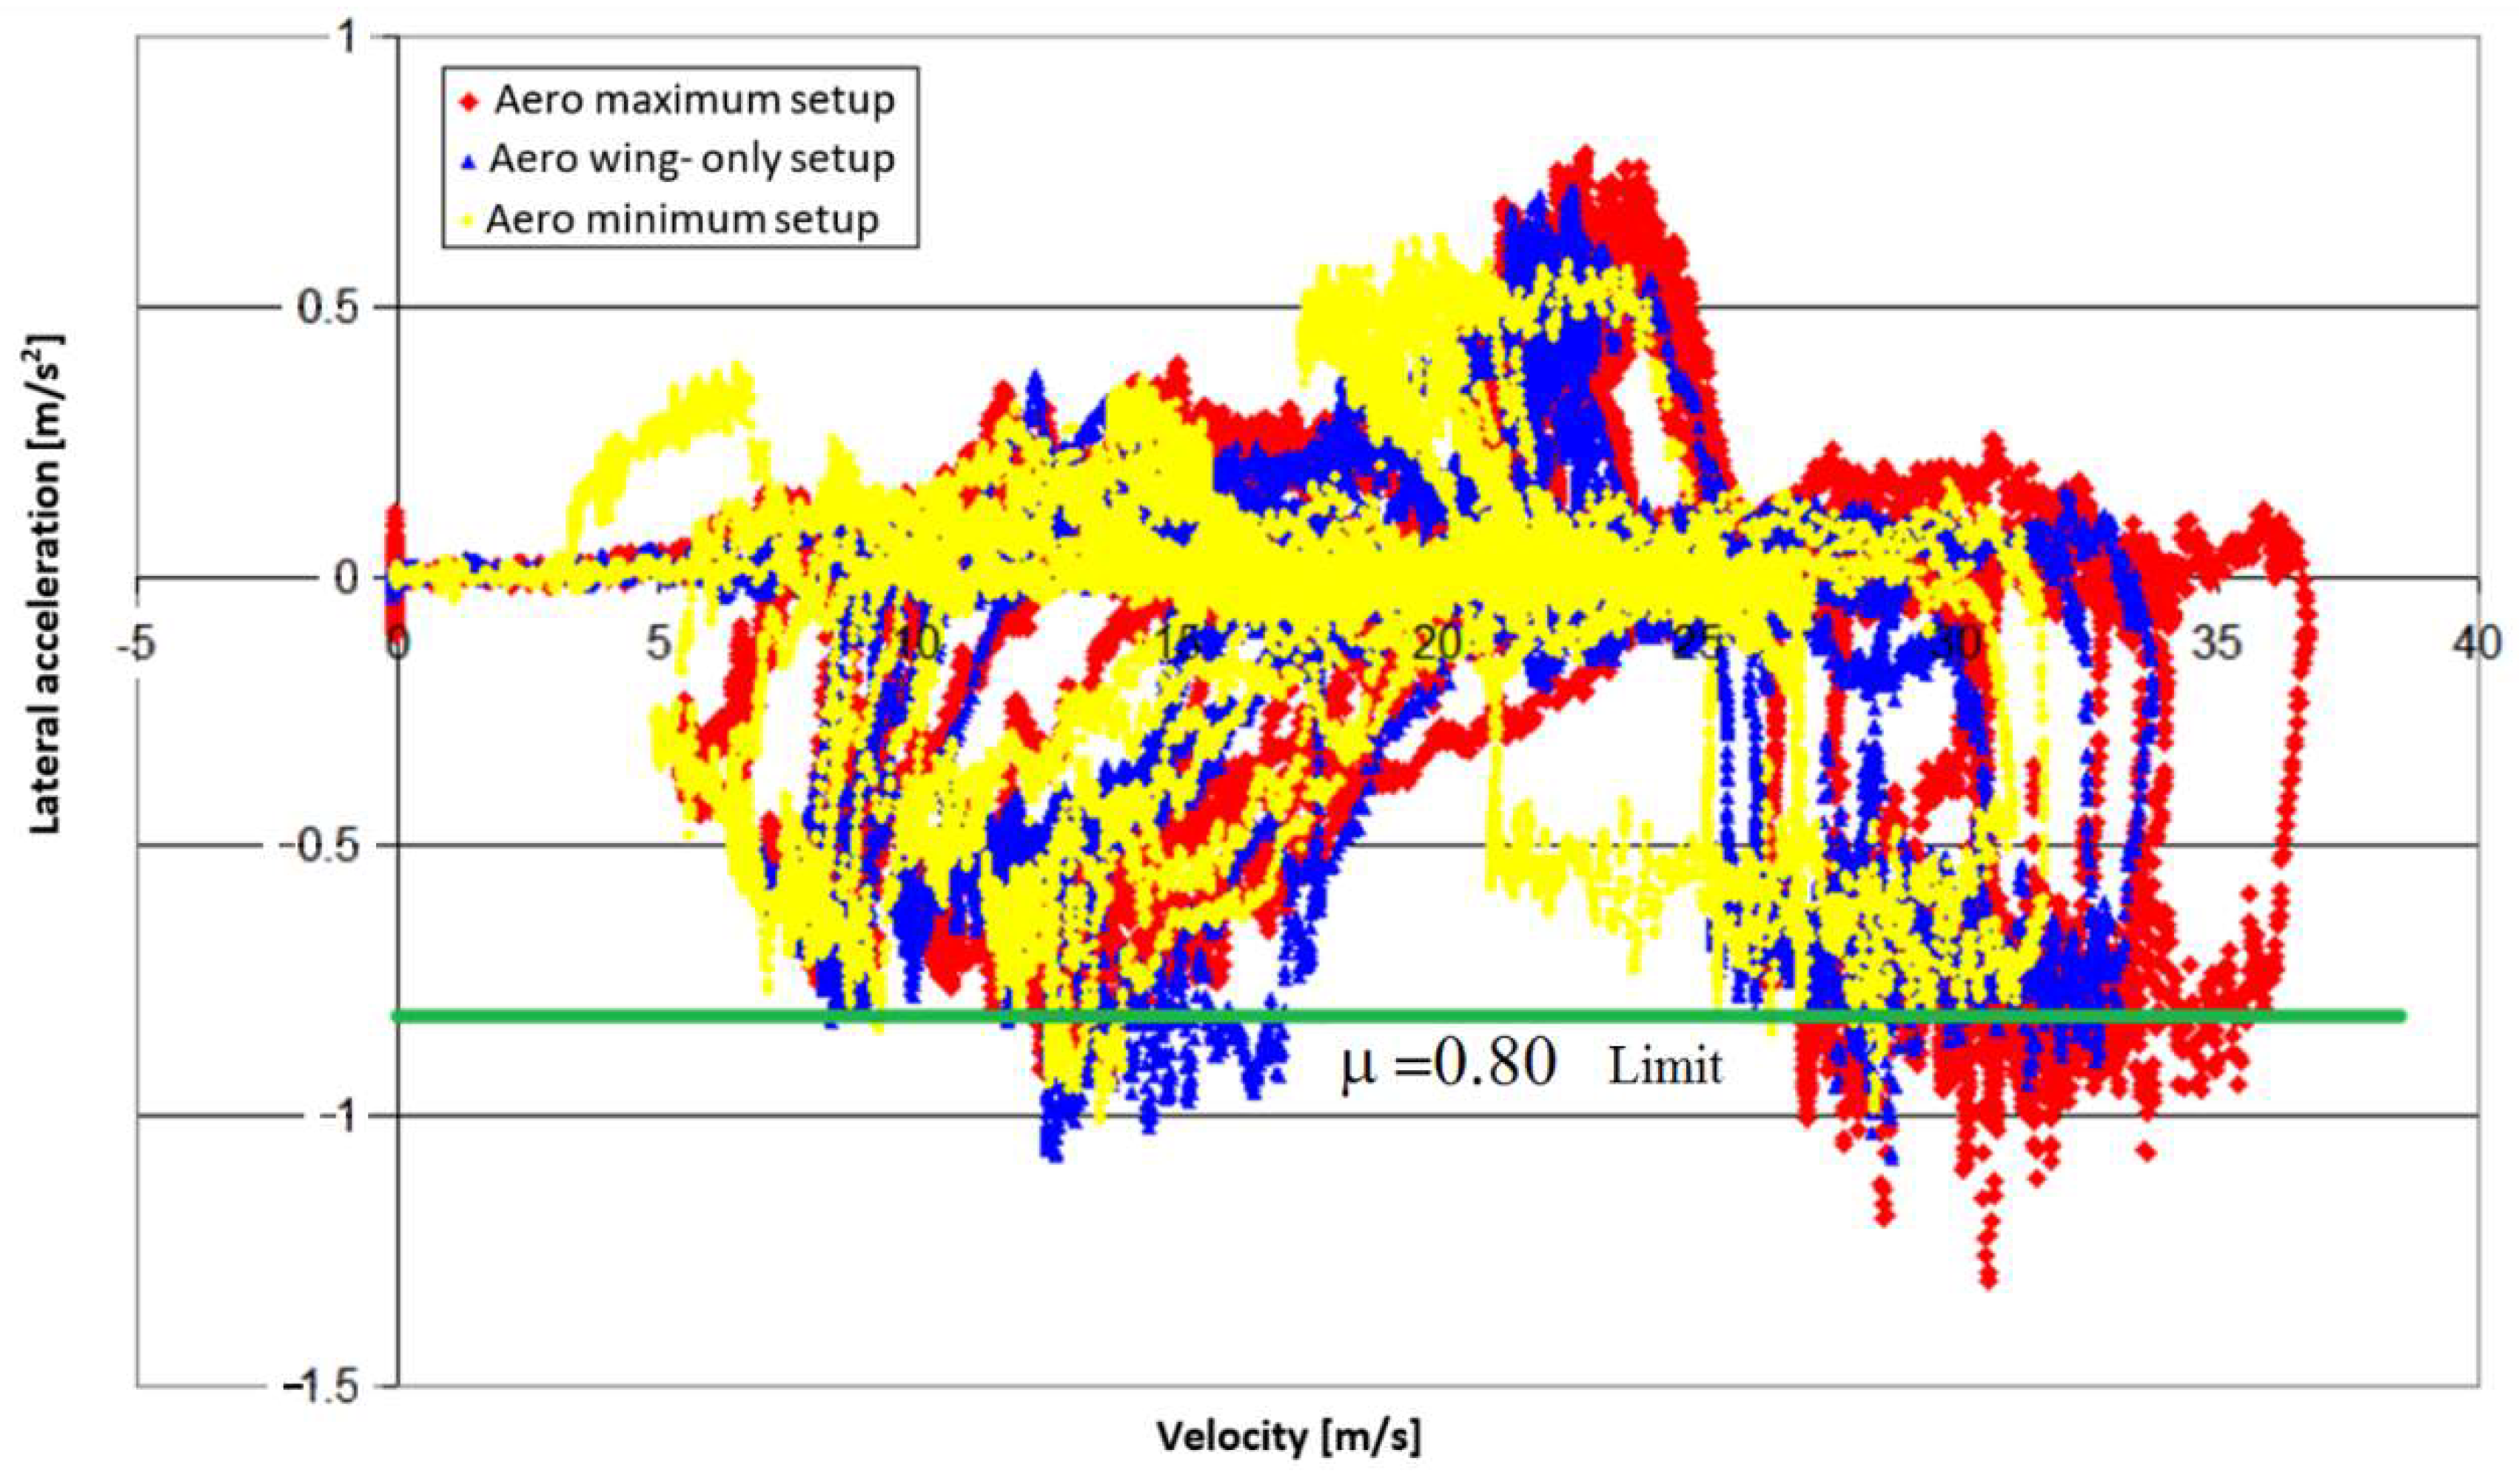
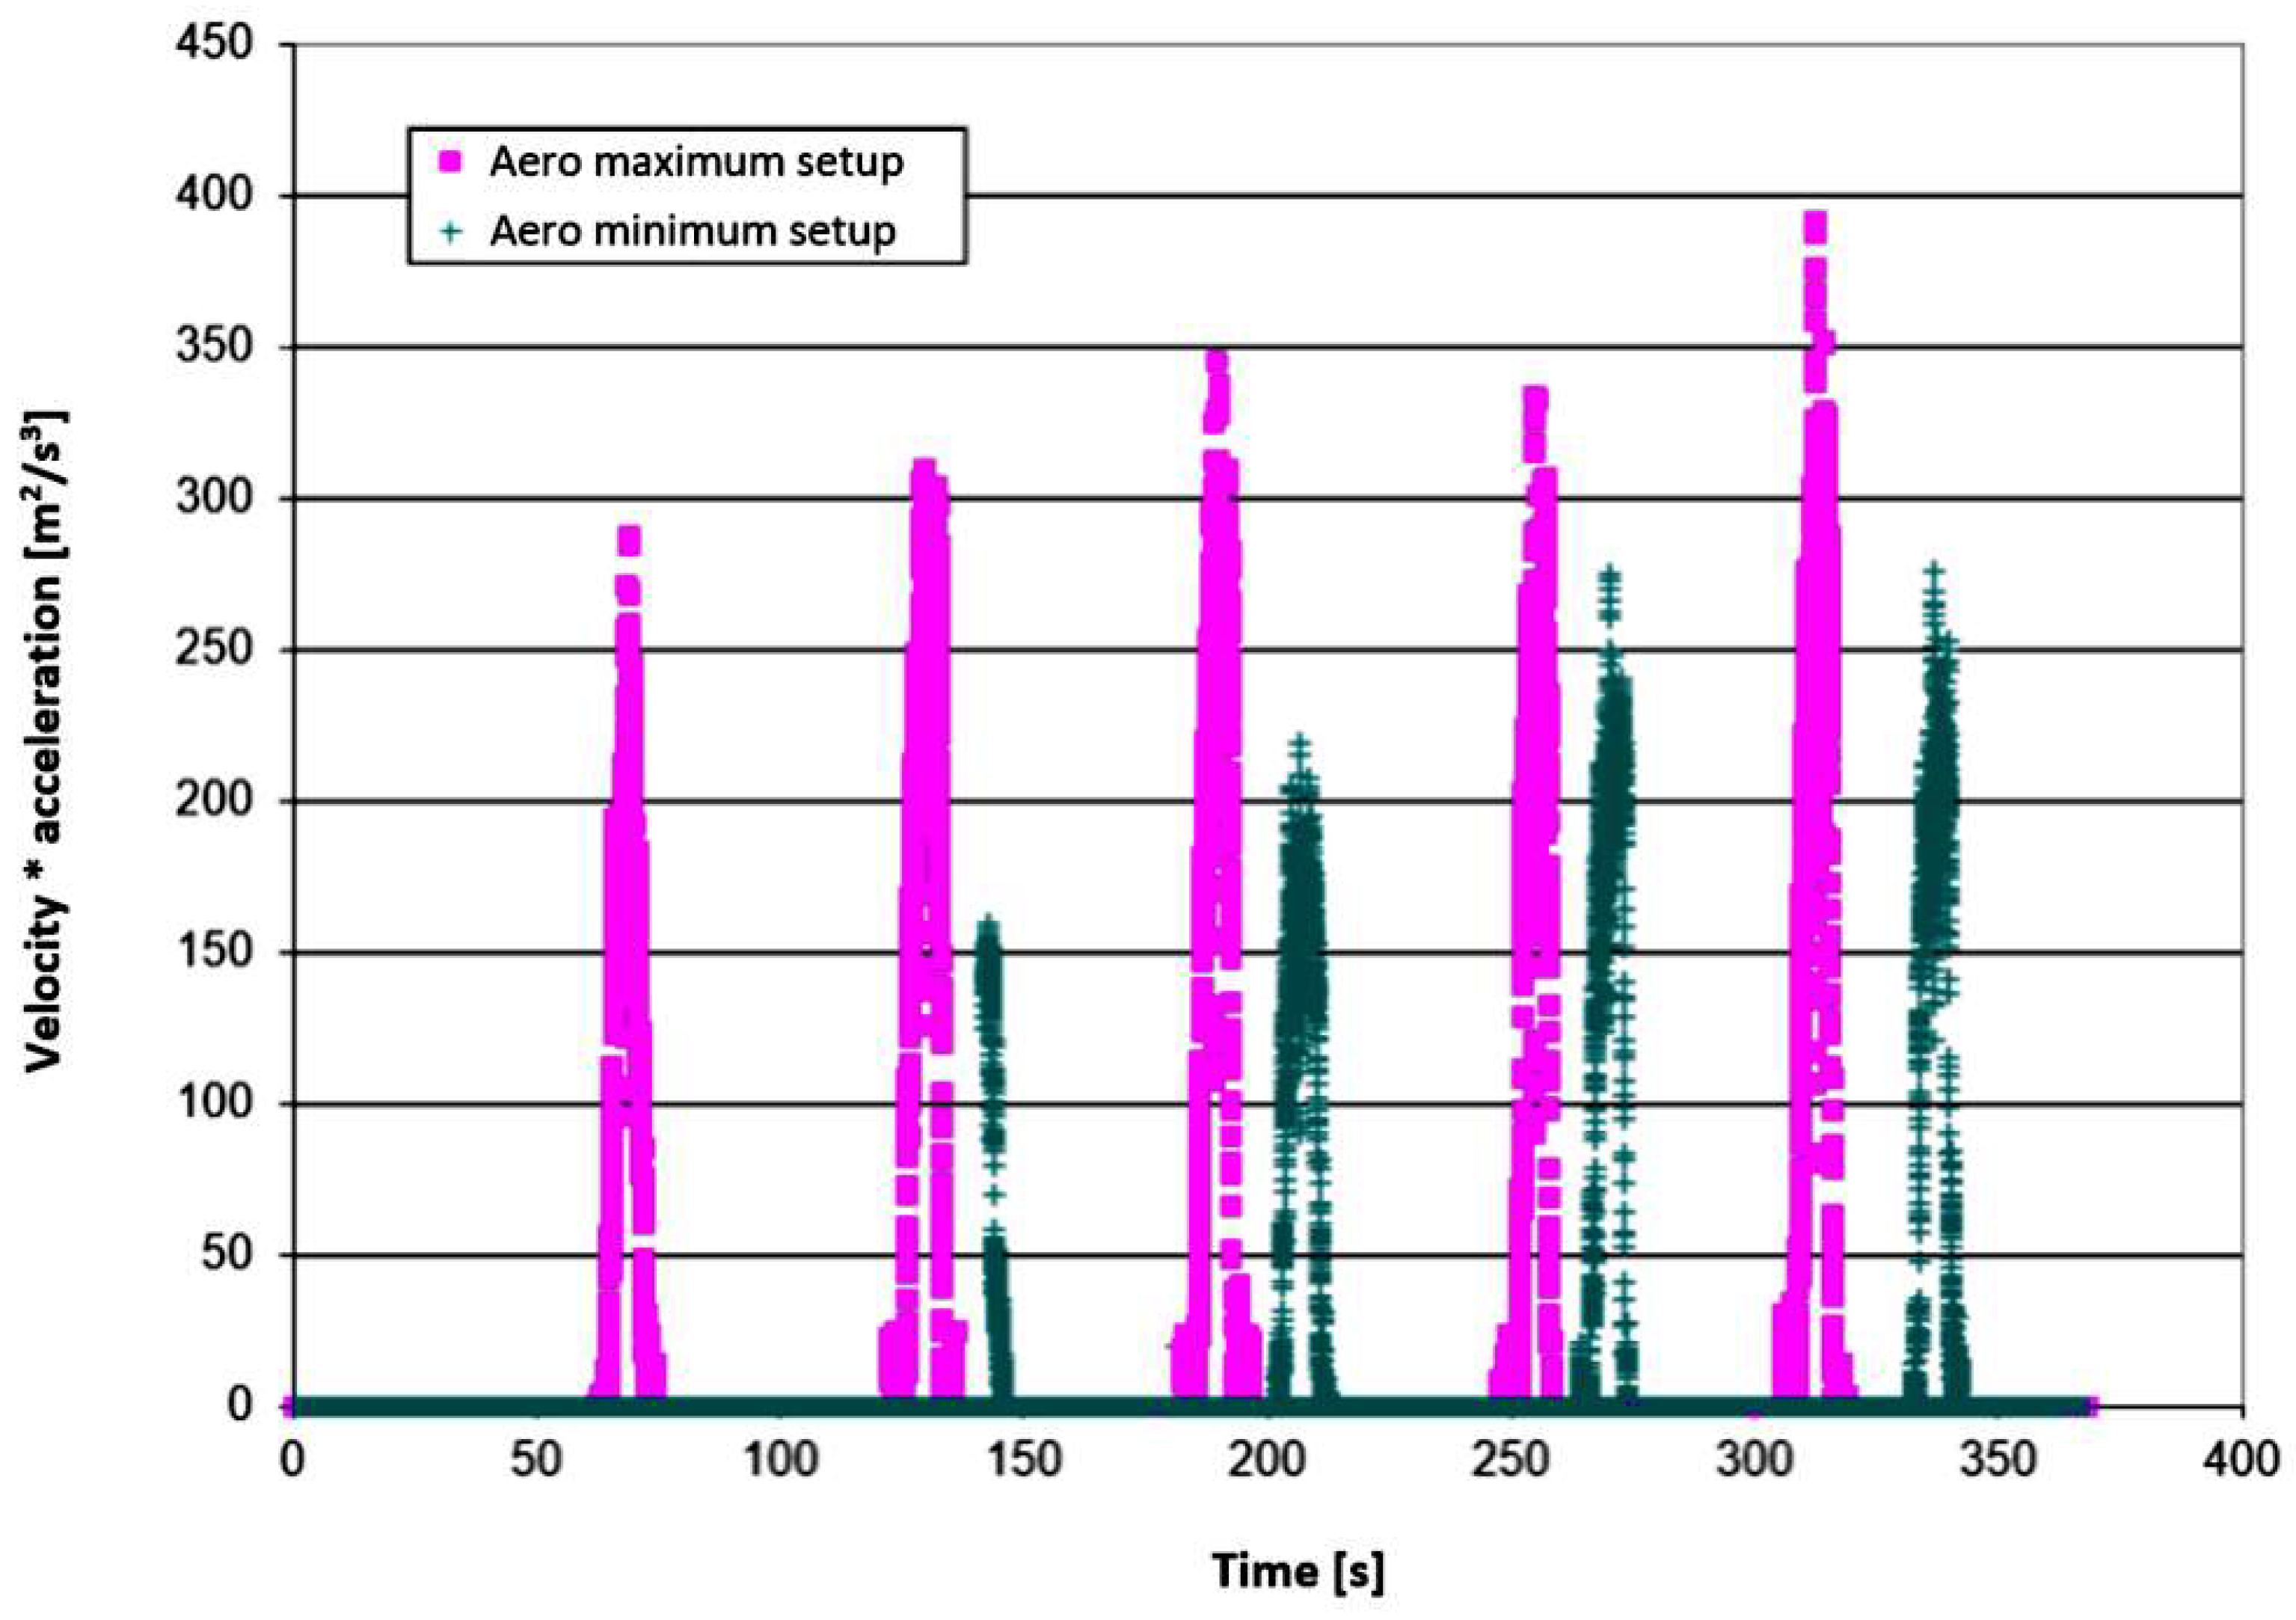
  • Aerodynamic elements set to minimum-speed of 31.6 m/s (113.8 km/h)—this is the reference speed;
  • Using only the extended wing-speed 33 m/s (118.8 km/h)—increase by 4% in relation to the reference speed;
  • Using the wing, under-wing support plate and Gurney flap-speed of 35.8 m/s (128.9 km/h), which is more than a 13% increase in speed relative to the reference speed.
The lateral acceleration-velocity plot shows an increase in speed in the corners (both left and right) with aerodynamic components, due to gaining more grip due to increased aerodynamic downforce, resulting in greater driver confidence.
The situation described suggests that a greater safety margin can be achieved by activating the moving aerodynamic elements. In order to separate the test results from the instantaneous values of the trajectory radii, a new parameter relating lateral accelerations to the driving speed was proposed, which is the product of lateral acceleration and speed.
Figure 37 shows the values of this parameter during the test curve. As can be seen, this parameter is significantly higher during runs with fully active aerodynamics. During the airport tests, information was obtained about the effects of moving the aerodynamic elements in extreme positions. It was shown that additional aerodynamic elements significantly affect the vehicle handling characteristics and increase the driving safety margin. The developed and constructed programmable electronic measurement and control system, which records information about the state of vehicle motion, can realize various control scenarios depending on the needs and applied actuators.
Our goal is not to persuade drivers to drive faster. Rather, our aim was to show that the use of movable aerodynamic elements leaves a wider margin of safety in a situation where there are, locally, surfaces with reduced grip on the road.

6. Conclusions

  • A wing positioned obliquely at the rear of the car body responds poorly to the flow asymmetry caused by the vehicle’s curved motion. The generated lateral force is less than expected. The aerodynamic downforce is slightly reduced.
  • A very effective movable aerodynamic element is support (booster) plate placed under the wing, improving its flow and aerodynamic characteristics at high angles of attack. Such a role seems to be fulfilled by the lower wing in the Bugatti Veyron [33].
  • Movable aerodynamic elements placed behind the axis of the rear wheels play the role of elements that increase the downforce of the rear wheels but at the same time reduce the downforce of the front wheels.
  • The splitter placed under the front part of the body partly balances the car aerodynamically by relieving the pressure on the front axle.
  • The data contained in the works [18,19], show that the shortest times on race tracks are obtained for rear axle aerodynamic loads within 55–70% of the total downforce. Movable aerodynamic elements allow dynamic adjustment of this downforce. Large range of rear-wheel downforce changes allows for aerodynamic balancing of dynamic front wheel loading during sudden braking.
  • Test drives with the twisted rear wing through a test curve with a radius of 90 m could be performed at a speed of 13% higher than without it. The calculations showed a generation of only slight side force by the twisted rear wing. It, therefore, appears that the increase in speed was due to an increased sense of better wheel grip, mainly due to increased aerodynamic downforce applied to the rear axle rather than the generation of lateral force.
  • The computational results showed that it is difficult to obtain significant aerodynamic downforce for the front axle wheels. The splitter located at the front under the body generates downforce, but its magnitude depends on its surface area.
  • Movable aerodynamic elements can change the aerodynamic characteristics of a car within a wide range, but they can be most effective when coupled to a GPS system with a programmed route, which would enable their predictive actuation.

Author Contributions

Conceptualization, J.R.P.; methodology, J.R.P. and J.B.; software, J.R.P., K.K. (Krzysztof Kurec), A.P., K.K. (Krzysztof Kurec) and K.K. (Konrad Kamieniecki); validation, A.P. and J.R.P.; formal analysis, J.R.P.; investigation, J.R.P., K.K. (Krzysztof Kurec) and A.P.; road tests, P.B., M.R. and J.R.P.; resources, J.R.P., K.K. (Konrad Kamieniecki); data curation, J.R.P. and K.K. (Krzysztof Kurec); writing—original draft preparation, J.R.P., writing—review and editing, J.R.P., K.K. (Krzysztof Kurec), M.R.; visualization, J.R.P., K.K. (Krzysztof Kurec) and A.P.; supervision, J.R.P. All authors have read and agreed to the published version of the manuscript.

Funding

This project was funded by the National Center for Research and Development (Narodowe Centrum Badań i Rozwoju), grant number PBS3/B6/34/2015, “The active system of car body oscillation damping”.

Institutional Review Board Statement

Not applicable.

Informed Consent Statement

Not applicable.

Data Availability Statement

Not applicable.

Acknowledgments

The authors thank Arrinera SA for allowing the geometry of the Hussarya vehicle to be used to perform the aerodynamic analyses presented in this paper.

Conflicts of Interest

The authors declare no conflict of interest.

References

  1. Keogh, J.; Barber, T.; Diasinos, S.; Doig, G. Techniques for Aerodynamic Analysis of Cornering Vehicles. SAE Technical Paper 2015-01-0022. In Proceedings of the 18th Asia Pacific Automotive Engineering Conference, Melbourne, Australia, 10–12 March 2015. [Google Scholar] [CrossRef]
  2. Keogh, J.; Barber, T.; Diasinos, S.; Graham Doig, G. A New Type of Wind Tunnel for the Evaluation of Curved Motion. Available online: https://www.researchgate.net/publication/310330442_ (accessed on 30 October 2021).
  3. Nakashima, T.; Mutsuda, H.; Kanehira, T.; Tsubokura, M. Fluid-Dynamic Force Measurement of Ahmed Model in Steady -State Cornering 3. Energies 2020, 13, 6592. [Google Scholar] [CrossRef]
  4. Nakashima, T.; Tsubokura, M.; Okada, Y.; Nouzawa, T.; Kono, R.; Doi, Y. Aerodynamic Characteristics of a Road Vehicle in Steady State Cornering. In Proceedings of the ASME-JSME-KSME 2015 Joint Fluids Engineering Conference AJKFluids2015, Seoul, Korea, 26–31 July 2015. AJKFluids2015-17553. [Google Scholar]
  5. Okada, Y.; Nakashima, T.; Tsubokura, M.; Morikawa, Y.; Kouno, R.; Okamoto, S.; Matsuhiro, T.; Nouzawa, T. Aerodynamics Evaluation of Road Vehicles in Dynamic Maneuvering. SAE Technical Paper 2016-01-1618. In Proceedings of the SAE 2016 World Congress and Exhibition, Detroit, MI, USA, 12–14 April 2016. [Google Scholar] [CrossRef]
  6. Patel, D.; Garmory, A.; Passmore, M. The Effect ofCornering on the Aerodynamics of a Multi-Element Wing in Ground Effect. Fluids 2021, 6, 3. [Google Scholar] [CrossRef]
  7. Nara, K.; Tsubokura, M.; Ikeda, J.; Fasel, U.; Takemoto, T.; Nakashima, T.; Yoshihiro Sasaki, Y. Numerical Analysis of Unsteady Aerodynamics of Formula Car during Dynamic Cornering Motion. In Proceedings of the 32nd AIAA Applied Aerodynamics Conference, Atlanta, GA, USA, 16–20 June 2014. [Google Scholar]
  8. Watanabe, K.; Matsuno, K. Moving computational domain method and its application to flow around a high-speed car passing through a hairpin curve. J. Comput. Sci. Technol. 2009, 3, 449–459. [Google Scholar] [CrossRef] [Green Version]
  9. Josefsson, E.; Hagvall, R.; Urquhart, M.; Sebben, S. Numerical Analysis of Aerodynamic Impact on Passenger Vehicles during Cornering. SAE Technical Paper 2018-37-0014. In Proceedings of the CO2 Reduction for Transportation Systems Conference, Torino, Italy, 6–8 June 2018. [Google Scholar] [CrossRef] [Green Version]
  10. Keogh, J.; Graham Doig, G.; Tracie, J.; Barber, T.J.; Sammy Diasinos, S. The Aerodynamics of a Cornering Inverted Wing in Ground Effect. Appl. Mech. Mater. 2014, 553, 205–210. [Google Scholar] [CrossRef] [Green Version]
  11. Okada, Y.; Nouzawa, T.; Okamoto, S.; Fujita, T.; Kamioka, T.; Tsubokura, M. Unsteady Vehicle Aerodynamics during a Dynamic Steering Action: 1st Report, On-Road Analysis. SAE Technical Paper Series. In Proceedings of the SAE 2012 World Congress & Exhibition, Detroit, MI, USA, 24–26 April 2012. [Google Scholar] [CrossRef]
  12. Tsubokura, M.; Ikawa, Y.; Nakashima, T.; Okada, Y.; Kamioka, T.; Nouzawa, T. Unsteady Vehicle Aerodynamics during a Dynamic Steering Action: 2nd Report, Numerical Analysis. SAE Int. J. Passeng. Cars-Mech. Syst. 2012, 5, 340–357. [Google Scholar] [CrossRef]
  13. Roberts, L.S.; Joao Correia, J.; Mark, V.; Finnis, M.V.; Kevin Knowles, K. Aerodynamic characteristics of a wing & flap configuration in ground effect & yaw. Proc. Inst. Mech. Eng. Part D J. Automob. Eng. 2015, 230, 841–854. [Google Scholar] [CrossRef]
  14. Keogh, J.; Doig, G.; Diasinos, S.; Barber, T. The influence of cornering on the vortical wake structures of an inverted wing. Proc. IMechE Part D J. Automob. Eng. 2015, 229, 1817–1829. [Google Scholar] [CrossRef] [Green Version]
  15. Gogel, D.; Sakurai, H. The Effects of End Plates on Downforce in Yaw. SAE Technical Paper Series 2006-01-3647x. In Proceedings of the Motorsports Engineering Conference & Exposition, Dearborn, MI, USA, 5–7 December 2006; Available online: https://www.sae.org/publications/technical-papers/content/2006-01-3647/ (accessed on 1 January 2021).
  16. Winkelmann, H. Aerodynamics of the New BMW Z4. In Proceedings of the MIRA International Vehicle Aerodynamics Conference, Gaydon, UK, 25–26 October 2002. [Google Scholar]
  17. Katz, J. Aerodynamics of Race Cars. Annu. Rev. Fluid Mech. 2006, 38, 27–63. [Google Scholar] [CrossRef] [Green Version]
  18. Dominy, J.A.; Dominy, R.G. Aerodynamic Influences on the Performance of the Grand Prix Racing Car. Proc. Inst. Mech. Eng. Part D: J. Automob. Eng. 1984, 198, 87–93. [Google Scholar] [CrossRef]
  19. Dominy, R.G. Aerodynamics of Grand Prix Cars. Proc. Inst. Mech. Eng. Part D: J. Automob. Eng. 1992, 206, 267–274. [Google Scholar] [CrossRef]
  20. Lin, M.; Papadopoulos, P. Aerodynamic Benefits of Oblique Wing Geometry for Race Cars by CFD Analysis. In Proceedings of the 26th Annual Conference of the Computational Fluid Dynamics Society of Canada (CFD2018), Winnipeg, MB, Canada, 10–12 June 2018. [Google Scholar]
  21. Broniszewski, J.; Piechna, J. A fully coupled analysis of unsteady aerodynamics impact on vehicle dynamics during braking. Eng. Appl. Comput. Fluid Mech. 2019, 13, 623–641. [Google Scholar] [CrossRef]
  22. Savkoor, A.R.; Chou, C.T. Application of Aerodynamic Actuators to Improve Vehicle Handling. Veh. Syst. Dyn. Int. J. Veh. Mech. Mobil. 1999, 32, 345–374. [Google Scholar]
  23. How This Hypercar’s Tilting Wing Gives It More Grip. Available online: https://www.youtube.com/watch?v=OaItQaSlSxs (accessed on 30 October 2021).
  24. Zenvo’s Crazy Tilting Rear Wing Would Make a Car Handle Worse. Available online: https://www.roadandtrack.com/new-cars/car-technology/a21081048/zenvos-tsrs-rear-wing-analysis/ (accessed on 30 October 2021).
  25. Kurec, K.; Piechna, J. Influence of Side Spoilers on the Aerodynamic Properties of a Sports Car. Energies 2019, 12, 4697. [Google Scholar] [CrossRef] [Green Version]
  26. Remmerie, W.R.J. Vehicle with Lateral Force Generation. Patent WO2013/049900A1, 11 April 2013. [Google Scholar]
  27. Maho, H. Concepts for Generating Lateral Aerodynamic Forces by Means of an Asymmetric Airflow. Available online: https://airshaper.com/research/sports-car-lateral-aerodynamics (accessed on 30 October 2021).
  28. Kurec, K.; Remer, M.; Mayer, T.; Tudruj, S.; Piechna, J. Flow control for a car-mounted rear wing. Int. J. Mech. Sci. 2019, 152, 384–399. [Google Scholar] [CrossRef]
  29. Piechna, J. A Review of Active Aerodynamic Systems for Road Vehicles. Energies 2021, 14, 7887. [Google Scholar] [CrossRef]
  30. Wang, Q.; Wu, Z.; Zhu, X.; Liu, L.; Zhang, Y. Analysis of Aerodynamic Performance of Tesla Model S by CFD. In Proceedings of the 3rd Annual International Conference on Electronics, Electrical Engineering and Information Science (EEEIS 2017), Guangzhou, China, 8–10 September 2017. [Google Scholar]
  31. Zhang, C.; Bounds, C.P.; Foster, L.; Uddin, M. Turbulence modeling effects on the CFD predictions of flow over a detailed full-scale sedan vehicle. Fluids 2019, 4, 148. [Google Scholar] [CrossRef] [Green Version]
  32. Szudarek, M.; Piechna, J. CFD Analysis of the Influence of the Front Wing Setup on a Time Attack Sports Car’s Aerodynamics. Energies 2021, 14, 7907. [Google Scholar] [CrossRef]
  33. Bugatii Veyron 16.4 Super Sport-Technical Specifications. Available online: https://assets.bugatti.com/fileadmin/media/Media/Veyron/Super_Sport/Technical_Specifications_Bugatti_Veyron_16.4_Super_Sport.pdf (accessed on 30 October 2021).
Figure 1. Solution of movable rear wing realized by Zenvo.
Energies 15 00689 g001
Figure 2. Basic version of supercar geometry.
Energies 15 00689 g002
Figure 3. Size of the arch computational domain with length L = 4.75 m, height H = 1.2 m, and width W = 2.05 m.
Energies 15 00689 g003
Figure 4. Visualization of the ratio of computational domain size to car size.
Energies 15 00689 g004
Figure 5. Exemplary mesh.
Energies 15 00689 g005
Figure 6. Exemplary y+ distribution.
Energies 15 00689 g006
Figure 7. Grid independence study for three elementary car geometries.
Energies 15 00689 g007
Figure 8. Prototype of GT version in MIRA wind tunnel and pressure distribution being the result of CFD simulations.
Energies 15 00689 g008
Figure 9. A view of the retracted spoiler, with the plate just below it.
Energies 15 00689 g009
Figure 10. Relation between the spoiler and supporting plate inclination.
Energies 15 00689 g010
Figure 11. Rear view of the car with spoiler and booster plate (red element) in the aerodynamic braking setup.
Energies 15 00689 g011
Figure 12. Aerodynamic characteristics Cx and Cl of the car with the spoiler and with the additional booster plate as a function of the spoiler setting angle.
Energies 15 00689 g012
Figure 13. Spoiler and booster flap surface pressure distributions for a spoiler angle of 30 degrees.
Energies 15 00689 g013
Figure 14. Pressure and velocity distribution around splitter (top—without support plate, and bottom—with support plate).
Energies 15 00689 g014
Figure 15. Visualization of the spoiler with the Gurney flap extended, left spoiler with the Gurney flap retracted, right with it extended.
Energies 15 00689 g015
Figure 16. Pressure and velocity distributions around the spoiler without the Gurney flap and with the flap extended when the spoiler is set at 10 degrees.
Energies 15 00689 g016
Figure 17. Vehicle geometry with a slanted wing at the rear and a splitter under the front of the body.
Energies 15 00689 g017
Figure 18. Pressure distributions on wing airfoil surfaces in the configuration with an inactive Gurney flap.
Energies 15 00689 g018
Figure 19. Pressure distributions on the upper and lower surfaces of the wing in its plane of symmetry and on the lower surface.
Energies 15 00689 g019
Figure 20. Pressure distribution on car in different views.
Energies 15 00689 g020
Figure 21. Velocity distributions in several cross sections of the wing.
Energies 15 00689 g021
Figure 22. Pressure 0distributions on the car surface and the iso-surface dimensionless. parameter Q = 0.1 in the braking wing configuration obtained from the RANS simulations.
Energies 15 00689 g022
Figure 23. Pressure distribution in the plane of symmetry on the surface of the car and the wing for different angles of attack of the wing.
Energies 15 00689 g023
Figure 24. Comparison of aerodynamic coefficients of car with wing in three configurations: SW23R9P25-wing tilted 9 degrees, angle of attack 23 degrees, booster plate angled at 25 degrees, SW23R9P25-wing tilted 9 degrees, angle of attack 23 degrees, booster plate angled at 40 degrees, and SW60R9P40-wing tilted 9 degrees, angle of attack 60 degrees, and booster plate angled at 40 degrees.
Energies 15 00689 g024
Figure 25. Comparison of aerodynamic coefficient values caused by the addition of the splitter and the change of booster plate angles during the 90 m radius curve. (no splitter and no supporting plate, CP0 with splitter and supporting plate at 0 deg, CP25 with splitter and supporting plate at 25 deg, CP50 with splitter and supporting plate at 50 deg).
Energies 15 00689 g025
Figure 26. Influence of the supporting plate angle and wing twist angle-cornering.
Energies 15 00689 g026
Figure 27. Pressure distributions on the car surface and the iso-surface of dimensionless parameter Q = 0.15 during cornering (R = 90 m) obtained from the RANS simulations.
Energies 15 00689 g027
Figure 28. Influence of the state of the Gurney flap on aerodynamic characteristics of cornering car.
Energies 15 00689 g028
Figure 29. Comparison of vehicle characteristics in three configurations during straight and curved 90 m run.
Energies 15 00689 g029
Figure 30. Structure of the data acquisition and control system.
Energies 15 00689 g030
Figure 31. Photographs of the vehicle prepared for passage in two different configurations. Asymmetrically inclined wing for cornering configuration (left) and braking configuration (right).
Energies 15 00689 g031
Figure 32. Rear aerodynamic add-ons: inverted wing, support (booster) plate, and movable Gurney flap (top configuration—maximum, and bottom configuration—minimum).
Energies 15 00689 g032
Figure 33. Trajectories of the test vehicle with minimum and maximum aerodynamic setups.
Energies 15 00689 g033
Figure 34. Parameters of the vehicle registered for minimum and maximum aerodynamic setup (MA). Steering wheel angle, yaw angle, and velocity are presented for described maneuvers. Longitudinal velocity is multiplied by 10.
Energies 15 00689 g034
Figure 35. G-G diagram of lateral and longitudinal accelerations occurring during curved driving with a vehicle without active aerodynamic elements and setup with tail-wing and active additional aerodynamic elements.
Energies 15 00689 g035
Figure 36. Relationship between lateral accelerations and the travel speed for configurations without aerodynamic and fully active aerodynamics (green line tire friction coefficient = 0.8 limit).
Energies 15 00689 g036
Figure 37. The product of the speed and the lateral acceleration during the passage through the curve.
Energies 15 00689 g037
Table 1. Parameters of the car without spoiler and without splitter.
CxCyCzCmxCmyCmzCzfCzr
0.3−0.00440.0145−0.00410.022−0.0178−0.02650.0410
Table 2. Parameters of the car with tilted wing.
Fx
(N)
Fy
(N)
Fl
(N)
Mx
(Nm)
My
(Nm)
Mz
(Nm)
CdCyCzCmxCmyCmz
Tilted wing925234−1001270−18174400.4450.113−0.4820.130−0.8760.212
Table 3. Parameters of the car with tilted wing at two angles of attack.
Tilted WingCxCyCzCmxCmyCmzCzfCzr
AOA 7°0.6060.036−0.674−0.031−0.8610.0001.070−1.744
AOA 14°0.5890.040−0.702−0.031−0.822−0.0061.040−1.742
Difference (%)2.77−8.62−4.07−0.844.79−102.022.940.11
Table 4. Parameters of the car model with blocked wheels and rotating wheels.
CxCyCzCmxCmyCmzCzfCzr
steady wheels0.6060.036−0.674−0.031−0.8610.0001.070−1.744
rotating wheels0.5890.040−0.702−0.031−0.822−0.0061.040−1.742
Difference (%)2.77−8.62−4.07−0.844.79−102.022.940.11
Publisher’s Note: MDPI stays neutral with regard to jurisdictional claims in published maps and institutional affiliations.

