Article

Pollutant Emissions during Oxy-Fuel Combustion of Biomass in a Bench Scale CFB Combustor

by
Monika Kosowska-Golachowska
1,*,
Adam Luckos
2 and
Agnieszka Kijo-Kleczkowska
1
1
Department of Thermal Machinery, Czestochowa University of Technology, Armii Krajowej 21, 42-201 Czestochowa, Poland
2
School of Chemical and Metallurgical Engineering, University of the Witwatersrand, Braamfontein Campus East, Johannesburg 2050, South Africa
*
Author to whom correspondence should be addressed.
Energies 2022, 15(3), 706; https://doi.org/10.3390/en15030706
Submission received: 5 December 2021 / Revised: 11 January 2022 / Accepted: 14 January 2022 / Published: 19 January 2022
(This article belongs to the Special Issue NOx, PM and CO2 Emission Reduction in Fuel Combustion Processes)

Abstract

:
Nowadays oxy-fuel combustion of coal and biomass is the most promising option for the reduction of CO2 emissions from power plants. In this paper, emissions of NOx (NO, NO2, N2O and their precursors, such as NH3 and HCN), SO2 and CO during conventional and oxy-fuel combustion of three kinds of biomass (agro, woody and energy crop) and a reference coal are presented and discussed. Combustion tests were conducted at 850 °C in the laboratory-scale circulating fluidized bed (CFB) reactor in air and O2/CO2 atmospheres. A FTIR spectrometer was used to measure instantaneous concentrations of all pollutants in the flue gas. Emissions of SO2, N2O and CO for the combustion of biomass in all atmospheres were lower than those for the combustion of reference coal. It was found that oxidation of nitrogen species released with volatile matter was responsible for high emissions of NOx during combustion of biomass fuels in air and mixtures of O2 and CO2. The lowest NO emissions for tested fuels were detected in oxy-21 atmosphere (21% O2/70% CO2). Oxy-combustion of biomass in O2/CO2 mixtures at 30% and 40% O2 caused a decrease in emissions of N2O and CO while NO and SO2 emissions increased. The results of this study show that the tested biomass fuels are ideal renewable energy resources both in conventional and oxy-fuel conditions with a minor potential for environmental pollution.

Graphical Abstract

1. Introduction

Utilization of fossil fuels, mainly coal, for power generation is associated with emissions of large quantities of carbon dioxide—a greenhouse gas responsible for global warming and climate change. As the world will still depend on coal for several decades to come, it is necessary to develop technologies such as carbon capture and storage (CCS) to significantly reduce emissions of CO2 and avoid negative consequences of global warming. Among CCS technologies, oxy-fuel combustion emerges as a technically feasible and cost-effective option for the reduction of CO2 emissions from coal-fired power plants [1,2,3]. When combined with co-firing of biomass—a renewable carbon-neutral fuel—it can offer negative CO2 emissions [4,5,6].
In an oxy-fuel combustion system, fuel is burned in a mixture of oxygen and recycled flue gas. As molecular nitrogen is eliminated from the oxidizing medium, the flue gas consists mainly of CO2 and water vapor. Partial recirculation of flue gas is necessary to control the combustion temperature in the boiler. Substituting recycled flue gas for N2 in the oxidizing medium leads to a smaller exhaust gas stream, higher boiler efficiency and lower NOx emissions [3].
Nowadays, pulverized coal (PC) combustion is the dominant technology of heat and power generation in utility and industrial sectors. However, circulating fluidized-bed (CFB) combustion gains popularity, particularly for the utilization of low quality, high-ash coals, and discards. Today, high-efficiency, utility CFB units with supercritical steam parameters and electric outputs up to 600 MW are available commercially. Fluidized bed combustion is also considered the best available co-firing technology [4,7,8,9]. Co-firing of coal and biomass in an oxy-CFB boiler has been demonstrated at the 30 MWth scale at Fundación Ciudad de la Energía (CIUDEN) in Spain [10,11].
In the case of oxy-combustion, CFB boilers have a few advantages over PC counterparts. The combustion temperature in oxy-CFB systems can be controlled by cooling (in an external heat exchanger) and recycling a part of circulating solid particles. This reduces the stream of recirculated flue gas and makes an oxy-CFB boiler smaller, more efficient, and cheaper. Due to lower combustion temperature, oxy-CFB units can meet NOx and SOx emission limits without additional de-NOx and de-SOx systems. Moreover, the oxy-CFB technology does not require sophisticated burner and fuel feeding systems.
A significant progress has been made in the case of oxy-combustion in PC boilers. However, to date, only a few studies have been published on combustion or co-combustion of biomass and coal in oxy-fuel fluidized-bed combustors. Some few among them are devoted to the formation and emissions of pollutants such as NOx, SO2 and CO.
Carbon dioxide storage/sequestration requires a gas stream with 95% or more CO2 purity. To achieve that a CO2 processing unit (CPU) is employed for drying, cleaning and compression of the exhaust gas. The presence of impurities affects the design and energy consumption in the CPU. The impurities of interest are O2, N2 and Ar supplied by the ASU and related to the purity of oxygen produced and excess O2 used in the oxy-combustion system. They also include NOx, SO2 and other N- and S-containing gases such as HCN, NH3, COS and H2S. Therefore, the knowledge on pollutant formation and their concentration in the flue gas is of crucial importance for the proper design of the CPU and assessment of its performance and cost.
In this study, combustion tests of three kinds of biomass (agricultural, woody and energy crop) and a reference coal were carried out in the laboratory-scale CFB reactor at 850 °C. Concentrations of NOx (NO, NO2, N2O and their precursors, such as NH3 and HCN), SO2 and CO were measured online during conventional and oxy-fuel combustion. The main objective was to assess the influence of oxidizing atmosphere and composition of tested biomass on the formation mechanism and emissions of pollutants. A comparison with emissions from bituminous coal can be useful to determine emission levels in the case of co-firing coal and biomass.
The study revealed that oxidation of nitrogen species released with volatile matter was responsible for high emissions of NOx during combustion of biomass fuels in air and mixtures of O2 and CO2. Emissions of SO2, N2O and CO for the combustion of biomass in all atmospheres were lower than those for the combustion of reference coal. Oxy-combustion of biomass in O2/CO2 mixtures at 30% and 40% O2 caused a decrease in emissions of N2O and CO while NO and SO2 emissions increased.

2. Literature Review

This short literature review is devoted to pollutant emissions from oxy-combustion of biomass fuels in fluidized-bed systems. The only exception is the study by Gao and co-workers [12] that was carried out in a TG-MS system with algae Chlorella vulgaris, a promising biofuel for “green” electricity generation.
Tan and co-workers [13] conducted oxy-combustion co-firing tests with different coals and wood pellets in the CanmetENERGY 800 kWth CFB combustor (406 mm ID). The fraction of cofired biomass was in the range 20–50%wt. The combustion characteristics, pollutant and trace metals emissions were measured at O2 concentration in the combustion gas between 24 and 25%vol. The authors concluded that the addition of wood pellets did not have a significant influence on combustion conditions. Emissions of NO were in a narrow range of 14–20 ng/J of heat input. All tests were carried out with the addition of limestone at the Ca/S ratio of 3. Emissions of SO2 varied from 35 to 95 ng/J of heat input. Concentrations of CO were stable and below 200 ppm when the O2 concentration in the flue gas exceeded 3.5%. In all tests, the NO and SO2 emission rates were below limits set by Canada and the UE.
Duan and co-workers [5] investigated NO emissions during oxy-fuel co-firing of biomass (rice husk, wood chips and dry wood flour) and bituminous coal in a 10 kWth CFB combustor (65 mm ID, 2.3 m height). The ratio of biomass in the fuel blend was in the range 0–100%wt. All tests were carried out at the same conditions—bed temperature 850 °C, excess oxygen 5% and primary O2 fraction 0.7. In the case of single fuel combustion, NO emissions were in the range 56–195 mg/m3n and they were greater for biomass fuels with the highest value observed for rice husk and the lowest for wood chips. Oxy-fuel combustion produced less NO than combustion in air. The conversion of fuel-N to NO increased with increasing H/N mass ratio in tested fuel. In the case of co-firing biomass and coal, NO emissions increased with increasing fraction of biomass in the fuel blend for all biomass fuel tested under air and oxy-fuel conditions.
Lupiáñez and co-workers [14] studied oxy-combustion of anthracite and corn stover blends in a laboratory-scale bubbling fluidized bed combustor (203 mm ID, 2.5 m height) with thermal input around 30 kW. Combustion tests at bed temperatures 850–900 °C in air and 30/70% mixtures of O2 and CO2 were carried out with 80/20 blends (on energy basis) of coal and biomass. In two tests, limestone was added for the in situ SO2 capture at the Ca/S molar ratio of 2.5. Measurements of the flue gas composition revealed that emissions of SO2 (corrected to 6% O2 and normalized to mg/MJ) were in the range from 105 (oxy-combustion at 870 °C) to 906 mg/MJ (air combustion at 860 °C). These emissions were related to the chlorine content in corn stover; the higher the Cl content in corn stover the lower the SO2 emission. The desulphurization efficiency exceeding 80% was achieved with limestone addition. Emissions of NO were not influence by the Cl in corn stover and they were in the range from 68–172 mg/MJ. According to the authors, the expected reduction in NO emissions during oxy-firing was not observed, owing to the higher excess of O2. Finally, it was concluded that the influence of coal/biomass ratio on NO emissions was negligible. The catalytic activity of limestone and higher O2 excess were responsible for the larger conversion of fuel-N to NO during oxy-combustion tests.
In the subsequent studies [15,16] Lupiáñez and co-workers investigated the influence of limestone on gaseous emissions during oxy-combustion of lignite and corn stover in the fluidized-bed combustor described in the previous paper. The author founded that the SO2 capture was influence by the limestone type and fragmentation of its particles. Emissions of SO2 decreases with the Ca/S ratio and bed temperature. On the other hand, emissions of NO increased with Ca/S ratio and the presence of calcined limestone in the bed. They were more influenced by the excess of O2 and CO concentration in the bed than by the biomass share in the blend or chlorine content in the fuel.
Pu and co-workers [17] studied the influence of oxygen concentration in the oxidizing medium (O2/CO2 mixture with O2 concentrations in the range 21–40%) on NO emissions in a lab-scale bubbling fluidized-bed combustor at 850–950 °C. Combustion tests were carried out with 2 g samples of anthracite and anthracite blended with 10–30%wt. of pine powder. At 900 °C, the conversion rate of fuel-N to NO increased with increasing O2 concentration from 40.4% to 42.6% in the case of anthracite and from 35.1% to 41.2% in the case of 20% pine powder blend. Tests with 35% O2/65% CO2 at different temperatures revealed a slight increase in NO emissions with increasing temperature in the case of anthracite. The opposite trend was observed for the blend containing 20% pine powder. The total NO emission was reduced from 12.48 mg at 850 °C to 11.46 mg at 950 °C which corresponded to a 3.4% decrease in the fuel-N conversion to NO. The influence of pine powder fraction in the blend was studied at 950 °C with 35% O2 in the O2/CO2 mixture. It was found that the addition of pine powder reduced the NO emission and fuel-N conversion to NO. The fuel-N conversion decreased from 42.9% in the case of anthracite to 37.8% in the case of blend containing 30% pine powder.
Wang and co-workers [18] investigated nitrogenous gas (NO, N2O, HCN) emissions from co-combustion of coal and biomass (corn straw and wheat straw) under oxy-fuel conditions with 50% oxygen concentration in the oxidizing medium. Tests were carried out in a 100 kW CFB combustor with blends containing 30% biomass and in atmospheres containing O2/CO2 and O2/recycled flue gas mixtures (RFG) at temperatures 800–900 °C. As expected, the NO and N2O emissions increased with increasing excess oxygen in the oxidizing medium. Tests with different fractions of corn straw in the fuel (10, 20 and 30%) revealed an increase in emission factors of NO, N2O, HCN by 241, 238 and 249%, respectively. The results of tests with coal and wheat straw at 800 and 900 °C showed that the NO emission factor increased slightly with increasing temperature. On the other hand, the emission factors of N2O and HCN were lower at 900 °C than those at 800 °C.
Sher and co-workers [19] studied the influence of the oxidizing medium (air, O2/N2/CO2 mixtures) on gaseous emissions and temperature profile during combustion of miscanthus, straw pellets and wood pellets in a 20 kWth fluidized-bed combustor. The authors observed a significant decrease in CO emissions for all three fuels when O2 concentration in the oxy-fuel medium exceeded 25%. Emissions of NO decreased with increasing O2 concentration in the oxy-fuel medium and at 30% O2 they were like those for combustion in air. It was found that NO concentrations in the flue gas are related to the nitrogen content in the fuel tested.
Varol and co-workers [8] investigated oxy-fuel combustion of high-sulfur lignite and wood pellet blends (up to 60%) in a laboratory-scale (100 mm ID, 5.1 m height) CFB combustor. The main objective of their study was to determine the effect of biomass share on NOx, SO2 and CO emissions. The results showed that increasing biomass share in the fuel blend had a negligible influence on NOx emissions. Emissions of CO decreased slightly with an increase in biomass share. Concentrations of SO2 in the flue gas were related to the sulfur content in the fuel and they decreased with increasing biomass share in the blend.
Nguyen and co-workers [20] studied SO2, NO and CO emissions during co-combustion of lignite and wood pellets (50–100%wt. share in the fuel) in an oxy-fuel 100 kWth test facility. All tests were carried out with 25% oxygen in the oxidizing medium. An increase in biomass share caused a decrease in NO, SO2 and CO concentrations from 19.2 mg/MJ (corrected to 6% O2 in the flue gas) to 16.1 mg/MJ, 92.8 mg/MJ to 25.0 mg/MJ, and 7.5 mg/MJ to 5.5 mg/MJ, respectively. The authors concluded that oxy-combustion of pure biomass can lead to negative CO2 emissions of, approximately, −647 g/kWth.
Gao and co-workers [12] investigated pollutant formation during air and oxy-fuel combustion of microalgae Chlorella vulgaris and its blends with Chinese lignite in a TG-MS (thermogravimetry coupled with mass spectrometry) system. The presence of microalgae in the fuel blend during combustion in air resulted in lower emissions of CO2, CO and NO2, but in enhanced formation of NO, COS and SO2. Similar trend was observed in the case of oxy-fuel combustion of microalgae/lignite blends.
The main conclusions of the conducted review are summarized in Table 1.
Table 1. A summary of the literature review.
ReferenceTest Facility and ConditionsFuels TestedComposition of Oxidizing MediumEmissions ReportedRemarks
Tan et al. [13]CFB, 800 kWth, ~900 °C, limestone, Ca/S = 3Wood pellets, different coals, fraction of biomass in blends 20–50%wt.O2/CO2 mixtures, 24–25% O2, recycled flue gasNOx, SO2, CO, CO2, O2The addition of biomass did not have a significant influence on combustion conditions. Emissions of NO, SO2 and CO below the EU limits (200 ppm).
Duan et al. [5]CFB, 10 kWth, 850 ± 10 °CRice husk, wood chips, dry wood flour, bituminous coal, biomass/coal ratio 0–100%wt.Air, 70% O2/30% CO2 mixtureNO, NO2, CO, CO2, O2, SO2For single fuel combustion, emissions of NO were higher for biomass (the highest for rice husk) than for coal. Oxy- combustion produced less NO than combustion in air. NO emissions increased with increasing fraction of biomass in the fuel blend for all biomass fuels in air and oxy-fuel conditions.
Lupiáñez et al. [14]BFB *, 50 kWth, 850–900 °C, limestone, Ca/S = 2.5Corn stover, anthracite, biomass fraction in blend 0.2 (on energy basis)Air, 30% O2/70% CO2 mixtureNO, CO, CO2, O2, SO2No reduction in NO emissions during oxy-firing was observed. Influence of coal/biomass ratio on NO emissions was negligible. Emissions of SO2 higher in air than in oxy-combustion.
Lupiáñez et al. [15,16]BFB *, 50 kWth, 850–925 °C, limestone, Ca/S ratio: 2.5, 4, 6Corn stover, lignite, biomass fraction in blend 0.1 and 0.2Air, 35% O2/65% CO2, 30% O2/70% CO2NO, SO2, CO, CO2, O2, HClEmissions of NO increased with increasing Ca/S ratio. They were more influenced by the excess O2 and concentration of CO than by the biomass share in the fuel blend.
Pu et al. [17]BFB *, 850–950 °CPine powder, anthracite, biomass fraction in blend 0–30%wt.21–40% O2, CO2NO, NO2, CO, CO2, O2, SO2Concentration of NO increased with increasing initial concentration of O2 in the oxidizing medium. Addition of pine powder reduced the NO emission in the test at 950 °C with 35% O2 in the O2/CO2 mixture.
Wang et al. [18]CFB, 10 kWth, 800–900 °CCorn straw, wheat straw, coal, 30% biomass in blend50% O2/50% CO2, 50% O2/50% recycled flue gasNO, N2O, CO, CO2, O2, HCNNO and N2O emissions increased with increasing excess O2. An increase in the fraction of corn straw in the fuel blend caused an increase in emission factors of NO, N2O, and HCN.
Sher et al. [19]BFB *, 20 kWth, 800 °CMiscanthus, straw pellets, wood pelletsAir, O2/N2/CO2 mixtures: 21/22/57%, 24/25/52%, 27/28/45%NOx, CO, CO2, O2Emissions of CO and NO decreased with increasing concentration of O2 in the oxy-fuel medium. At 30% O2, emissions of NO were like those for combustion in air.
Varol et al. [8]CFB, 850 and 915 °C, limestone, Ca/S = 2Wood pellets, high-sulphur lignite, fraction of biomass in blend up to 60%25, 30% O2, CO2NOx, SO2, CO, CO2Increasing biomass share in the fuel blend had a negligible influence on NOx emissions. Emissions of CO and SO2 decreased with increasing fraction of biomass in the fuel blend.
Nguyen et al. [20]CFB, 100 kWthWood pellets, lignite, fraction of biomass in blend 50–100%wt.21–29% O2, CO2NO, SO2, COAn increase in biomass share caused a decrease in NO, SO2 and CO concentrations. Oxy-combustion of pure biomass can produce negative CO2 emissions of, approximately, –647 g/kWth.
Gao et al. [12]TG-MS **, non-isothermal tests, 20–800 °C, heating rates 5–15 K/minMicroalgae Chlorella vulgaris, lignite, 50/50 blends21% O2/79% N2, 21% O2/79% CO2CO, CO2, COS, NO, NO2, SO2The presence of microalgae in the fuel blend during combustion in air resulted in lower emissions of CO2, CO and NO2 but in enhanced formation of NO, COS and SO2. Similar trend was observed during oxy-combustion.
* BFB—bubbling fluidized-bed combustor, ** TG-MS—thermogravimetric analyzer with mass spectrometer.

3. Materials and Methods

3.1. Fuel Tested

Wheat straw (agricultural biomass), willow (Salix viminalis, energy crop biomass) and Scots pine (woody biomass) were used as primary fuels, and a Polish bituminous coal, combusted in CFB boilers, was chosen as the reference fuel.
The moisture content in biomass fuels was determined with the use of the oven-drying method, based on the PN-EN ISO 18134. The ash content of the biomass samples was determined in accordance with PN-EN ISO 18122, whereas PN-EN ISO 18123 standard was used to assess the volatile matter content. Elemental analyzers Truespec CHN Leco and SC-144DR Leco were used to determine the hydrogen, carbon, sulfur and nitrogen contents. The proximate and ultimate analyses and higher heating value (HHV) of the tested fuels are presented in Table 2.

3.2. Experimental Setup and Procedure

Conventional and oxy-fuel combustion experiments were carried out in a 12-kW, electrically heated lab-scale CFB combustor, which has been described in detail in references [21,22,23]. Here, only the experimental conditions are briefly mentioned. All experiments were carried out at temperature 850 °C in air (base case) and mixtures of O2/CO2 with O2 concentrations in the range from 21% to 40%vol. The names given to the different oxy-fuel atmospheres, oxy-21, oxy-30 and oxy-40, are related to the O2 concentration in the oxy-fuel mixture fed to the combustor, i.e., 21, 30 and 40%vol., respectively.
Silica sand (particles below 400 μm) to a mass of 0.3 kg constituted the fluidized bed. The gases (O2 and CO2) to make up gas mixtures are supplied from cylinders to a mixer and then transferred via a preheater directly into the combustion chamber. Flow rates of gases are controlled by valves and measured by rotameters. During air and oxy-combustion experiments, the superficial gas velocity was kept at a constant level of about 5 m/s.
A small sample of fuel (0.5 g) was fed into the combustion chamber (riser) for each test. Sorbent was not used to capture SO2 during all tests. The biomass and coal samples were in the form of spherical pellets. The detail method of pellet making is explained by Kosowska-Golachowska et al. [24] and Kijo-Kleczkowska et al. [25]. Concentrations of NO, NO2, N2O, SO2, CO and other compounds (HCN and NH3) in the flue were measured online (with frequency of 1 Hz) by a FTIR spectrometer (Gasmet DX-4000). The maximum error of these measurements was less than 2%. The time period for each test was set 3 s. Each test was repeated minimum three times to guarantee a relative standard deviation of less than 5%. This methodology has been successfully used in our previously studies on pollutant emissions during combustion of sewage sludge [21] or lignite and bituminous coal [22].

4. Results and Discussion

Biomass combustion both in air and oxy-fuel atmospheres proceeds through several stages, namely drying, devolatilization, ignition and volatile matter combustion, char combustion and agglomeration of ash [7,22,23]. A detail report on all these stages, temperature profiles and visualization during oxy-combustion of wheat straw and Salix viminalis can be found in [22,23], respectively.
Volatile matter and oxygen contents in the biomass samples are significantly higher than those in the bituminous coal whereas the ash yield and HHV are lower than those in coal (see Table 1). The contents of S, N and Cl in biomass are lower than those in coal, which indicates that the tested biomass fuels are ideal renewable energy resources with a minor potential for environmental pollution.
In this section, emissions of NOx (NO, NO2, N2O and their precursors, such as NH3 and HCN), SO2 and CO during conventional and oxy-fuel combustion of three kinds of biomass and a reference coal are presented and discussed.

4.1. Conventional Combustion

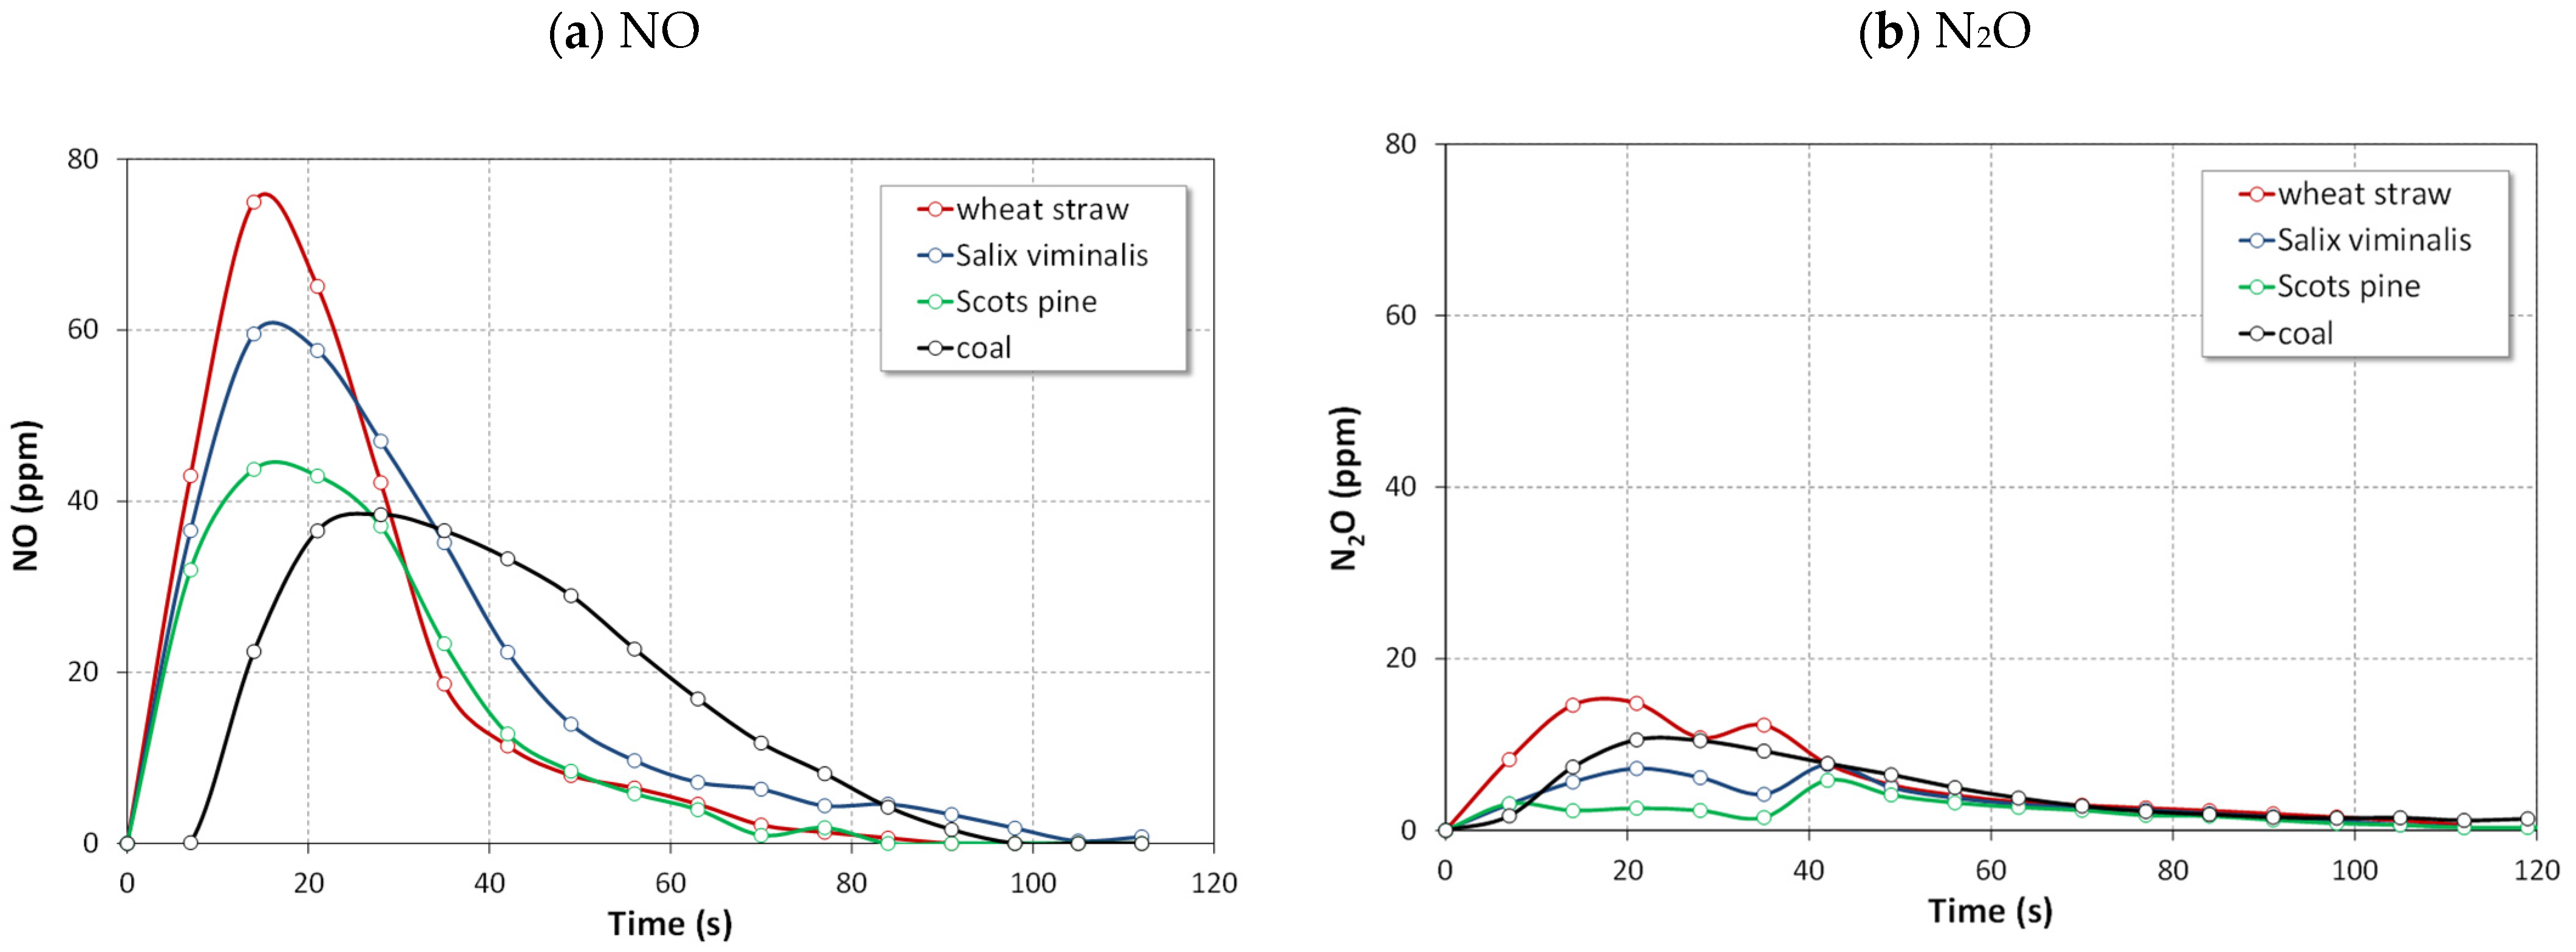
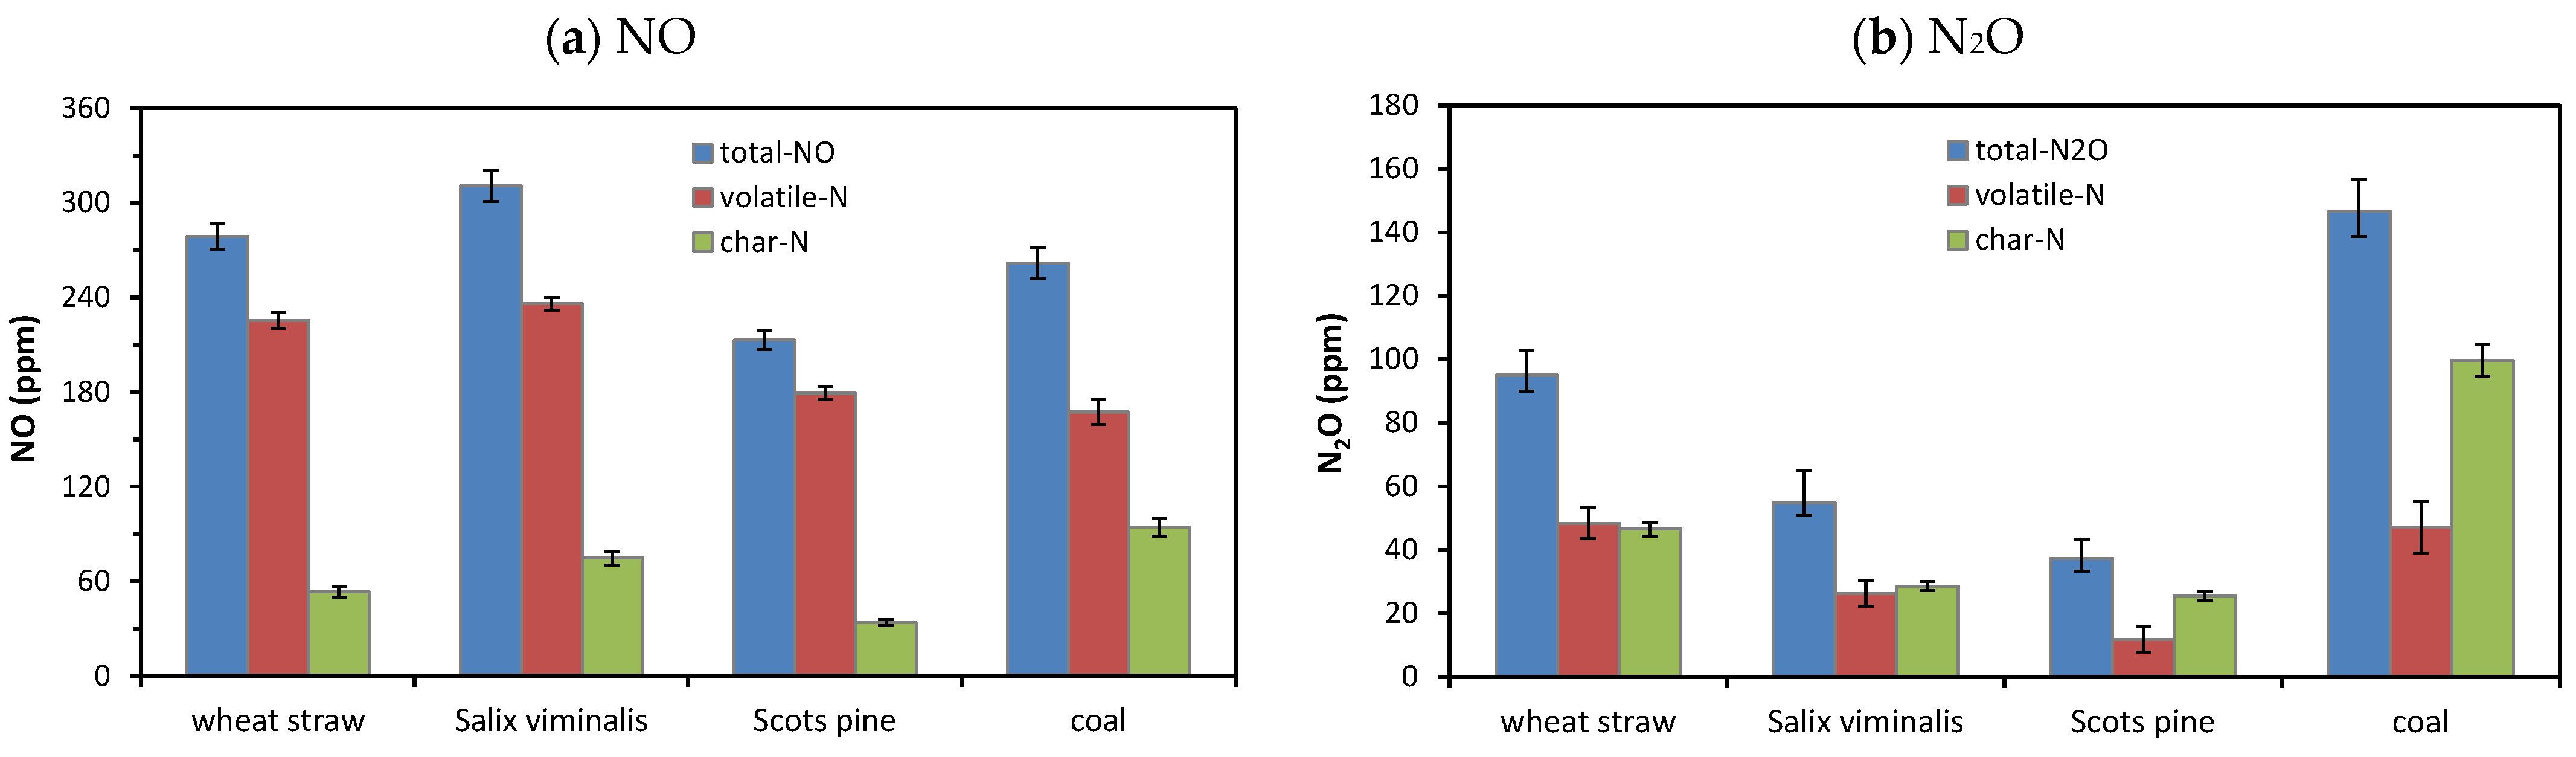
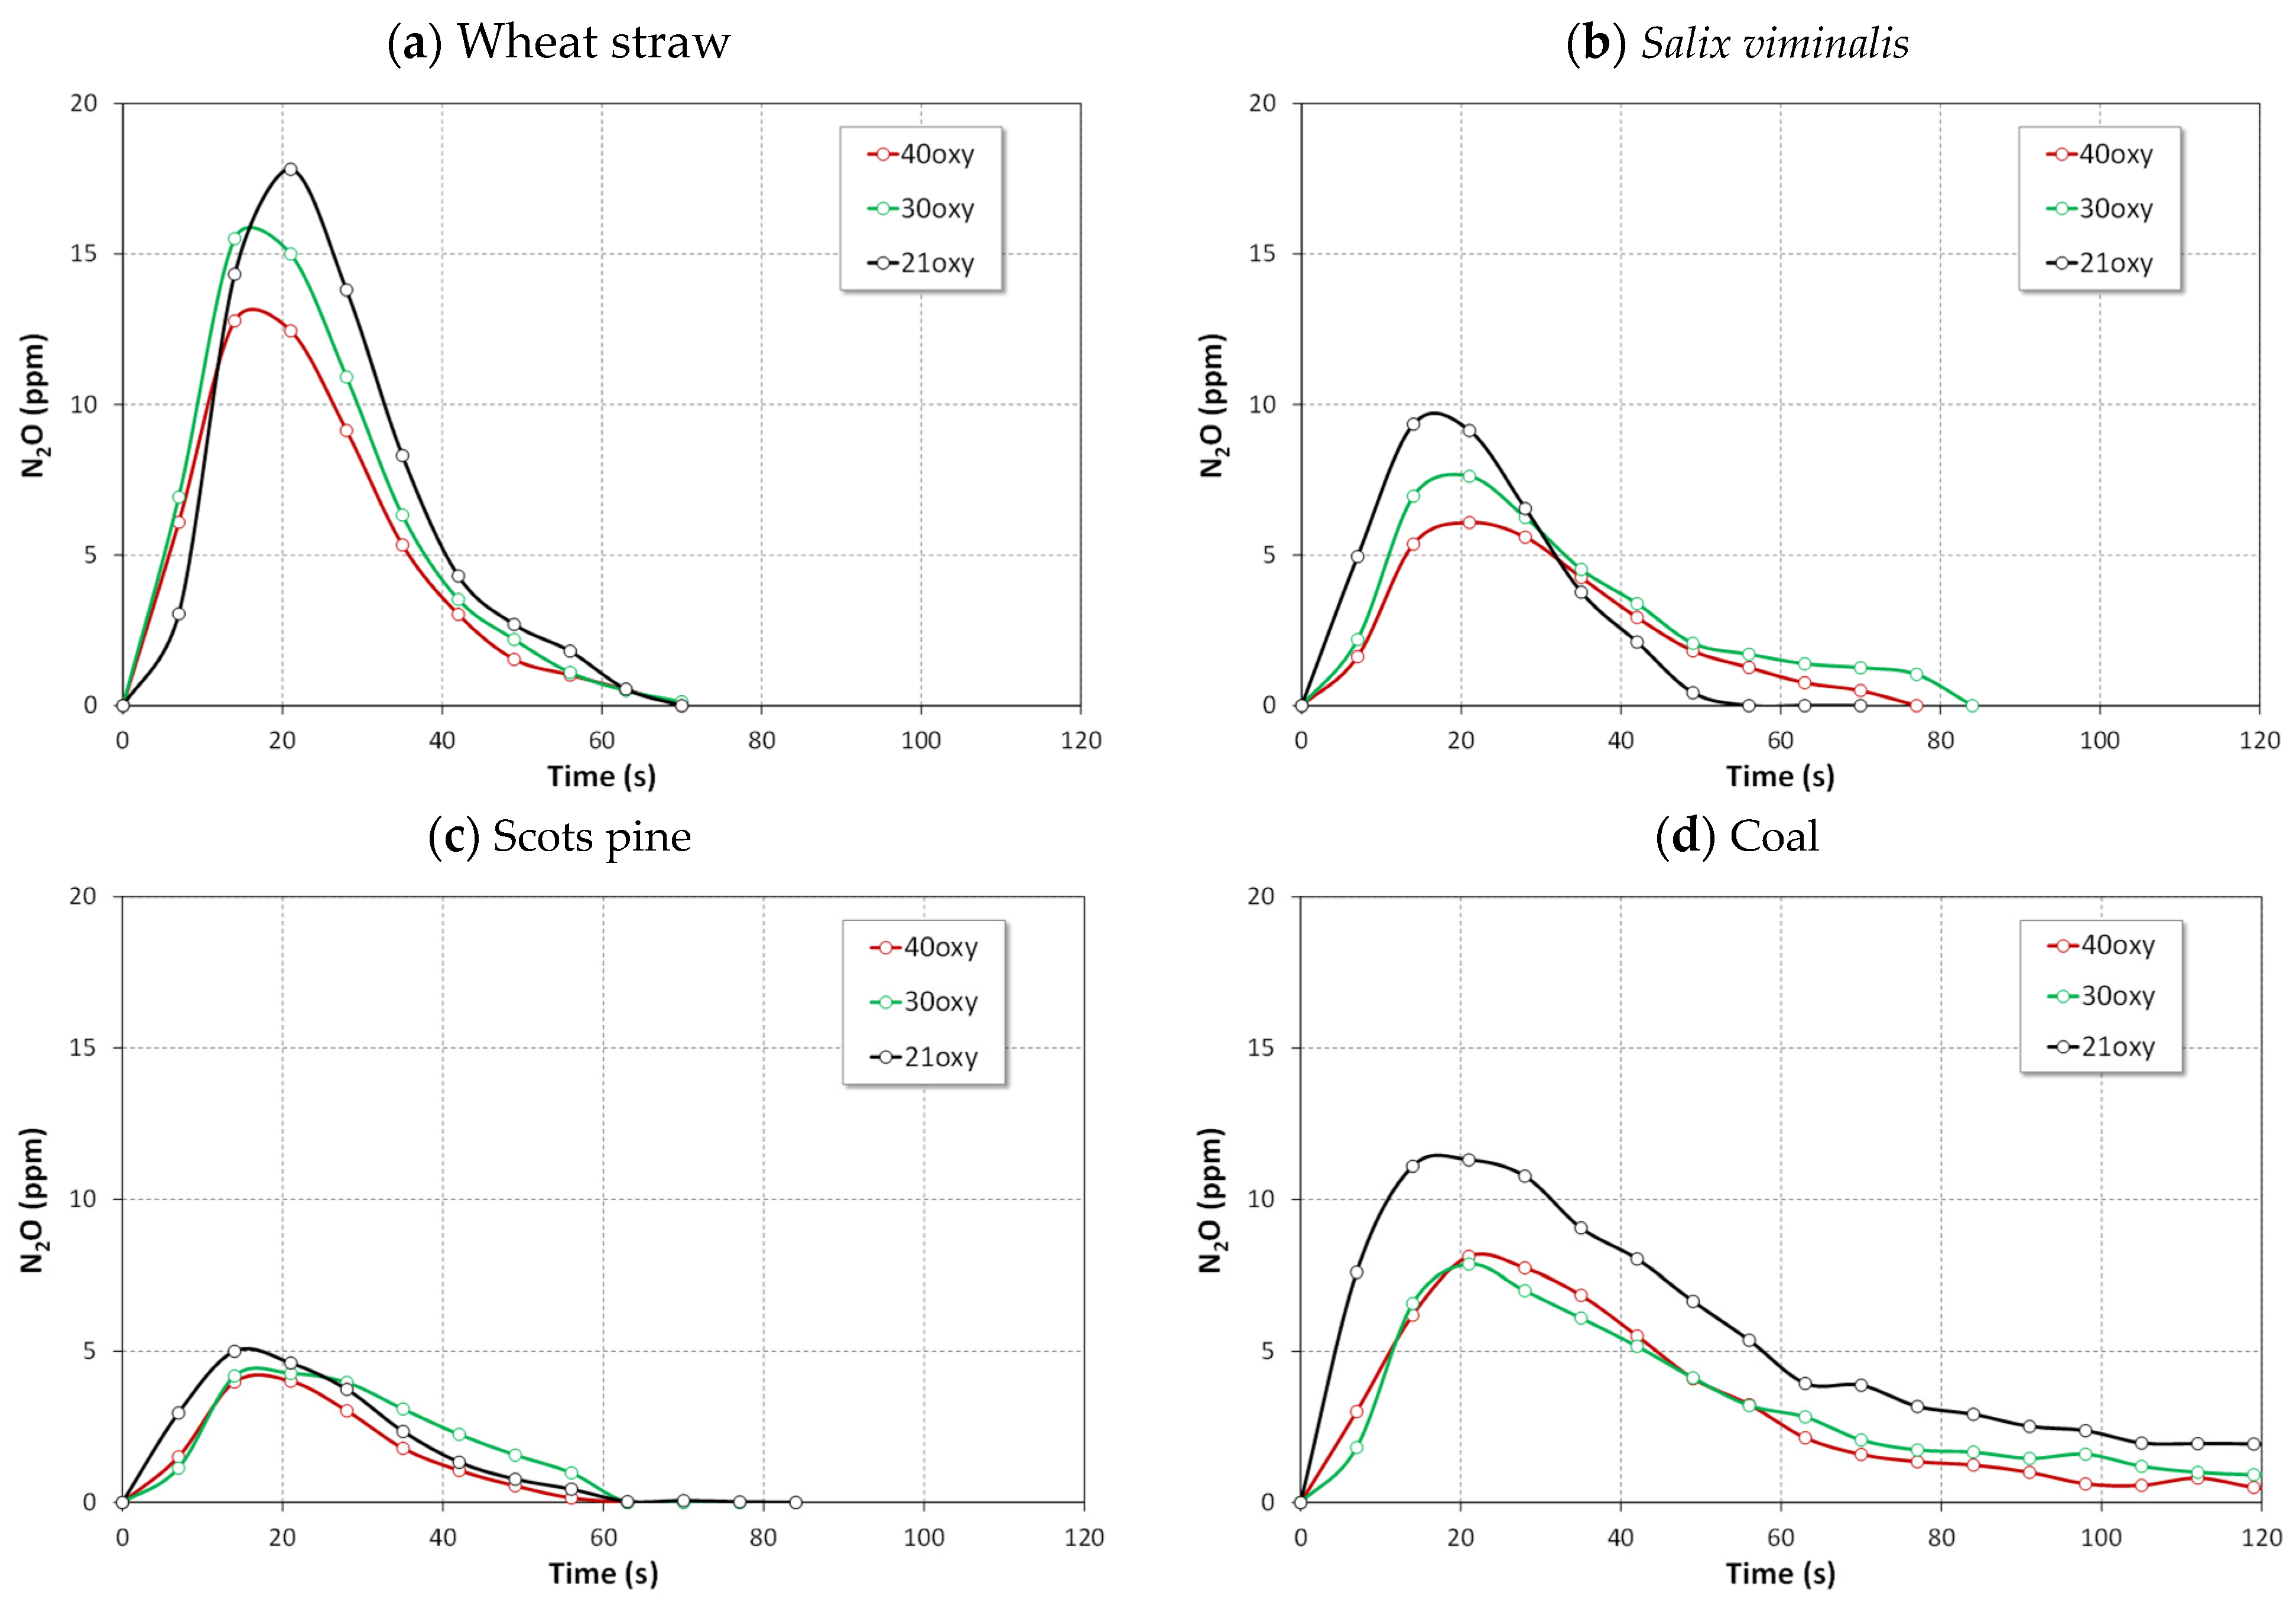
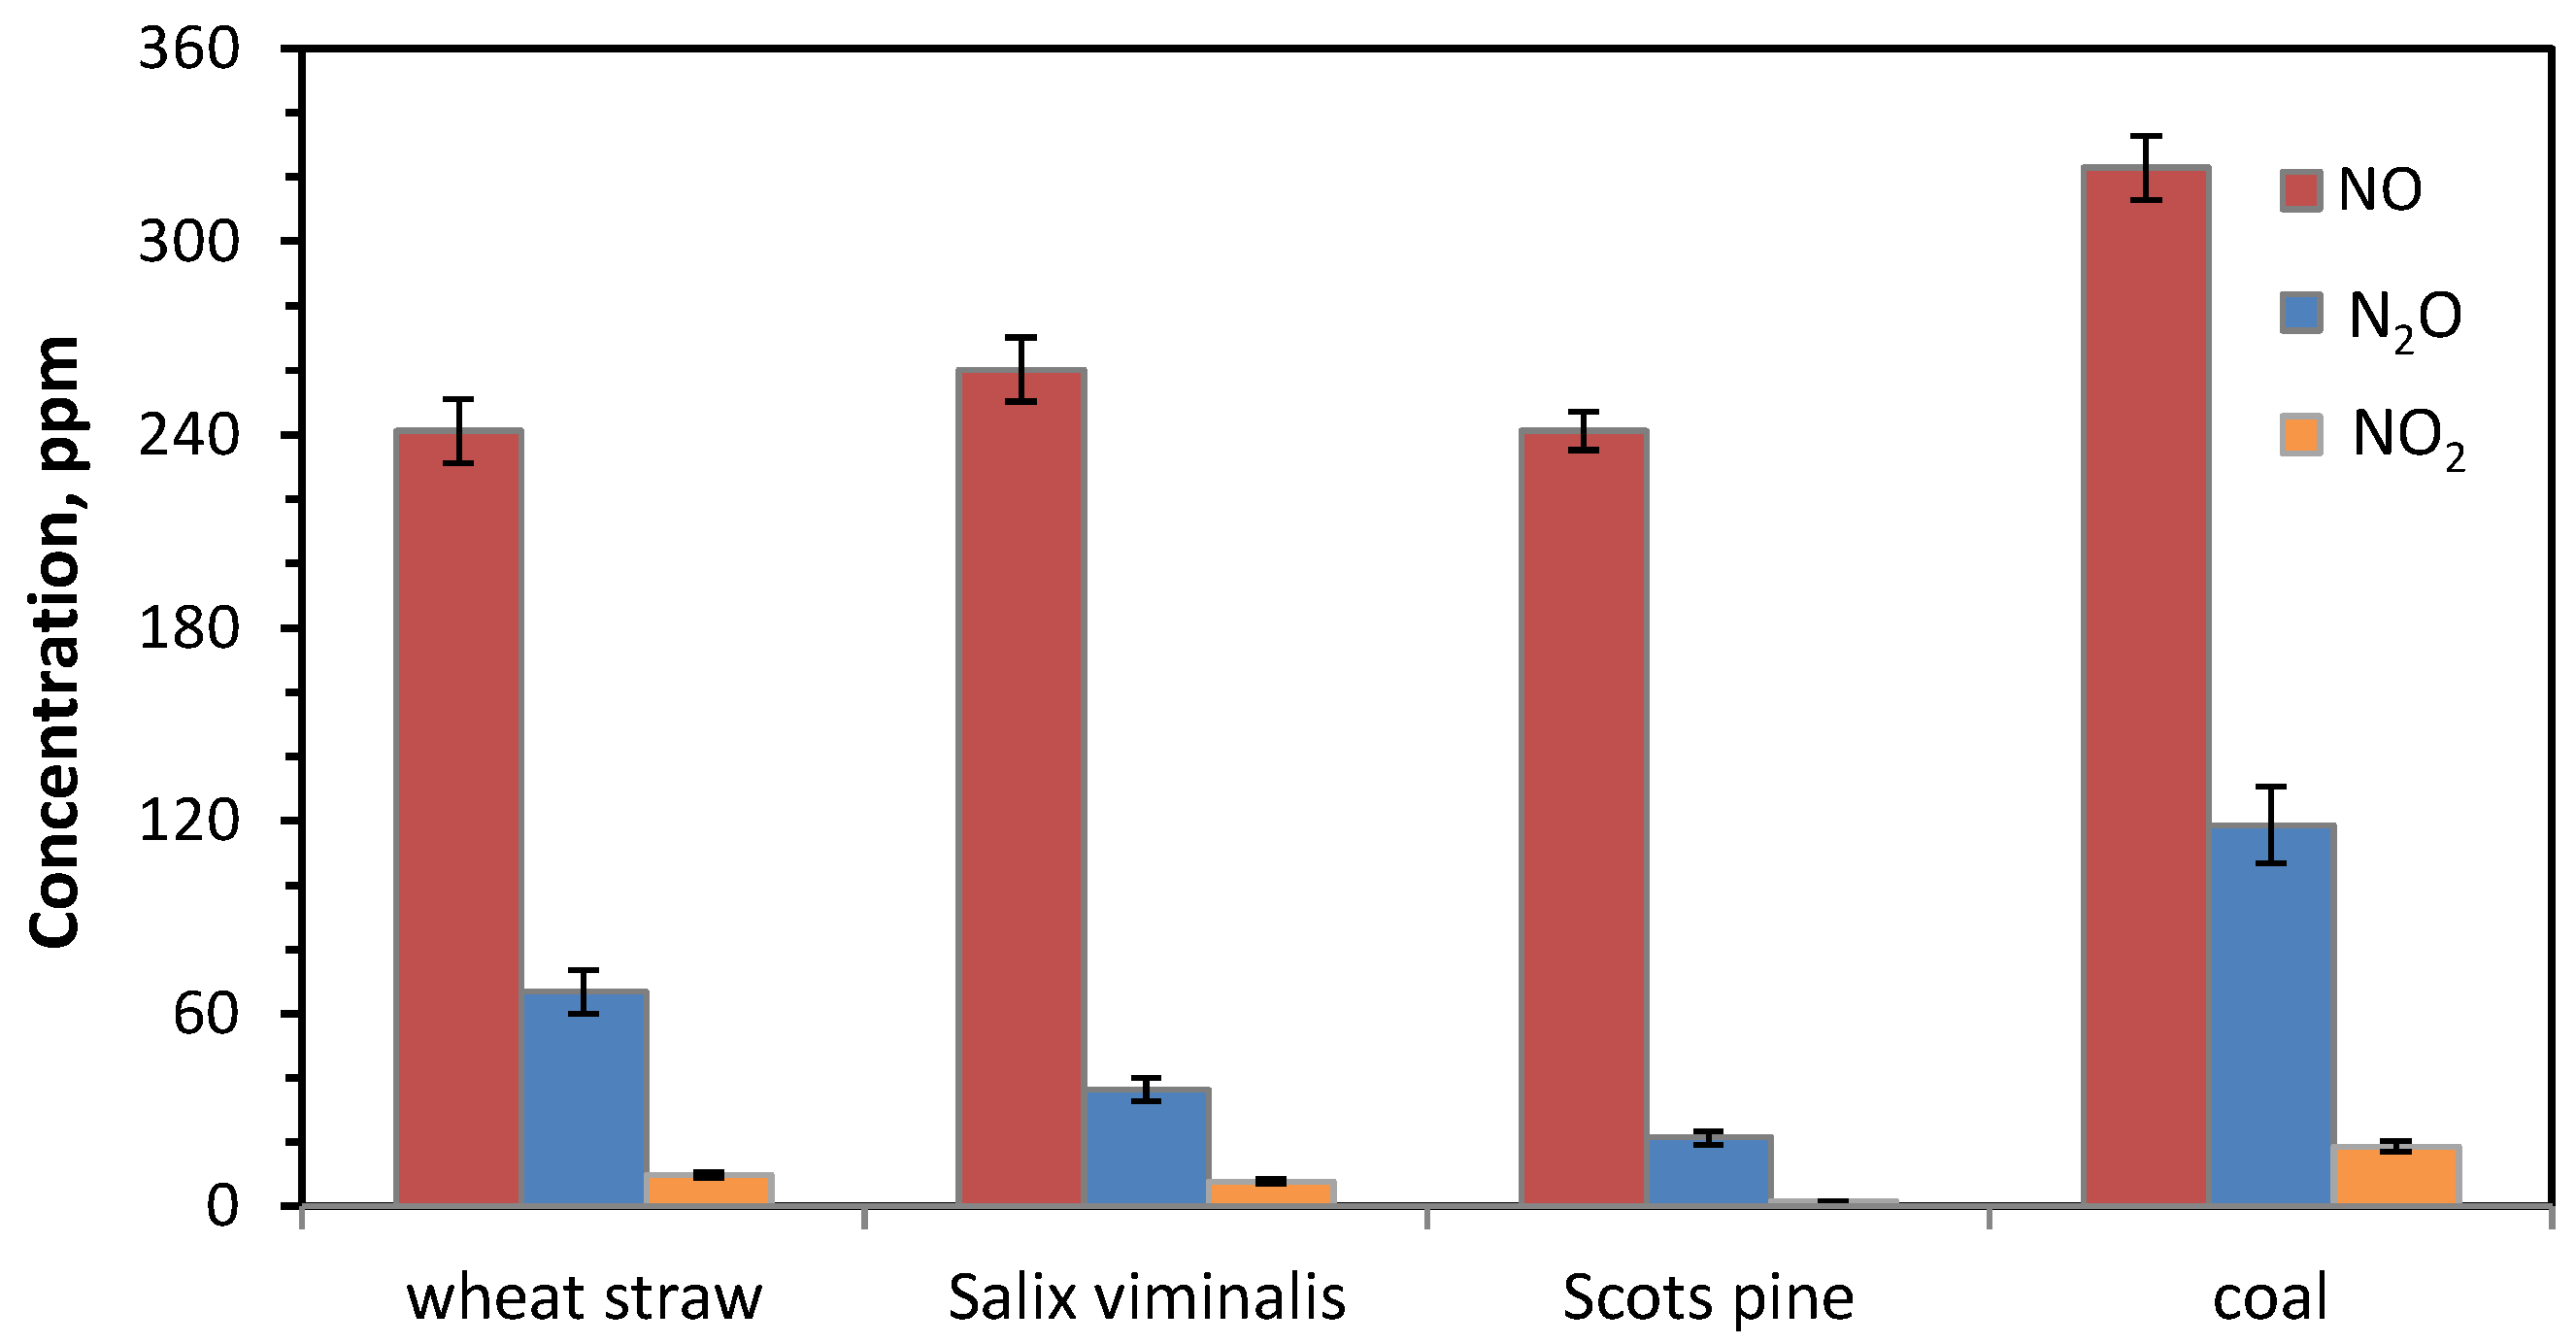
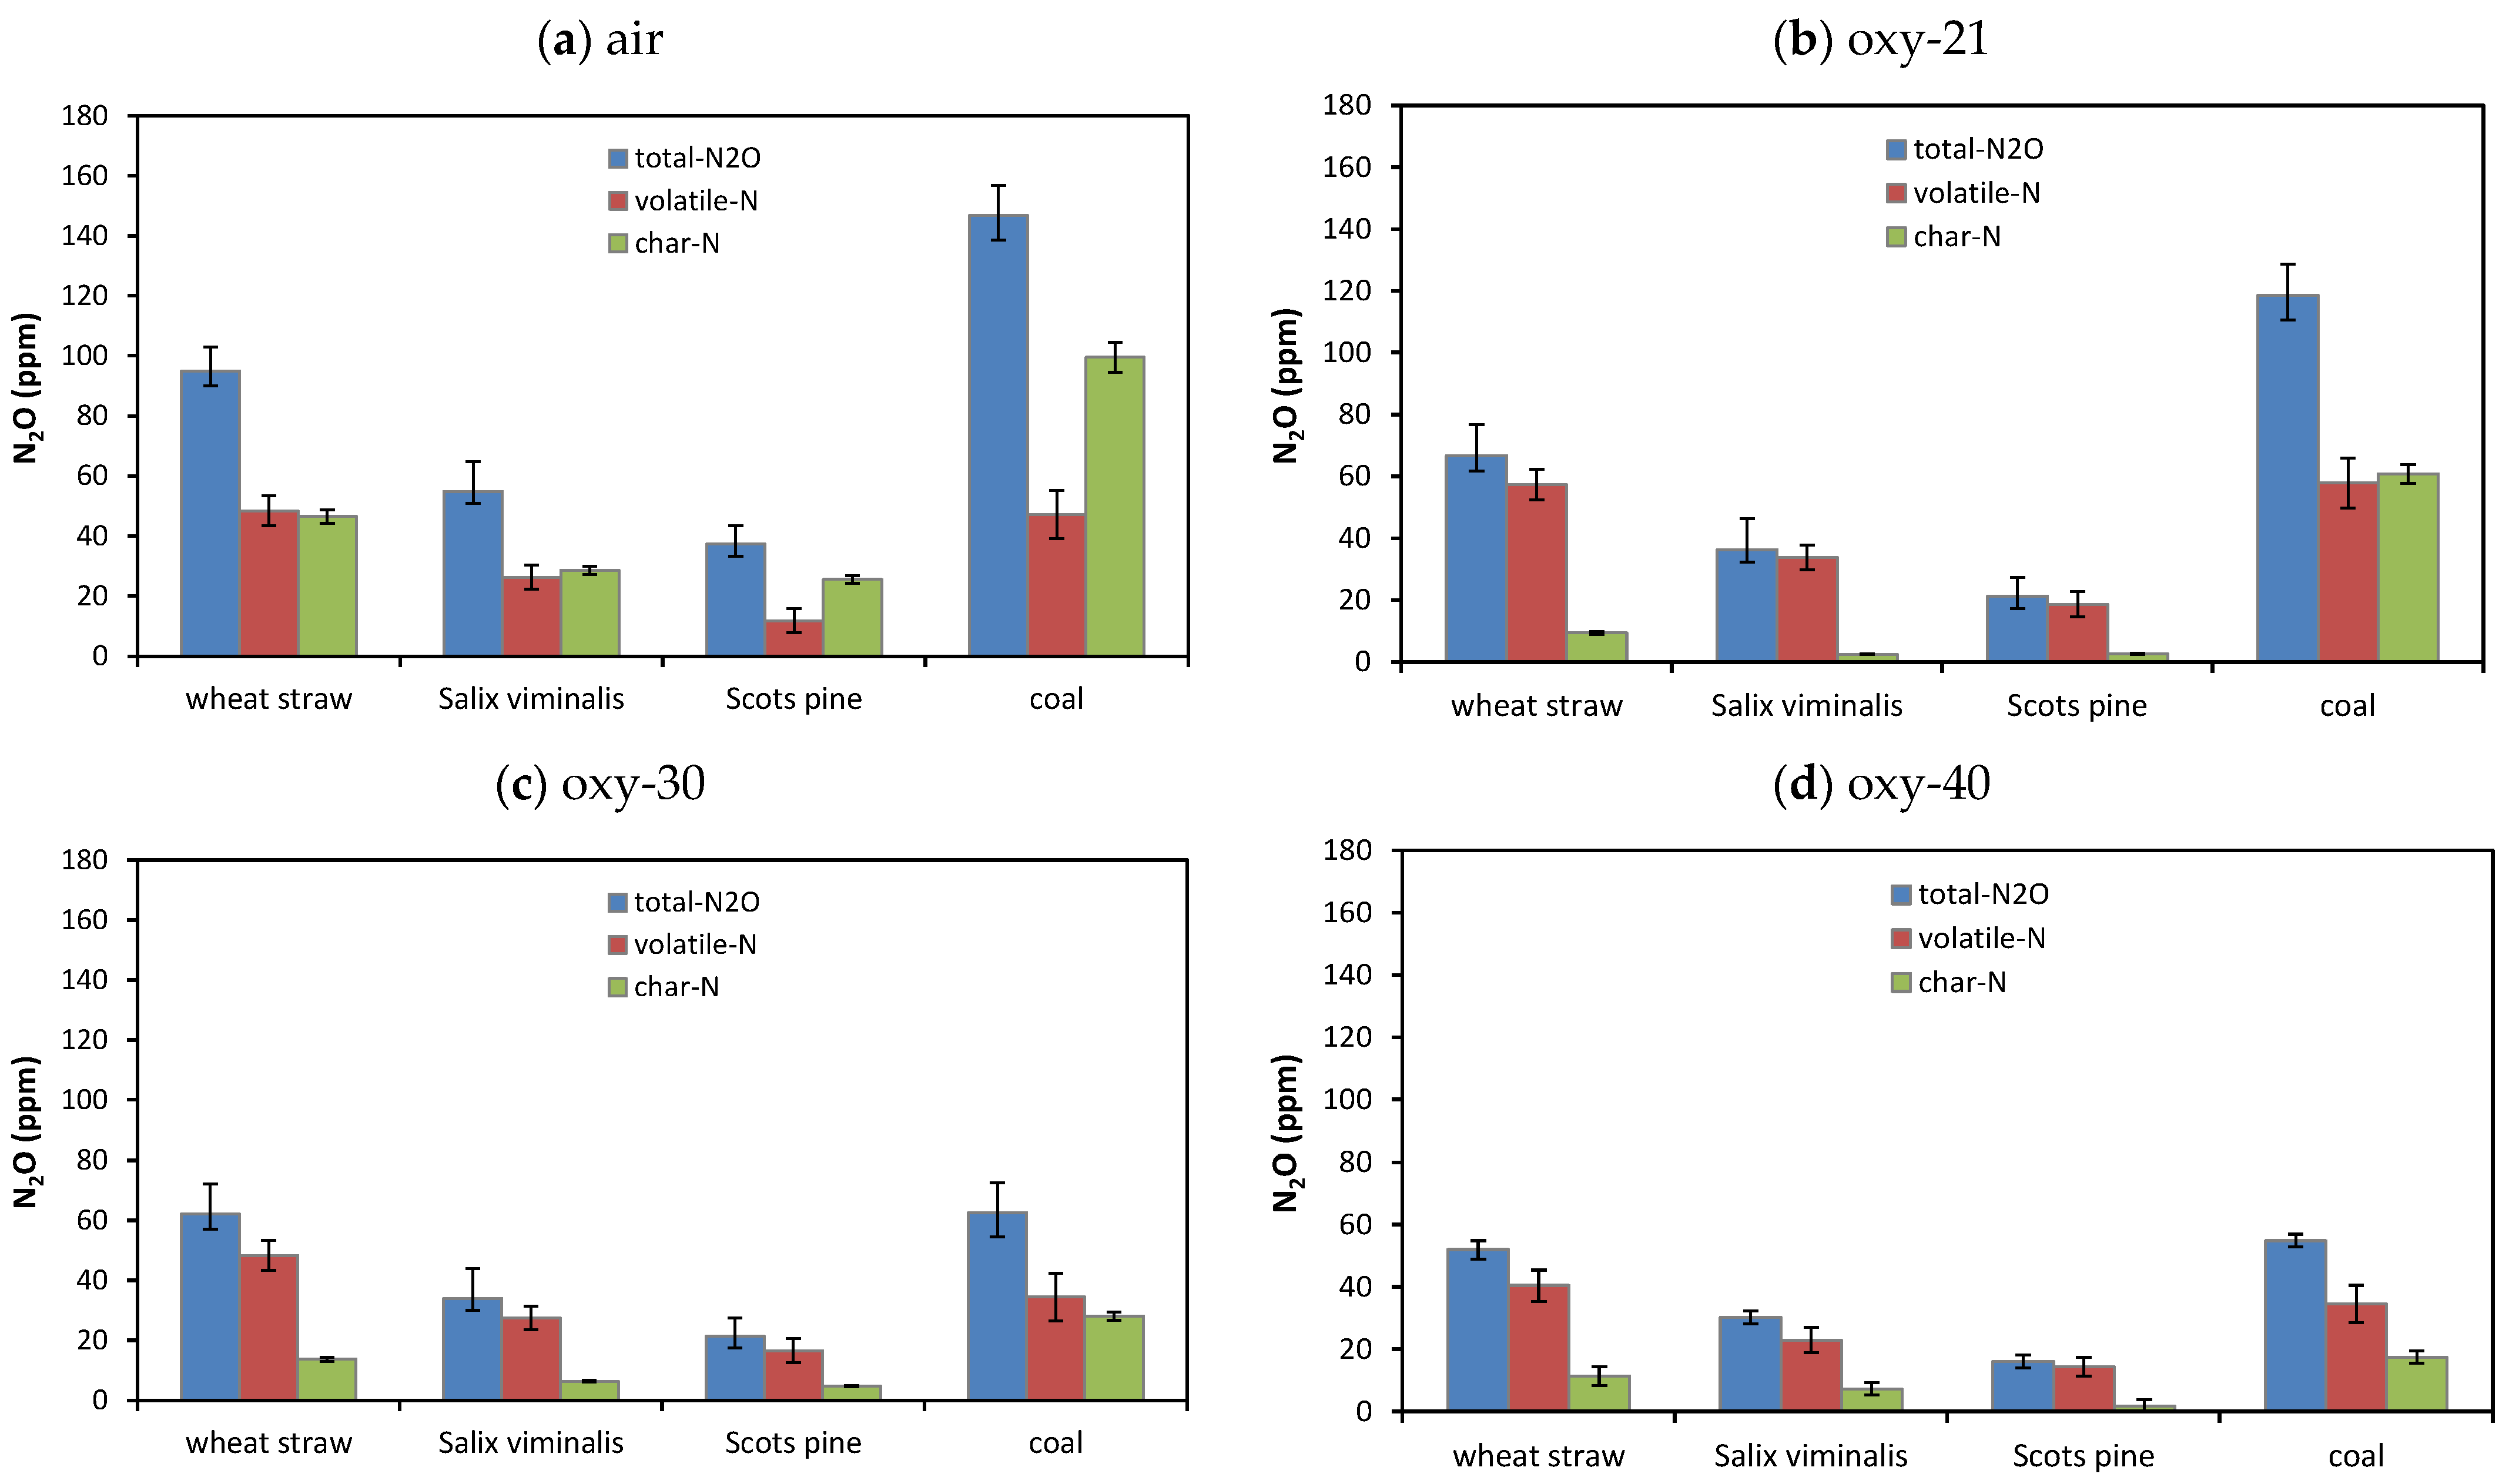
4.1.1. NO, NO2 and N2O Emissions

Nitrogen oxides (NOx), such as NO, NO2 and N2O, are main contributor to air pollution [26]. The mechanism of NOx formation in conventional air-fired combustion includes thermal, prompt and fuel-N NOx. Thermal and prompt NOx formation occurs at high temperatures, usually above 1400 °C, that are typical for pulverized fuel combustion. In fluidized-bed combustion, contributions of thermal and prompt mechanisms to the total NOx emissions are negligible.
Fuel nitrogen oxides are formed through oxidation of N-containing species in the fuel (fuel-N), which are released during devolatilization (volatile-N) and char oxidation (char-N) stages. At typical fluidized-bed combustion temperatures (below 900 °C), fuel-N is the dominant source for NOx formation. Although char is an important intermediate for NOx formation, the behavior of volatile-N is a dominating factor in the case of burning fuels with high-volatile matter contents such as biomass [27].
Figure 1 shows the time-resolved emissions of NO and N2O during air-CFB combustion of all tested fuels. Nitrogen oxide was the dominant N-containing pollutant and no NO2 was detected during tests in air. This finding is consistent with the results obtained by Liu et al. [28]. The highest NO concentrations (Figure 1a) were detected during the volatile matter combustion. The highest NO concentrations were approximately 75 ppm and 60 ppm for wheat straw and Salix viminalis, respectively. The lowest NO emissions were measured for the reference coal despite its highest nitrogen content. This observation can be attributed to the lower volatile matter content in coal and lower temperature during the volatile matter combustion compared to biomass fuels.
Nitrous oxide emissions (Figure 1b) were about four times lower than NO emissions, which indicates that fuel-N was more inclined to undergo conversion to NO than to N2O during combustion in air. The N2O formed, compared to NO, was also more readily reduced to N2 by char or CO [27,28]. The highest N2O concentrations were approximately 15 ppm for wheat straw, while the lowest for Scots pine what was attributed to the nitrogen content in biomass fuels.
Hydrogen cyanide, HCN, and ammonia, NH3, are major precursors for the formation of NOx during combustion of solid fuels containing nitrogen. There is a consensus that the conversion of fuel-N to nitrogen oxides proceeds through these intermediates [29]. The instantaneous concentrations of HCN were below 3 ppm and NH3 was not detected during air combustion of tested fuels.
Figure 2 shows the influence of fuel type on the total emissions of NO and N2O during combustion in air. In the case of whet straw, NO accounts for approximately 75% of the total NOx emitted and N2O for remaining 25%. For Salix viminalis and Scots pine, these figures are 85% and 15%, and 72% and 28%, respectively. In the case of bituminous coal, the fraction of NO in the total NOx is much lower, approximately 40%, and N2O accounts for remaining 60%. As coal contains less volatile matter than biomass fuels, high emissions of N2O can be attributed to oxidation and reduction reactions at the surface of char particles.
The split of NO and N2O emissions between volatile-N and char-N oxidation during air-combustion of wheat straw is shown in Figure 3. Oxidation of volatile matter accounts for approximately 80% of total NO formed and char oxidation contributed only 20%. In the case of N2O, contributions of volatile-N and char-N are similar and are approximately 51% and 49%.
Oxidation of volatile-N was responsible for 75% of the total NO formed for Salix viminalis, 85% for Scots pine and 65% for coal (Figure 4). Volatile-N contributed 48% to the total N2O formed during combustion of Salix viminalis and 32% during combustion of Scots pine and coal.

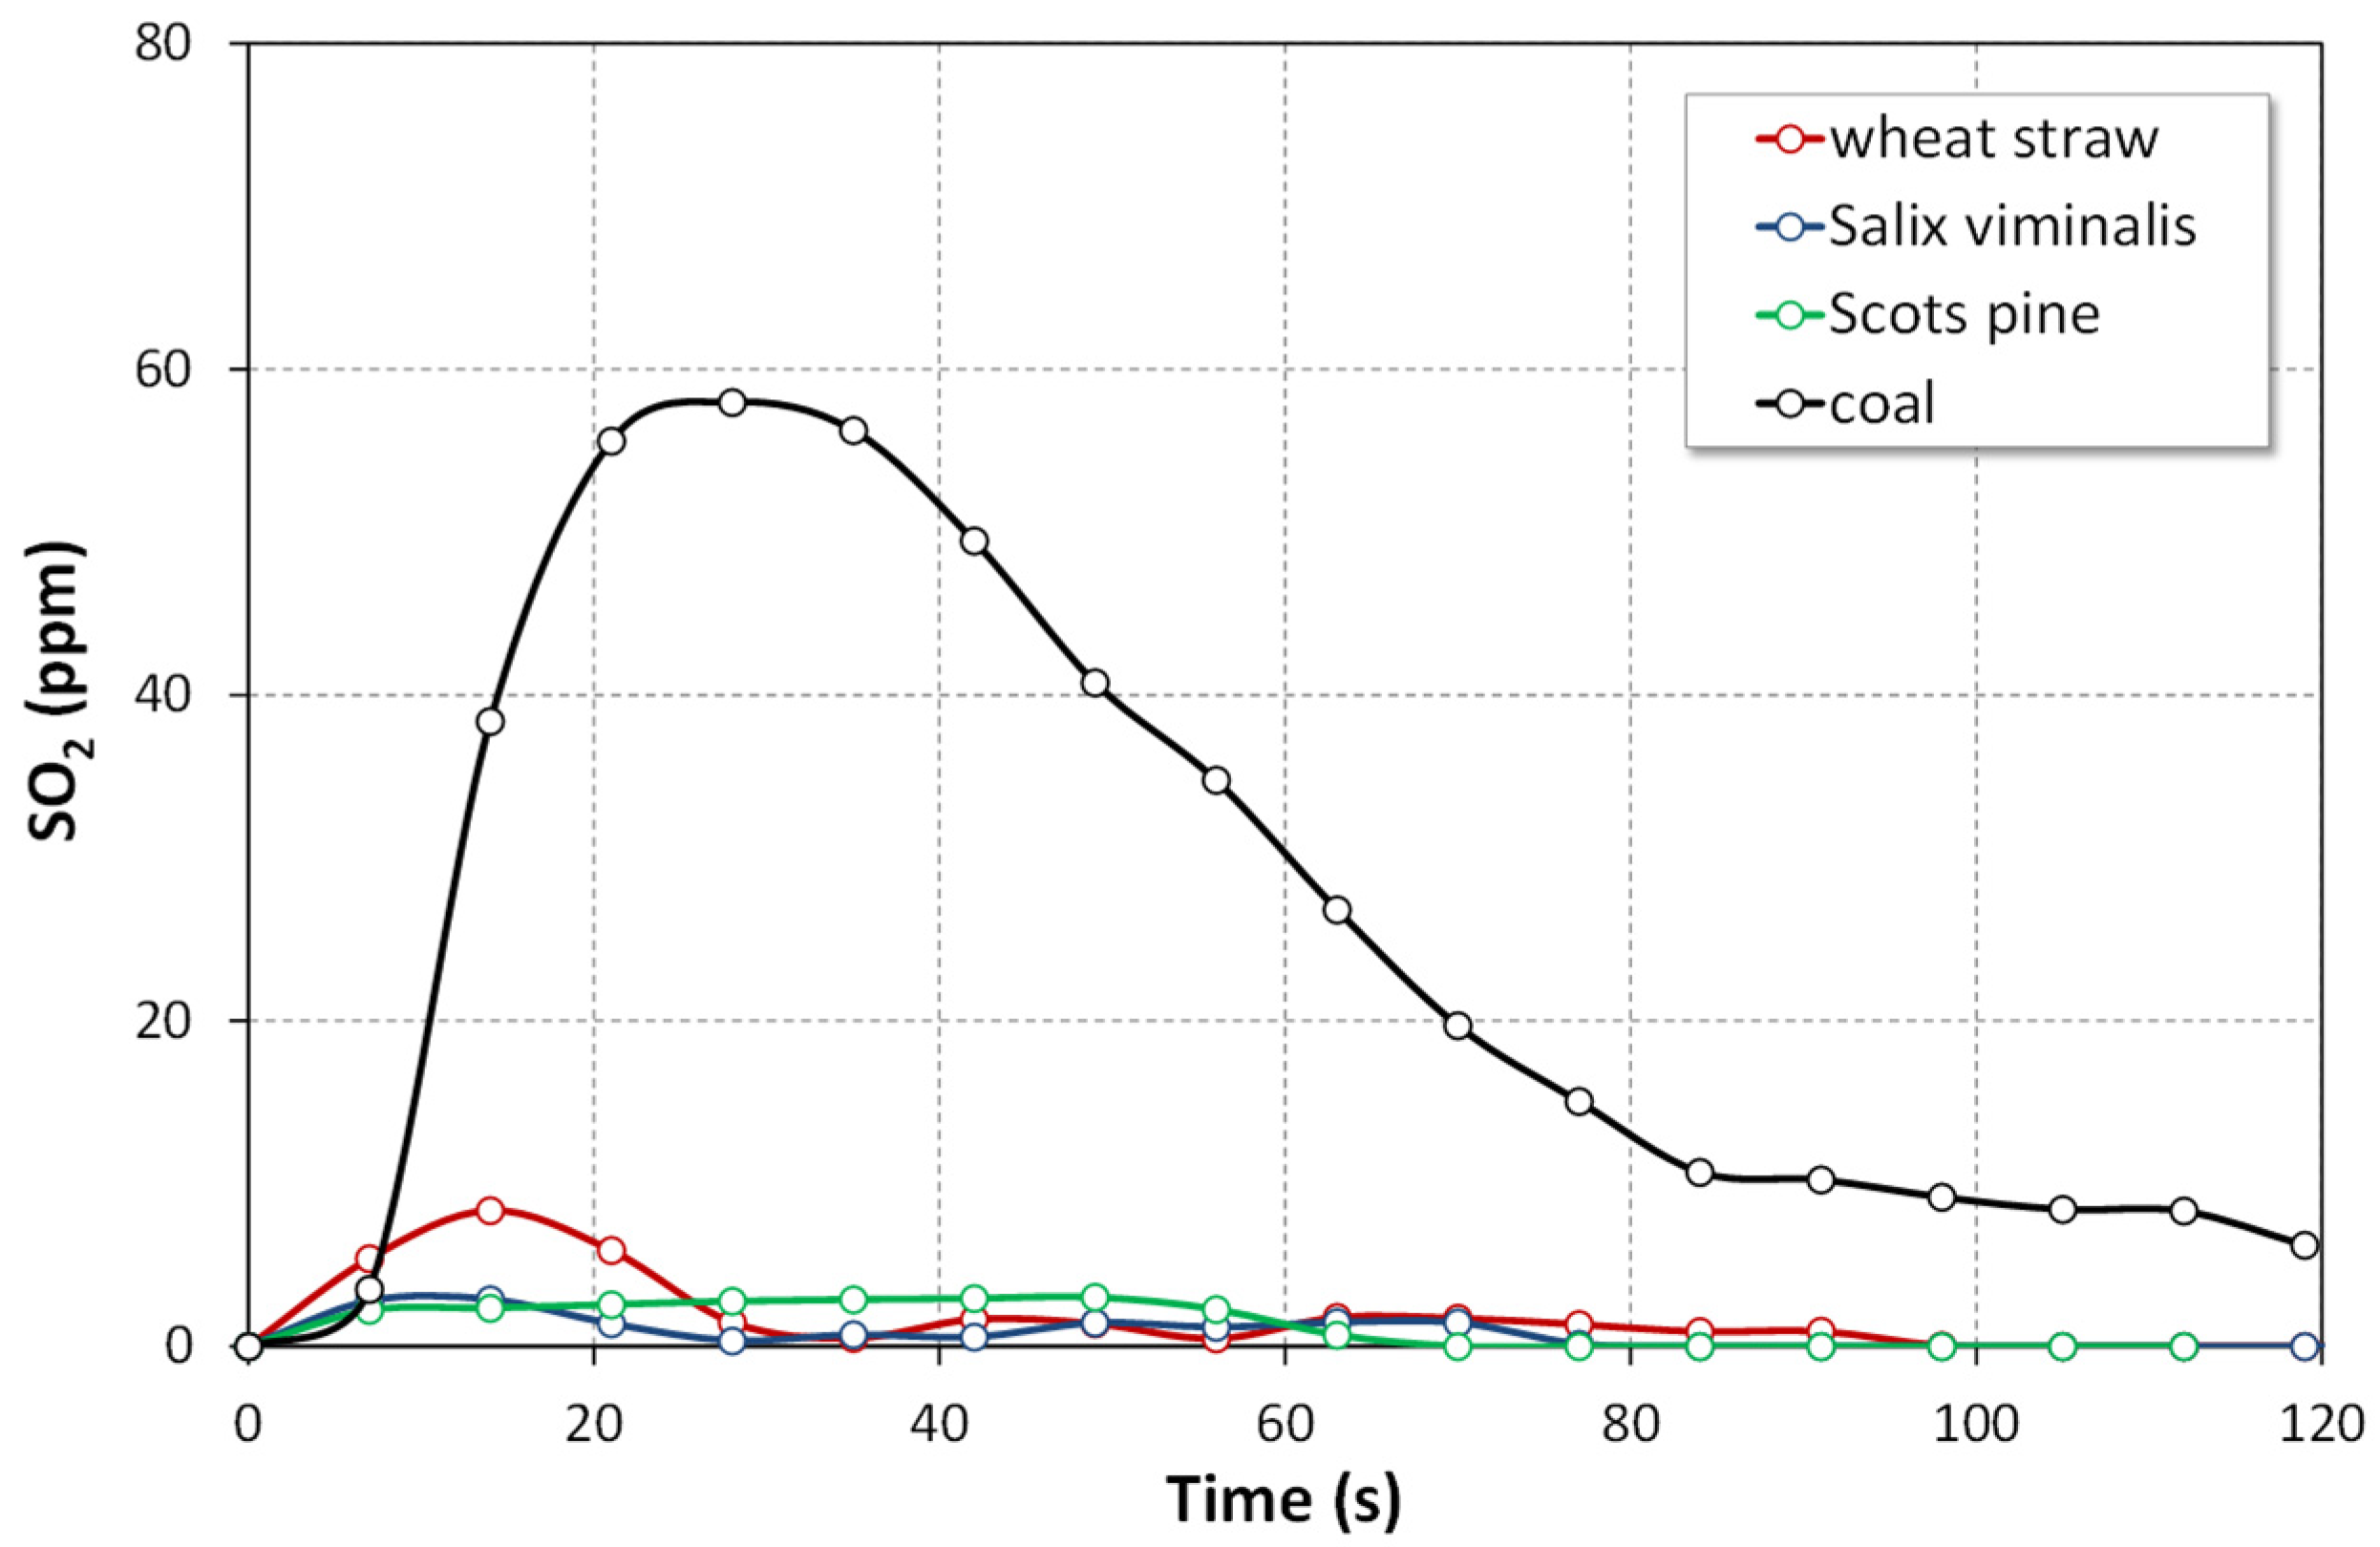
4.1.2. SO2 Emissions

In the air-combustion process, the sulfur contained in the fuel is oxidized mostly to SO2 with only a small fraction converted to SO3 [2]. Biomass fuels contain much less sulfur than coals, therefore, their combustion or co-combustion with coal produces lower emissions of SO2 [7,8,30]. Figure 5 and Figure 6 show the time-resolved concentrations of SO2 and the total SO2 emissions for tested fuels. Emissions of SO2 from combustion of the tested biomass were much lower than those from the combustion of coal. The highest instantaneous concentrations of SO2 were observed during combustion of volatiles and they were approximately 58 ppm for coal and less than 9 ppm for biomass fuels.
Sulphur dioxide is formed through oxidation of sulfur-containing species in the fuel (fuel-S), which are released during devolatilization (volatile-S) and char oxidation (char-S) stages (Figure 6). Oxidation of volatile-S was responsible for 60–65% of the total SO2 formed for biomass fuels and for only 30% in the case of coal.

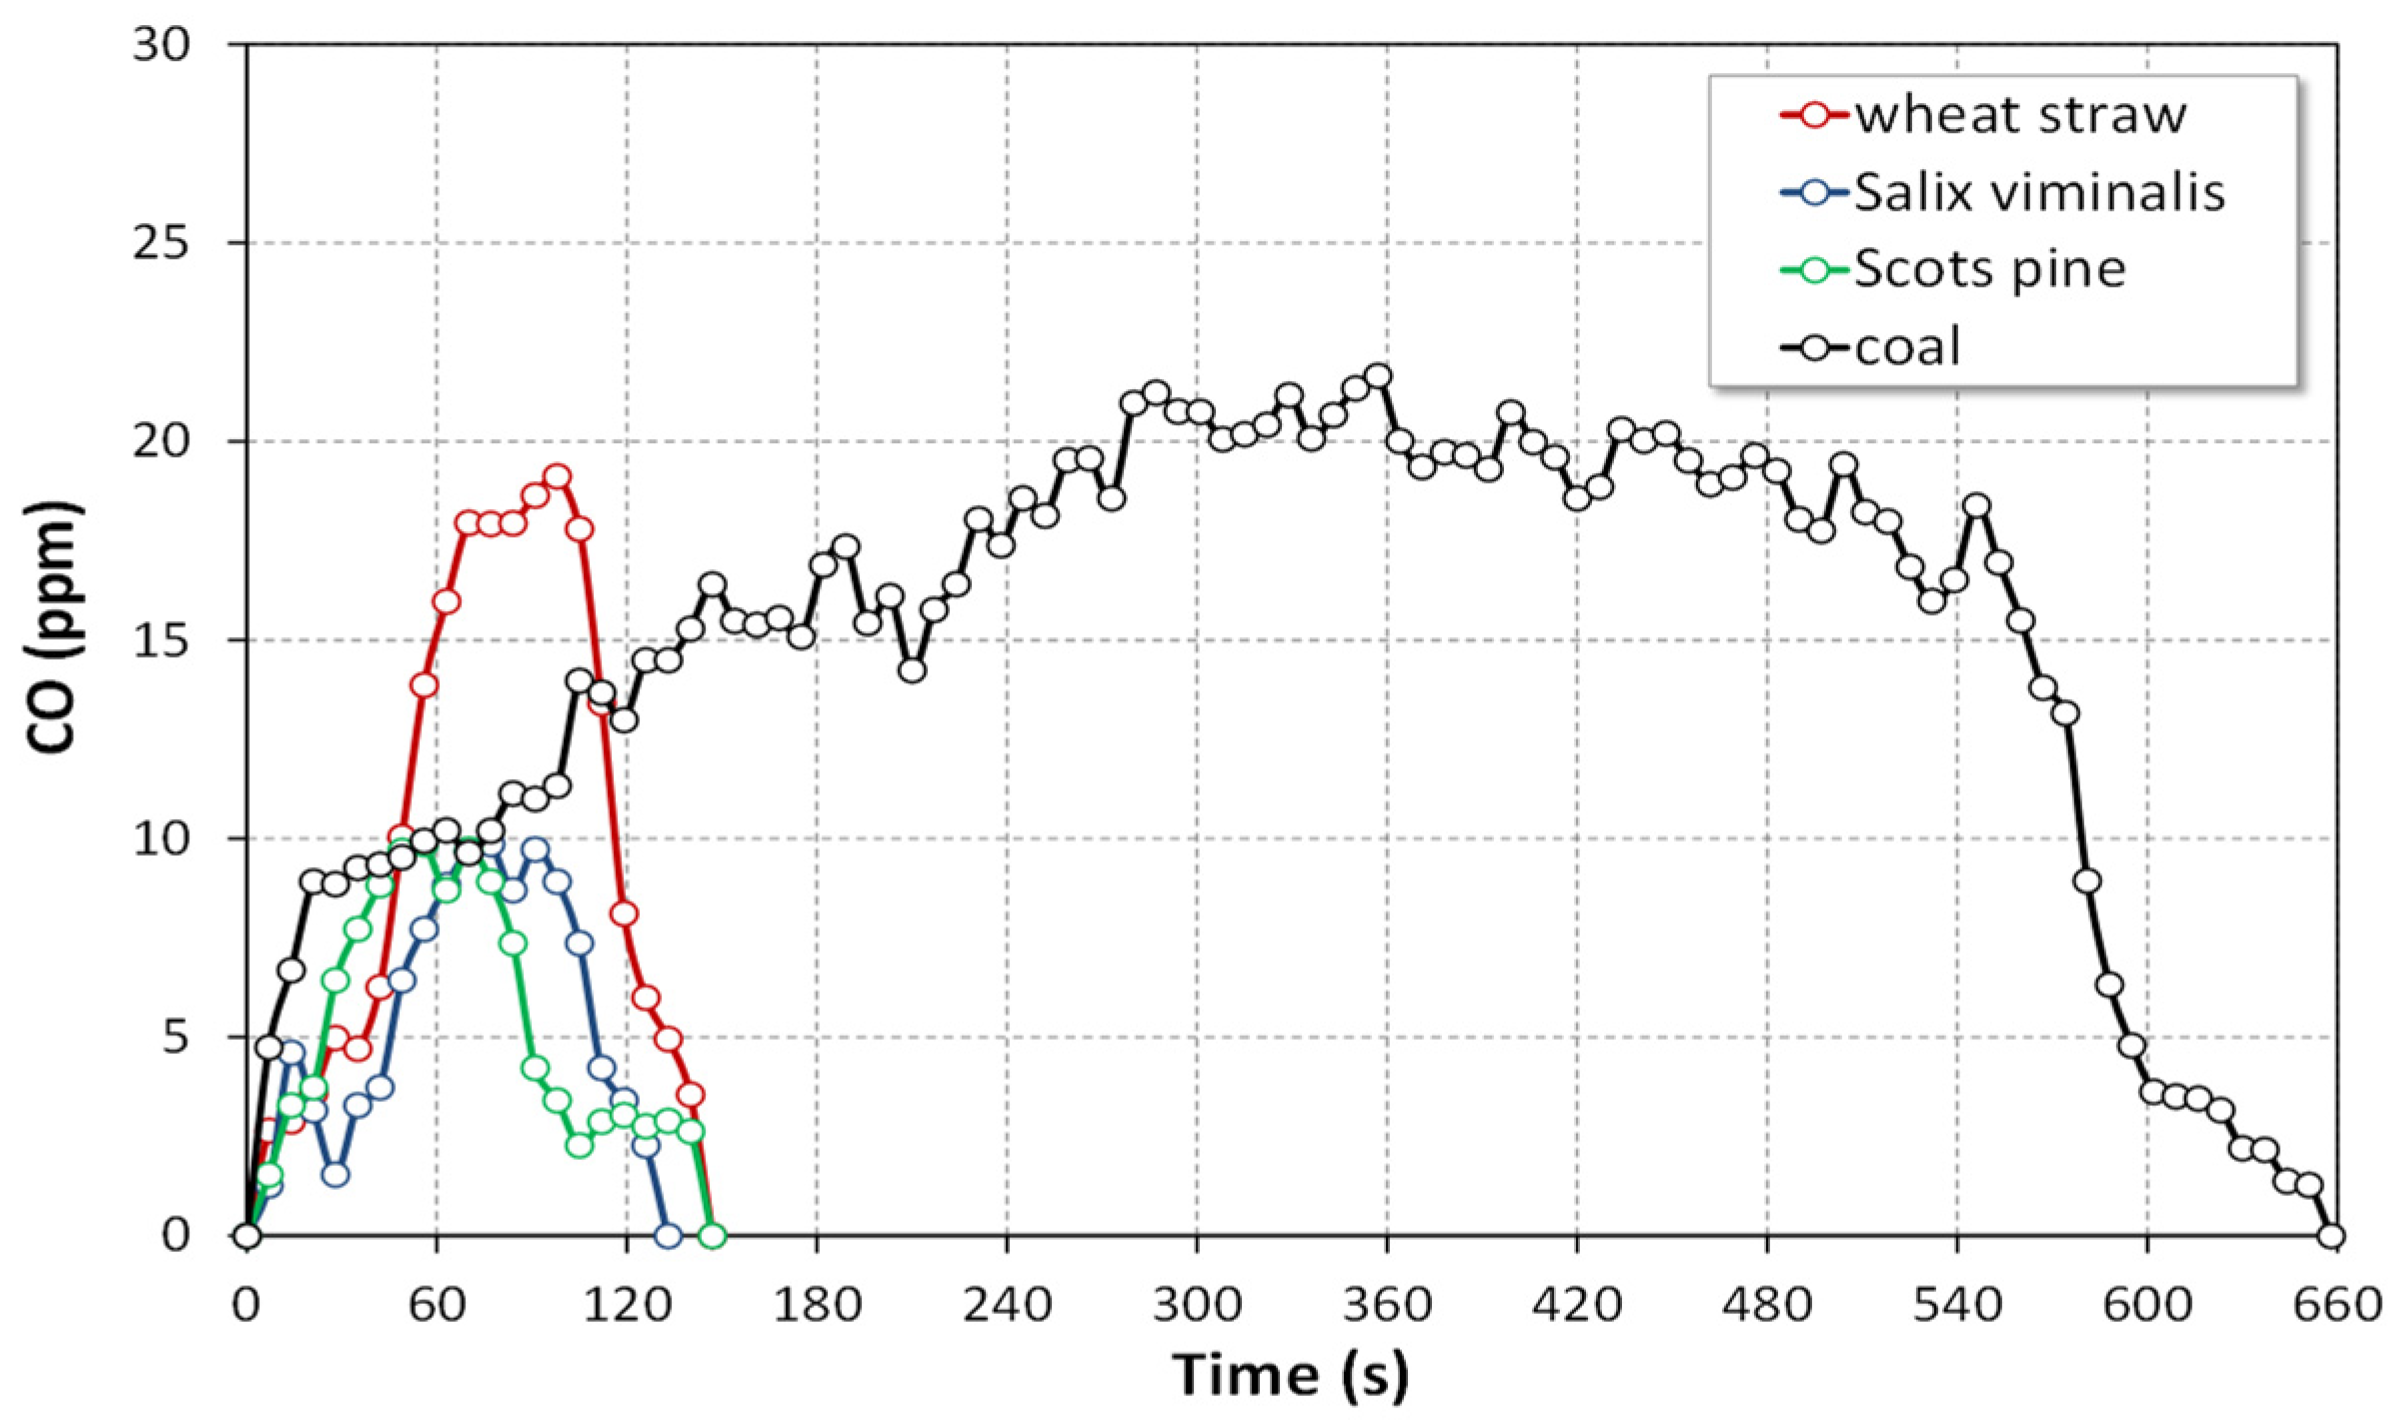
4.1.3. Emissions of CO

Figure 7 shows carbon monoxide emissions during air combustion of tested fuels. The instantaneous concentrations of CO for the combustion of biomass fuels were much lower than those for the combustion of reference coal. This can be attributed to the lower carbon content (Table 2) of biomass fuels. Release times of CO were 130–140 s for biomass and much longer, approximately 650 s, for coal. The highest CO emissions were detected during the combustion of char, both for biomass and coal. During air-combustion, the highest instantaneous concentration of CO were approximately 22 ppm and 19 ppm for coal and wheat straw, respectively.

4.2. Oxy-Fuel Combustion

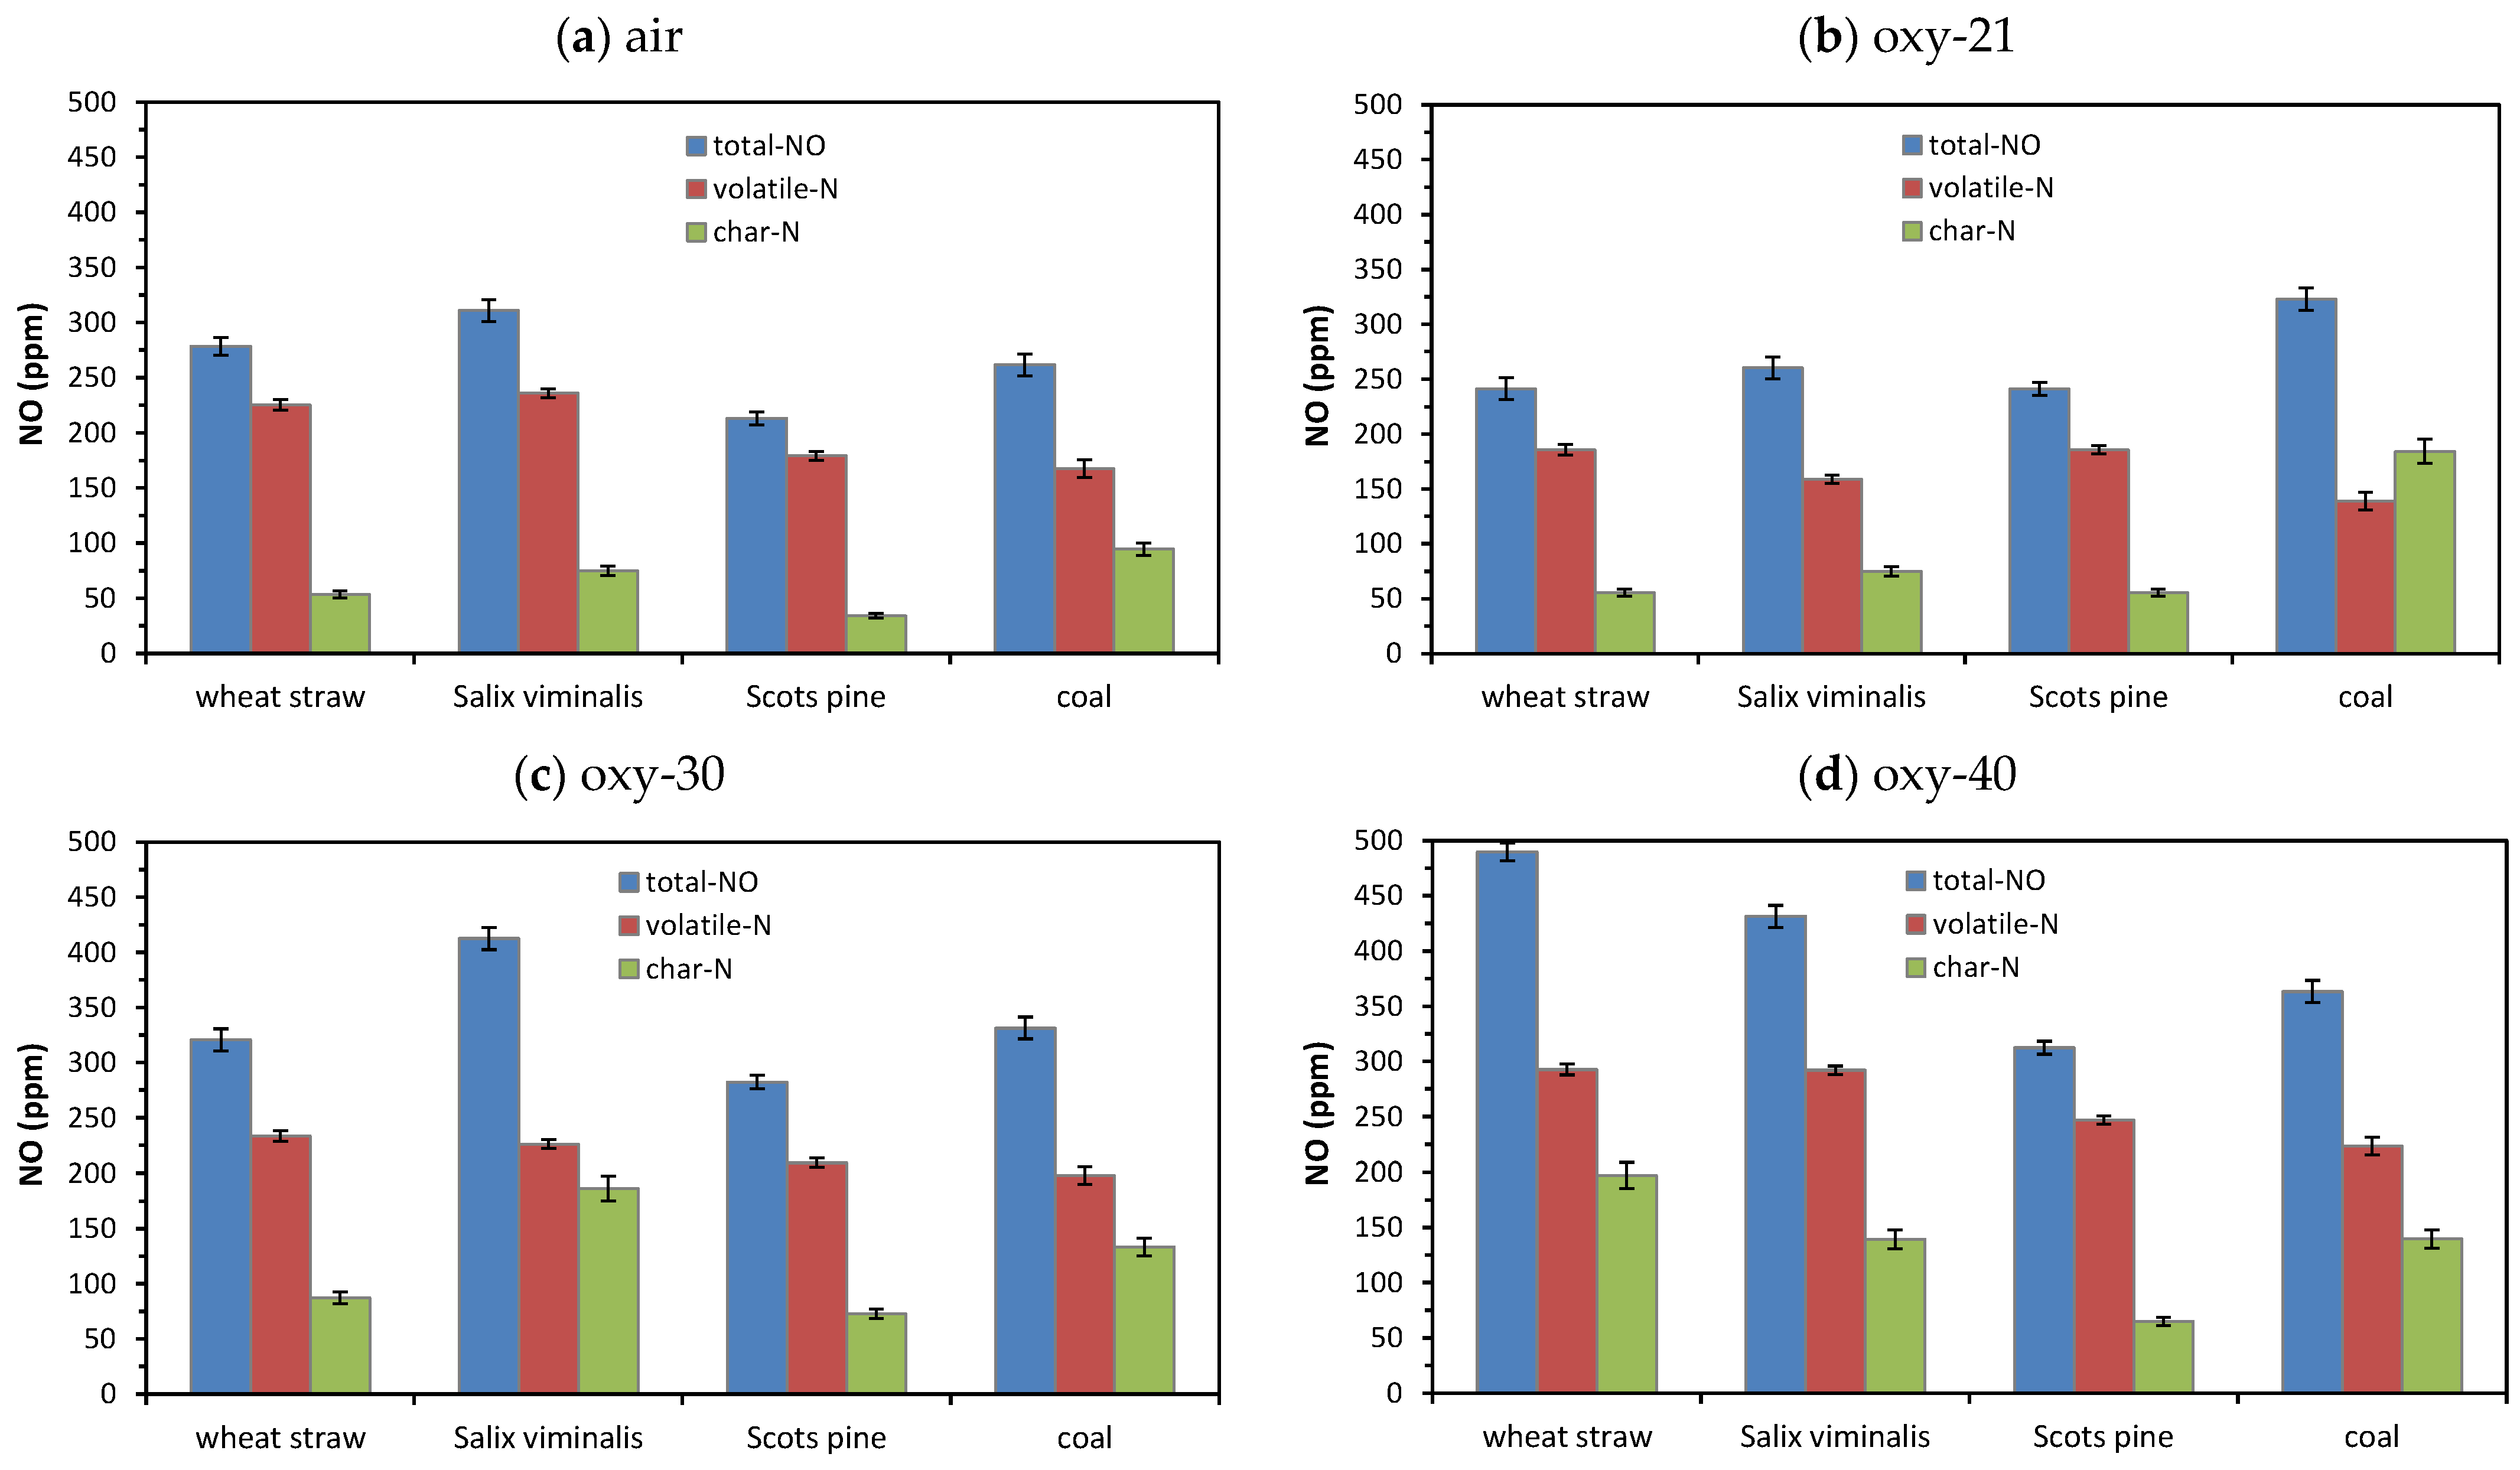
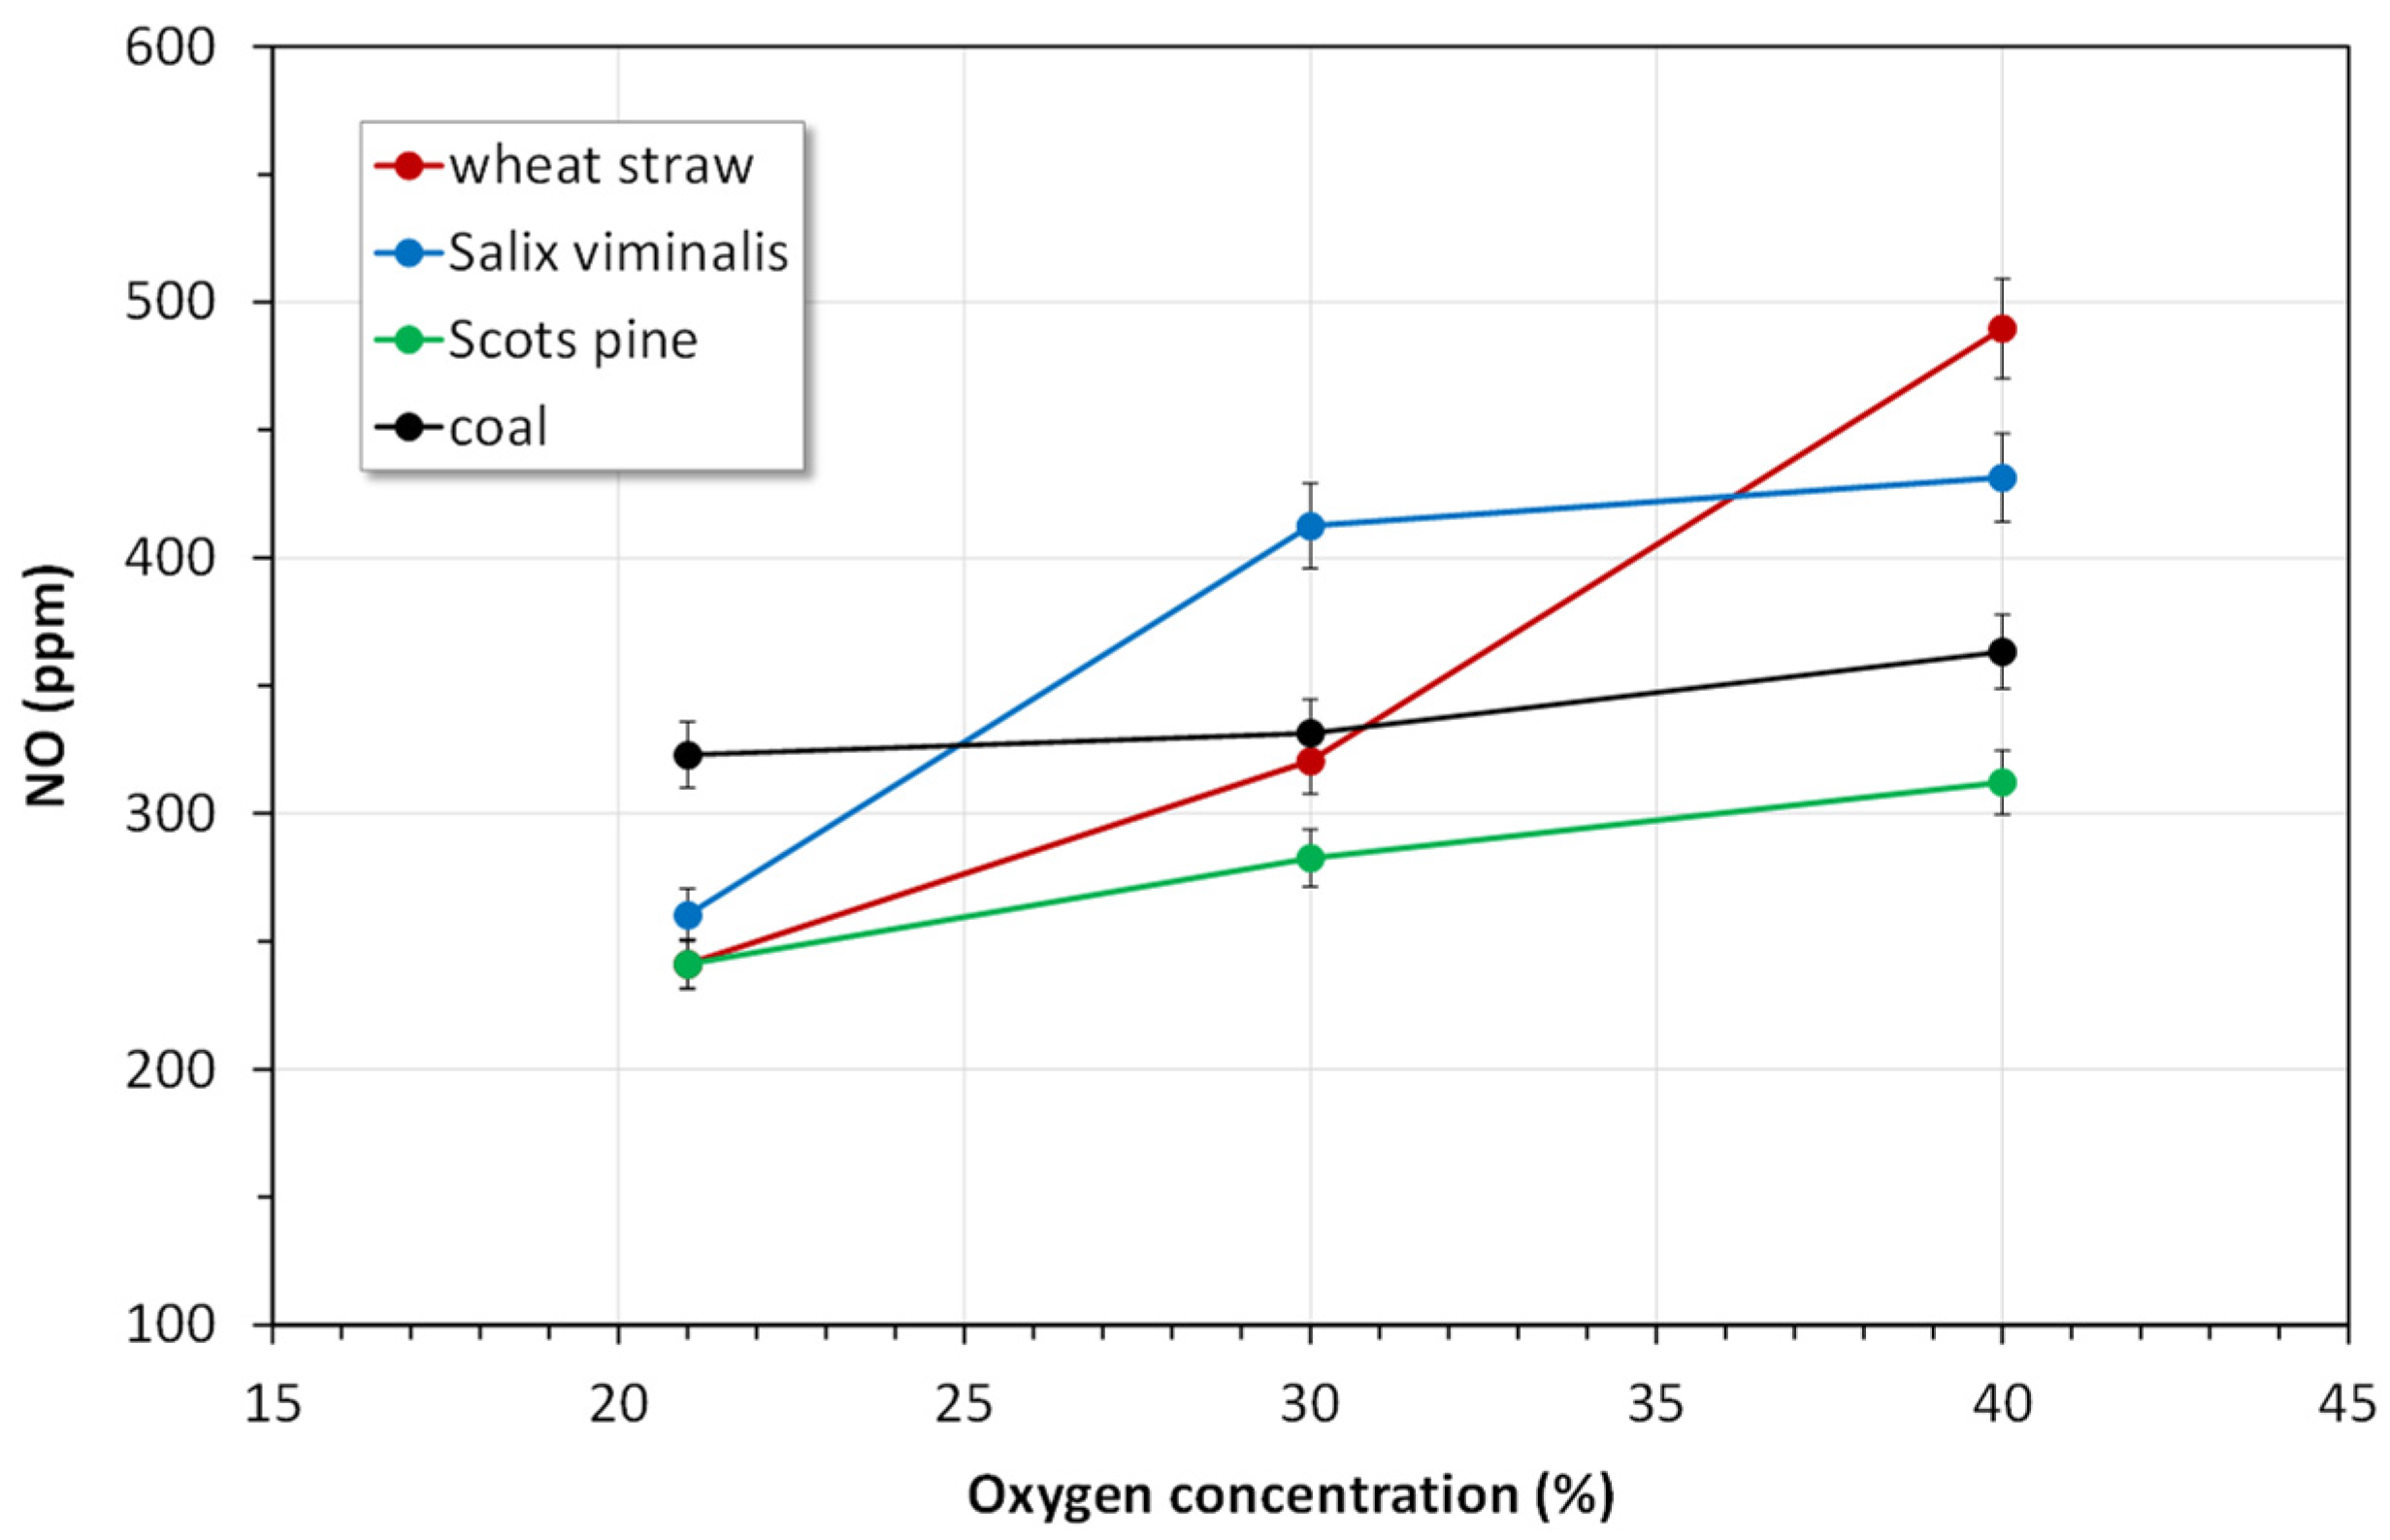
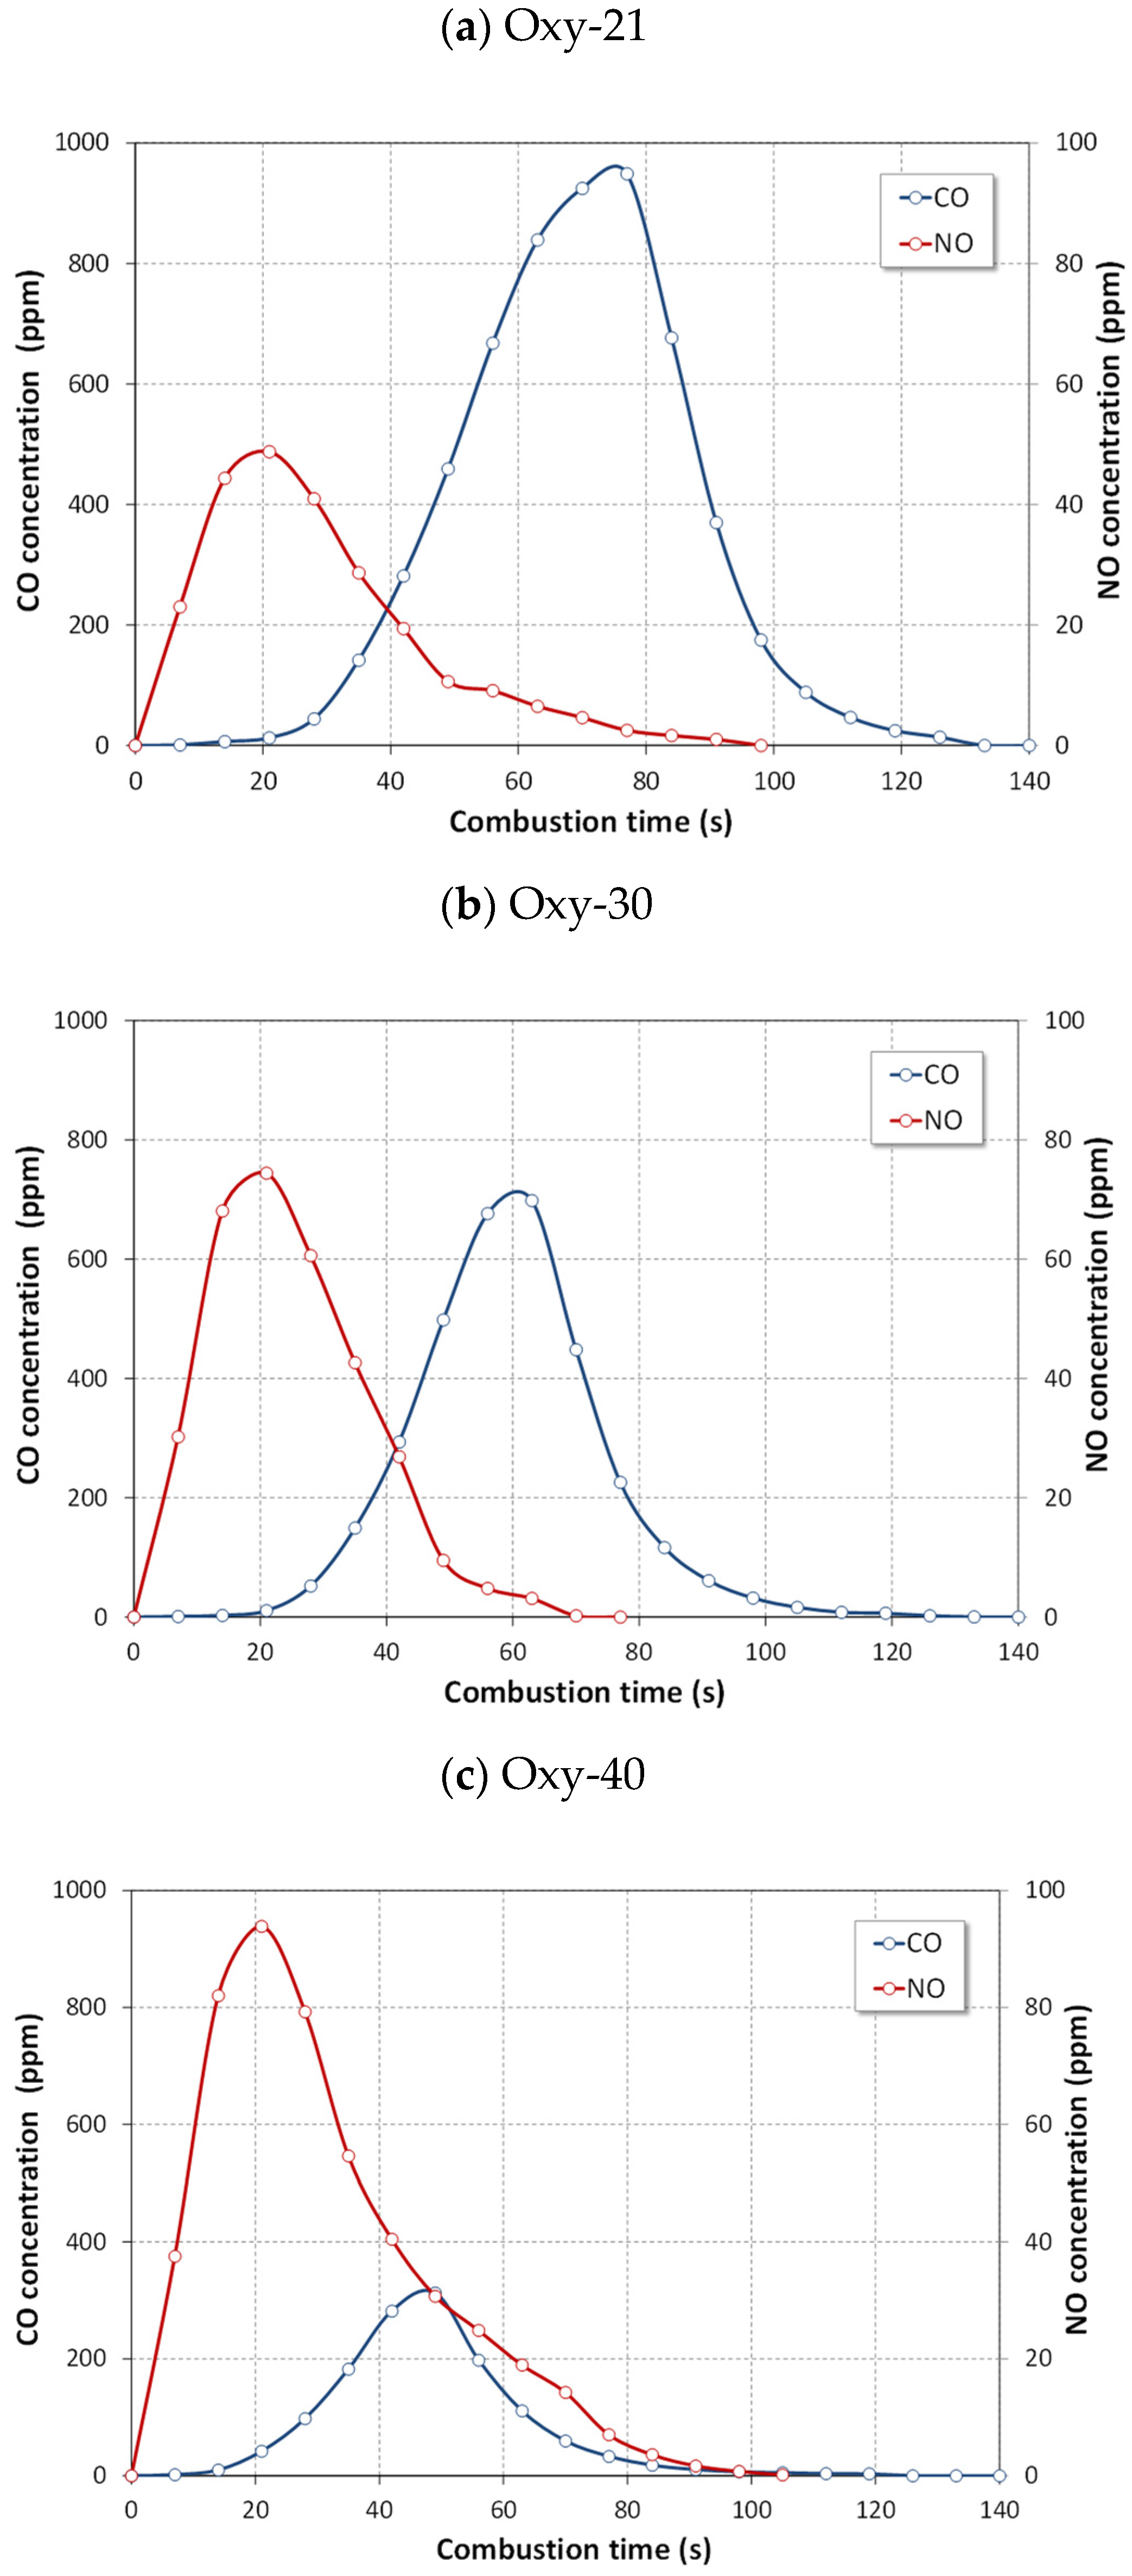
4.2.1. NOx Emissions

Figure 8 and Figure 9 show the time-resolved emissions of NO and N2O during oxy-fuel combustion of all tested fuels. During oxy-combustion, the highest NO emissions were detected during the volatiles combustion after 14 s for Scots pine (Figure 8c), 21 s for wheat straw (Figure 8a) and willow (Figure 8b), and 28 s for coal (Figure 8d). The lowest NO concentrations in a flue gas were observed during combustion in 21% O2/79% CO2 environment for all fuels, due to the lower temperature of fuel particle [23,24]. During oxy-21 combustion of wheat straw (Figure 8a), the highest NO concentration was approximately 50 ppm and it was 25 ppm lower than that in air combustion (Figure 1a). Concentrations of NO increased with increasing O2 content in the O2/CO2 mixture. The highest NO concentrations were detected in 40% O2/60% CO2 atmosphere and were approximately 95 ppm and 75 ppm for wheat straw and Salix viminalis, respectively. The maximum value of NO concentration for wheat straw was about twice as high in oxy-40 than that in oxy-21.
Emissions of N2O were significantly lower in comparison with NO emissions. Nitrous oxide was formed simultaneously with NO, which implies that formation of N2O proceeded by direct oxidation of fuel nitrogen rather than by the reduction of NO. The highest N2O concentrations were detected during volatile matter combustion in the oxy-21 atmosphere. The highest value of N2O concentration, approximately 18 ppm, was observed for the combustion of wheat straw (Figure 9a). As the oxygen concentration in O2/CO2 atmosphere increased, N2O concentrations decreased. The lowest N2O emissions (below 5 ppm) were observed for oxy-combustion of Scots pine, the fuel with the lowest nitrogen content.
Emissions of NO2 were only detected during char combustion in oxy-21 atmosphere. The highest instantaneous NO2 concentration did not exceed 6 ppm for coal and 4 ppm for wheat straw. Figure 10 shows total NO, N2O and NO2 emissions during combustion in the oxy-21 atmosphere. Total emissions of NO2 were approximately 20 ppm and 10 ppm for coal and wheat straw, respectively. This finding is consistent with the results obtained by Lasek et al. [31].
Figure 11 shows the split of NO and N2O emissions between volatile-N and char-N oxidation during burning of biomass fuels and coal in all atmospheres. Oxidation of volatile matter accounts for approximately 75% of total NO formed and char oxidation contributed 25% for wheat straw in the oxy-21 atmosphere while for coal 40% and 60%. Combustion of wheat straw in the oxy-40 atmospheres caused oxidation of volatile-N for approximately 60% of total NO formed, and char oxidation contributed 40% for wheat straw (68% and 32% for Salix viminalis; 80% and 20% for Scots pine; 60% and 40% for coal).
In the case of N2O (Figure 12), during oxy-combustion, contributions of volatile-N and char-N are completely different than that in air-combustion. Oxidation of volatile matter accounts for approximately 85% of total N2O formed, and char oxidation contributed 15% for wheat straw and Scots pine in the oxy-21 atmosphere. (93% and 7% for Salix viminalis; 80% and 20% for Scots pine; 51% and 49% for coal).
Combustion of wheat straw in the oxy-40 atmospheres caused oxidation of volatile matter for approximately 77% of total N2O formed and, char oxidation contributed 23% for wheat straw (75% and 25% for Salix viminalis; 90% and 10% for Scots pine; 70% and 30% for coal).
The influence of oxygen concentration in the O2/CO2 mixture on the total emissions of NO is shown in Figure 13. As expected, emissions of NO increase with increasing O2 content in the mixture, particularly for biomass fuels. The emission of NO also increased with the particle temperature due to the decrease in CO emission. Higher particle temperatures helped the oxidation of NCO to NO, too [29]. Moreover, higher concentration of O2 in the riser enhance the combustion of volatile matter and char and lead to an increase in NO formation. This remark has been confirmed by the results obtained by Czakiert et al. [32] and Jankowska et al. [33].
The opposite trend can be observed for N2O emissions (Figure 14). As the oxygen concentration in O2/CO2 mixture increases, N2O concentrations in a flue gas decrease, mainly for coal.
Hydrogen cyanide is a main precursor of N2O formation. It should be mentioned that HCN is a very toxic gas (approximately 20 times more toxic than CO) that already affects human beings at ppm levels [31]. Higher concentrations of HCN were generated during oxy-fuel combustion. Emissions of HCN were the highest in oxy-21 atmosphere, particularly during char combustion. The highest instantaneous concentrations of HCN did not exceed 6 ppm both for biomass fuels and coal. Similar results were reported in our previous study [22] and by Lasek et al. [31].
The highest NH3 emissions were observed during combustion in oxy-30 and oxy-21 atmospheres. However, the instantaneous concentrations of NH3 were very low; they did not exceed 3 ppm for all fuels. High concentrations of CO2 inhibited oxidation of HCN and NH3 to NOx.

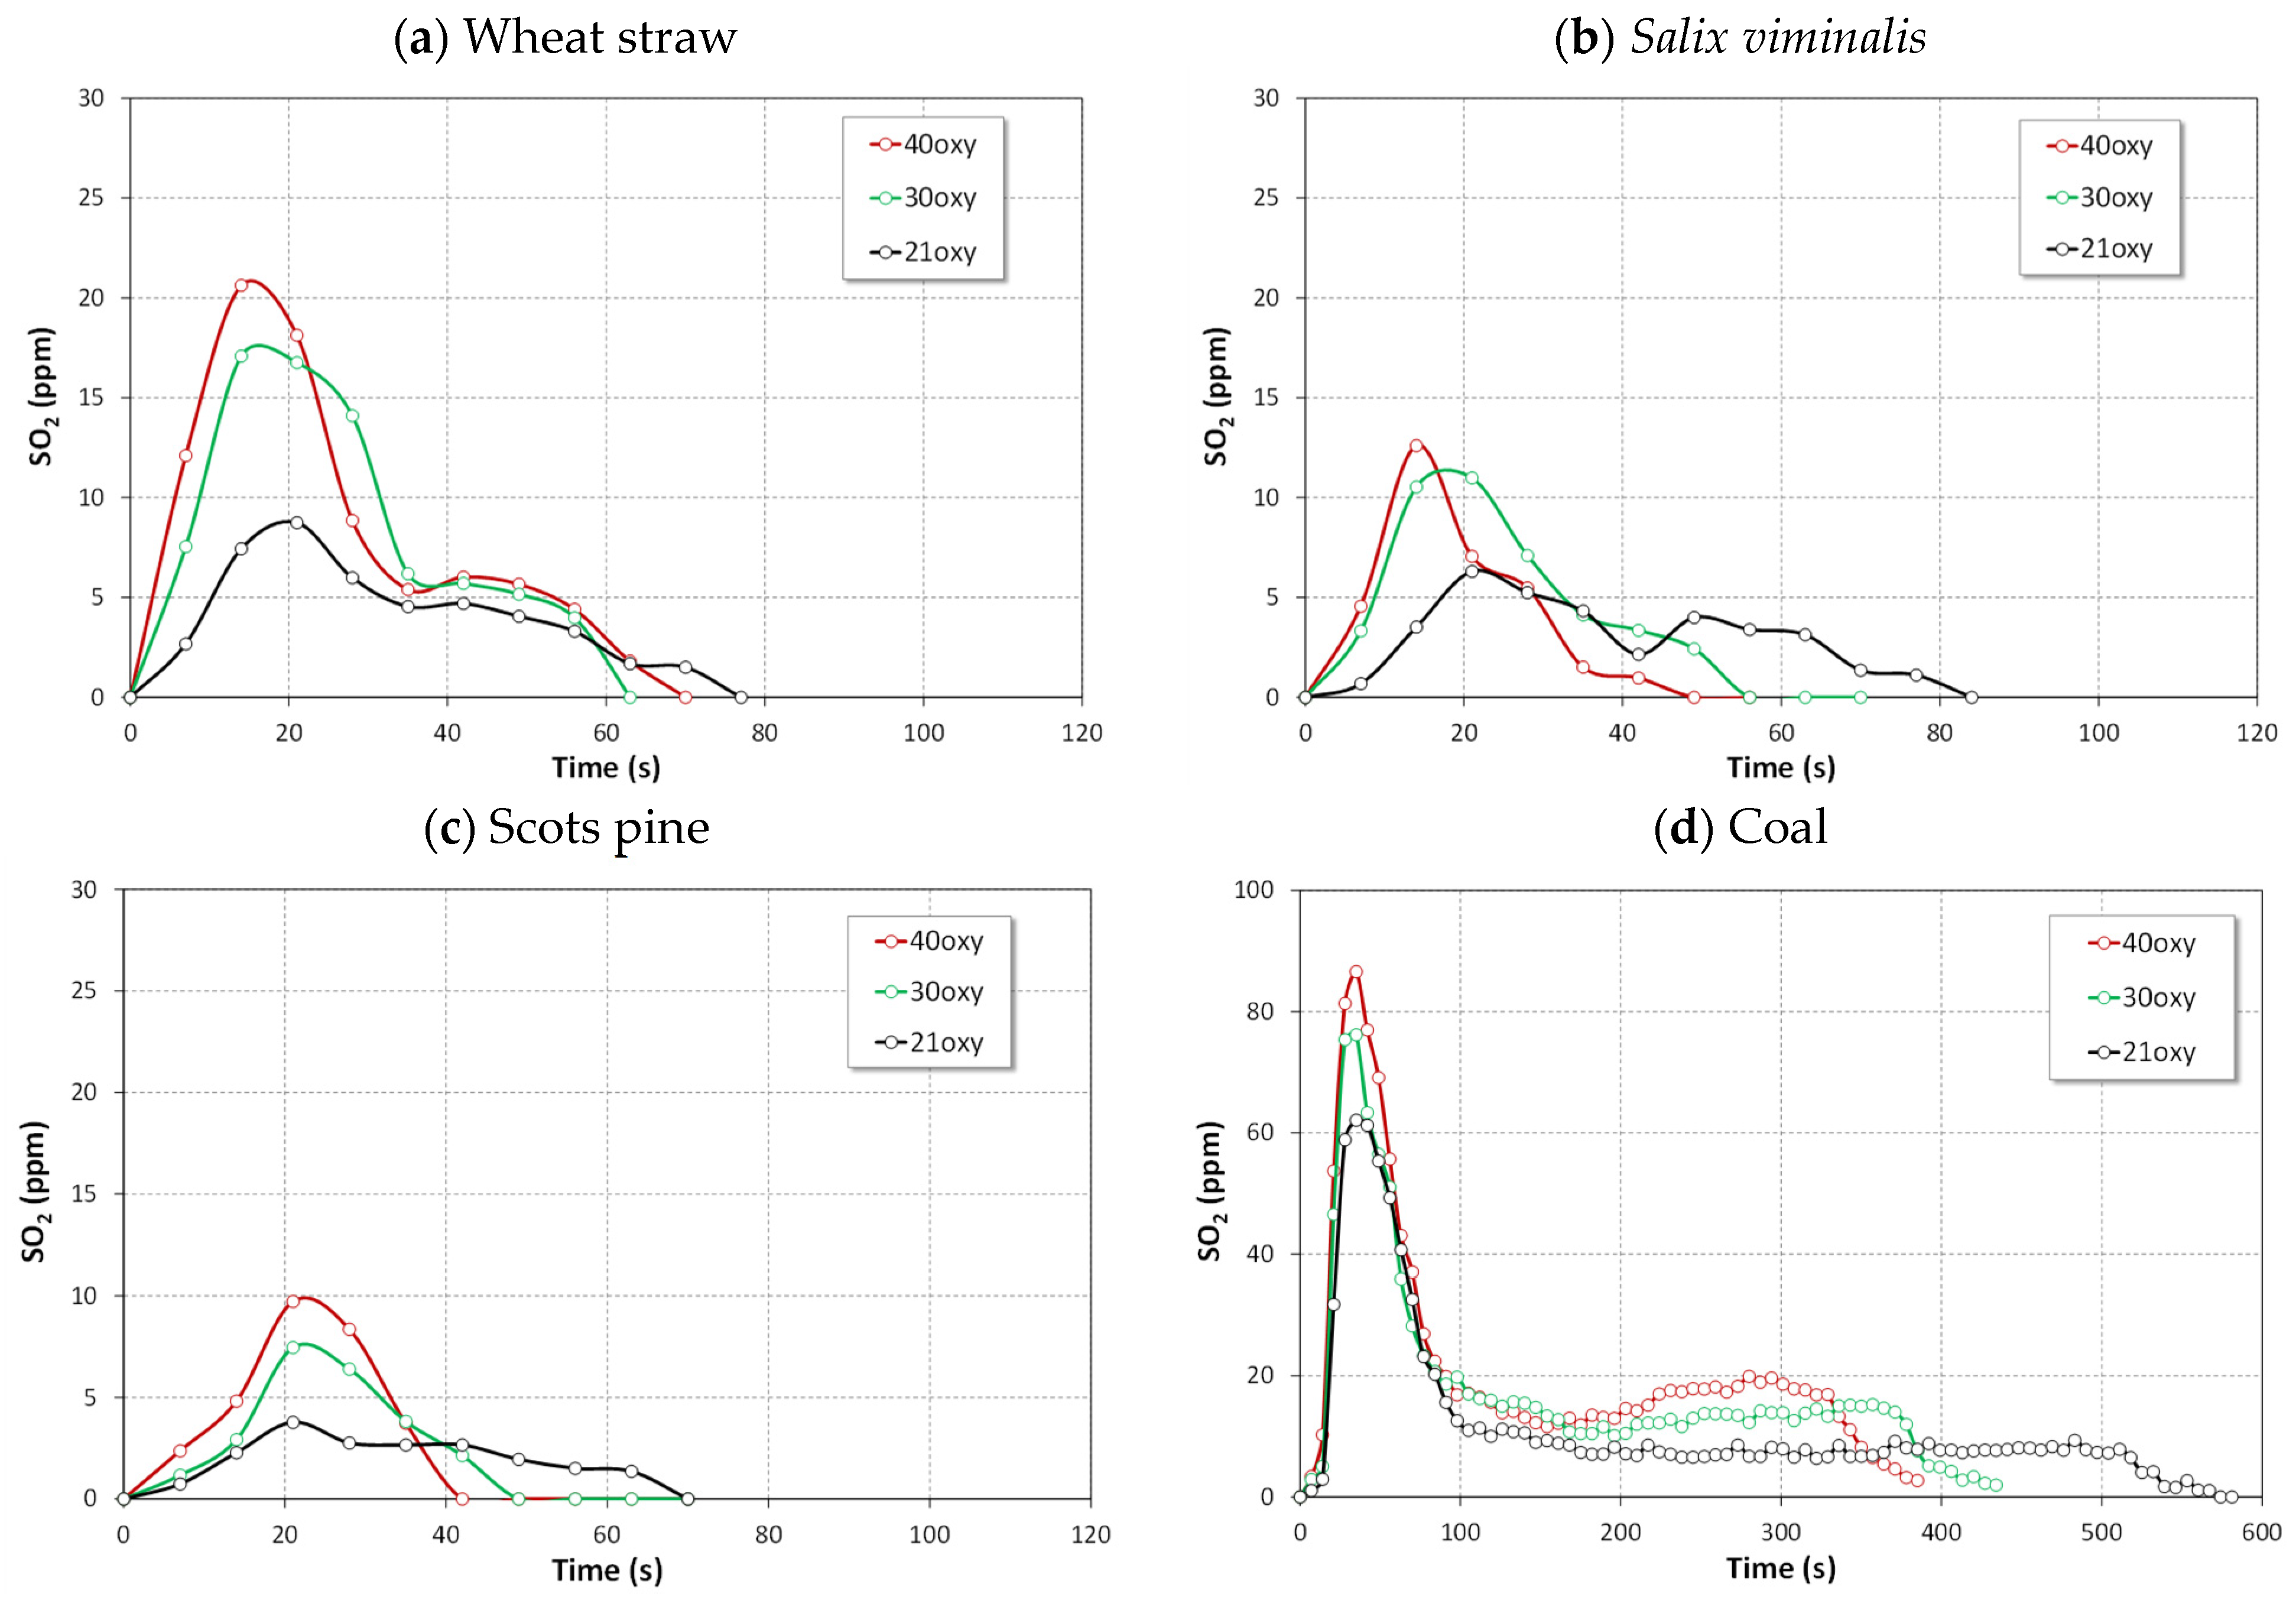
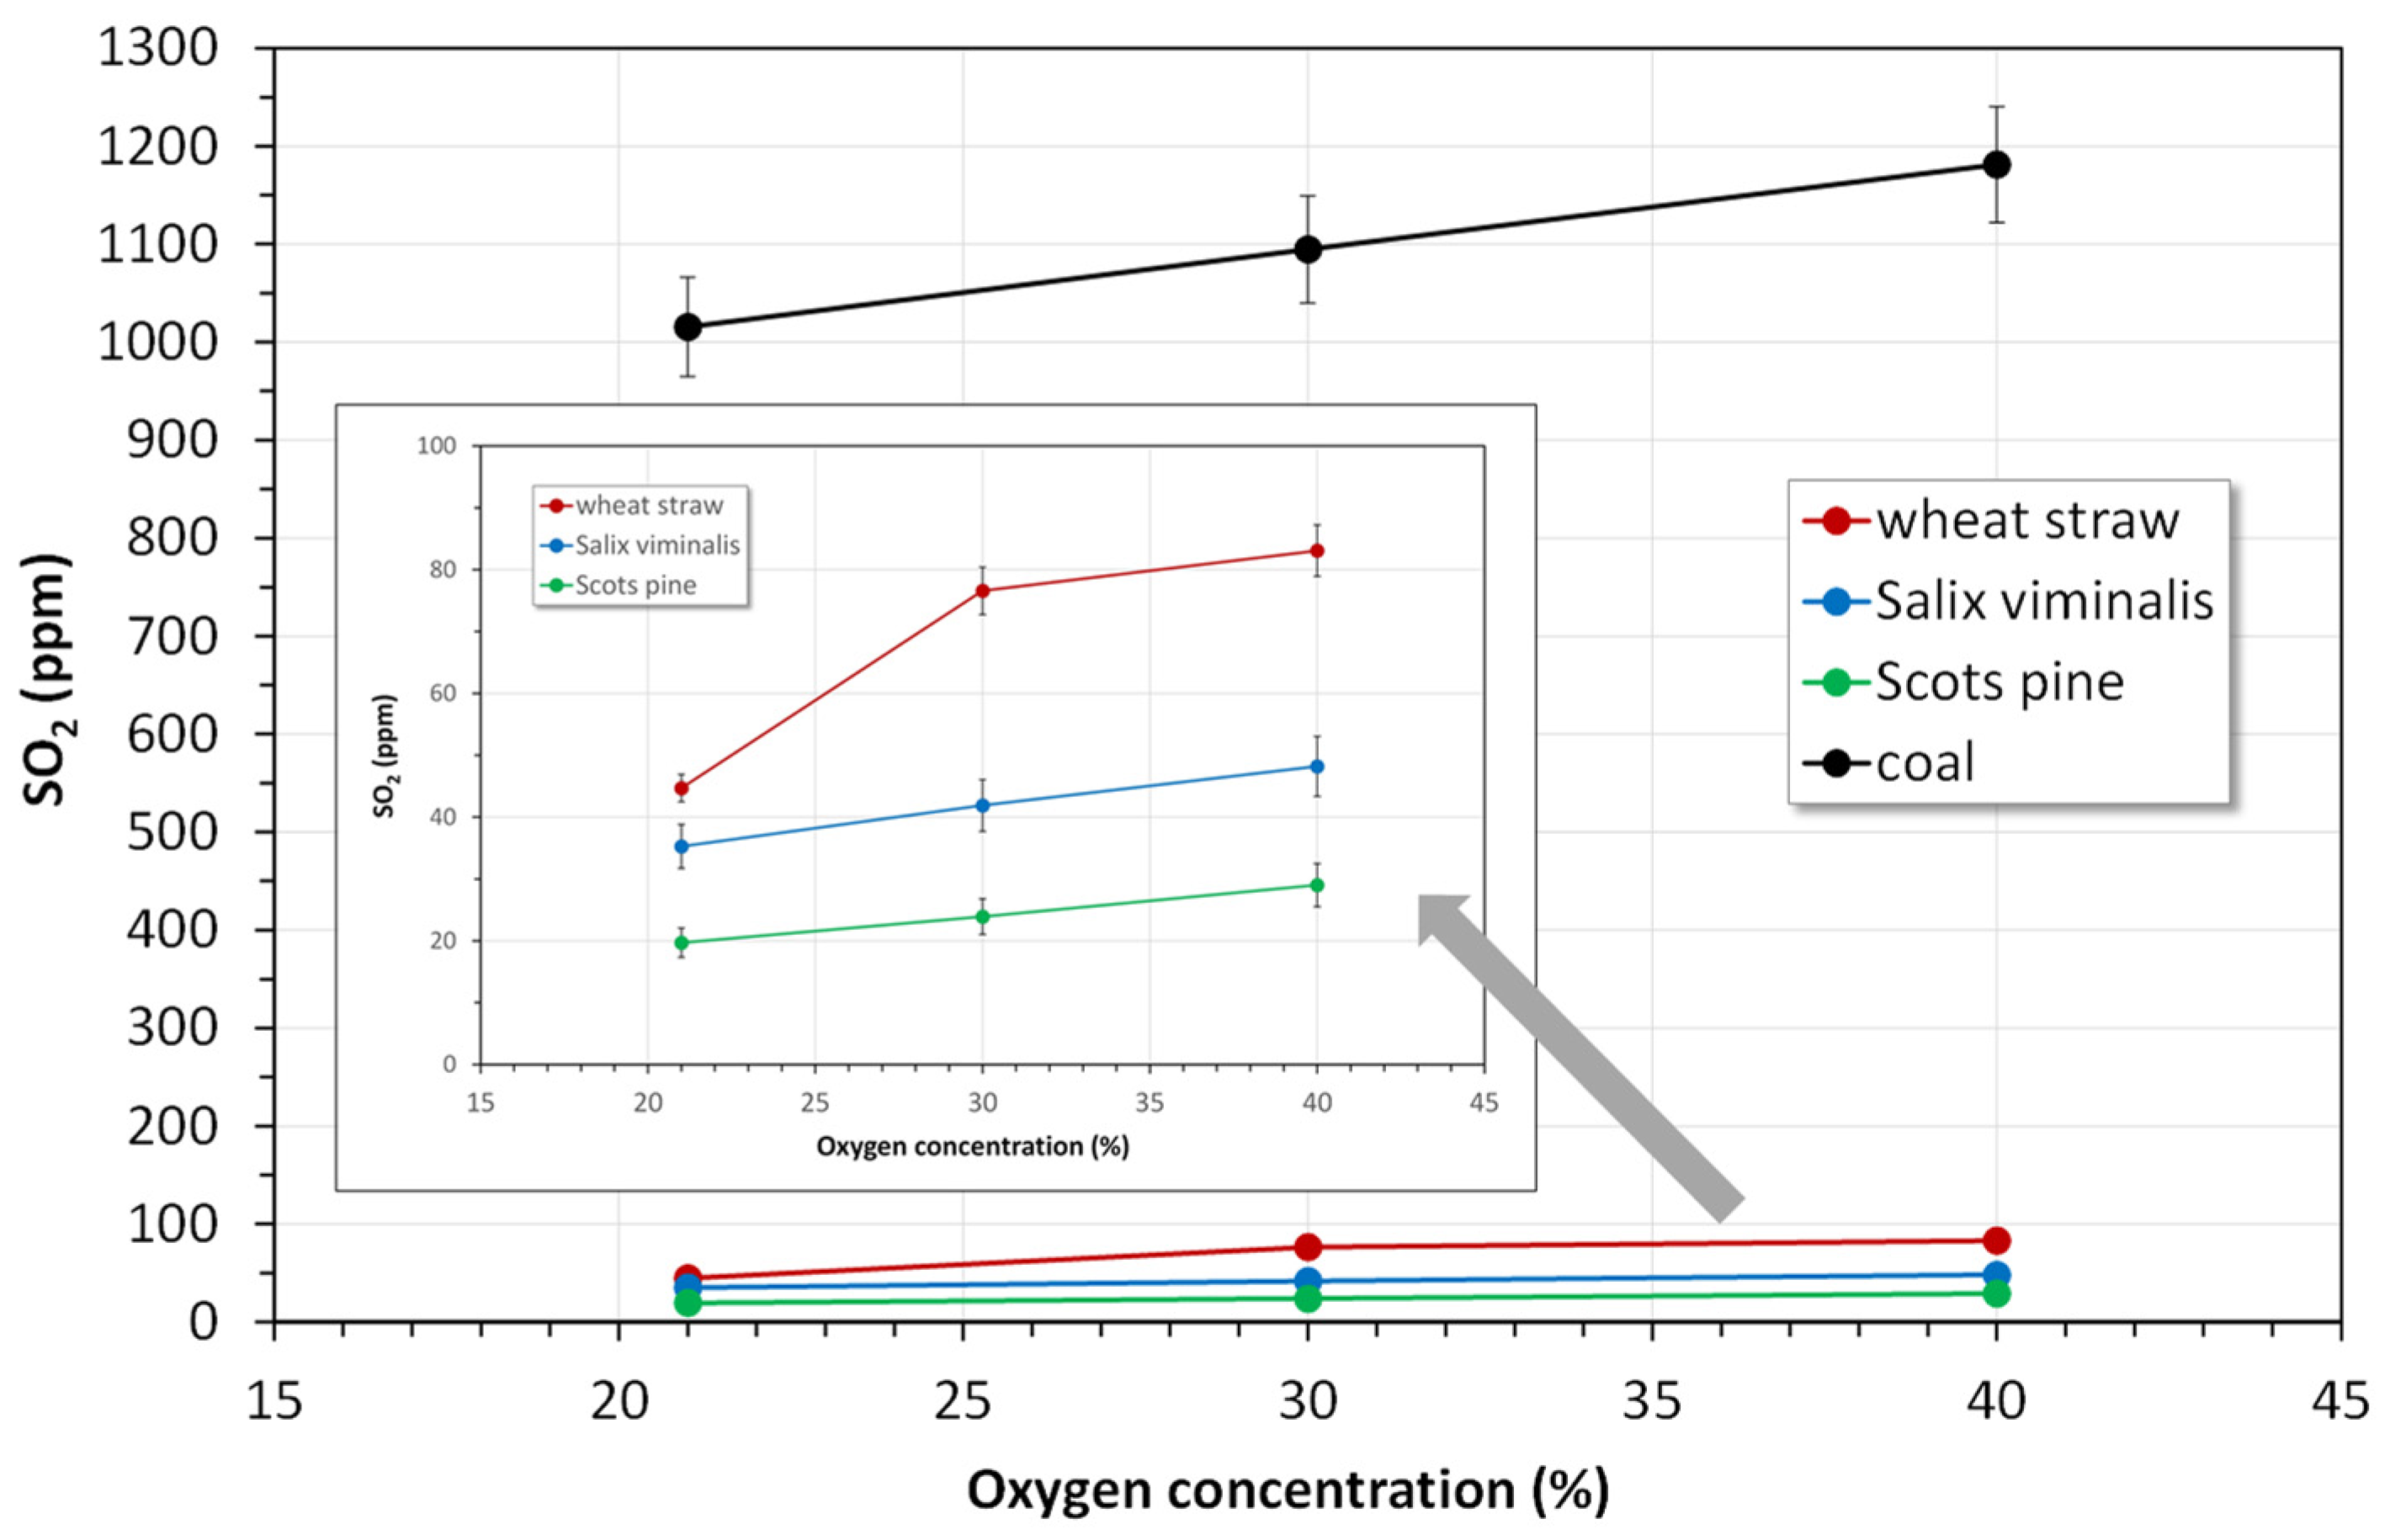
4.2.2. Emissions of SO2
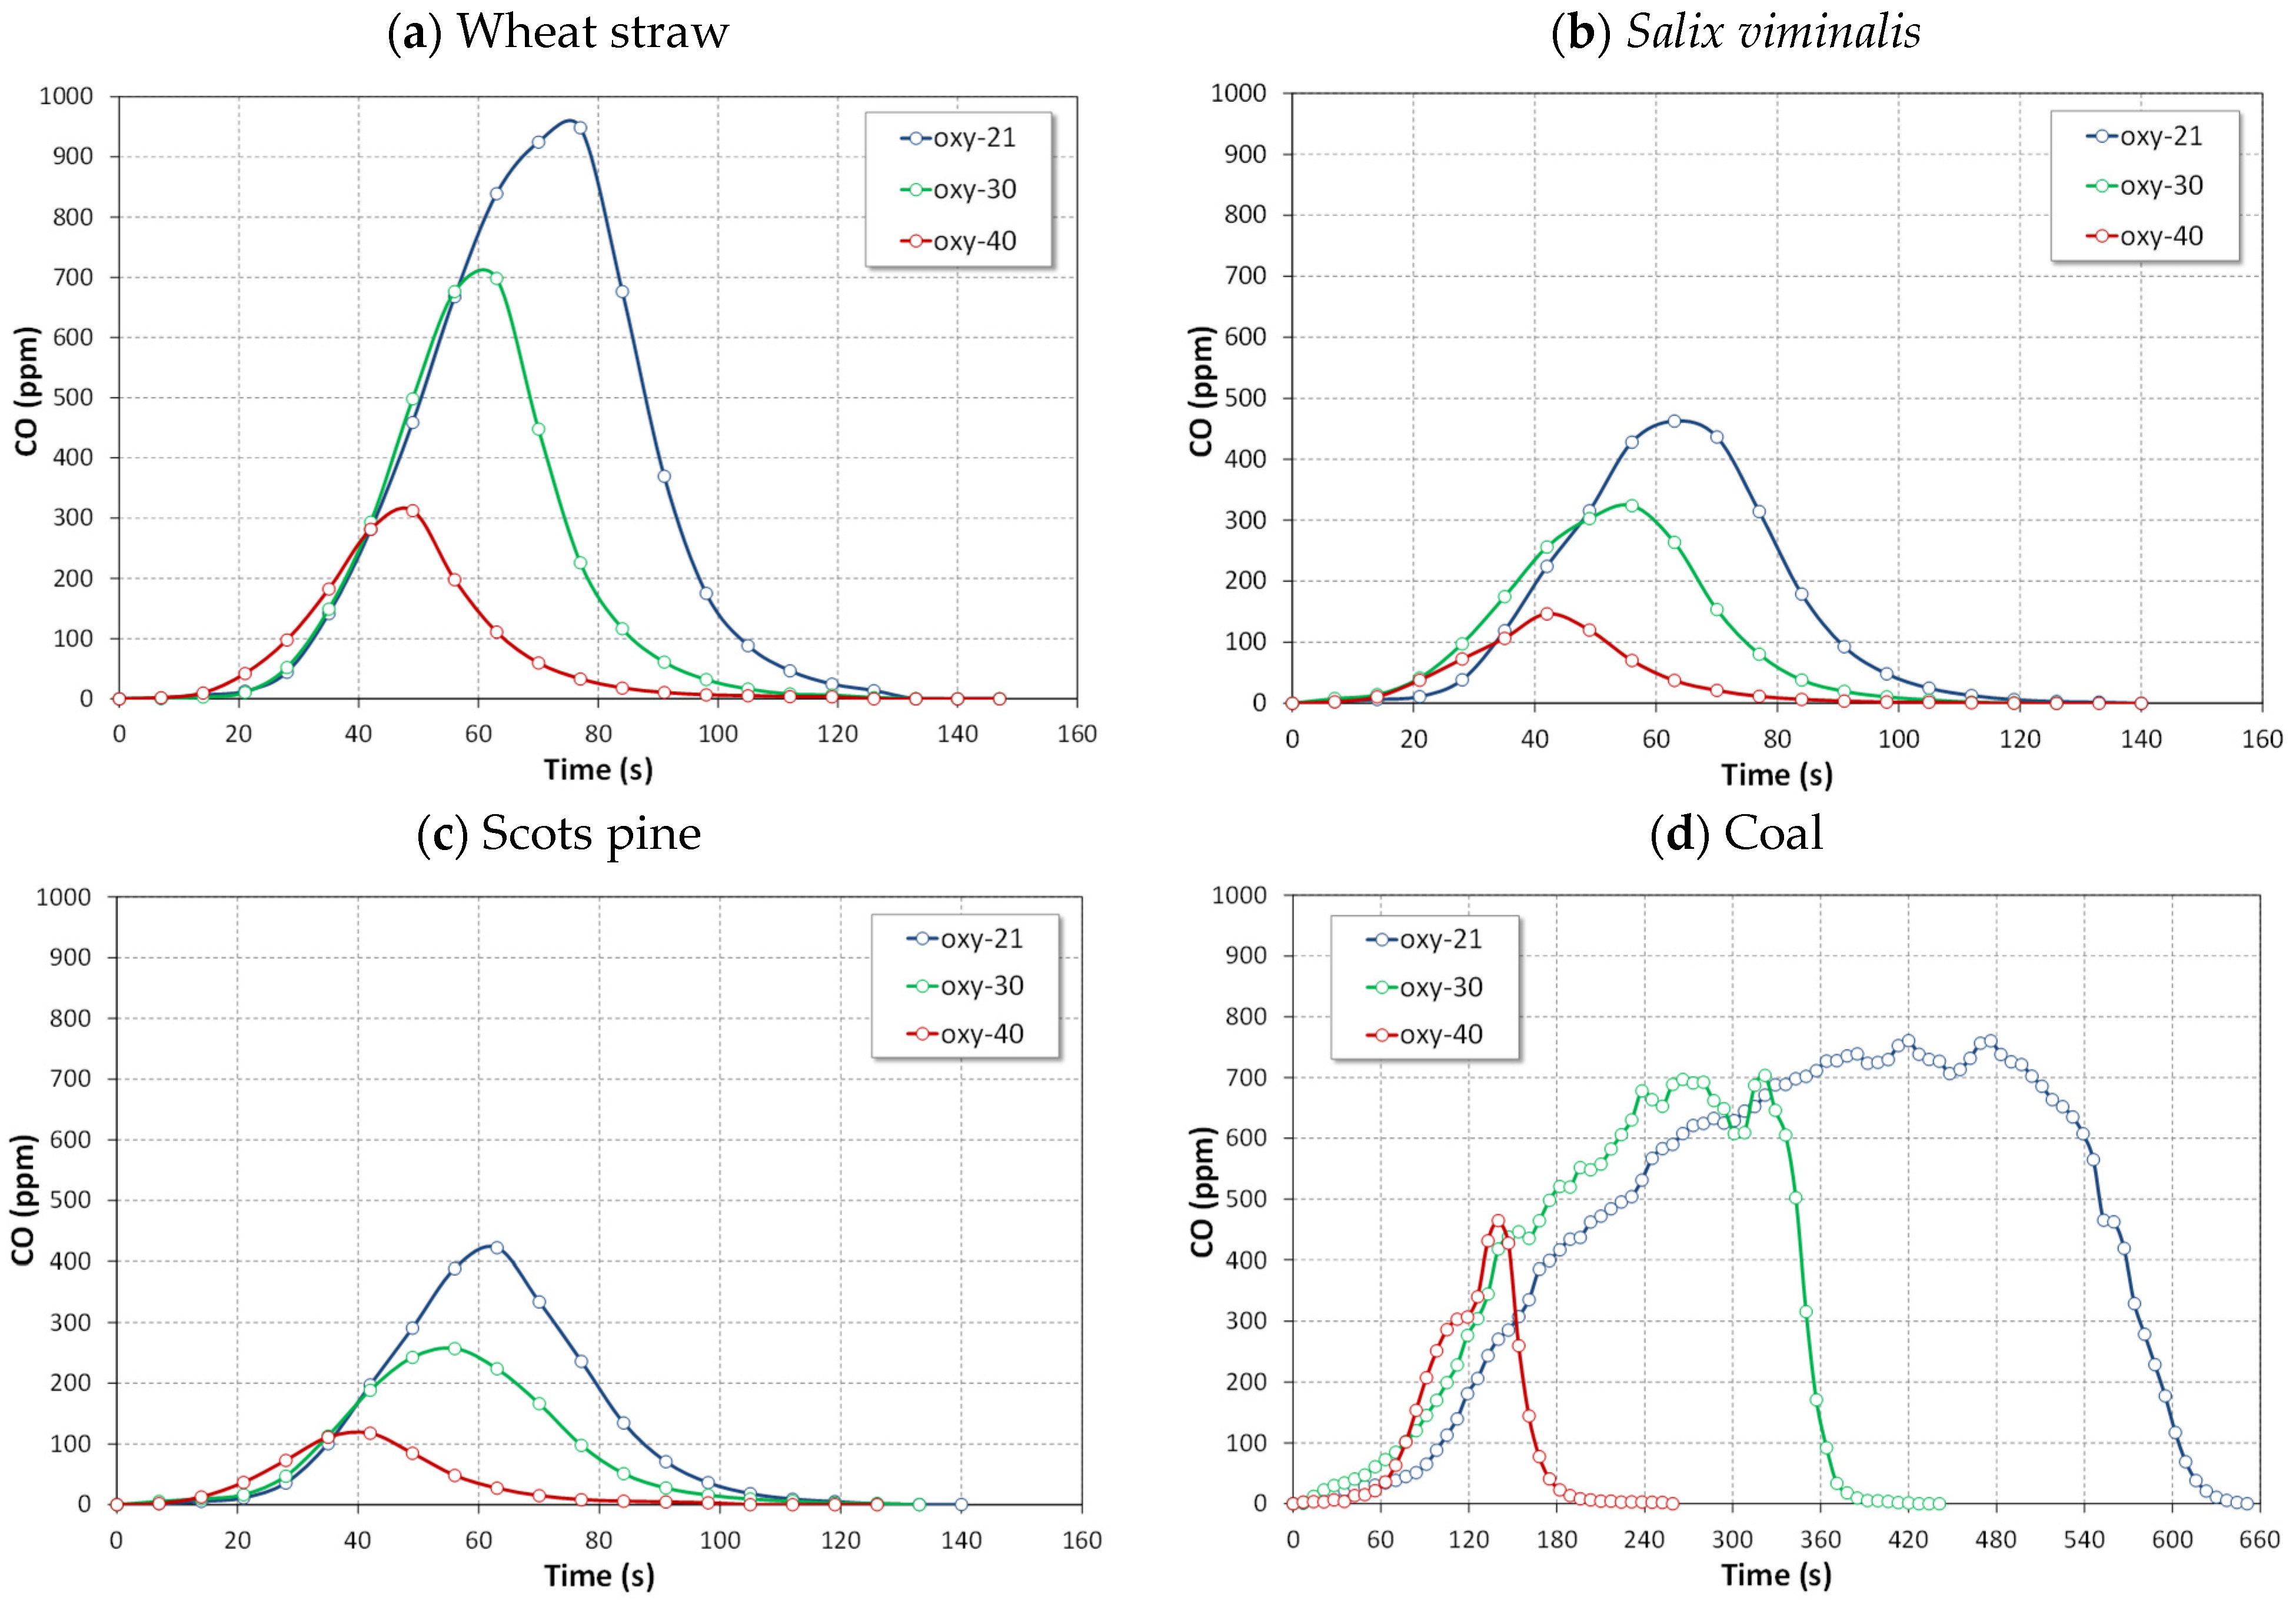
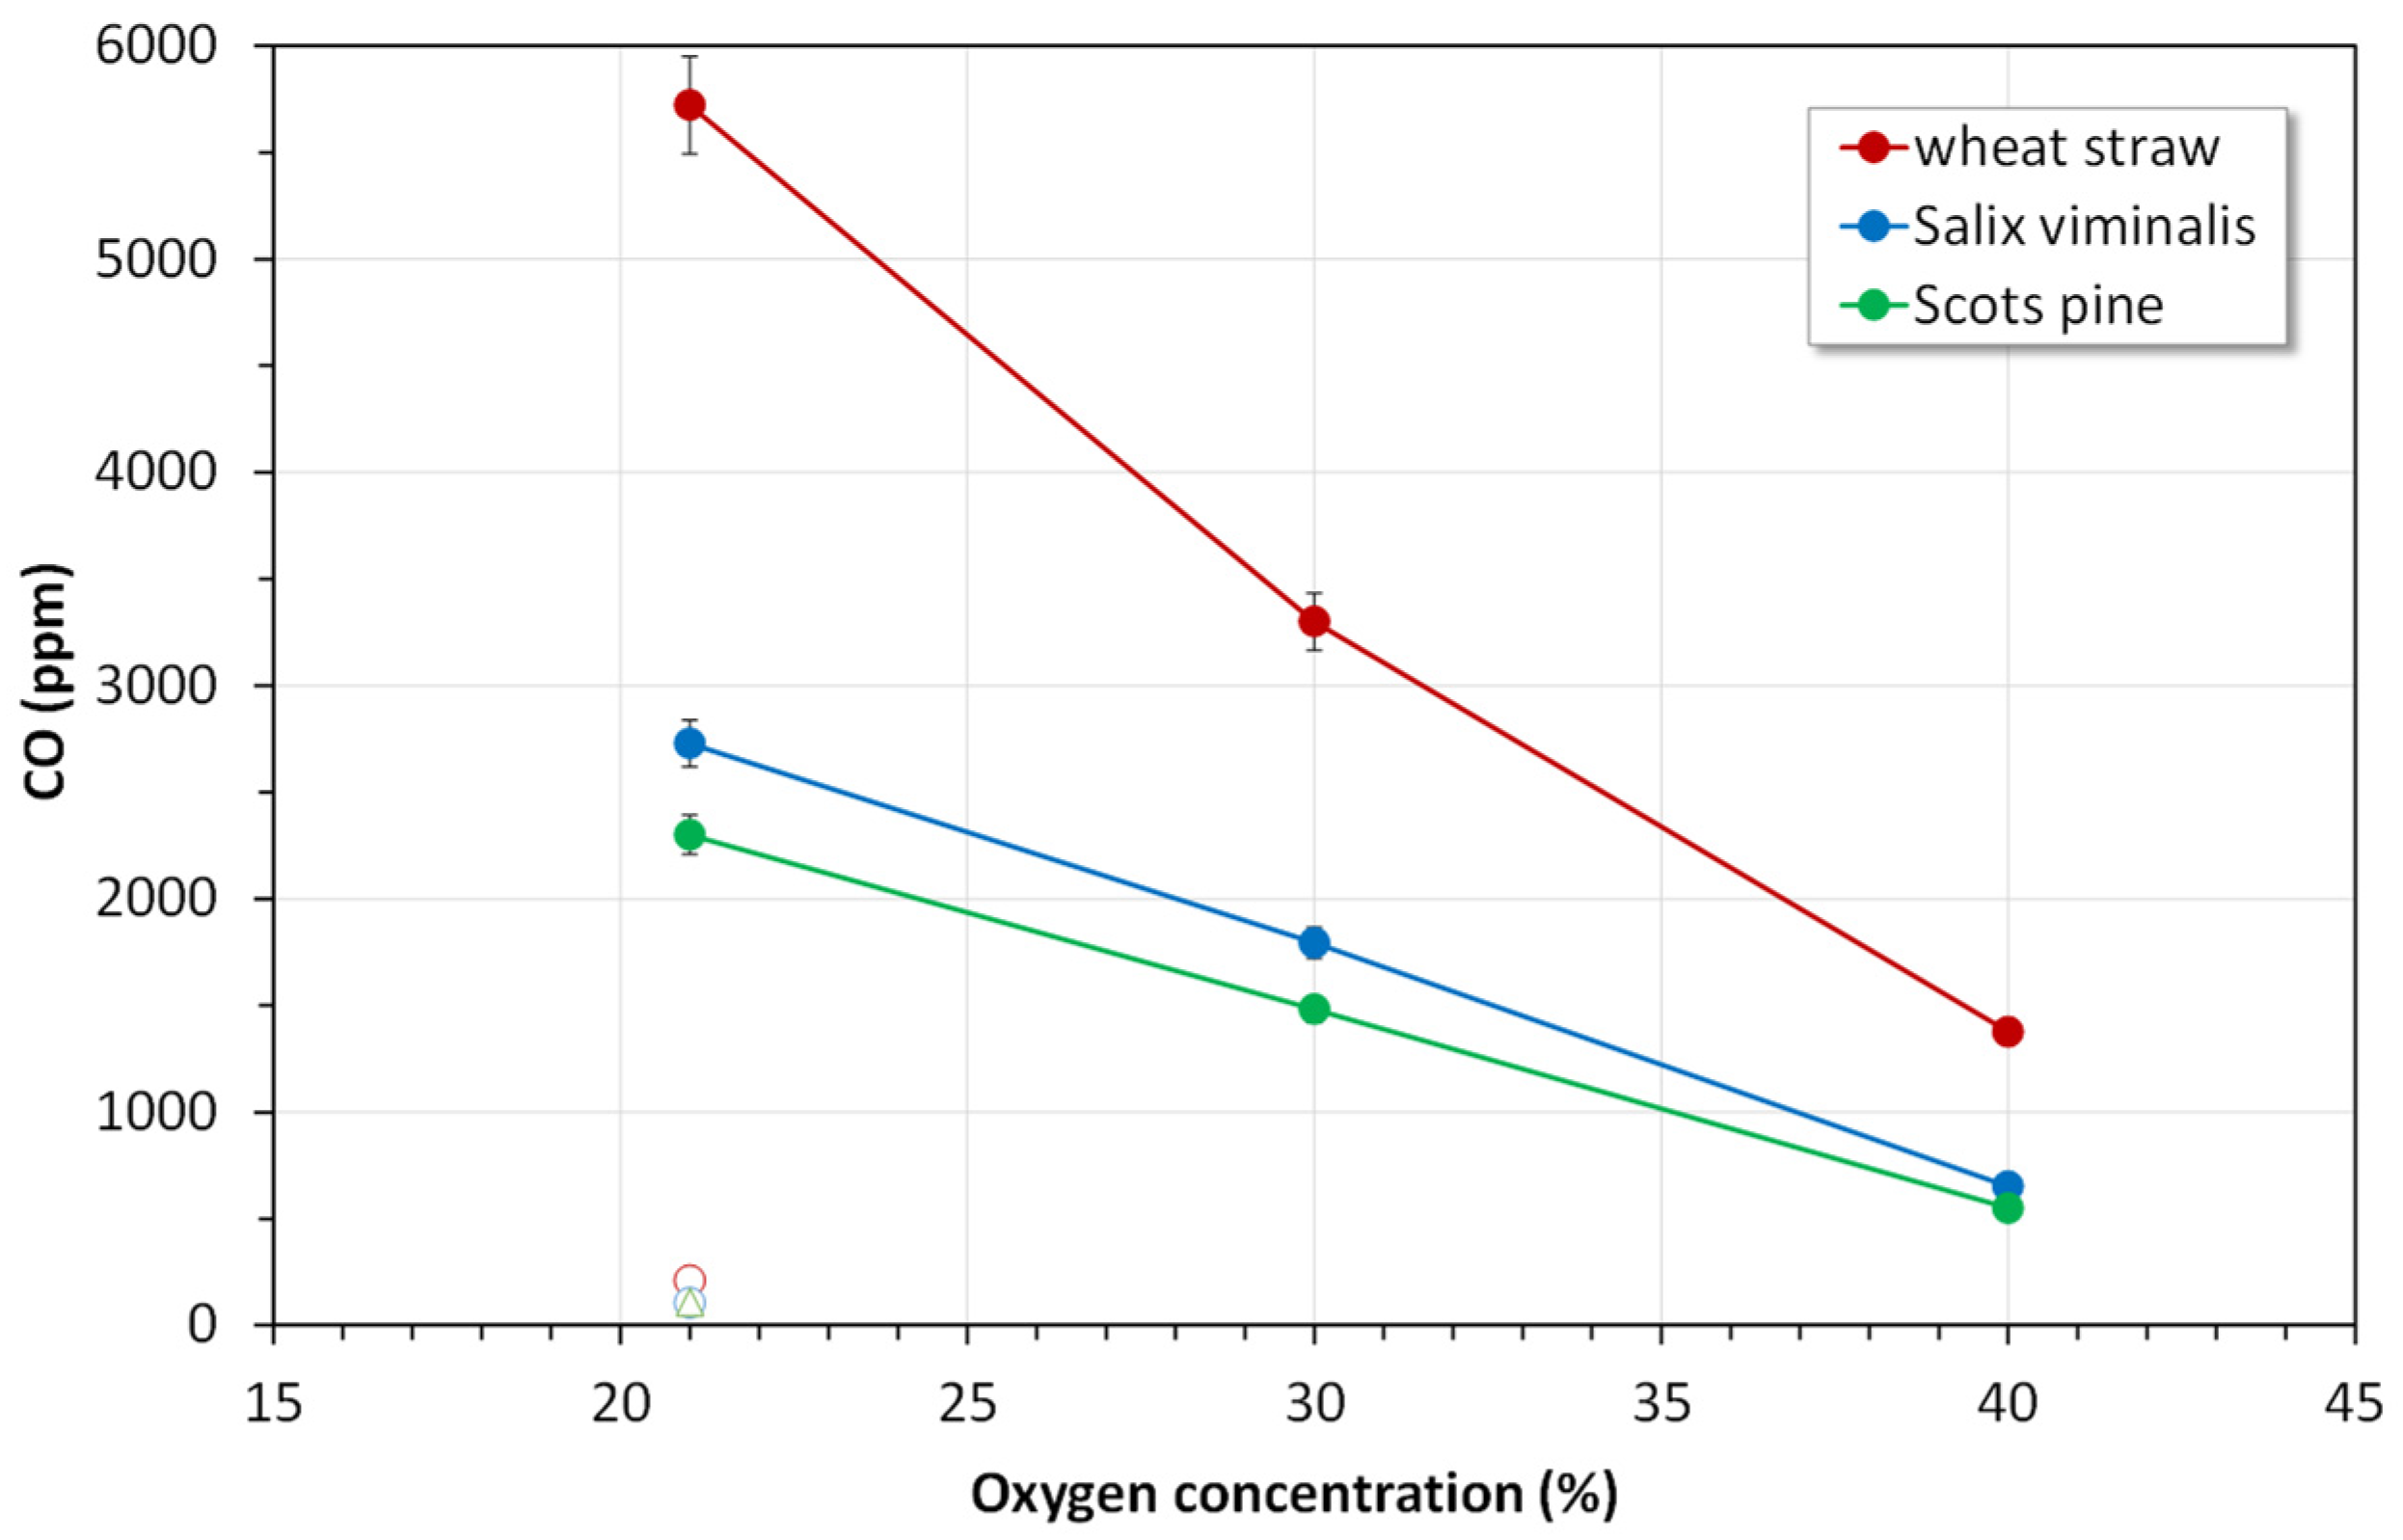
The SO2 emissions during biomass fuels and coal combustion in various environments are shown in Figure 15. The instantaneous SO2 concentrations during oxy-combustion of biomass were much lower than those for the combustion of reference coal. The times of SO2 release were 40–90 s for biomass and 380–580 s for coal in all O2/CO2 mixtures. The highest emissions of SO2 were observed during the combustion of volatiles, for both biomass and coal. Compared with air-combustion, burning both biomass fuels and coal in oxy-21 atmosphere caused a minor increase in emissions of SO2. The highest SO2 emission in oxy-21 mixture was approximately 62 ppm for coal. An increase in the oxygen inlet concentration caused higher emissions of SO2. The highest SO2 emissions were detected in oxy-40 atmosphere and was 86 ppm for coal. The highest concentrations of SO2 in oxy-40 for biomass fuels were 21 ppm, 13 ppm and 10 ppm for wheat straw, Salix viminalis and Scots pine, respectively.
Figure 16 shows the influence of the oxygen concentration on the total emission of SO2. It can be seen that an increase in the oxygen inlet concentration resulted in higher SO2 emissions, particularly for coal. Combustion of wheat straw in the oxy-40 atmosphere caused twice as higher emission of SO2 than that in oxy-21. A similar trend for coal and biomass fuels during oxy-combustion was found in references [19,31,34,35].

4.2.3. CO Emissions

Concentrations of CO during oxy-fuel combustion are shown in Figure 17 and Figure 18. These results reveal a significant impact of the composition of oxidizing gas mixture on CO emissions. Combustion of biomass or coal in the oxy-21 mixture caused a strong increase in CO concentrations in comparison with air-combustion (see Figure 3). The highest CO emissions were approximately 950 ppm and 760 ppm for wheat straw and coal, respectively. This phenomenon can be explained by the influence of three chemical reactions [2,3,31,32]: Boudouard’s reaction Equation (1), the reaction of CO2 with H radical Equation (2) and the dissociation of CO2 Equation (3):
CO 2 + C     2 CO
CO 2 + H     CO + OH
CO 2     CO + 1 2 O 2
Reaction (1) seems to play a leading role in the conversion of CO under conditions typical for fluidized-bed combustion [31]. As oxygen concentration increased, the emission of CO was reduced. In oxy-40 environment, the highest CO emissions were three times lower for biomass fuels than that in the oxy-21 mixture. The highest instantaneous CO concentrations were 760 ppm, 700 ppm and 465 ppm in oxy-21, oxy-30 and oxy-40, respectively. The analogous trends were reported in references [31,36,37,38].
Moreover, the reduction of NO to N2 in the presence of an active char and higher concentrations of CO is enhanced through the heterogeneous NO reduction reaction [37,39]:
CO + NO     CO 2 + 1 2 N 2
According to results presented by Lupianez et al. [14,15,16], a high level of CO in the flue gas is a result of incomplete combustion, which is a symptom of lower combustion efficiency. Thus, in this case, the reduction of NO to N2 is a consequence of such deficiency (Figure 19).
The results of this study show that the tested biomass fuels are ideal renewable energy resources both in conventional and oxy-fuel conditions with a minor potential for environmental pollution. According to the EU’s Large Combustion Plant Directive, emission limits for NO (as NO2), SO2 and CO are 200 mg/m3n (dry gas at 6% O2), and 20 mg/m3n for particulate matter (fly ash). In the case of coal-fired CFB boilers, these limits can only be met with De-NOx (selective non-catalytic reduction) and De-SOx (in situ SO2 capture) systems. Biomass fuels usually contain much less nitrogen, sulfur and mineral matter than coals. Since the magnitude of NOx and SO2 emissions is strongly related to the content of N and S in the fuel, a proper combination of combustion technique, operating conditions, and biomass fuel can deliver a combustion system with significantly reduced requirements for De-NOx and De- SOx systems or even eliminate them.
These experimental results can be used to optimize the combustion process of biomass fuels in the CFB oxy-combustion technology. The data can also be useful in mathematical modeling of biomass combustion both in conventional and oxy-combustion processes.

5. Conclusions

Three kinds of biomass and bituminous coal were burned in a laboratory-scale CFB combustor, and the influence of fuel type and oxidizing atmosphere on pollutant emissions were studied. Pellets were burned in air and oxy-combustion environments (oxy-21, oxy-30 and oxy-40) at 850 °C. The major conclusions from this study are as follows:
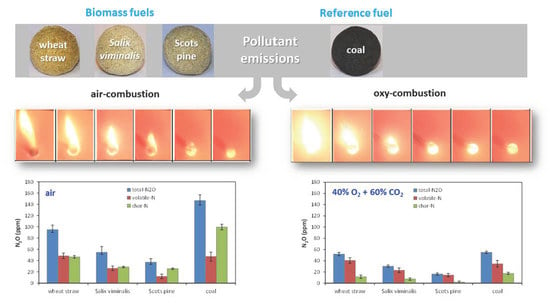
  • The instantaneous emissions of SO2, N2O and CO for the combustion of biomass fuels in all atmospheres were lower than those for the combustion of bituminous coal.
  • The instantaneous NO concentrations for the combustion of biomass fuels in all atmospheres were higher than those for the combustion of reference coal.
  • Oxidation of nitrogen species released with volatile matter was responsible for high emissions of NOx during combustion of biomass fuels in air and mixtures of O2 and CO2.
  • The highest instantaneous emissions of all gaseous pollutant during combustion of biomass fuels were observed for agro biomass (wheat straw) in both air and oxy-fuel atmospheres.
  • The lowest emissions of all gaseous pollutant during combustion of biomass fuels were observed for woody biomass (Scots pine) in both air and oxy-fuel atmospheres.
  • The lowest NO emissions and the highest N2O emissions for tested fuels were detected in oxy-21 atmosphere owing to lower temperature of fuel particles.
  • The instantaneous CO emissions for the combustion of biomass in all atmospheres were much lower than those for the combustion of reference coal.
  • Oxy-combustion of biomass or coal caused a significant increase in emissions of CO in comparison with air-combustion. This observation can be attributed to CO2 + C(char) reaction (the Boudouard reaction).
  • Combustion of biomass in oxy-30 or oxy-40 atmospheres causes an increase in SO2 and NO emissions and a reduction in of CO and N2O emissions.
  • Considering all pollutant emissions during oxy-combustion of biomass fuels, the optimal atmosphere is oxy-30.

Author Contributions

Conceptualization, M.K.-G., A.K.-K. and A.L.; methodology, M.K.-G.; formal analysis, M.K.-G. and A.K.-K.; investigation, M.K.-G. and A.K.-K.; writing—original draft preparation, M.K.-G.; writing—review and editing, M.K.-G. and A.L.; project administration, M.K.-G.; funding acquisition, M.K.-G. All authors have read and agreed to the published version of the manuscript.

Funding

Funds to cover costs of publishing in an open access journal were provided by the statute subvention of Czestochowa University of Technology, Faculty of Mechanical Engineering and Computer Science, Department of Thermal Machinery.

Institutional Review Board Statement

Not applicable.

Informed Consent Statement

Not applicable.

Data Availability Statement

Not applicable.

Acknowledgments

The results presented in this paper were obtained from research work co-financed by the National Science Centre (Poland) based on the decision No. DEC-2012/07/B/ST8/03730. The support is gratefully acknowledged.

Conflicts of Interest

The authors declare no conflict of interest.

References

  1. Yadav, S.; Mondal, S.S. A review on the process and prospects of oxy-fuel carbon capture and sequestration (CCS) technology. Fuel 2022, 308, 122057. [Google Scholar] [CrossRef]
  2. Stanger, R.; Wall, T.; Spörl, R.; Paneru, M.; Grathwohl, S.; Weidmann, M.; Scheffknecht, G.; McDonald, D.; Myöhänen, K.; Ritvanen, J.; et al. Oxyfuel combustion for CO2 capture in power plant. Int. J. Greenh. Gas Control 2015, 40, 55–125. [Google Scholar] [CrossRef]
  3. Toftegaard, M.B.; Brix, J.; Jensen, P.A.; Glarborg, P.; Jensen, A.D. Oxy-fuel combustion of solid fuels. Prog. Energy Combust. Sci. 2010, 36, 581–625. [Google Scholar] [CrossRef]
  4. Liu, Q.; Shi, Y.; Zhong, W.; Yu, A. Co-firing coal and biomass in oxy-fuel fluidized bed for CO2 capture: A review of recent advances. Chin. J. Chem. Eng. 2019, 27, 2261–2272. [Google Scholar] [CrossRef]
  5. Duan, L.; Duan, Y.; Zhao, C.; Anthony, E.J. NO emission during co-firing coal and biomass in an oxy-fuel circulating fluidized bed combustor. Fuel 2015, 150, 8–13. [Google Scholar] [CrossRef]
  6. Zhang, X.; Meloni, S. Technology Developments in the Cofiring of Biomass; IEA, Clean Coal Centre: London, UK, 2020. [Google Scholar]
  7. Williams, A.; Jones, J.M.; Ma, L.; Pourkashanian, M.M. Pollutants from the combustion of solid biomass fuels. Prog. Energy Combust. Sci. 2012, 38, 113–137. [Google Scholar] [CrossRef]
  8. Varol, M.; Symonds, R.; Anthony, E.J.; Lu, D.; Jia, L.; Tan, Y. Emissions from co-firing lignite and biomass in an oxy-fired CFBC. Fuel Processing Technol. 2018, 173, 126–133. [Google Scholar] [CrossRef] [Green Version]
  9. Singh, R.I.; Kumar, R. Current status and experimental investigation of oxy-fired fluidized bed. Renew. Sustain. Energy Rev. 2016, 61, 398–420. [Google Scholar] [CrossRef]
  10. Lupion, M.; Alvarez, I.; Otero, P.; Kuivalainen, R.; Lantto, J.; Hotta, A.; Hack, H. 30 MWth CIUDEN oxy-CFB boiler—First experience. Energy Procedia 2013, 37, 6179–6188. [Google Scholar] [CrossRef] [Green Version]
  11. Anthony, E.J.; Hack, H. Oxy-fired fluidized bed combustion: Technology prospects and new developments. In Fluidized Bed Technologies for Near-Zero Emission Combustion and Gasification; Scala, F., Ed.; Woodhead Publishing: London, UK, 2013; pp. 867–894. [Google Scholar]
  12. Gao, Y.; Tahmasebi, A.; Dou, J.; Yu, J. Combustion characteristics and air pollutant formation during oxy-fuel co-combustion of microalgae and lignite. Bioresour. Technol. 2016, 207, 276–284. [Google Scholar] [CrossRef] [PubMed]
  13. Tan, T.; Jia, L.; Wu, Y. Some combustion characteristics of biomass and coal cofiring under oxy-fuel conditions in a pilot-scale circulating fluidized combustor. Energy Fuels 2013, 27, 7000–7007. [Google Scholar] [CrossRef]
  14. Lupiáñez, C.; Carmen Mayoral, M.; Guedea, I.; Espatolero, S.; Díez, L.I.; Laguarta, S.; Manuel Andrés, J. Effect of co-firing on emissions and deposition during fluidized bed oxy-combustion. Fuel 2016, 184, 261–268. [Google Scholar] [CrossRef]
  15. Lupiáñez, C.; Carmen Mayoral, M.; Díez, L.I.; Pueyo, E.; Espatolero, S.; Díez, L.I.; Manuel Andrés, J. The role of limestone during fluidized bed oxy-combustion of coal and biomass. Appl. Energy 2016, 184, 670–680. [Google Scholar] [CrossRef] [Green Version]
  16. Lupiáñez, C.; Carmen Mayoral, M.; Díez, L.I.; Pueyo, E.; Espatolero, S.; Manuel Andrés, J. On the oxy-combustion of lignite and corn stover in a lab-scale fluidized bed reactor. Biomass Bioenergy 2017, 96, 152–161. [Google Scholar] [CrossRef] [Green Version]
  17. Pu, G.; Zang, H.; Du, J.; Zhang, X. Study on NO emission in the oxy-fuel combustion of cofiring coal and biomass in a bubbling fluidized bed combustor. BioResources 2017, 12, 1890–1902. [Google Scholar] [CrossRef] [Green Version]
  18. Wang, X.; Ren, Q.; Li, W.; Li, H.; Li, S.; Lu, Q. Nitrogenous gas emissions from coal/biomass co-combustion under a high oxygen concentration in a circulating fluidized bed. Energy Fuels 2017, 31, 3234–3242. [Google Scholar] [CrossRef]
  19. Sher, F.; Pans, M.A.; Sun, C.; Snape, C.; Liu, H. Oxy-fuel combustion study of biomass fuels in a 20 kWth fluidized bed combustor. Fuel 2018, 215, 778–786. [Google Scholar] [CrossRef]
  20. Nguyen, H.K.; Moon, J.-H.; Jo, S.-H.; Park, S.J.; Seo, M.W.; Ra, H.W.; Yoon, S.-J.; Yoon, S.-M.; Song, B.; Lee, U.; et al. Oxy-combustion characteristics as a function of oxygen concentration and biomass co-firing ratio in a 0.1 MWth circulating fluidized bed combustion test-rig. Energy 2020, 196, 117020. [Google Scholar] [CrossRef]
  21. Kosowska-Golachowska, M.; Luckos, A.; Kijo-Kleczkowska, A.; Musiał, T.; Wolski, K.; Środa, K. Gaseous emissions during oxy-fuel combustion of sewage sludge in a circulating fluidized bed. Powder Technol. 2020, 371, 209–216. [Google Scholar] [CrossRef]
  22. Kosowska-Golachowska, M.; Luckos, A.; Musiał, T.; Kijo-Kleczkowska, A.; Wolski, K.; Środa, K. NOx and N2O emissions during oxy-fuel combustion of bituminous coal and lignite in a circulating fluidized bed combustor. In Proceedings of the 13th International Conference on Fluidized Bed Technology, Vancouver, BC, Canada, 10–14 May 2020; Bi, X., Briens, C., Ellis, N., Wormsbecker, M., Eds.; GLAB Reactor and Fluidization Technologies: Vancouver, BC, Canada, 2021; pp. 587–592. [Google Scholar]
  23. Kosowska-Golachowska, M.; Kijo-Kleczkowska, A.; Luckos, A.; Wolski, K.; Musiał, T. Oxy-combustion of biomass in a circulating fluidized bed. Arch. Thermodyn. 2016, 37, 17–30. [Google Scholar] [CrossRef] [Green Version]
  24. Kosowska-Golachowska, M.; Otwinowski, H.; Wolski, K.; Kijo-Kleczkowska, A.; Musiał, T.; Środa, K.; Richter, D. Oxy-fuel combustion of wheat straw pellets in a lab-scale fluidized bed combustor. In Renewable Energy Sources: Engineering, Technology, Innovation; Springer Proceedings in Energy; Mudryk, K., Werle, S., Eds.; Springer: Cham, Switzerland, 2018; pp. 375–386. [Google Scholar]
  25. Kijo-Kleczkowska, A.; Środa, K.; Kosowska-Golachowska, M.; Musiał, T.; Wolski, K. Combustion of pelleted sewage sludge with reference to coal and biomass. Fuel 2016, 170, 141–160. [Google Scholar] [CrossRef]
  26. Shah, I.A.; Gou, X.; Zhang, Q.; Wu, J.; Wang, E.; Liu, Y. Experimental study on NOx emission characteristics of oxy-biomass combustion. J. Clean. Prod. 2018, 199, 400–410. [Google Scholar] [CrossRef]
  27. Chyang, C.S.; Wu, K.T.; Lin, C.S. Emission of nitrogen oxides in a vortexing fluidized bed combustor. Fuel 2007, 86, 234–243. [Google Scholar] [CrossRef]
  28. Liu, X.; Luo, Z.; Yu, C. Conversion of char-N into NOx and N2O during combustion of biomass char. Fuel 2019, 242, 389–398. [Google Scholar] [CrossRef]
  29. Liu, X.; Yang, X.; Xie, G.; Yu, Y. NO emission characteristic during fluidized combustion of biomass with limestone addition. Fuel 2021, 291, 120264. [Google Scholar]
  30. Roknia, E.; Renb, X.; Panahia, A.; Levendis, Y.A. Emissions of SO2, NOx, CO2, and HCl from co-firing of coals with raw and torrefied biomass fuels. Fuel 2018, 211, 363–374. [Google Scholar] [CrossRef]
  31. Lasek, J.A.; Janusz, M.; Zuwała, J.; Głód, K.; Iluk, A. Oxy-fuel combustion of selected solid fuels under atmospheric and elevated pressures. Energy 2013, 62, 105–112. [Google Scholar] [CrossRef]
  32. Czakiert, T.; Sztekler, K.; Karski, S.; Markiewicz, D.; Nowak, W. Oxy-fuel circulating fluidized bed combustion in a small pilot-scale test rig. Fuel Processing Technol. 2010, 91, 1617–1623. [Google Scholar] [CrossRef]
  33. Jankowska, S.; Czakiert, T.; Krawczyk, G.; Borecki, P. model of fuel combustion in oxygen-enriched CFB environment. Fuel Processing Technol. 2010, 91, 290–295. [Google Scholar]
  34. Jia, L.; Tan, Y.; Anthony, E.J. Oxy-emissions of SO2 and NOx during fuel CFB combustion tests in a mini-circulating fluidized bed combustion reactor. Energy Fuel 2010, 24, 910–915. [Google Scholar] [CrossRef]
  35. Ahn, J.; Okerlund, R.; Fry, A.; Eddings, E.G. Sulfur trioxide formation during oxy-coal combustion. Int. J. Greenh. Gas Control 2011, 5, S127–S135. [Google Scholar] [CrossRef]
  36. Krzywanski, J.; Czakiert, T.; Muskala, W.; Sekret, R.; Nowak, W. Modeling of solid fuels combustion in oxygen-enriched atmosphere in circulating fluidized bed boiler: Part 1. The mathematical model of fuel combustion in oxygen-enriched CFB environment. Fuel Processing Technol. 2010, 91, 290–295. [Google Scholar] [CrossRef]
  37. Normann, F.; Andersson, K.; Leckner, B.; Johnsson, F. Emission control of nitrogen oxides in the oxy-fuel process. Prog. Energy Combust. Sci. 2009, 35, 385–397. [Google Scholar] [CrossRef]
  38. Meng, X.; Rokni, E.; Zhou, W.; Qi, H.; Sun, R.; Levendis, Y.A. Emissions from oxy-combustion of raw and torrefied biomass. J. Energy Resour. Technol. 2020, 142, 122307. [Google Scholar] [CrossRef]
  39. Allen, D.; Hayhurst, A.N. The chemical reactions of nitric oxide with solid carbon and catalytically with gaseous carbon monoxide. Fuel 2015, 142, 260–267. [Google Scholar] [CrossRef]
Figure 1. Impact of fuel type on the instantaneous NO (a) and N2O (b) concentrations during air combustion.
Energies 15 00706 g001
Figure 2. Effect of fuel type on the total NO and N2O concentrations during air combustion. Vertical bars represent standard deviation.
Energies 15 00706 g002
Figure 3. The instantaneous concentrations of NO and N2O during air-combustion of wheat straw.
Energies 15 00706 g003
Figure 4. Effect of fuel type on NO (a) and N2O (b) concentrations during air combustion. Vertical bars represent standard deviation.
Energies 15 00706 g004
Figure 5. The instantaneous concentrations of SO2 during air combustion.
Energies 15 00706 g005
Figure 6. Effect of fuel type on the total SO2 emissions during air combustion. Vertical bars represent standard deviation.
Energies 15 00706 g006
Figure 7. Effect of fuel type on the instantaneous CO concentrations during air combustion.
Energies 15 00706 g007
Figure 8. The instantaneous concentrations of NO during oxy-combustion of tested fuels.
Energies 15 00706 g008
Figure 9. The instantaneous concentrations of N2O during oxy-combustion of tested fuels.
Energies 15 00706 g009
Figure 10. Total emissions of NO, N2O and NO2 during combustion in oxy-21 atmosphere. Vertical bars represent standard deviation.
Energies 15 00706 g010
Figure 11. Effect of oxidizing atmosphere on NO emissions during combustion. Vertical bars represent standard deviation.
Energies 15 00706 g011
Figure 12. Effect of oxidizing atmosphere on N2O emissions during combustion. Vertical bars represent standard deviation.
Energies 15 00706 g012
Figure 13. Influence of oxygen concentration on the total emission of NO during oxy-combustion. Vertical bars represent standard deviation.
Energies 15 00706 g013
Figure 14. Effect of the oxygen concentration on the total emissions of N2O during oxy-combustion. Vertical bars represent standard deviation.
Energies 15 00706 g014
Figure 15. The instantaneous concentrations of SO2 during oxy-combustion of the tested fuels.
Energies 15 00706 g015
Figure 16. Influence of the oxygen concentration on total emissions of SO2 during oxy-combustion. Vertical bars represent standard deviation.
Energies 15 00706 g016
Figure 17. Effect of oxygen concentration on the instantaneous CO concentrations during oxy-combustion.
Energies 15 00706 g017
Figure 18. Influence of the oxygen concentration on total emissions of CO during combustion of biomass fuels. Open points represent combustion in air. Vertical bars represent standard deviation.
Energies 15 00706 g018
Figure 19. NO and CO (ppm) profiles during combustion of wheat straw under oxy-combustion.
Energies 15 00706 g019
Table 2. Proximate and ultimate and higher heating value of the tested biomass and coal.
Wheat StrawSalix viminalisScots PineBituminous Coal [21]
Proximate analysis (air-dry basis), wt.%
Moisture (M)8.46.97.08.7
Ash yield (A)6.11.40.618.9
Volatile matter (VM)68.376.376.826.8
Fixed carbon (FC), (by difference)17.215.415.645.6
Higher heating value (HHV), MJ/kg17.8418.2018.9022.75
Ultimate analysis (dry, ash-free basis), wt.%
Carbon (C)50.2049.6050.9073.30
Hydrogen (H)5.806.005.704.30
Sulphur (S)0.080.030.012.30
Nitrogen (N)0.800.300.101.10
Chlorine (Cl)0.150.010.010.70
Oxygen (O), (by difference)42.9744.0643.2818.30
Publisher’s Note: MDPI stays neutral with regard to jurisdictional claims in published maps and institutional affiliations.

