Abstract
Incorporating Internet of Things (IoT) technology into the operation of buildings is expected to generate immense synergy, thereby saving energy and improving occupant comfort by overcoming the limitations of the existing system. Preventing operations in the absence of occupants can save energy, and the occupants’ preferred operating temperature should be used as the control set-point rather than the nominal temperature. In this study, IoT technology and image sensors are used to rapidly detect indoor environment changes, and a method is proposed to utilize air quality and thermal comfort as the control set-points. A real-time ventilation control algorithm is proposed based on the CO2 concentration calculated according to the number of occupants. To check the thermal comfort level, the real-time operating temperature estimated from the surface temperature data of the infrared array sensor is reflected in the comfort zone defined by the American Society of Heating, Refrigerating, and Air-Conditioning Engineers (ASHRAE). The deficiencies in indoor environment conditions caused by the temporal and spatial lag of sensors in the old system are minimized using IoT technology, which also facilitates wireless communications. The image sensors can be used for multiple purposes based on various interpretations of the image information obtained.
1. Introduction
1.1. Background
Heating, ventilation, and air conditioning (HVAC) systems are commonly used in buildings to provide convenience and comfort to occupants. In the era of the climate crisis, there is considerable motivation to reduce the energy demand of buildings to reduce CO2 emissions and thereby the environmental effect. Efforts are ongoing to improving operational efficiency and thereby reduce the energy used in operating buildings. The CO2 emission can be reduced by improving the energy efficiency of the building operations. To improve the energy efficiency, it is very important to minimize the redundant energy demand while providing an appropriate level of energy where needed, rather than forcibly restricting the use of a system. Energy requirements vary depending on the type of building and its purpose. Most buildings are constructed for occupants, and this means that most spaces should be well-controlled to achieve a balance between energy demand and occupant comfort. The provision of the required energy demand does not aim to simply reach set-points such as the nominal temperature and humidity, but to achieve the set-points that reflect integrative factors such as occupant comfort [1,2].
1.1.1. Current Challenges
Many studies are carried out to obtain and apply objective indicators reflecting complex factors, and their number is accelerating with the application of advanced techniques such as machine learning. Nevertheless, in many cases, it is necessary to collect data through the use of measuring devices from manufacturers such as Testo and to utilize costly high-performance workstations to analyze the collected data. In such cases, the performance and results are of high quality, but the methods are too expensive for practical application in real-world environments. These issues suggest the need for an affordable device that can collect and analyze data at a reasonable price. The availability of such a device promises the high likelihood of overcoming the limitations of conventional buildings.
Among these limitations, the first is the building automation system (BAS). BAS has not progressed to reflect the changes in the installation and use of building systems over 30 years, since it was first proposed in the 1990s. The direct digital control system used in BAS connects and monitors building systems such as facilities and monitoring systems by wire. Physical retrofitting, such as improving and replacing a system partly or entirely, is not common, owing to its excessive time and cost. Many buildings that adopted the initial BAS are not fully functioning at present owing to aging; in such cases, partial retrofitting in place of improvement and replacement of the entire system is very difficult. The second limitation is related to the building energy management system (BEMS). BEMS adds the functionalities of monitoring and operator control to the existing BAS; it has similar physical limitations as BAS. The building energy reduction using BEMS is difficult to attain without the active correction efforts of knowledgeable operators who have received professional education. This is the reason that they typically reside in the buildings they manage. However, when buildings are managed by such operators, the general set-points based on their experience and on building codes are used as the operational standards.
1.1.2. Possibility of Improving a Conventional System by Using IoT Technology
Owing to the influence of the fourth industrial revolution, new technologies such as Internet of Things (IoT), cloud computing, and big data have been recently applied to building architecture, and digital technologies, which have been difficult to implement in the past owing to complicated procedures and processes, have been realized. However, in terms of building management, approaches such as data measurement and communication are in their nascent stages with limited applications, and extended application to the entire construction process is very limited in reality.
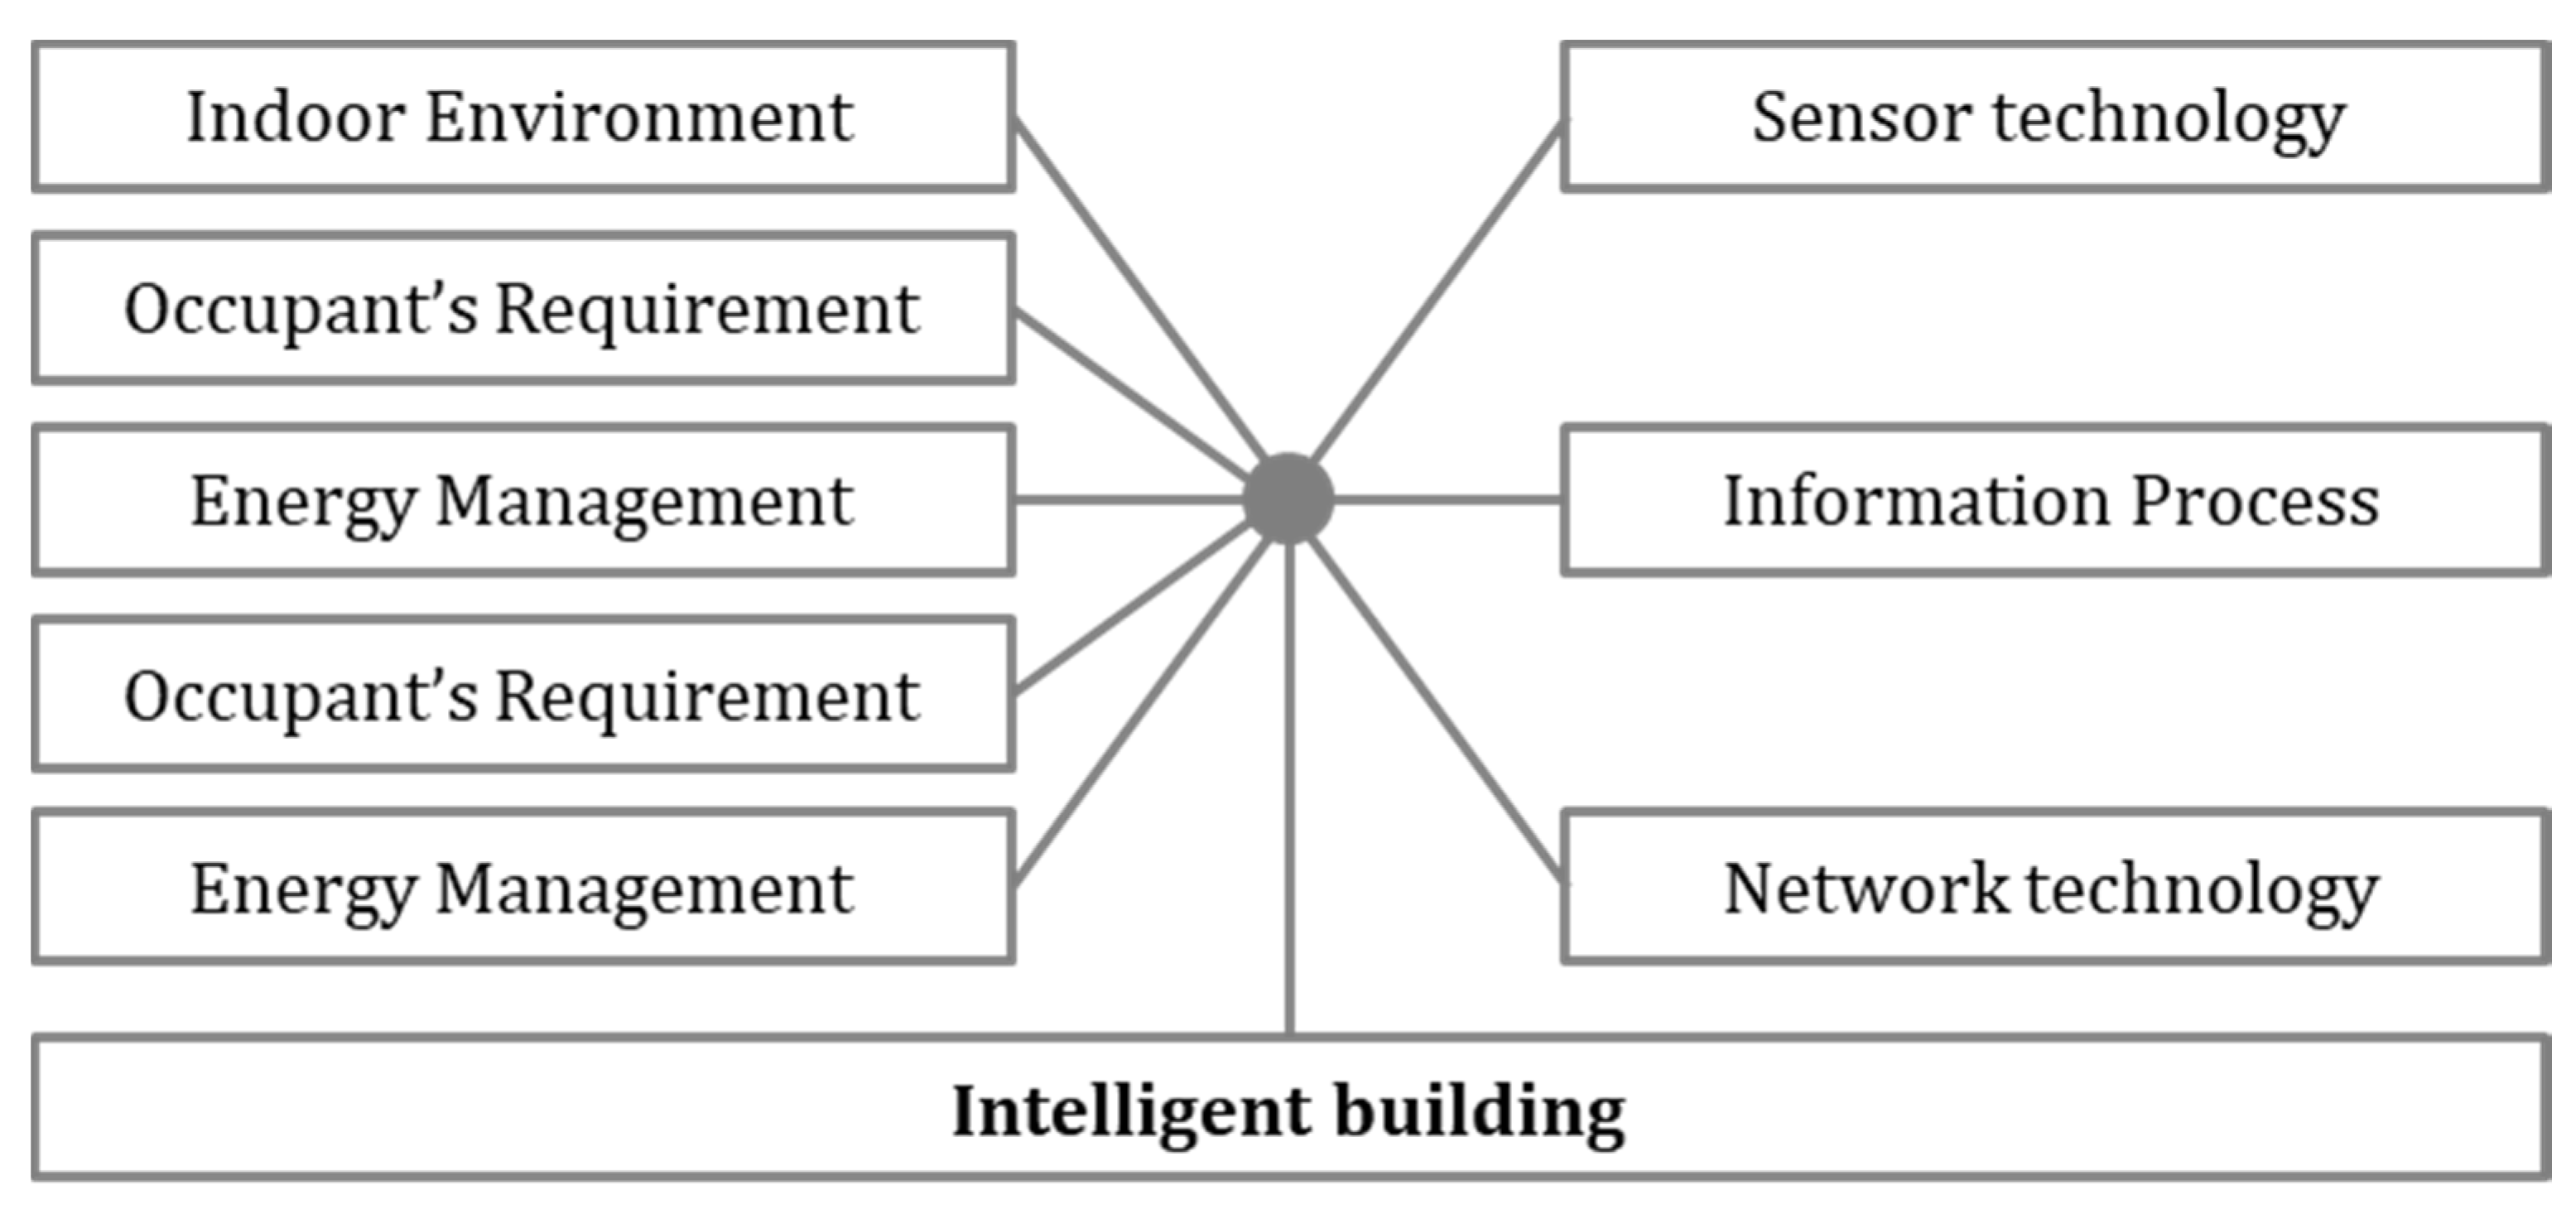
Proper utilization of IoT technology can overcome the temporal and physical limitations of the existing system, as well as ensure optimal and reasonable operation by considering occupant comfort instead of relying on the operator’s experience and building codes. IoT technology mainly comprises three parts—sensing, data processing, and network technology, as shown in Figure 1 [3]. In the field of construction, it can be used for various purposes such as design, construction, operation, maintenance, and safety. Post installation, sensors used in building operations must always detect the operating state until they are replaced owing to failure. As the monitoring result is provided to the operating platform or operator immediately upon detection, it has a very high probability of use; hence, IoT technology is actively used in buildings [4].
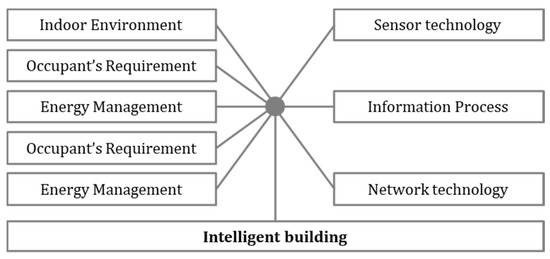
Figure 1.
Integration of IoT technology into an intelligent building.
Sensors used in building operations are classified into monitoring sensors and indoor environment sensors [5] according to their use. Monitoring sensors detect the status of actuators, cold water temperature, chilled water temperature, and control points of mechanical system hardware, such as fan revolution. Indoor environment sensors generate information on the “space to be controlled”, such as the room air temperature, occupant state, humidity, and illuminance level. Depending on the size of the building, the number of sensing points for these sensors ranges from tens to thousands, but most of the sensors are installed for a specific purpose. Owing to the nature of the wired sensor, additional maintenance costs and labor costs due to reasons such as periodic repair continue to occur frequently until the building is no longer in use [6].
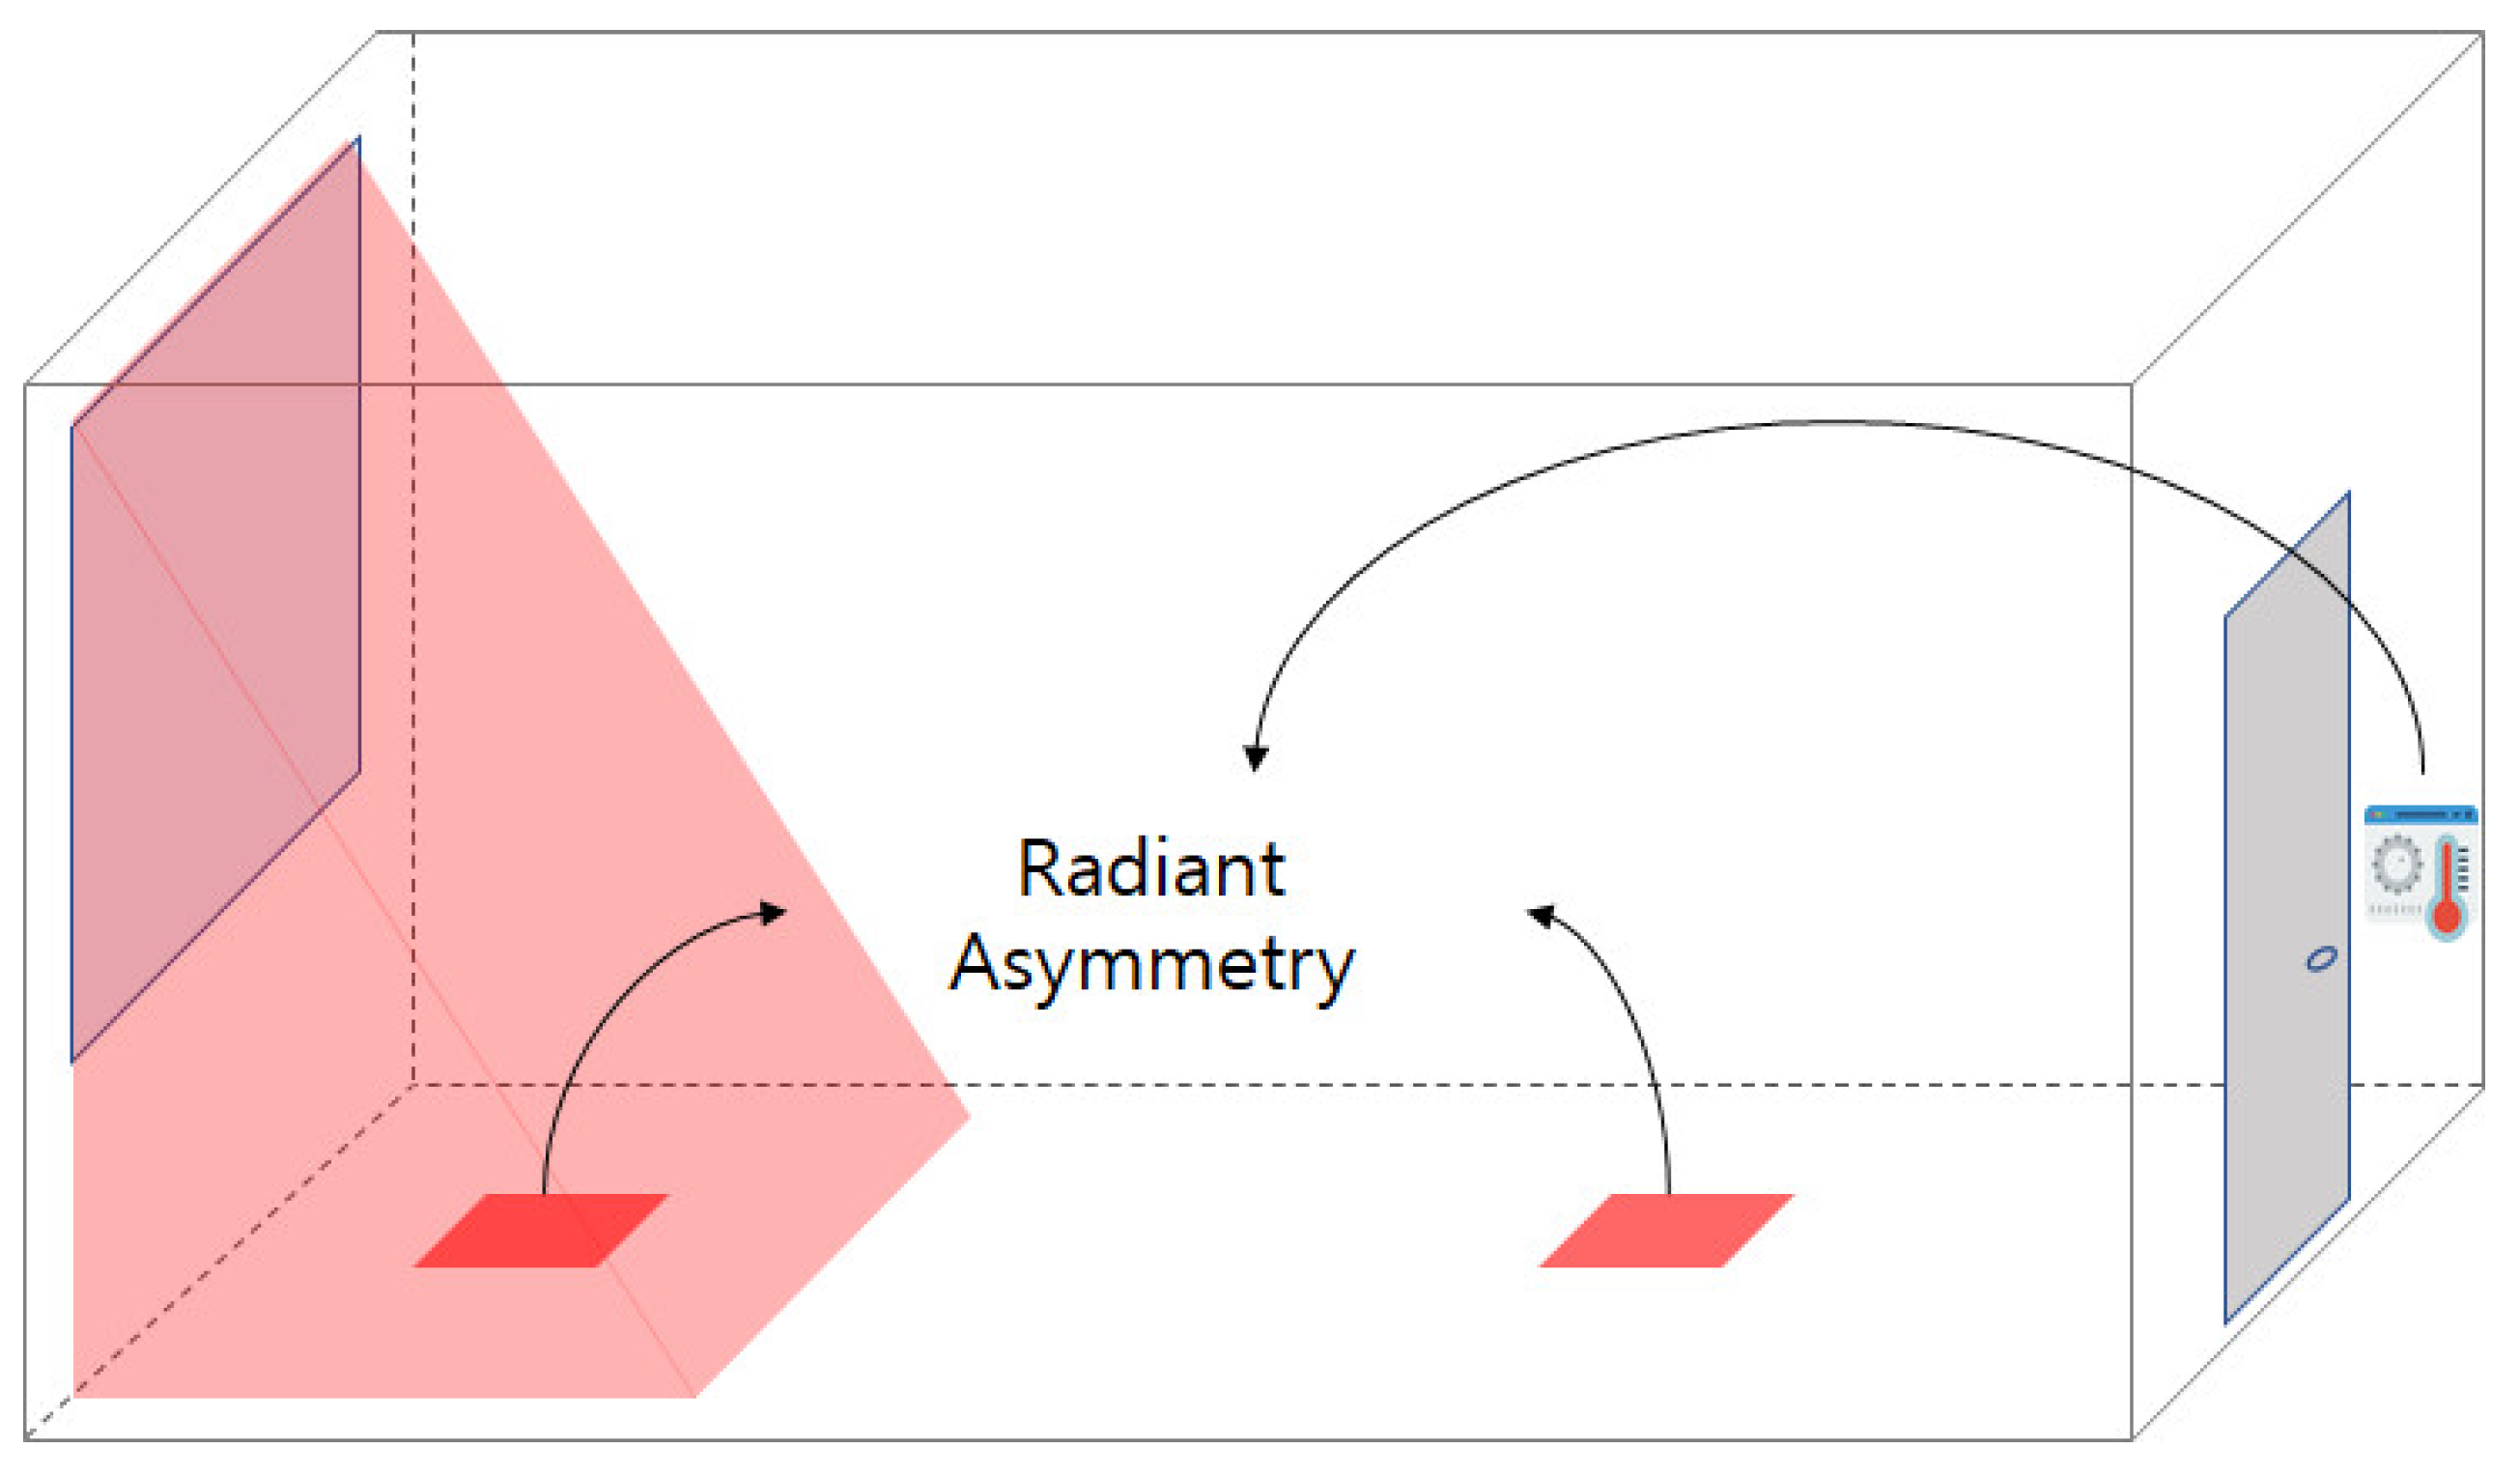
The indoor environment information delivered to the monitoring system is compared with the set-point, and the operation of the building system is controlled based on the set operation system. The set-point of the building system is often decided based on the criteria universally specified in the building code or the operator’s experience. In fact, the set-point for public buildings in South Korea is required to be 28 °C for cooling in summer and 18 °C for heating in winter, according to the building code. This results in redundancy in energy utilization because cooling, heating, and ventilation are operated according to a preset set-point, regardless of the room occupancy status. Such set-points are hardly considered reasonable and often result in occupant discomfort because the occupant’s comfort requirements are not sufficiently guaranteed owing to the simple use of one-dimensional standards such as room air temperature. This means that the “space to be controlled” is not properly controlled. The American Society of Heating, Refrigerating, and Air-Conditioning Engineers (ASHRAE) Standard 55 explains that even in a room separated into individual spaces [7], radiant temperature asymmetry with large solar heat gain can occur in the areas close to windows and doors, which can cause thermal discomfort to the occupants (Figure 2). In addition, the settings for spatial control may vary depending on the range or area detected by the sensor.
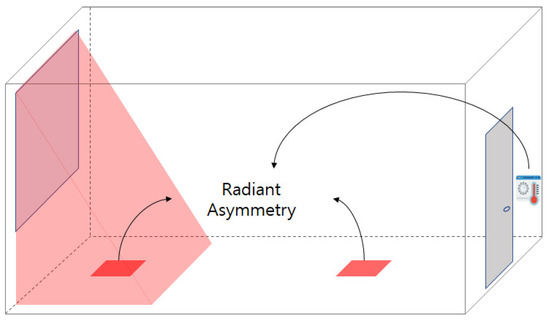
Figure 2.
Radiant asymmetry.
The utilization of IoT devices allows for physical and systematic improvement of the indoor environment. The IoT devices used for physical improvement overcome the specific limitations associated with wireless devices such as Wi-Fi and Bluetooth, demonstrating the effect of multiple sensors with only a single sensor. Systematic improvement will enable reasonable control according to the purpose of the space, such as controlling the occupant’s thermal comfort, indoor air quality, and energy savings by utilizing the data transmitted from the sensor. In particular, changes in the indoor environment can be detected rapidly, allowing for appropriate control to adjust to the frequency of changes. In other words, systematic improvement will allow for more accurate and faster judgment of the situation, which will eventually be the first step in reducing redundant energy while still meeting the occupant comfort requirements.
1.1.3. Need for Control Standards Reflecting Indoor Environment Quality
In South Korea, mechanical facilities (air conditioning equipment and ventilation equipment) in general buildings are designated by building code to operate at an average of 18–20 °C or lower for heating and 26–28 °C or higher for cooling [8]. Operating a building based on temperature as the only operation control standard is not reasonable considering both indoor comfort and energy savings. It is necessary to consider the comfort index, which largely reflects subjective factors, as the control standard to save energy or improve the comfort level, rather than using the data collected from the sensor as the control standard.
Recent studies have analyzed and improved the indoor environmental quality (IEQ) for the purpose of controlling the indoor comfort. Graham proposed a two-fold classification of indoor environment data: (1) data that require the supervision of occupants and (2) objective data obtained through measurement and monitoring. He argued that the IEQ can be analyzed based on both data types. IEQ is divided into four objective elements—thermal comfort, indoor air quality (IAQ), visual comfort, and acoustic comfort—and consists of subjective sub-elements [9]. Because of the characteristics of IEQ, it is very difficult to convert the subjective factors into an objective numerical value; however, many researchers are engaged in ongoing efforts to achieve ventilator control based on the CO2 concentration in order to secure IAQ. To control based on comfort, it is essential to reflect the subjective factors as a control criterion. Traditionally, data have been acquired through surveys and interviews, and recently, advanced IoT technologies have been employed, including wearable devices and analysis platforms, which allow for accurate analysis through quantification of physiological responses such as the heart rate in the space.
Buildings in the past aimed at protecting the occupant from the external environment, but modern buildings are required to play the role of a sanctuary for life, providing safety and comfort to the occupants (Table 1) [10,11]. There are four types of comfort indices, and an appropriate standard for each purpose is required to achieve comfort. The air quality, carbon monoxide concentration, carbon dioxide concentration, ozone, and nitrogen oxide are used as standards for monitoring the concentration of pollutants in the air. Illuminance, luminance, and lighting color are adjusted for visual comfort. Standards reflecting wind speed, humidity, air temperature, surface temperature, clo value, and metabolic rate are required for thermal comfort. For a comfortable acoustic environment, the degree of sound absorption and sound level in decibels can be considered as the standard.

Table 1.
Components of indoor environmental quality.
1.2. Literature Review
Hardware-based research for the improvement of physical comfort mainly involves physical methods and basic system settings, such as connecting IoT devices and necessary sensors, installing devices that use the features of IoT technology, or setting the storage necessary to collect the measured data. Software research for systematic improvement involves processing and using the data after specifying the set-points for building operation control. With the advancement in digital technology, research using IoT devices is being actively conducted in the field of architecture. Previous studies on the application of IoT devices for operation and control, which are likely to be the most common uses of these devices, are described below.
The literature review was conducted to summarize the research on the controllability of buildings through data collected using IoT devices and remote control. Shigaki and Yashiro enabled the control of lighting, heating, and cooling based on the data obtained from sensors attached to a real building by using IoT devices. The indoor environment was evaluated and controlled by the occupants, which improved the occupant comfort, health, convenience, and safety. The use of cloud technology allowed for remote operation and control of the device [12]. Plageras et al. stored the data gathered by the temperature, humidity, motion, and illuminance sensors in the cloud server through IoT devices, and enabled analysis and control in the cloud server for the ultimate goal of realizing a smart city. In addition, remote control was enabled by connecting to the user’s cloud server [13]. In a study by Song and Kim, IoT devices were connected to a direct digital controller, a watt-hour meter, and a temperature and humidity sensor to collect and store data on the IoT cloud server to enable monitoring and control. A control algorithm for saving energy was built based on such a configuration, allowing operators to remotely check the status of the system and make decisions [14]. Through these studies, it was identified that it is possible to use physical connections and that it is feasible to control not only the indoor electric heat pump (EHP), but also large equipment such as the main heat pump of a building.
Subsequently, the effect of interlocking machine learning with a control was investigated through the connection of IoT devices and cloud servers. Li et al. suggested the efficient operation of smart homes by linking IoT systems installed in the smart homes to machine learning. A control scheme for collecting power data based on wireless networks through IoT devices and machine learning for the demand-based prediction of power consumption was proposed [15]. In a study by Ray, an IoT-based system was constructed using the MISSENARD index by considering the effect of thermal comfort on lifestyle, productivity, and health. The system consisted of a control, sensor, network, and cloud, enabling data storage, visualization, and analysis [16]. Zhang et al. proposed a plug-and-play learning method by using IoT technology to automatically determine the thermal state of each space without manual configuration. The temperature data of the smart thermostat were used as the standard to determine the thermal state of the space [17]. Salamone et al. proposed a method that used a device called a smart lamp, which aims to optimize the status of the occupants’ thermal comfort while saving energy. The methodology presented in ASHRAE 55-2013 was used as the standard for thermal comfort, and an algorithm for saving cooling energy was proposed [18]. In a study by Zhang et al., the predictive mean value (PMV), which is a thermal comfort indicator, was inferred by using the data gathered through IoT sensors. A deep neural network was used to infer the PMV thermal comfort model, and the thermal comfort model index was reflected in the cooling standard. The HVAC system of the building was operated in summer, considering energy savings by setting limits on the thermal comfort model index to minimize the energy consumption [19]. In these studies, the air conditioning and heating equipment was controlled utilizing complex standards such as for thermal comfort that were based on the data collected from the IoT device. To deduce the complex factors such as occupant comfort, the incorporation of hardware improved for the application of techniques beyond machine learning is required.
Taking all of the above studies into consideration, an examination of the hardware used in previous studies on IoT technology shows that a connection is established between the sensor and the monitoring system [20]. This was because connecting the existing sensors with the IoT devices allowed the data to be wirelessly transferred to the monitoring system via wireless communications for monitoring and utilization. The application of early IoT technology to building operations and control systems demonstrated limited functionality in terms of multidimensional and massive information processing, such as machine learning and platforms for monitoring and feedback, owing to the technical limitations of IoT devices. Therefore, machine learning, such as deep neural networks, requires a separate high-performance computing device, which is not affordable [2]. The installation and application of additional expensive equipment for applying technology did not seem to be much different from the approach adopted for BEMS, which only added a monitoring function to BAS. The approach is considered a case of applying advanced technology, not affordable technology [1,21]. Therefore, it is necessary to use an IoT device to enable data collection, storage, computation, and algorithm application in the affordable device itself, and the device must also be reliable.
1.3. Study Objectives
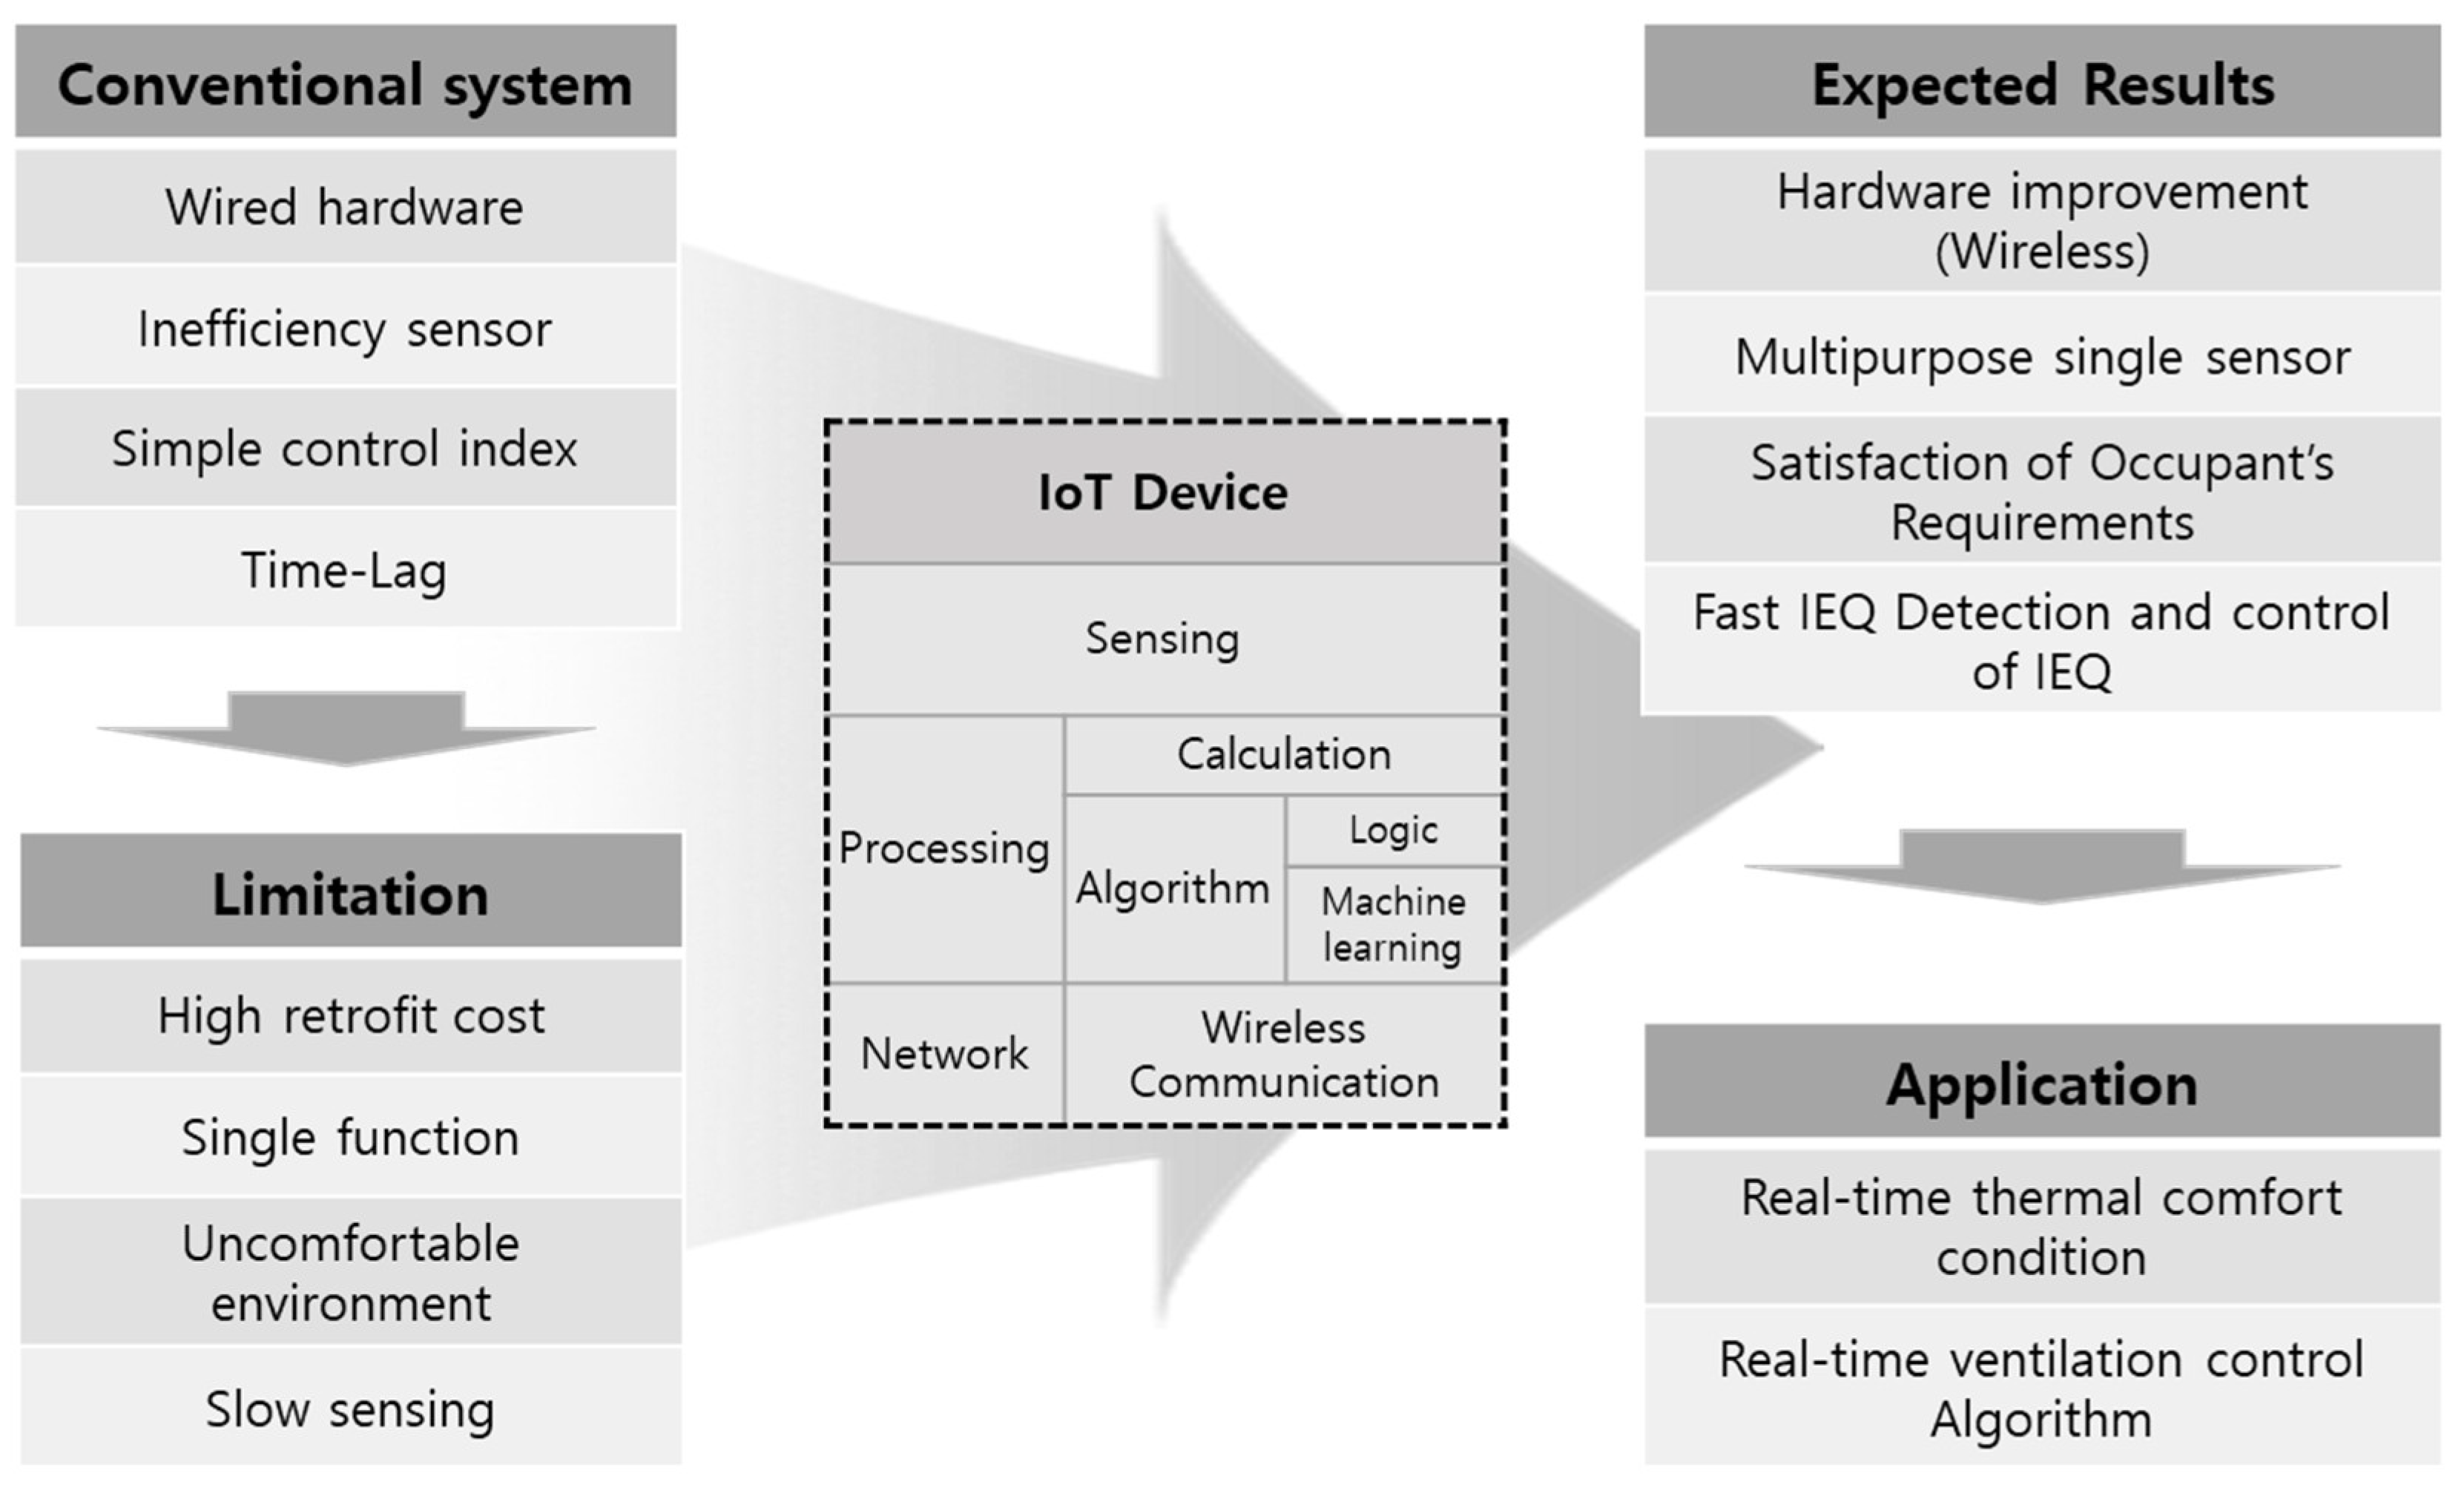
Figure 3 shows how IoT technology is improved in conventional building, to which conventional systems such as BAS and BEMS are applied. Conventional building is inefficient in control due to wired-based control and sensing, simple control methods, and time delay. This eventually leads to problems such as high retrofit costs, uncomfortable environments, and continuous use of inefficient devices. The following effects are expected when IoT technology is used. The first is the application of a wireless-based system, enabling the continuous upgrade of hardware and software of the control system in the building. Improving the hardware of wired systems applied to conventional systems causes material costs and labor costs, and it is difficult to continuously upgrade software. Second, computational and machine learning functions can be mounted, and various results can be derived using a single sensor using them. For example, data such as the number of people and carbon dioxide concentration can be collected from one image sensor. Finally, it is possible to improve the comfort of the occupants and to control and sense for comfort. Information such as comfort is very difficult to estimate using fragmentary information such as temperature and humidity. However, it is expected that IoT technology that can combine various applications such as machine learning and various sensors will be sufficiently possible [22,23].
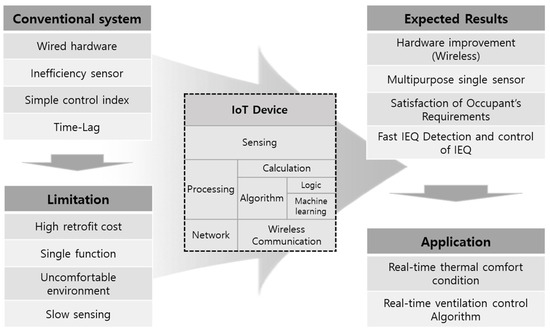
Figure 3.
Research process.
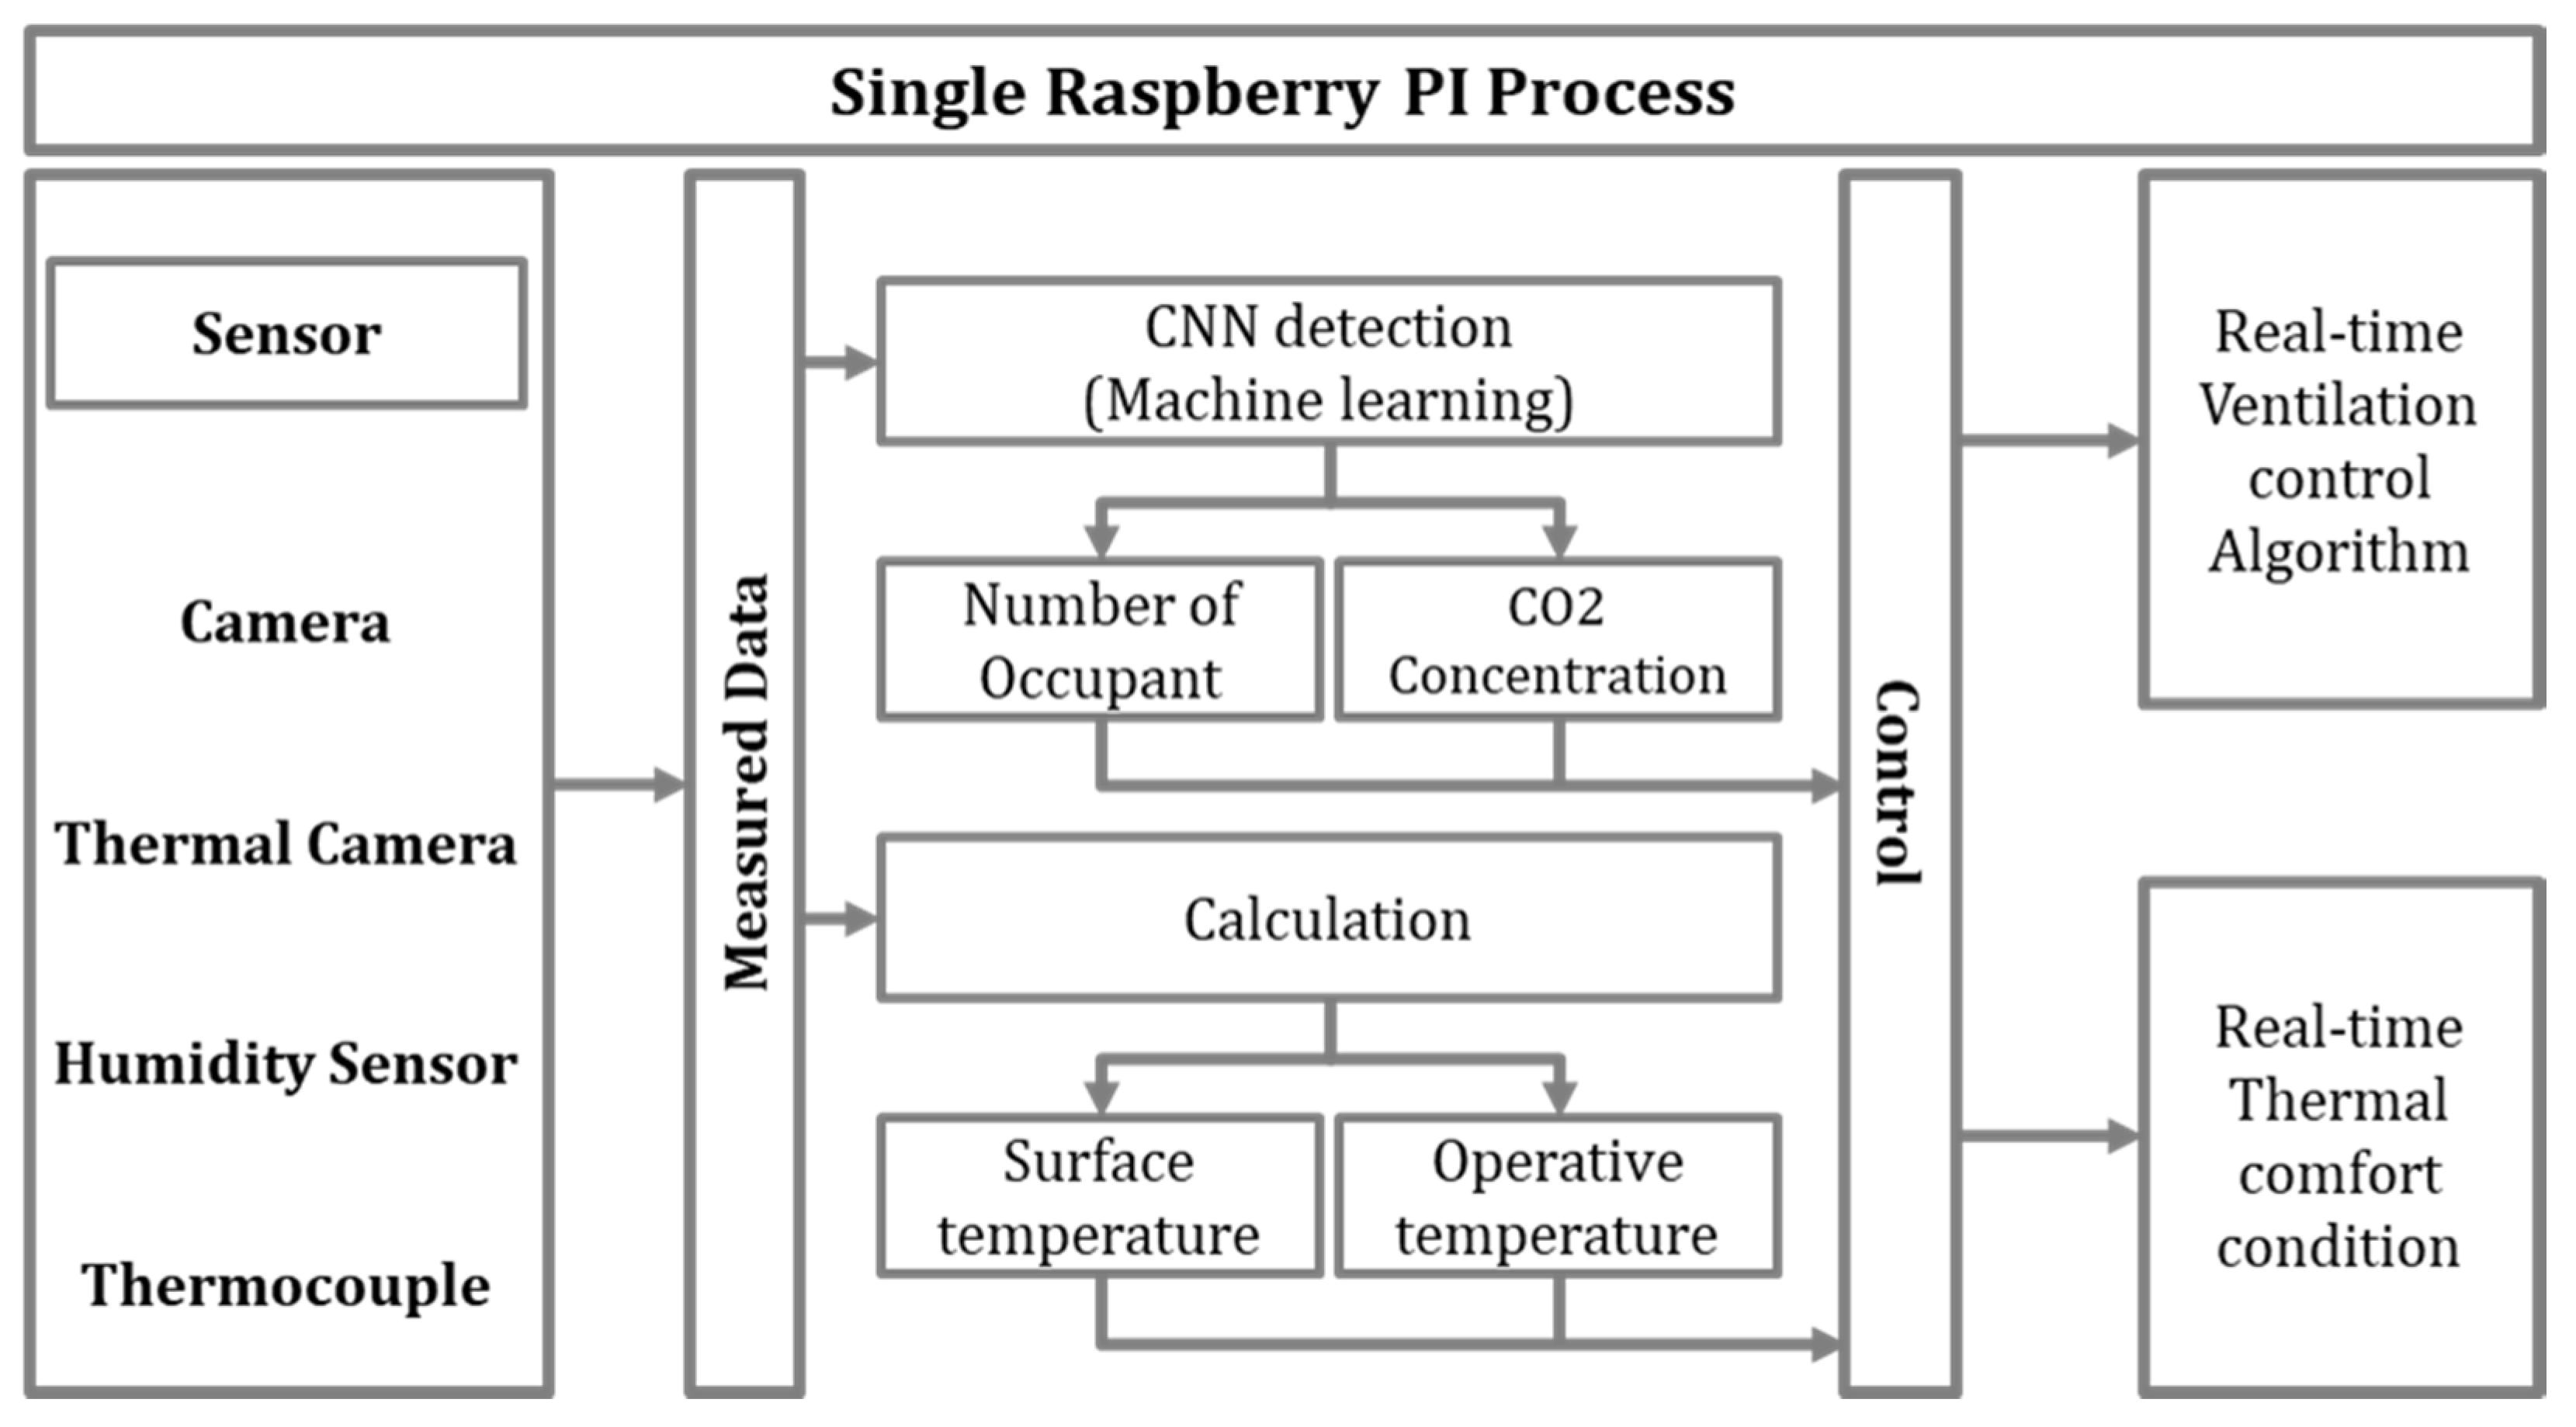
The objective of this study is to allow for real-time control based on the ability to collect accurate and fast occupant status and thermal conditions of the indoor environment from IoT devices to use the required amount of energy appropriately [24]. Accordingly, a convolutional neural network (CNN) [25], one of the machine learning techniques for determining the information contained in images, was used to obtain the occupant status data, and affordable technology (e.g., Infrared (IR) array sensor) was used to collect the thermal condition data [26,27]; the results were then verified. In the information related to the thermal environment [28], operative temperature is a very reliable indicator, but there are difficulties in monitoring and using the globe temperature. Although the IR array sensor is not a commonly used sensor, it has the advantage of being able to easily acquire the operative temperature by utilizing the feature of surface temperature detection. When connected with a Raspberry Pi, it enables the creation, visualization, and delivery of various results based on the surface temperature, thus playing the role of a platform for various purposes while controlling the facility operation with condition logging. This reduces the need for a separate expensive arithmetic unit and leads to cost savings. This study proposes a real-time ventilation control algorithm based on the occupant data and a scheme for checking the real-time thermal comfort status after comparing the thermal data with the ASHRAE Standard 55 Thermal Comfort data. The characteristics of IoT technology are utilized to overcome the limitations of the existing system by using a single sensor for multiple purposes [29,30] and rapidly responding to changes in the indoor environment [31].
2. Materials and Methods
This study aimed to determine whether it was possible to collect and utilize the number of occupants and thermal information, which were the factors for the real-time ventilation control algorithm and real-time thermal comfort condition, based on the experimentally measured indoor environment information.
A considerable amount of research has been conducted on converting the information in the image into data along with the active development of machine learning. Image data were used to obtain the occupant data as accurately as possible with the visual data obtained by humans. As a representative approach for acquiring the images, the Pi camera, which is easily linked with an IoT device, was used, and a CNN, which is a type of machine learning, was used to detect the information contained in the images. Among the numerous open-source CNN algorithms on the web, the YOLOv4 algorithm was found suitable for this study.
A thermostat is generally used as the standard for controlling the heating and cooling equipment. It measures the air temperature at a specific location, resulting in the use of an inaccurate temperature value as the control index due to thermal asymmetry. Therefore, an infrared thermal camera was used to acquire the thermal data in a more reasonable manner. Commercially available thermal cameras are not only very expensive, but also have many limitations related to their use, as they are manufactured and sold as finished products, with a unique algorithm specific to the manufacturer. Therefore, in this study, an IR array sensor was used in place of a thermal imaging camera to collect the thermal data, and a thermal sensor, which could be linked with the IoT device, was separately installed and used after modifying the C++ code to meet the purpose.
The experiment performed in this study was divided into two parts. The first part of the experiment was intended to collect the image data and surface temperature data from the Pi camera and IR array sensor connected to the IoT device. The second part of the experiment was intended to calculate the CO2 concentration based on the number of occupants assessed from the image data and the operative temperature based on the surface temperature data, and to verify the reliability of the obtained results.
The experiment was conducted in three phases, with different requirements in each phase (Figure 4). In the first phase, it was essential to check the normal operation of the IoT device after setting it up and connecting the sensor for the first time. The Raspberry Pi code was modified to collect data according to the set size and time. The collection of image data obtained with the Pi camera, application of the ventilation control algorithm, and ability to reflect the data on the thermal comfort chart of the IR array sensor were verified simultaneously.

Figure 4.
Full process in the IoT device.
In the second phase, the IR array sensor and globe temperature sensor were used to acquire simultaneous measurements. To minimize external influences on the experimental space, the access of the occupants was restricted, thus allowing for only the effect of temperature change by infiltration and solar radiation.
In the third phase, after running the CNN algorithm, an experiment was conducted to obtain the number of occupants after one or more occupants entered or exited the monitored space and to log the number of occupants continuously. Considering the size of the experimental space, up to four occupants were allowed to enter the space. In addition, this experiment attempted to examine whether the number of occupants was accurately counted even when the occupants were seated in an unmoving state or moving about in the experimental space.
The occupant data and thermal condition data obtained during the experiment are inadequate to verify the ventilation control algorithm and thermal comfort status, which were the ultimate goals of this study. Therefore, additional necessary factors such as the ventilation set-point, CO2 emission rate per capita [32], and mean radiant temperature (MRT) calculation were considered based on the results of previous studies.
2.1. Experimental Instrumentation
The IoT device used in this study was a Raspberry Pi [33], a low-cost small computer developed by the Raspberry Pi Foundation, United Kingdom, to promote education in basic computer science in schools and developing countries. Because it is a Linux-based small computer, it has the advantage of allowing the installation and use of Python for calculations and machine learning algorithms; it performs calculations up to the level of the latest data-driven machine learning functions. In addition, it supports wireless communications such as Wi-Fi and Bluetooth, which are characteristics of IoT devices, enabling it to perform sensing and networking and to act as a platform for monitoring and feedback. To proceed with learning and calculating with the extracted data, this study used a program based on the Python language to accommodate additional sensors or equipment in the future.
Table 2 shows sensors that are used in the experiment. The Pi camera [34] used in the study had a resolution of eight megapixels and a shooting angle of 160°, enabling image data collection without blind spots in the experimental space. IR wavelengths of all objects existing within the shooting angle were measured with an IR array sensor [34], and temperature data were collected as 768 pixels with 32 × 24 arrays. The sensor could detect temperatures in the range of −40 °C to 300 °C with an error range of ±1 °C, and could detect targets within a radius of up to 7 m. However, with regard to accuracy, it was adequate to have a distance of 2–3 m from the target. In the method of calculating the temperature from the IR wavelength, the average IR wavelength of the area included in one pixel was converted to the temperature. As the distance between the sensor position and the target increased, the area included in one pixel gradually increased, resulting in lower accuracy. Lastly, the thermo-hygrometer sensor measured the temperature in the range of −40 °C to 80 °C, with an error range of ±0.5 °C. The humidity was measured with an error range of ±2% and 0% to 100% relative humidity.
Table 2.
Sensors.
The globe temperature sensor and CO2 sensor were installed to verify the operating temperature and CO2 concentration measured in the above experiment. The globe temperature sensor was a resistance temperature detector for measuring temperatures between −5 °C and 60 °C, with an error range of ±1.5 °C, which could be used as the MRT. The indoor TR-76Ui data logger manufactured by T&D Corporation was used as the CO2 sensor. This equipment detects CO2 concentrations from 0 to 9999 ppm with an error range of ±50 ppm +5%. The CO2 concentration was measured using this equipment to calculate the infiltration rate for the ventilation algorithm [35], and the calculation results for the CO2 concentration based on the number of occupants were verified [36].
2.2. Experimental Set-Up
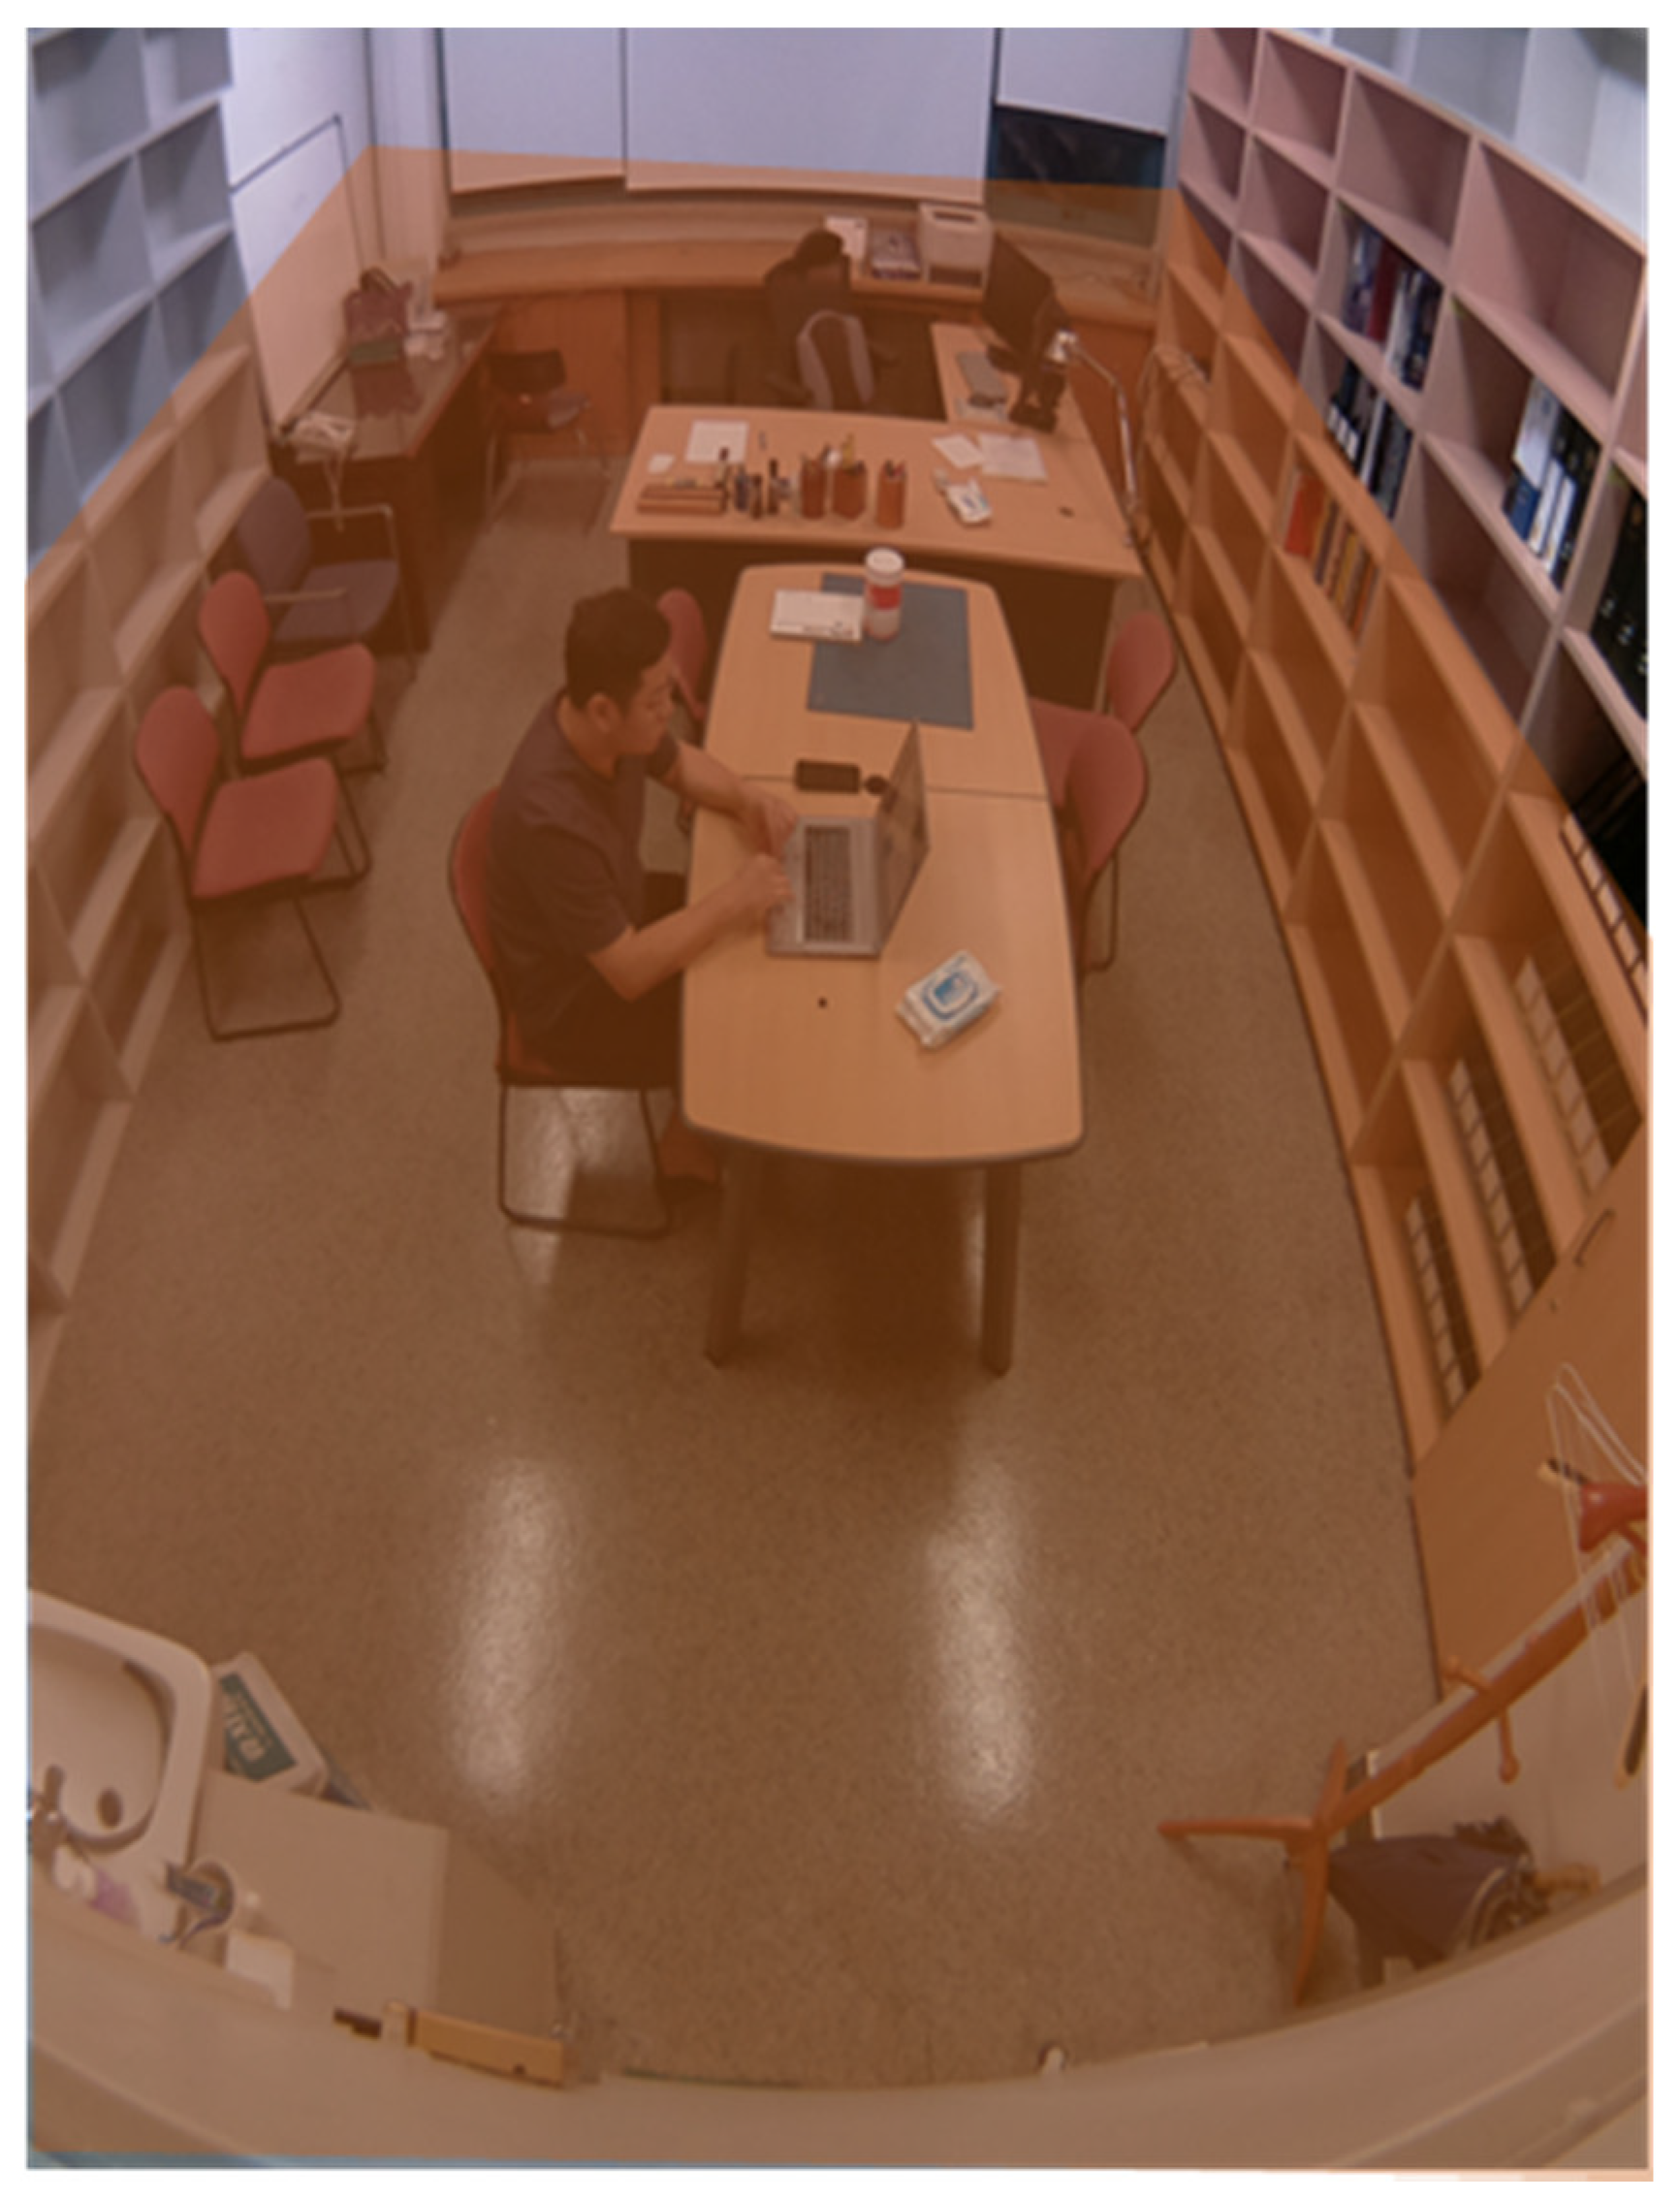
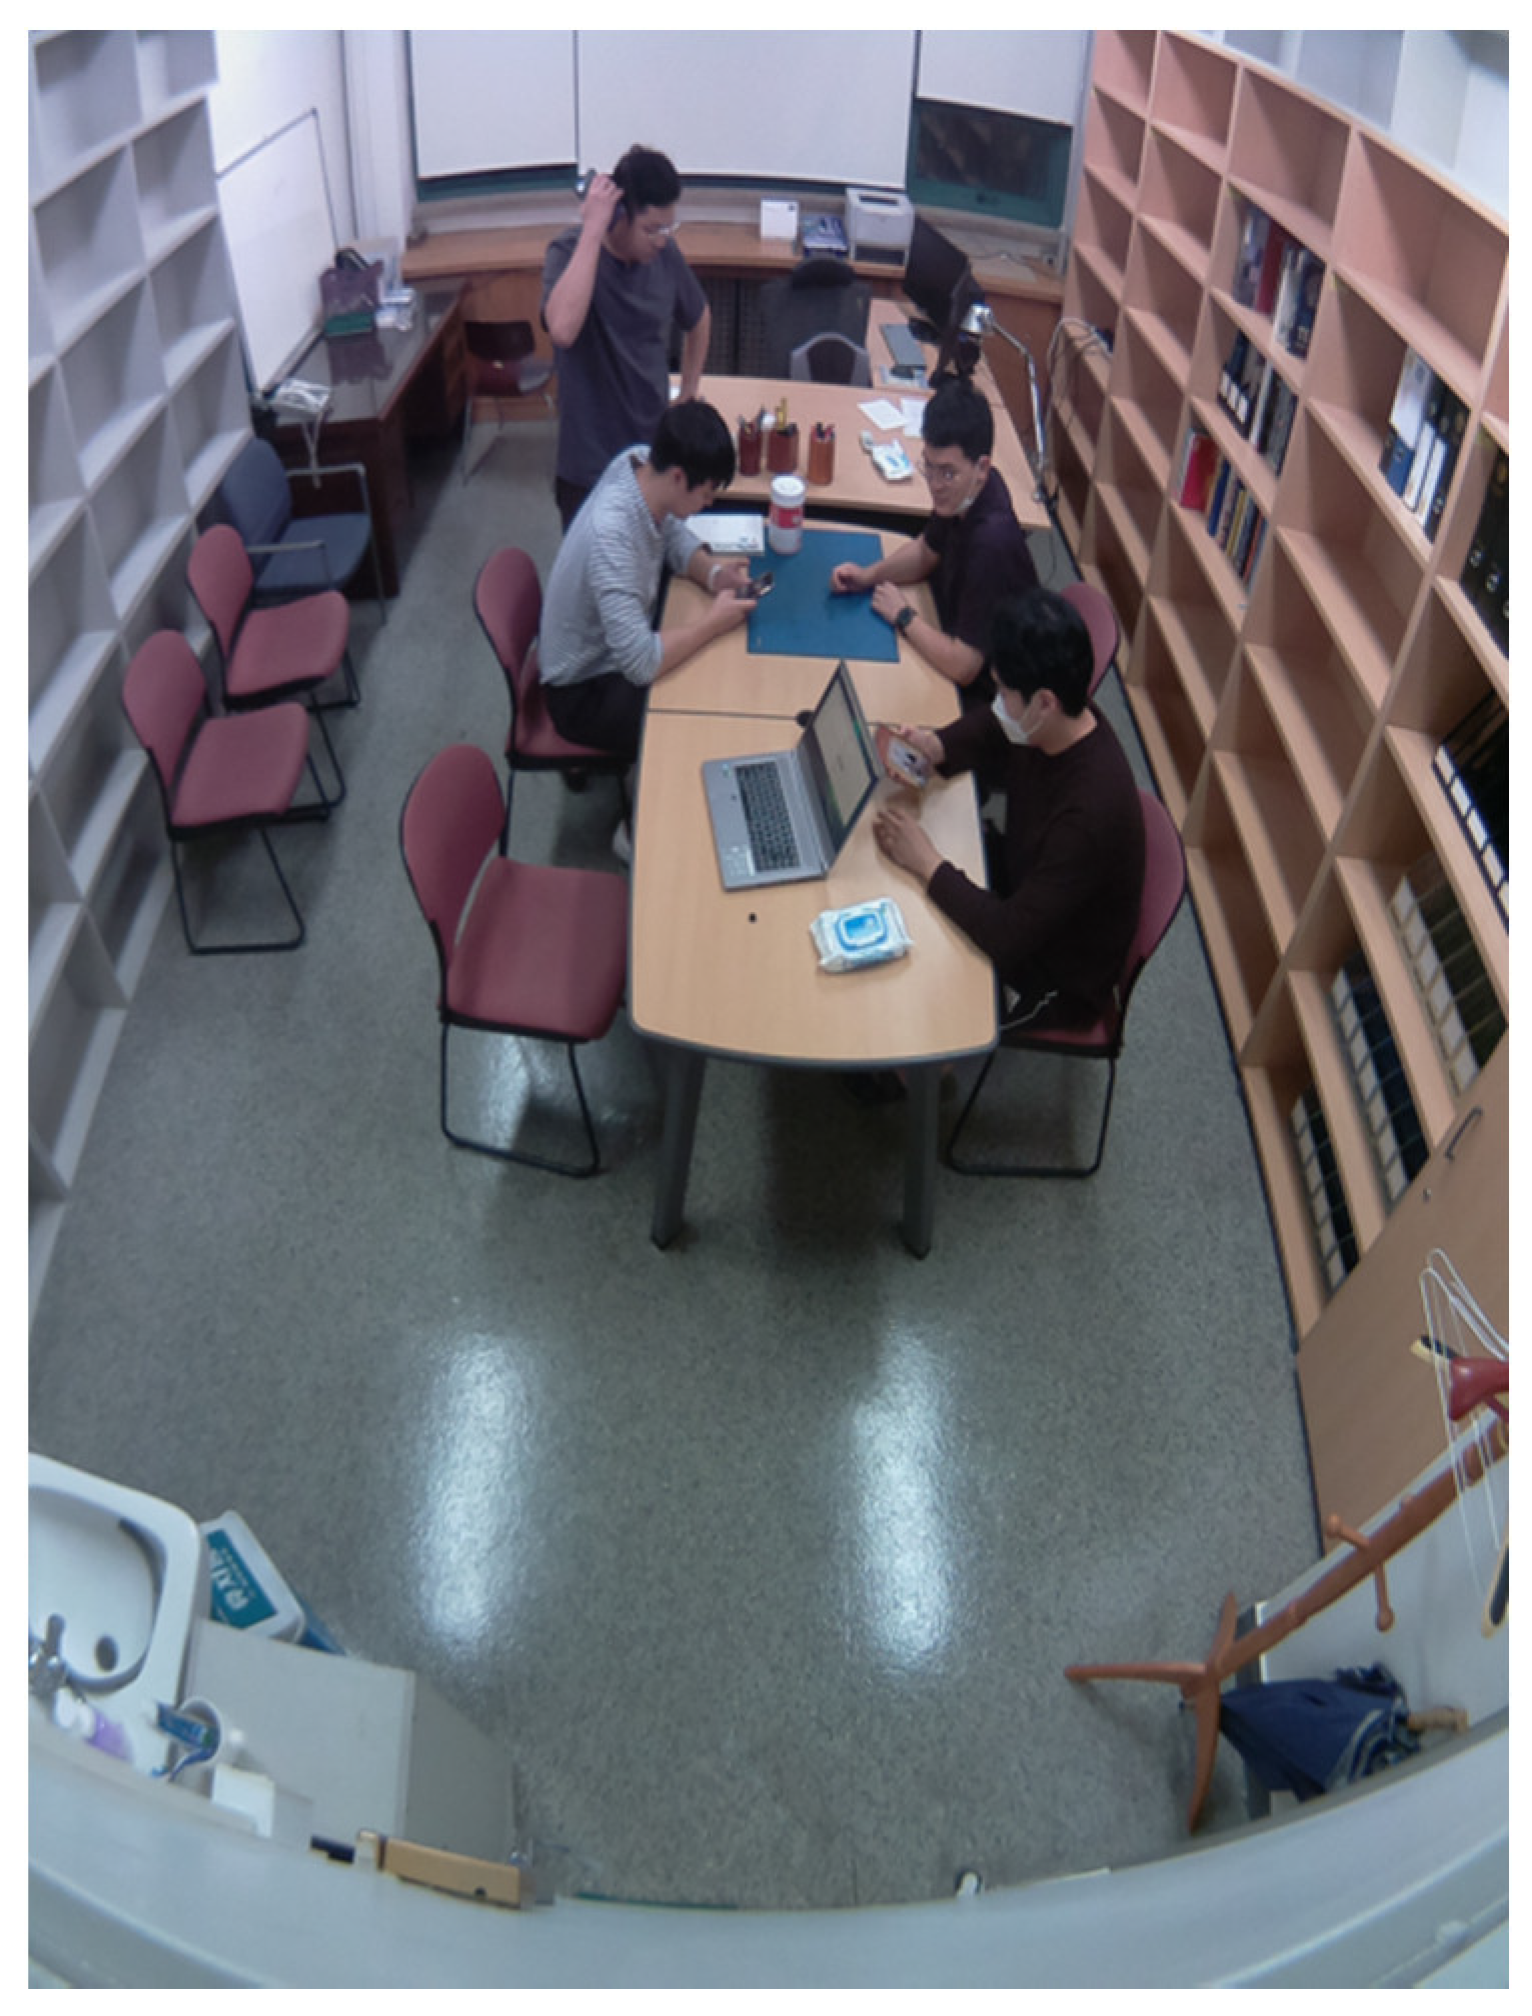
The experiment was conducted in the office space at Yonsei University, located in Seoul. Figure 5 shows the experimental space and set devices, and the experimental outline is shown in Table 3. Figure 5 shows the cross section of the experimental space, where the locations of the IoT device (Figure 6) used for the experiment and the sensors used for verification are indicated. The Raspberry Pi camera and IR array sensor were installed at a point 2.2 m from the floor to be able to focus in the direction of the window from the doorway. The globe temperature sensor and CO2 concentration sensor were installed 1.6 m from the floor at the center of the experimental space [37].
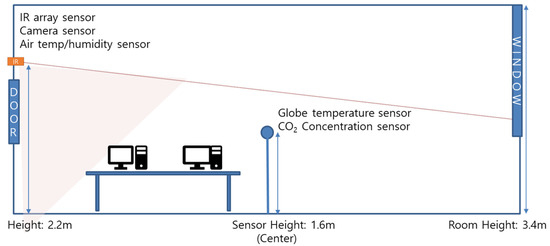
Figure 5.
Experimental set-up.
Table 3.
Experimental outline.
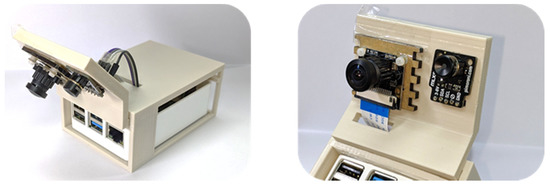
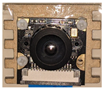
Figure 6.
Raspberry Pi with image sensors.
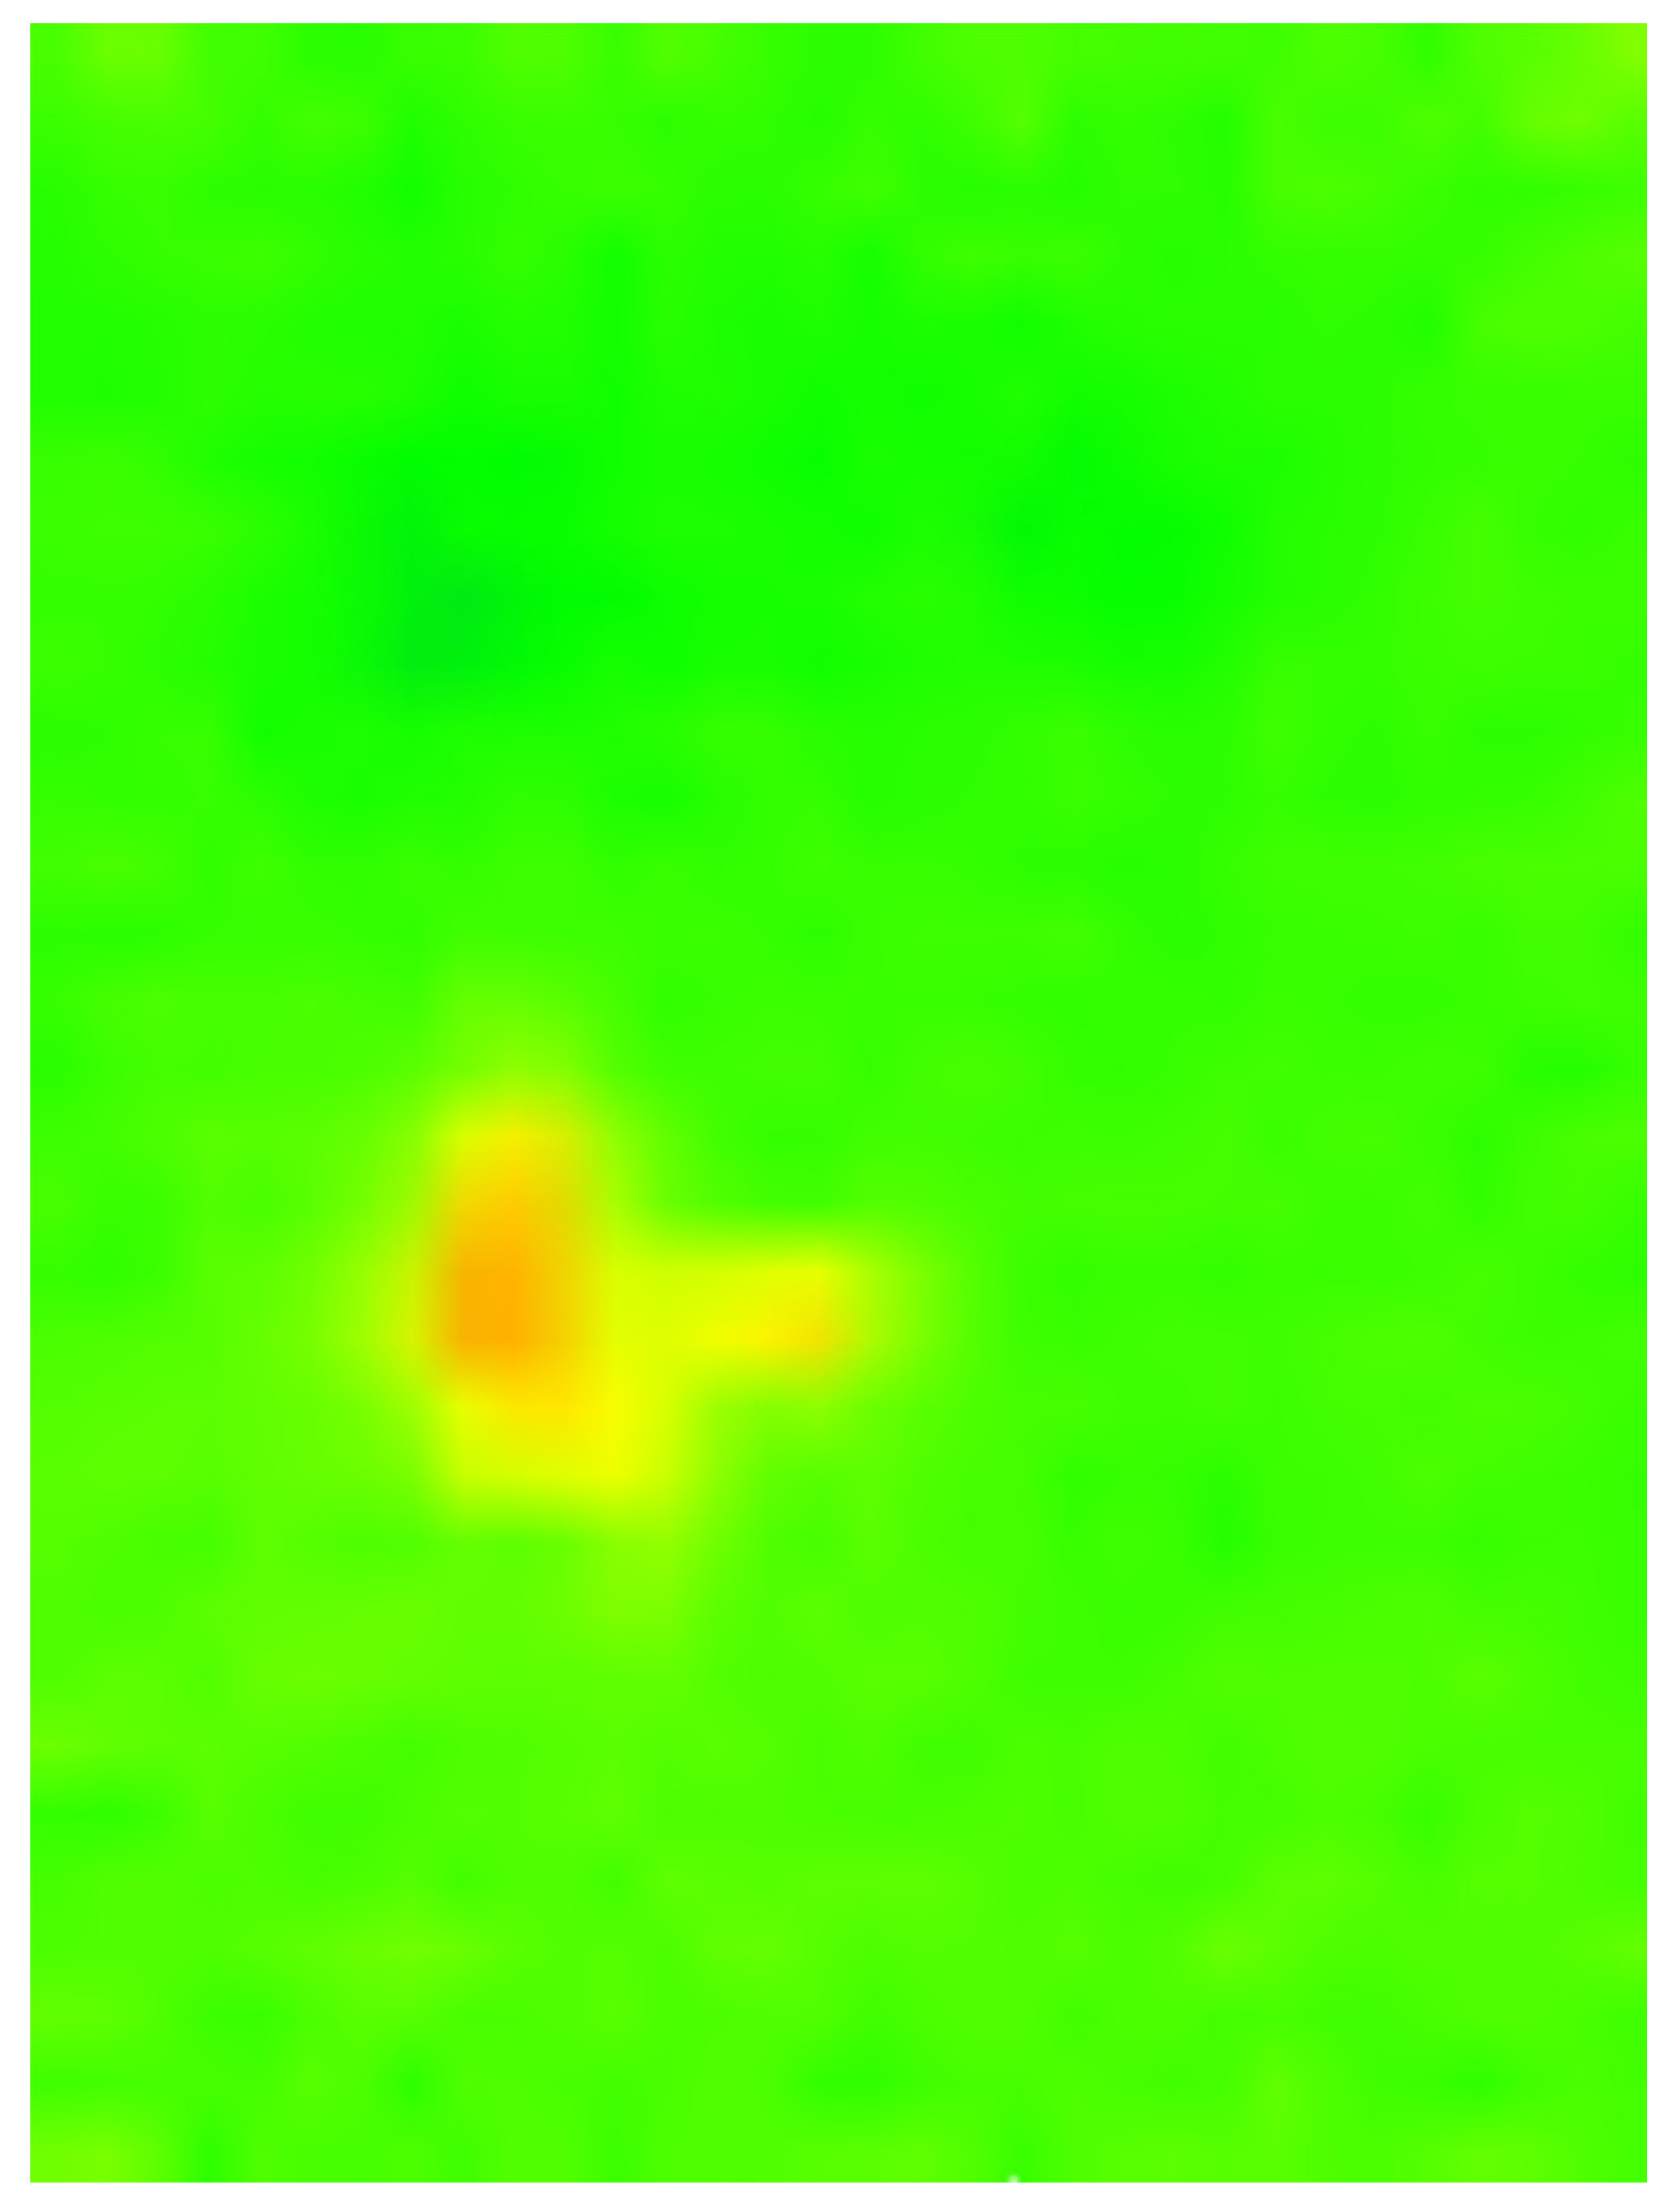
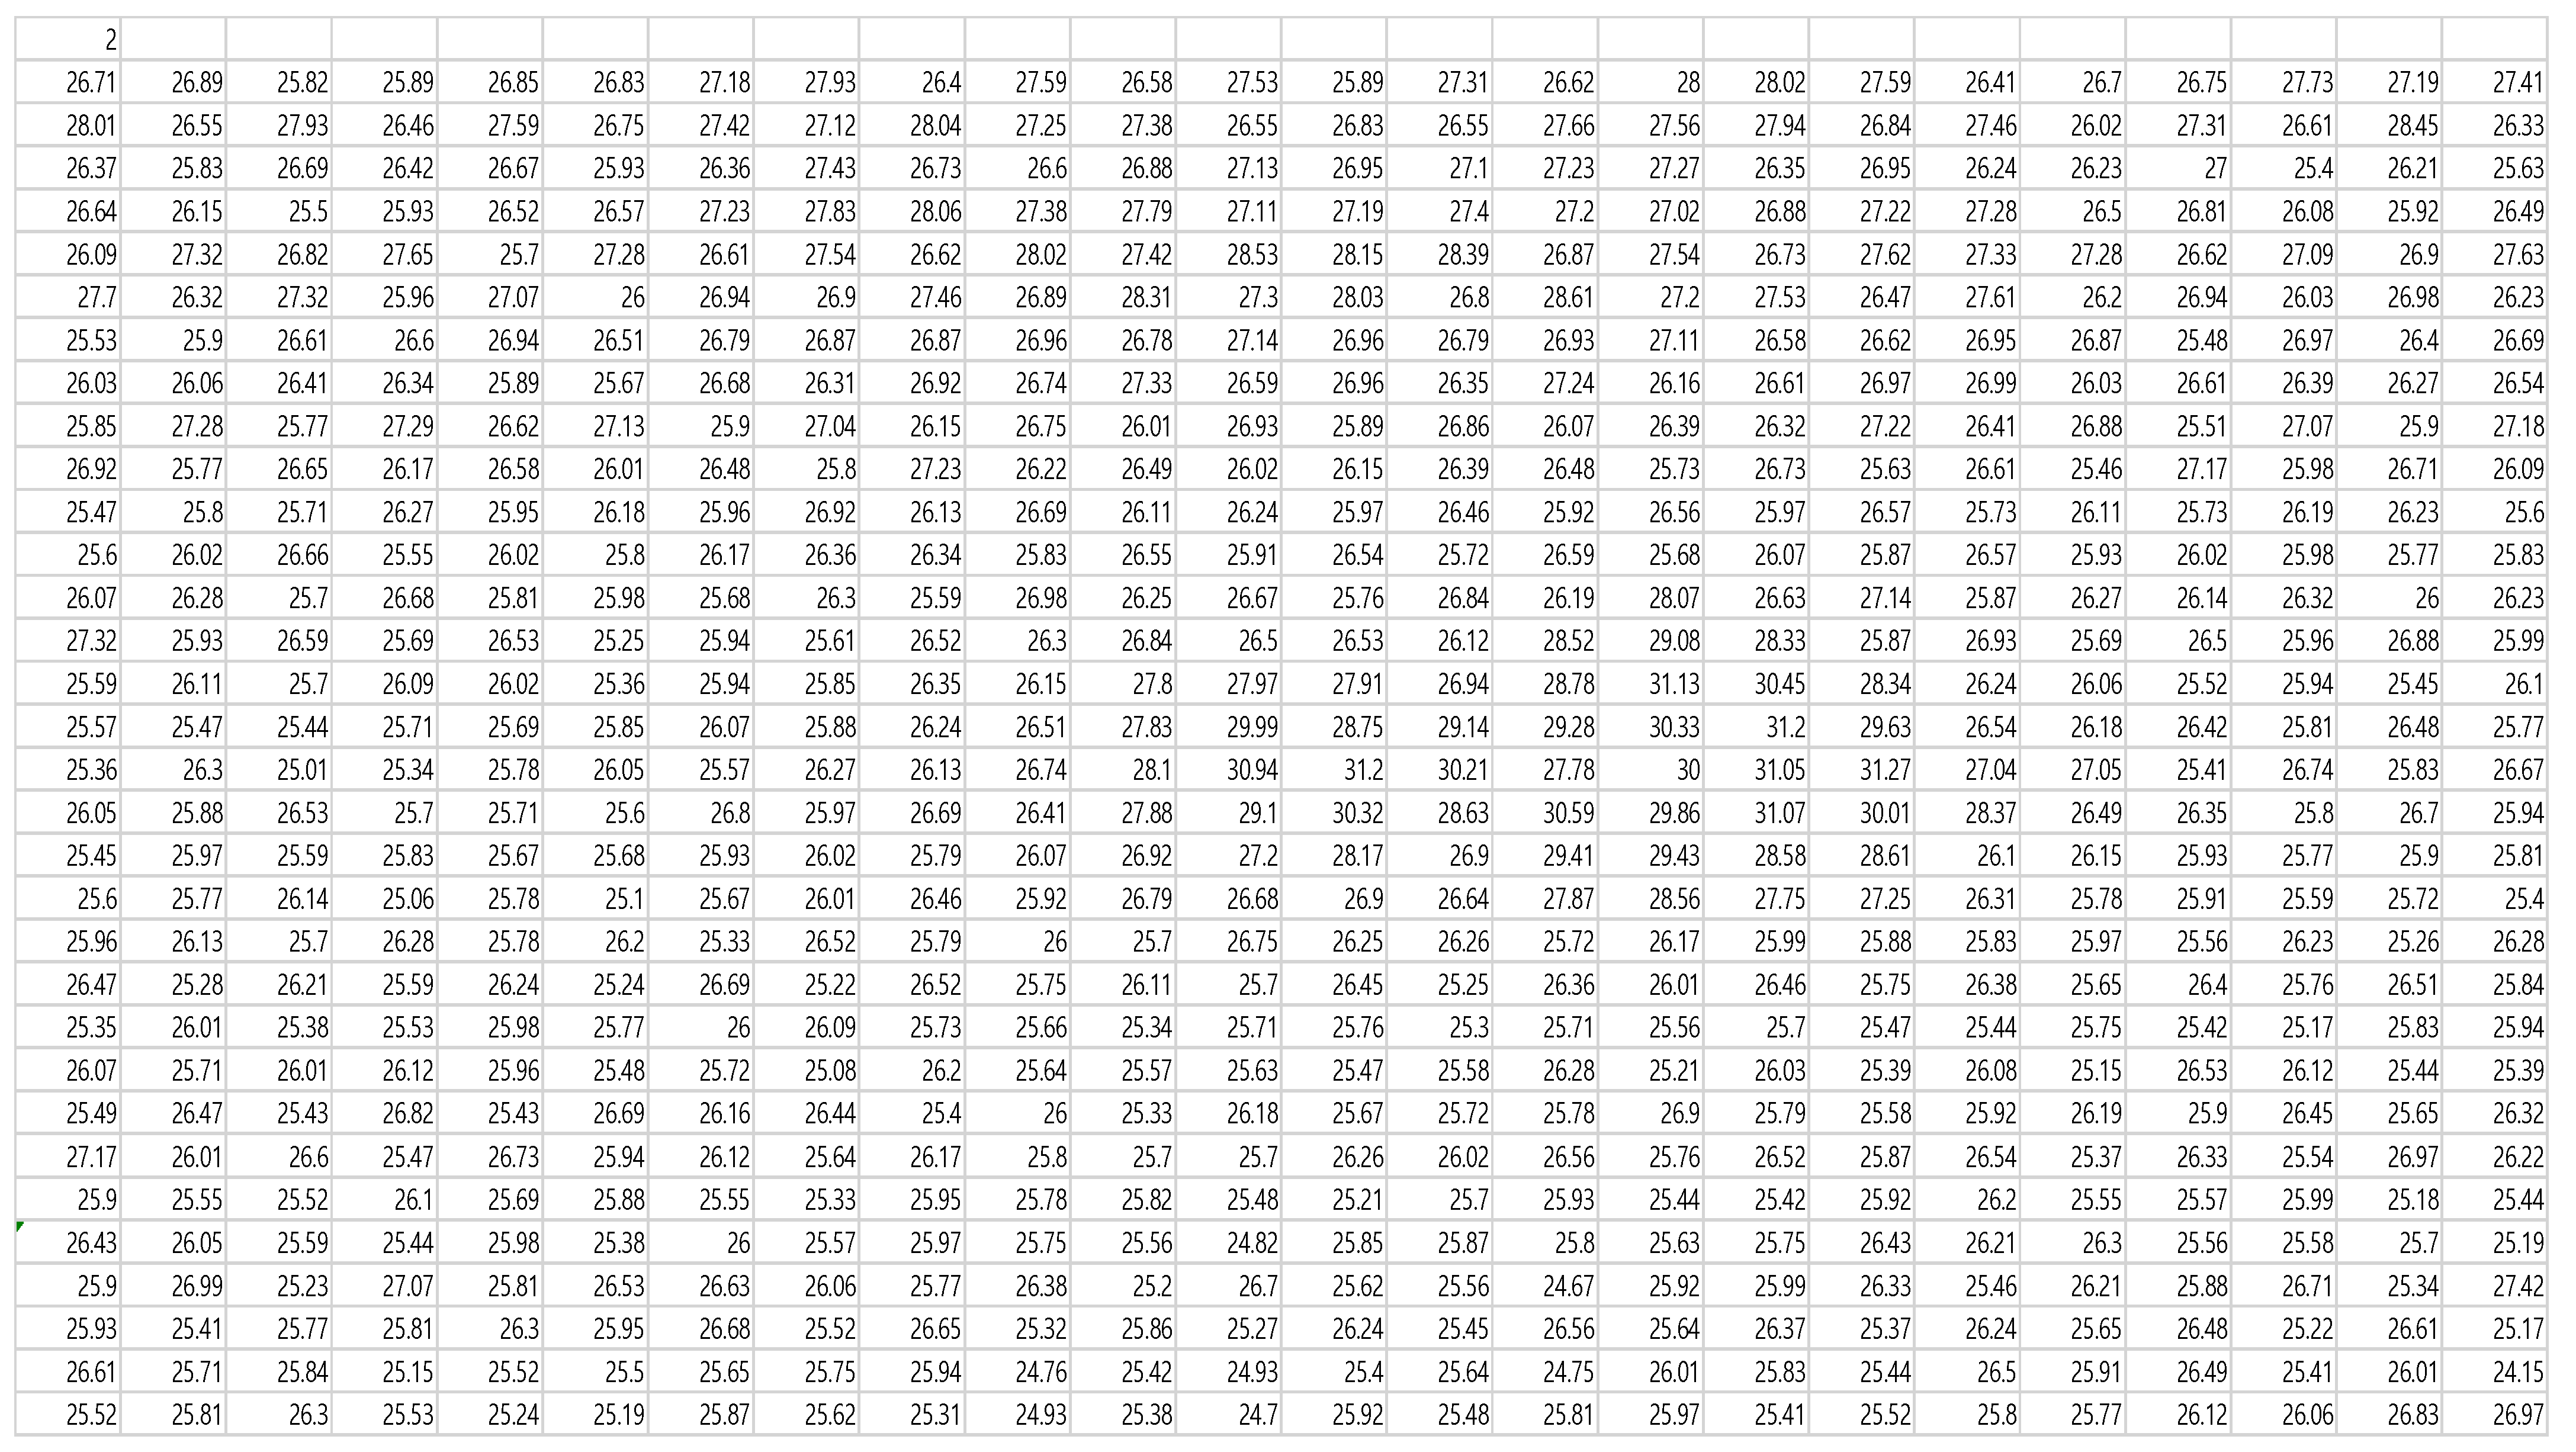
2.3. Thermal Data Collection
The IR array sensor detects IR wavelengths between 5 and 12 μm and converts the readings to surface temperatures. The result indicates the surface temperature of the detected object. Figure 7 shows the range detected by the IR array sensor used in this study. It detects an area of approximately 60% of the entire experimental space, and two types of data, as shown in Figure 8 and Figure 9, can be collected based on the IR wavelengths of all objects within the detection range. Figure 8 shows the IR wavelength expressed as a temperature value and converted into a heat map as a thermal image. Figure 9 shows the same temperature value converted and saved in the form of a matrix in Excel. The temperature data in the matrix form consisted of 768 pixels (32 pixels horizontally and 24 pixels vertically), i.e., 768 temperature data were collected. Thermal image data were not used; rather, only temperature data in the matrix form, as shown in Figure 8, were used.
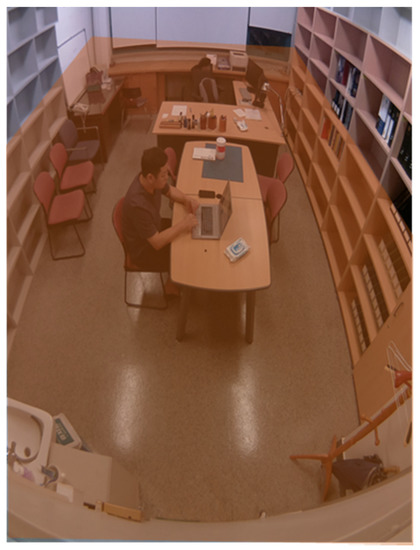
Figure 7.
IR array sensor detecting area.

Figure 8.
Thermal image.
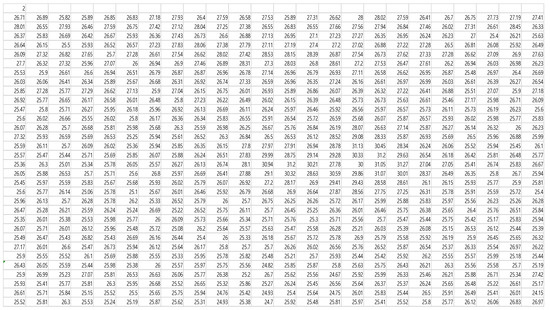
Figure 9.
Surface temperature array data.
2.4. Occupant Data Collection
In this study, the image data of the experimental space were collected using a Pi camera. Most available techniques cannot collect the occupant data as accurately as human visual inspection. In many previous studies, the occupant data were obtained using a passive IR sensor or calculated based on the rate of increase in CO2 concentration. Although satisfactory results may have been reported for the experimental arrangement specially installed for the study, there were many cases of inaccurate occupant detection using sensors in daily life, such as failure to detect an occupant with no movement, for example, a sleeping occupant.
Therefore, this study aimed to collect the occupant data using image information to make judgments as accurate as human visual information [38,39]. The CNN detection model YOLOv4 was selected from among the previously published open-source CNN-based machine learning models for image analysis, as it is suited to the camera characteristics and has the highest accuracy.
Figure 10 shows the image before the detection of the number of occupants from the image, and Figure 11 shows the image after the detection. The YOLOv4 algorithm was installed on the Raspberry Pi device to detect the number of occupants in a space. The targeted accuracy of determining an object as a human by the algorithm was 96% to 99%. However, because the accuracy of the algorithm may differ from the actual result, a separate verification process was required. A visual examination of 120 different result data revealed only one error in one image, where a chair was detected as a person, indicating that the scheme was highly accurate and suitable for practical use.

Figure 10.
Original image data.
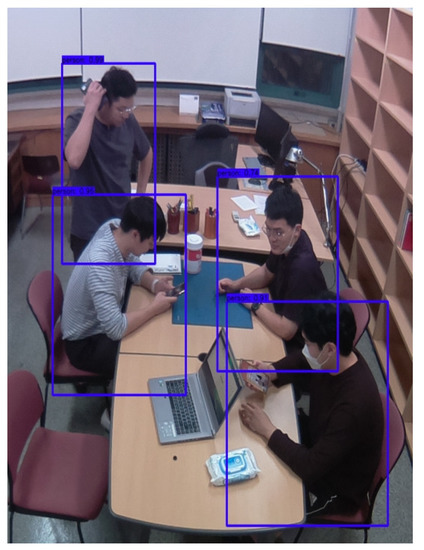
Figure 11.
Result of the CNN algorithm.
3. Results and Discussion
Chapter 3 uses the collected data to determine where the operative temperature is located within the comfort range. In addition, the carbon dioxide concentration was calculated using the detected number of occupants, and accuracy was performed through comparison with the actual data. Finally, the utilization of IoT equipment was maximized through the proposal of a ventilation control algorithm using the calculated carbon dioxide concentration.
3.1. Use of Thermal Environment Information
3.1.1. Operative Temperature
Although temperature, which is an indicator of the thermal status of the space, is used as a general HVAC set-point, it is difficult to consider it as an indicator of the thermal comfort of an occupant. To ensure the thermal comfort of the occupant, an appropriate set-point is required, for which the operating temperature is an index used in the ASHRAE comfort chart. The operative temperature is suitable for use as an index for the occupant’s thermal comfort, as the thermal comfort status of the space can be determined based on this temperature.
The operative temperature can be calculated simply as the median value of the mean radiant temperature (MRT) and air temperature (Table 4) [6], but it is not easy to obtain the MRT. To determine the MRT of the space, the temperature emitted from the surface can be measured by installing a globe temperature sensor at the center of the space. It is easier to obtain the MRT by using a globe temperature sensor than by calculation; however, owing to the nature of the globe temperature sensor, there are practical difficulties in installing and using it in an indoor space [40,41].
Table 4.
Operative temperature equation.
To overcome this limitation, this study aimed to obtain a value that can replace the MRT by using an IR array sensor. For instance, a globe temperature sensor should be installed at the center of the space and 1 m in height from the floor. However, if it is installed in this way in general buildings such as hospitals and commercial buildings, which will allow for accurate measurement of the temperature, it will also create physical interference with occupants, causing uncomfortable situations. This method does not take into account the practical applicability, and it was to improve applicability that this study was carried out.
The data collected with the IR array sensor were represented as matrix data containing 768 temperature values, which were the surface temperatures of objects occupying approximately 60% of the experimental space. This study aimed to compare the operating temperature obtained as the mean of 768 temperatures (mean surface temperature (MST)) and that obtained using the globe temperature (MRT).
3.1.2. Comparison of Surface-Temperature-Based Operative Temperature and Globe-Temperature-Based Operative Temperature
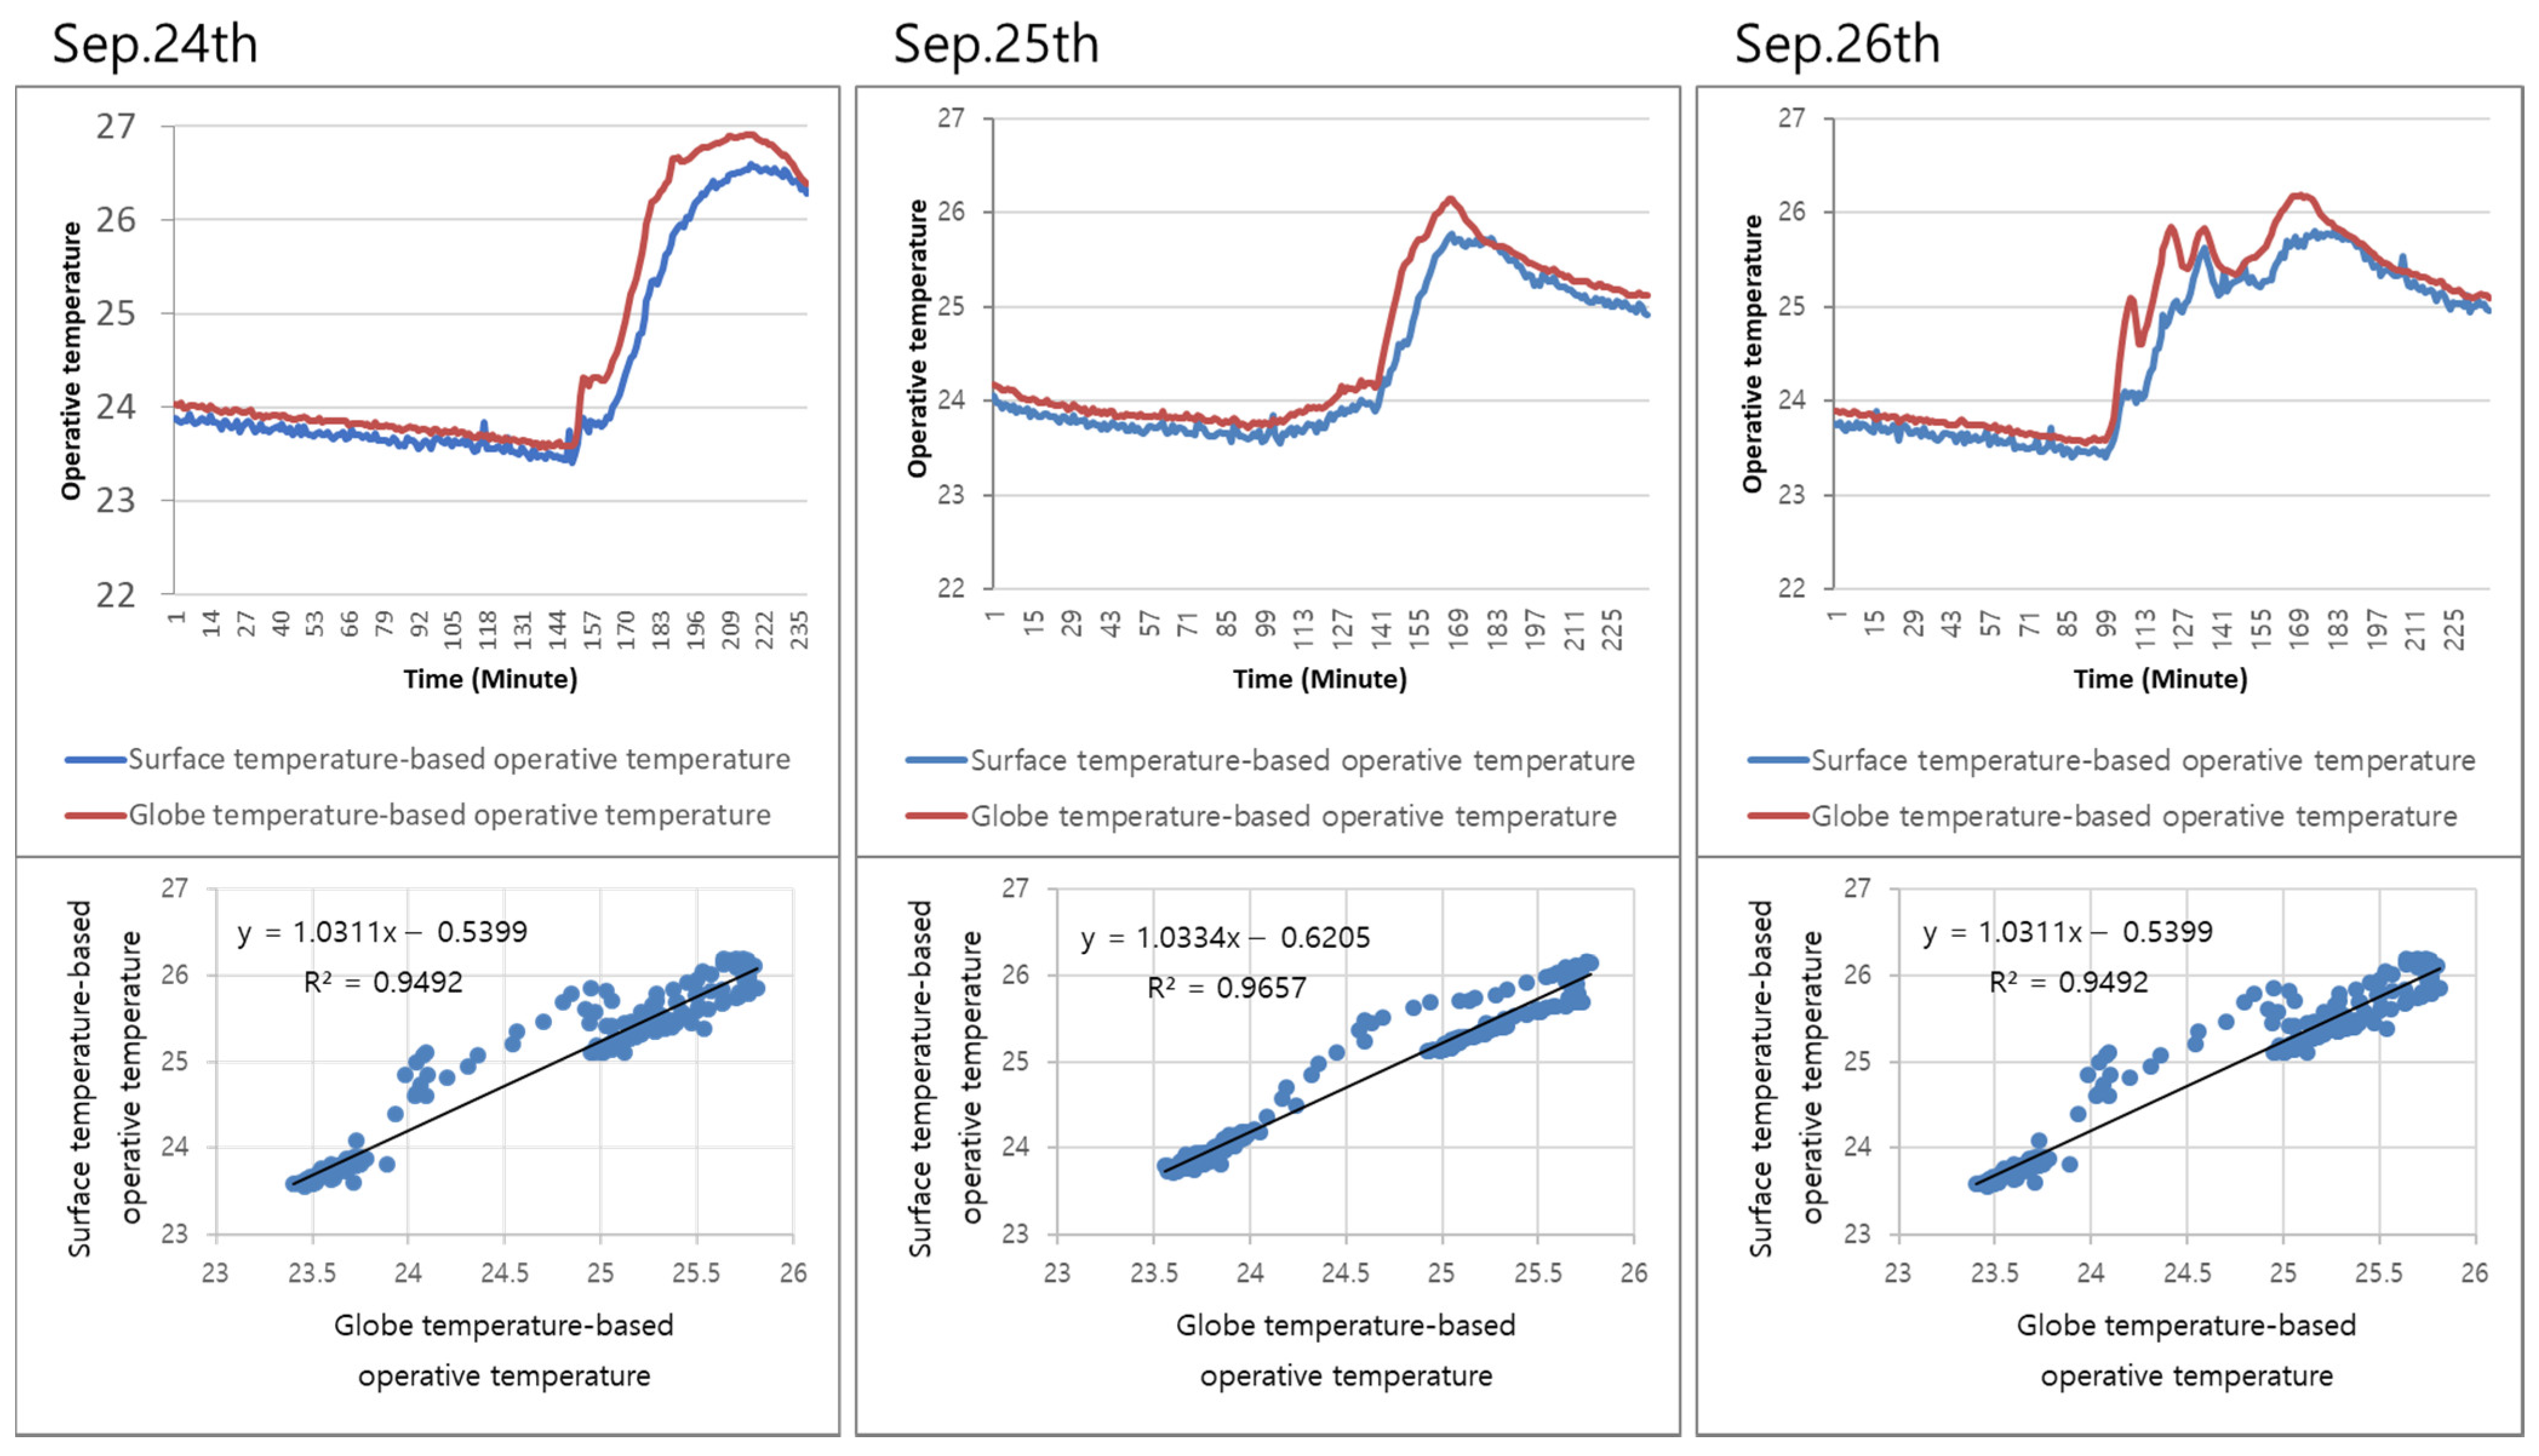
The IoT device connected to the globe temperature sensor and IR array sensor was installed as shown in Figure 5. The experiment was conducted from 02:00 a.m. to 14:00 p.m. for three days from 24 September to 26 September 2020, and a total of 4320 data were collected. The experiment was conducted in the absence of occupants in the experimental space. Figure 12 shows the experimental results. From the start of the experiment at 02:00 a.m. until sunrise, the operative temperatures remained almost the same. After dawn, the globe-temperature-based operative temperature was measured to be at least 0.3 to 1 °C higher, and the difference between the two temperatures decreased from noon onward. The MST was always lower than the MRT, and the data were not constant, with many changes over a short period. A similar phenomenon was observed throughout the three days of the experiment, which was explained as follows.
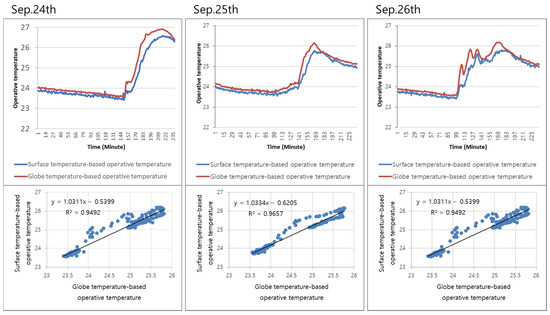
Figure 12.
Regression analysis for mean radiant temperature (MRT) and mean surface temperature (MST).
First, the results were affected by the orientation of the windows. In the space, the windows were facing east, which allowed the radiant heat from the sun to affect the indoor space after sunrise, thereby causing changes in the temperature. Although the sunrays penetrating the window were blocked as much as possible by window blinds to minimize the solar heat, the radiant heat could not be blocked entirely owing to the insufficient heat blocking performance of the window blinds. Second, the MST temperature data showed numerous changes, which seemed to have been due to the characteristics of the IR array sensor. The surface temperature collected by the IR array sensor was used to express the IR wavelength as a temperature using a formula. At this time, it was set to calculate the monitored IR wavelength 16 times per second; therefore, all 768 units of temperature data showed different temperature values according to the changing wavelength. Because the change occurred in a very small range with no significant effect on the result, it was not classified as an error in the separate data preprocessing step.
Regression analysis was performed to compare the MST-based operating temperature and MRT-based operating temperature by date, and the results are shown in the graph at the bottom of Figure 12. The R-squared value, i.e., the coefficient of determination, obtained from the results of the experiment conducted over three days was in the range of 0.94–0.96. An R-squared value higher than 0.8 and closer to 1 indicates a significant relationship, and the two sets of data demonstrated a very significant relationship based on the values mentioned above, suggesting that the MST-based operating temperature could replace the MRT-based operative temperature.
3.1.3. Utilization of Indoor Thermal Comfort Data
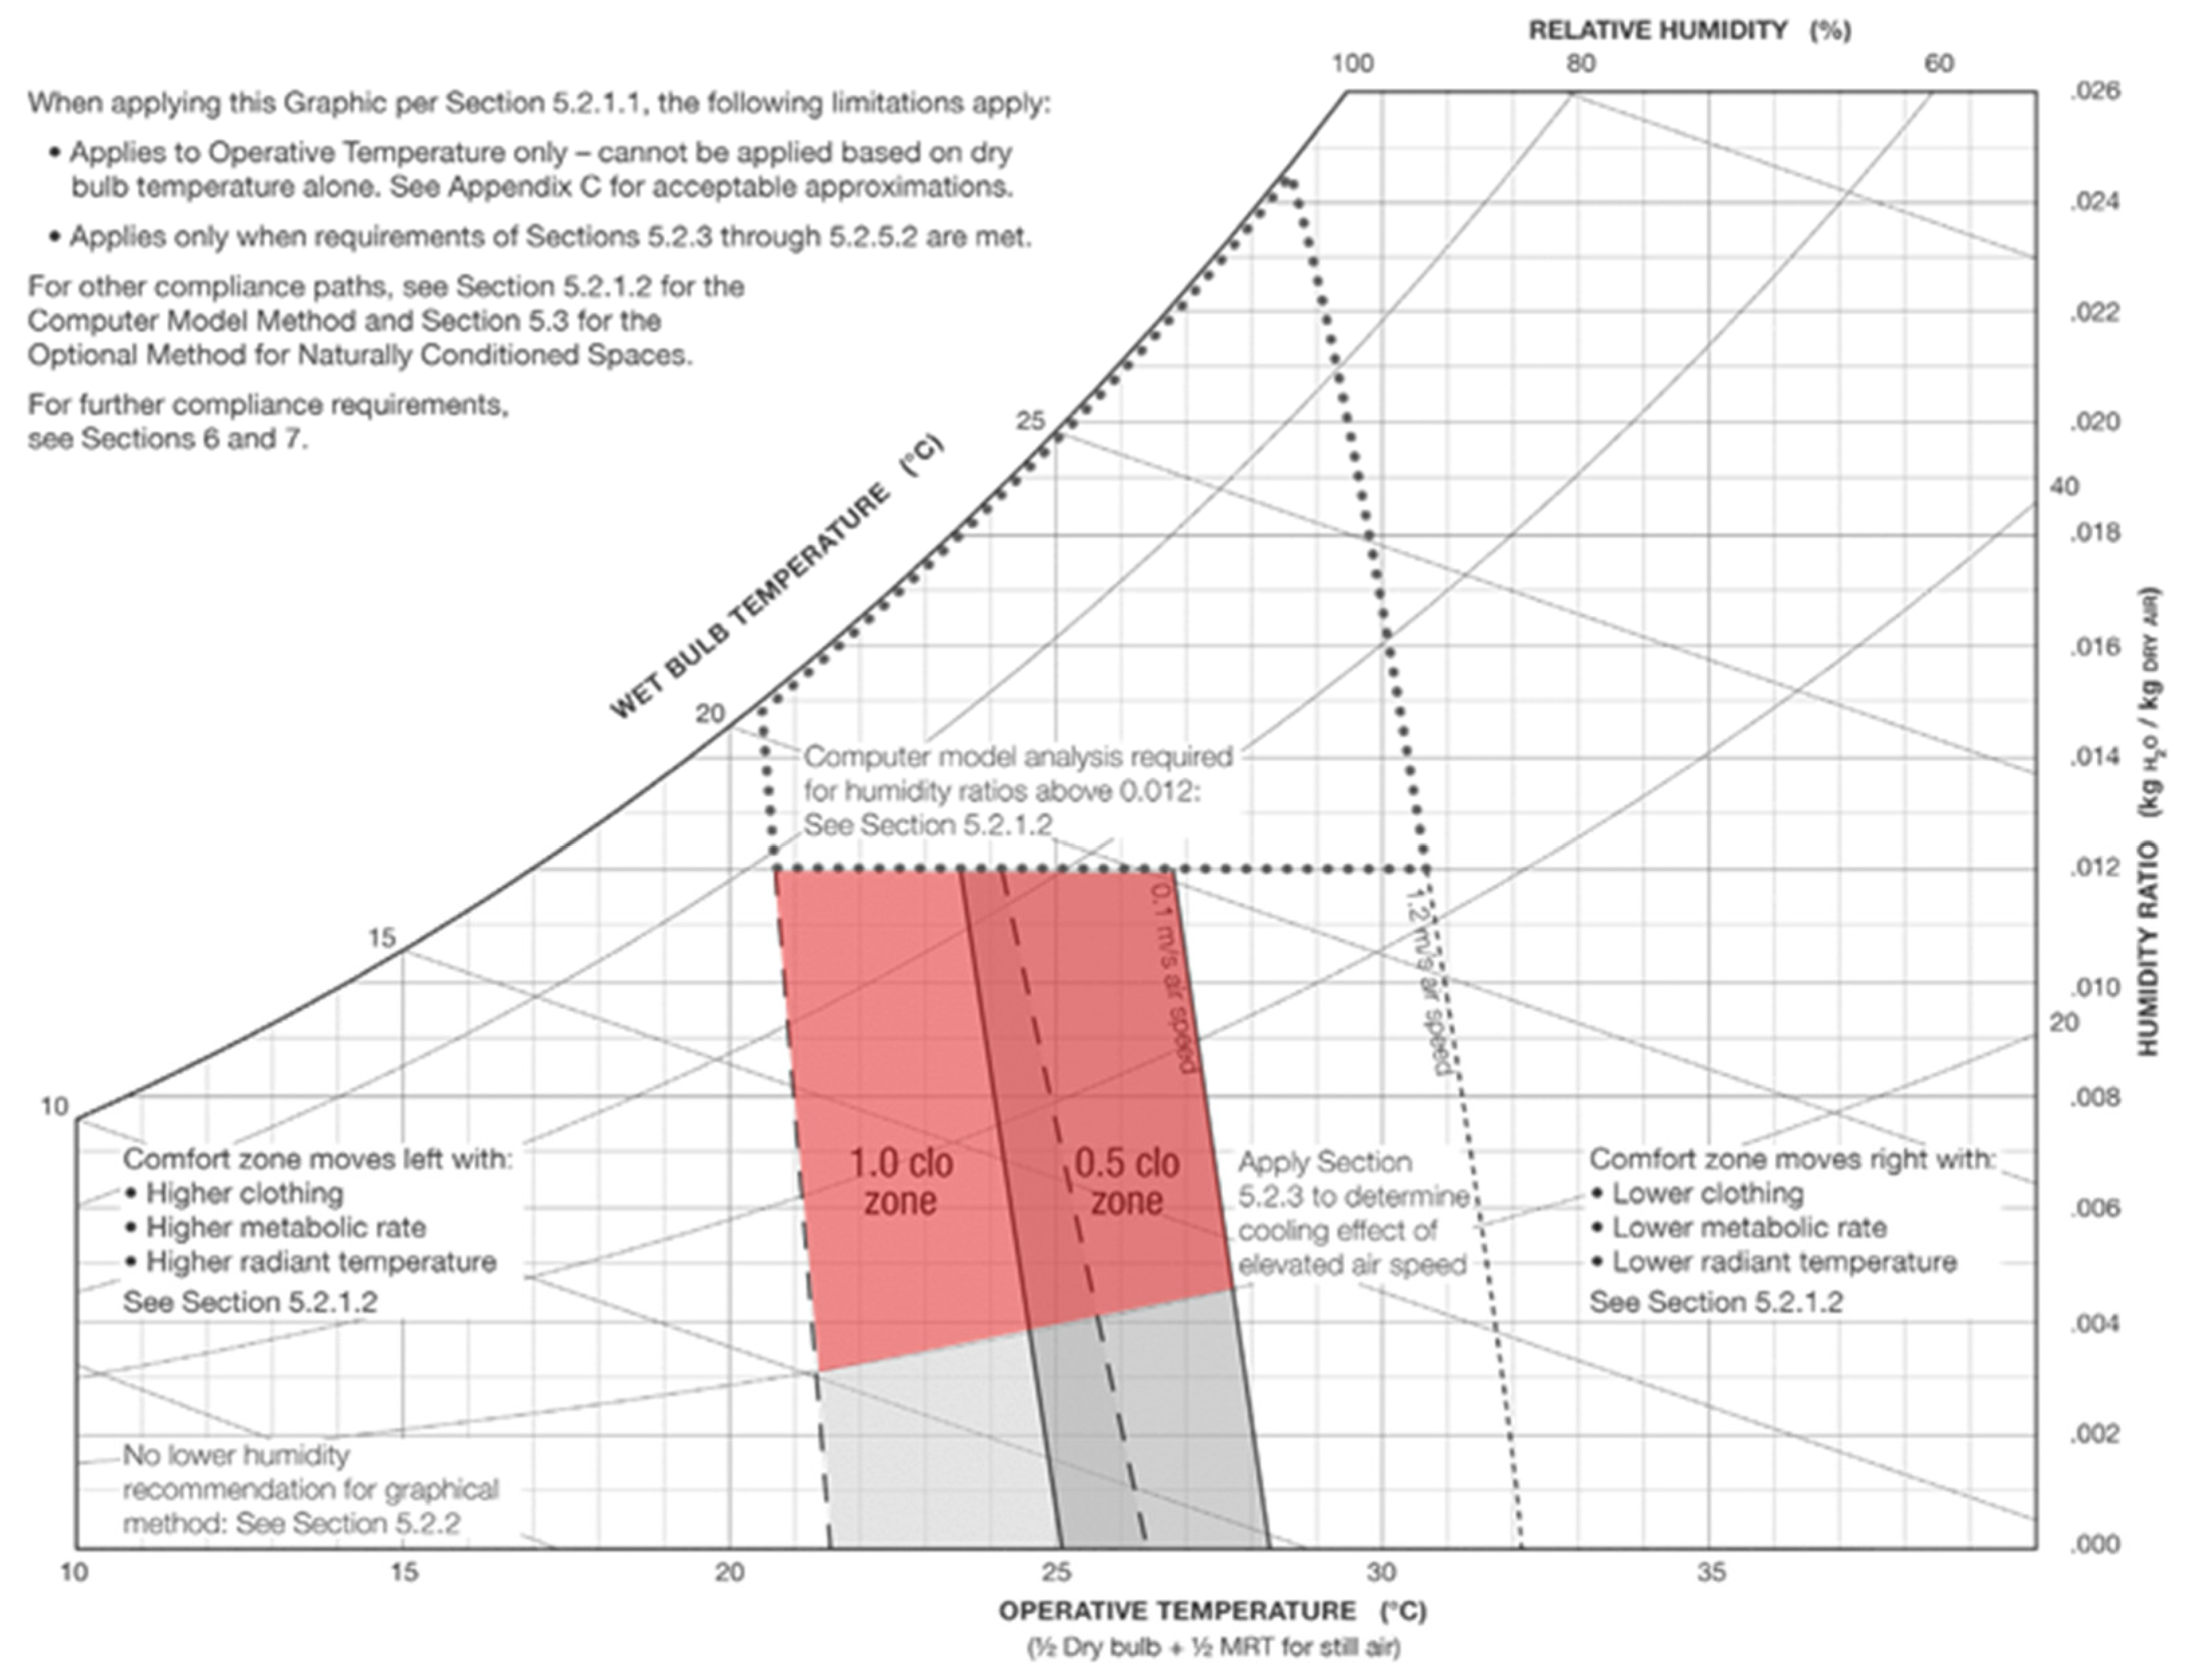
Based on the operative temperature obtained with the IR array sensor and the relative humidity data obtained with the thermo-hygrometer sensor, the thermal comfort state at the moment the data were obtained could be determined by using a chart with the ASHRAE comfort zone. However, as the comfort range of ASHRAE Standard 55 did not specify a lower limit for the humidity, the range required modification. Because the saturated water vapor ratio differs according to the relative humidity ratio depending on the temperature, the relative humidity increases as the temperature decreases, and vice versa, even for the same absolute water vapor ratio. Regardless of the temperature, an occupant of a space with very low relative humidity may experience discomfort due to conditions such as dry eye and skin psoriasis. Previous studies reported that to prevent discomfort due to low relative humidity [42], it is desirable to reset the comfort range by setting the relative humidity below 20% as the range indicating discomfort, as shown in Figure 13 [43].

Figure 13.
Modified American Society of Heating, Refrigerating, and Air-Conditioning Engineers (ASHRAE) thermal comfort chart.
Rather than plotting a graph of the operative temperature and relative humidity collected based on the chart with the ASHRAE comfort zone, the method of converting the relative humidity ratio into the absolute humidity ratio and graphically representing the result was selected. As shown in Figure 13, an absolute humidity ratio over 0.012 is outside the comfort zone. Thus, to accurately utilize the humidity ratio, the relative humidity should be converted into absolute humidity.
The thermodynamic fundamental equation in Table 5 was used to convert the relative humidity ratio to the absolute humidity ratio. For temperature and relative humidity, the data obtained from the IoT devices were used, and the air pressure applied when converting the absolute humidity ratio was set as the standard atmospheric pressure to calculate the saturated water vapor pressure.
Table 5.
Absolute humidity equation.
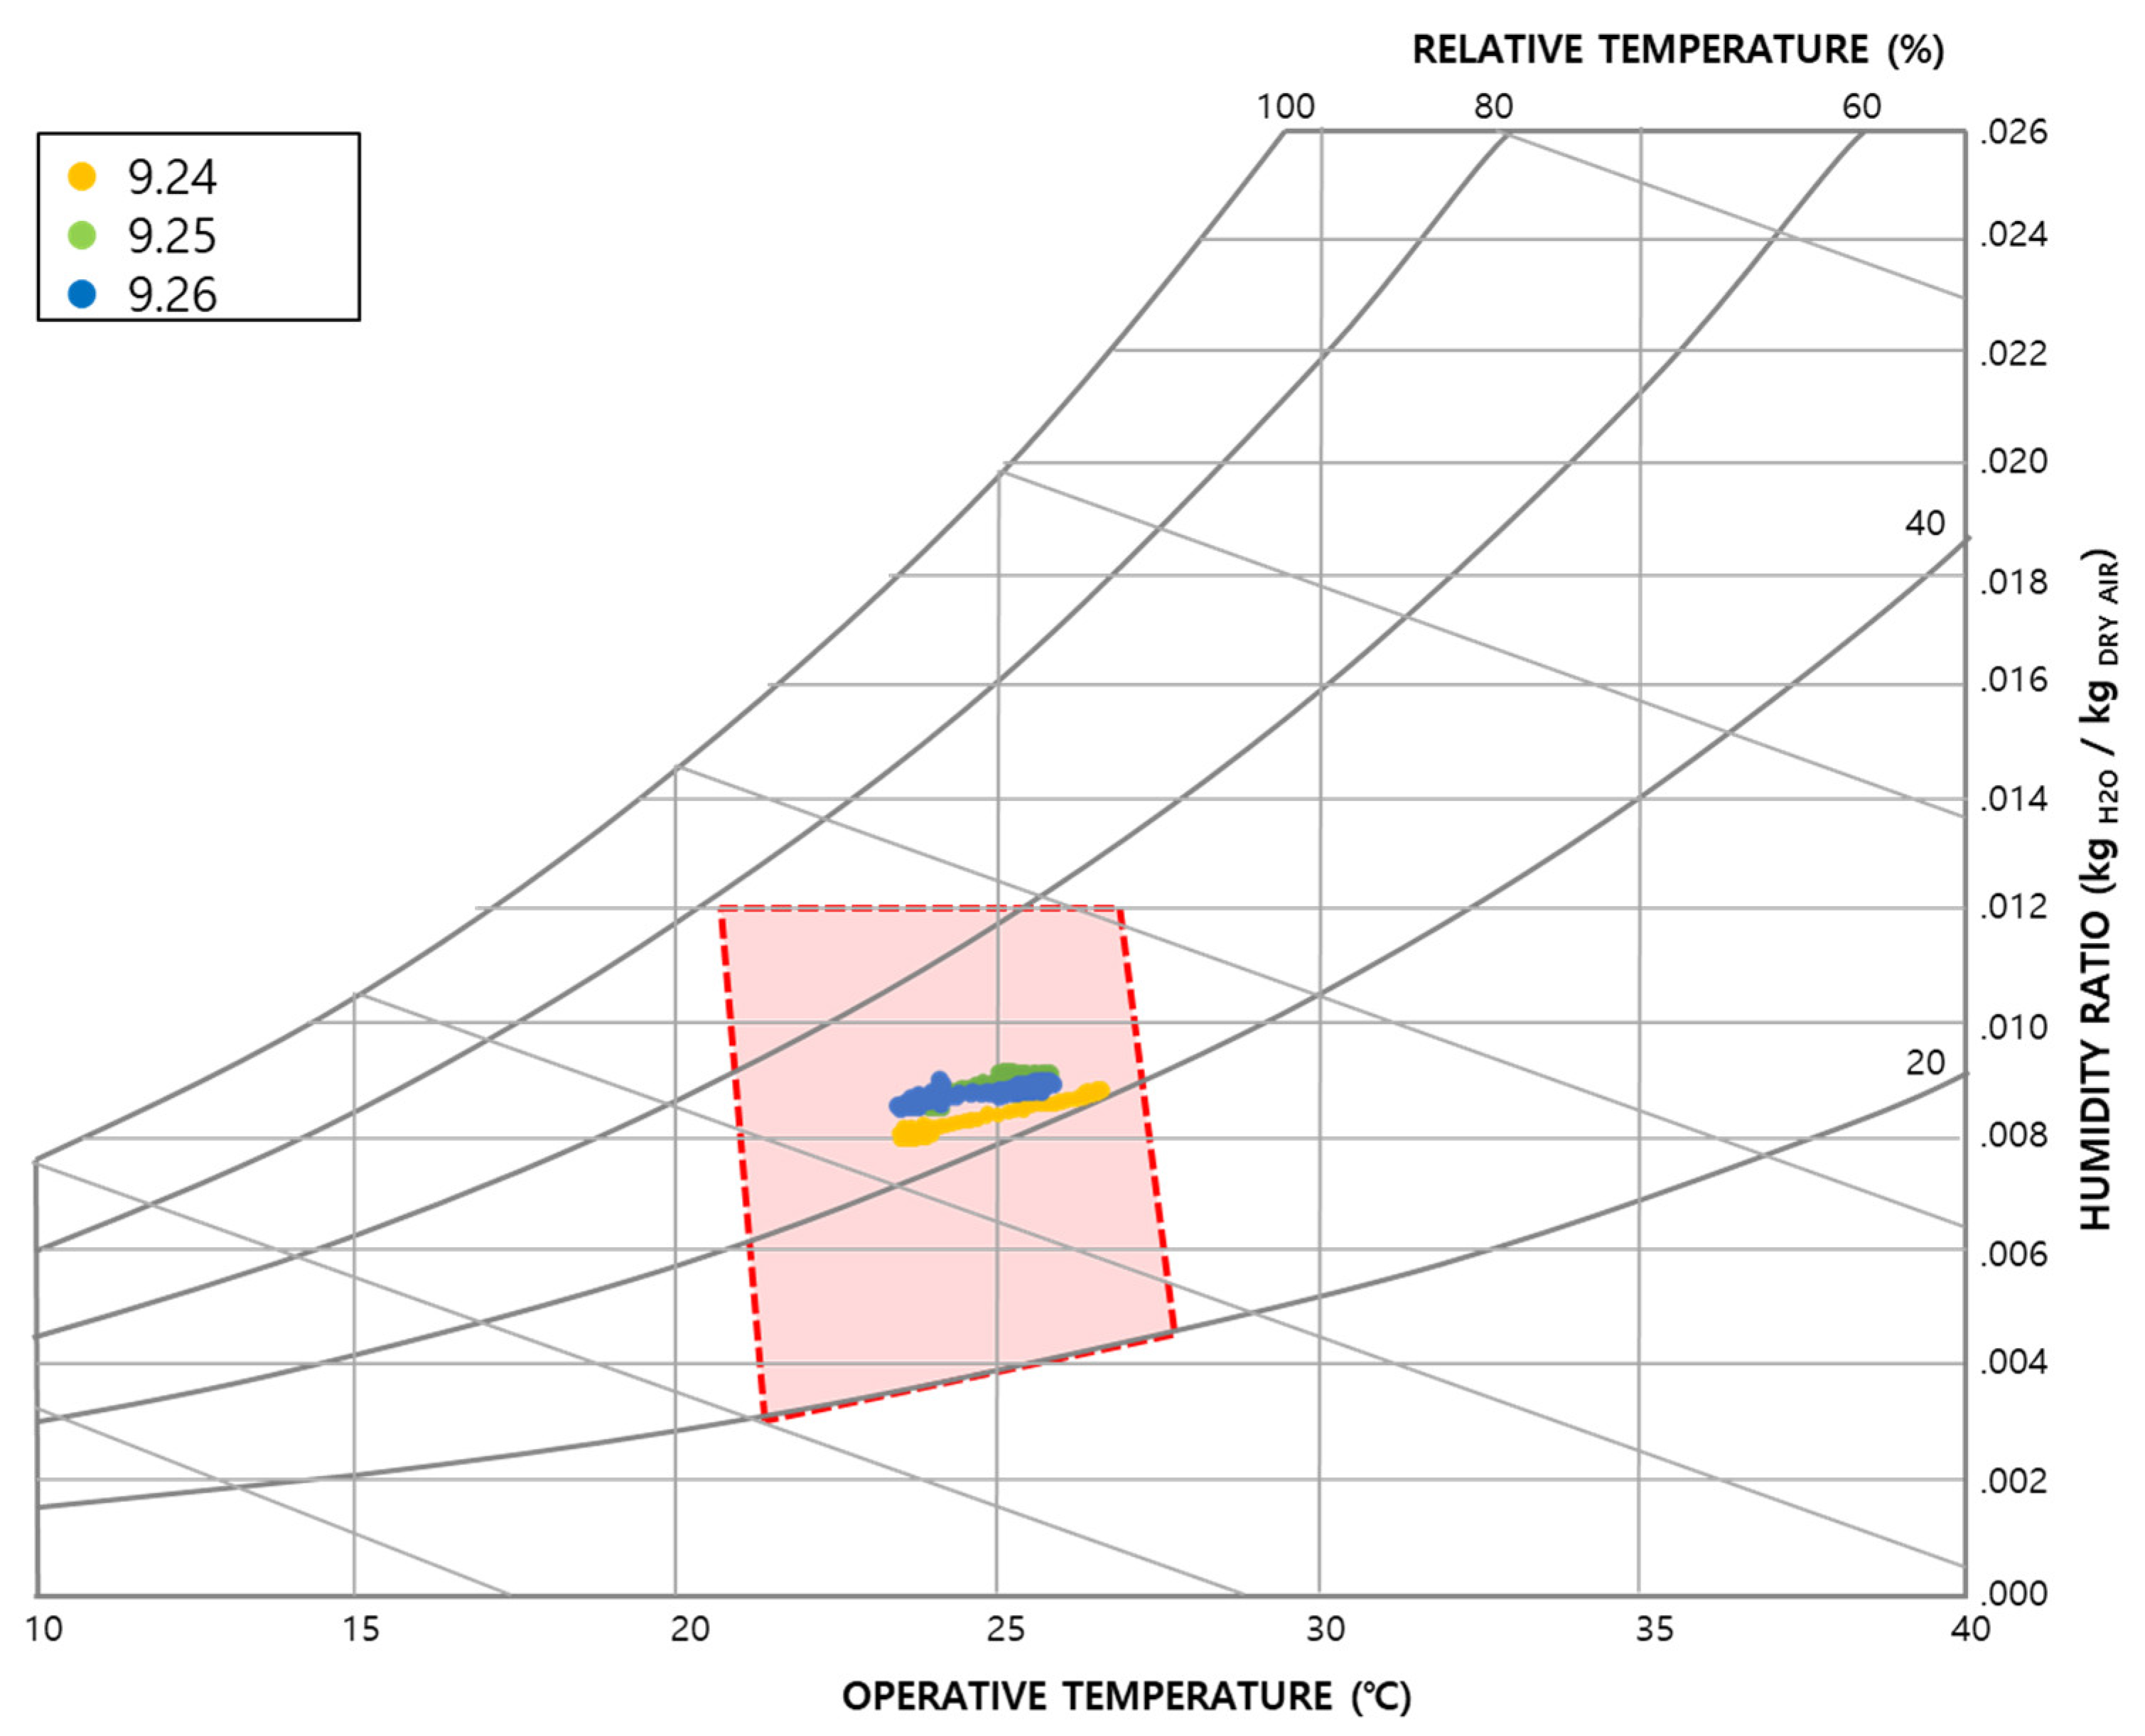
Assuming that the air velocity and physical activity level reflected the ASHRAE Standard 55 criteria, the operative temperature and absolute humidity ratio were reflected in the graph, as shown in Figure 14; the thermal comfort status can be observed on the chart. Blue dots represent the data collected on 24 September, green dots on 25 September, and yellow dots on 26 September. The comfort range is indicated in red and blue; the red area corresponds to 1.0 clo, and the blue area on the right corresponds to 0.5 clo in terms of the clothing quantity. Because the clothing required is less in late spring and summer, cooling and dehumidification can be performed by checking the thermal comfort status based on the blue area. In late autumn and winter, when additional clothing is required, heating and humidification can be performed by checking the thermal comfort status based on the red area.

Figure 14.
Reflecting data on the chart.
3.2. Use of Occupant Information
3.2.1. Determining CO2 Emission Per Capita
To ensure the reliability of the calculated CO2 concentration data, the CO2 concentration was measured in the same space as that reflected in the experiment scenario. In the experiment, a CO2 concentration sensor was installed at the same location as the globe temperature sensor, as shown in Figure 5. The occupant was asked to sit at the desk and work, as shown in Figure 7. If the position of the sensor is too close to the occupant, changes such as an abnormally high CO2 concentration can occur. Therefore, the sensor was installed at a distance of 1.5 m from the occupant. The experiment began after the first occupant entered the space and worked alone for 90 min; then, two occupants stayed in the space from 90 to 206 min. After 206 min from the start of the experiment, the space was maintained in an unoccupied state for the collection of CO2 concentration data. The air change rate was calculated using the mass conservation equation to reflect the decrease in CO2 concentration in the calculated value based on the number of occupants, due to infiltration occurring during non-occupancy. As a result, the air change rate per hour was calculated to be 0.198 times.
To assess the CO2 concentration, the CO2 emissions per capita should be known. Research on CO2 emissions according to the living space, amount of activity, sex, age, and weight has been actively conducted, and CO2 emissions can be determined according to the situation and conditions. Table 6 shows the conditions used to determine the CO2 emissions per capita for this scenario. This study set the CO2 emissions per capita to 0.0057 L/s, the result for the experiment scenario, indicating that 342 ppm of carbon dioxide was generated per minute considering the size of the space [31].
Table 6.
Initial values for ventilation control algorithm.
3.2.2. Comparison of Measured and Calculated Values of CO2 Concentration Based on the Number of Occupants
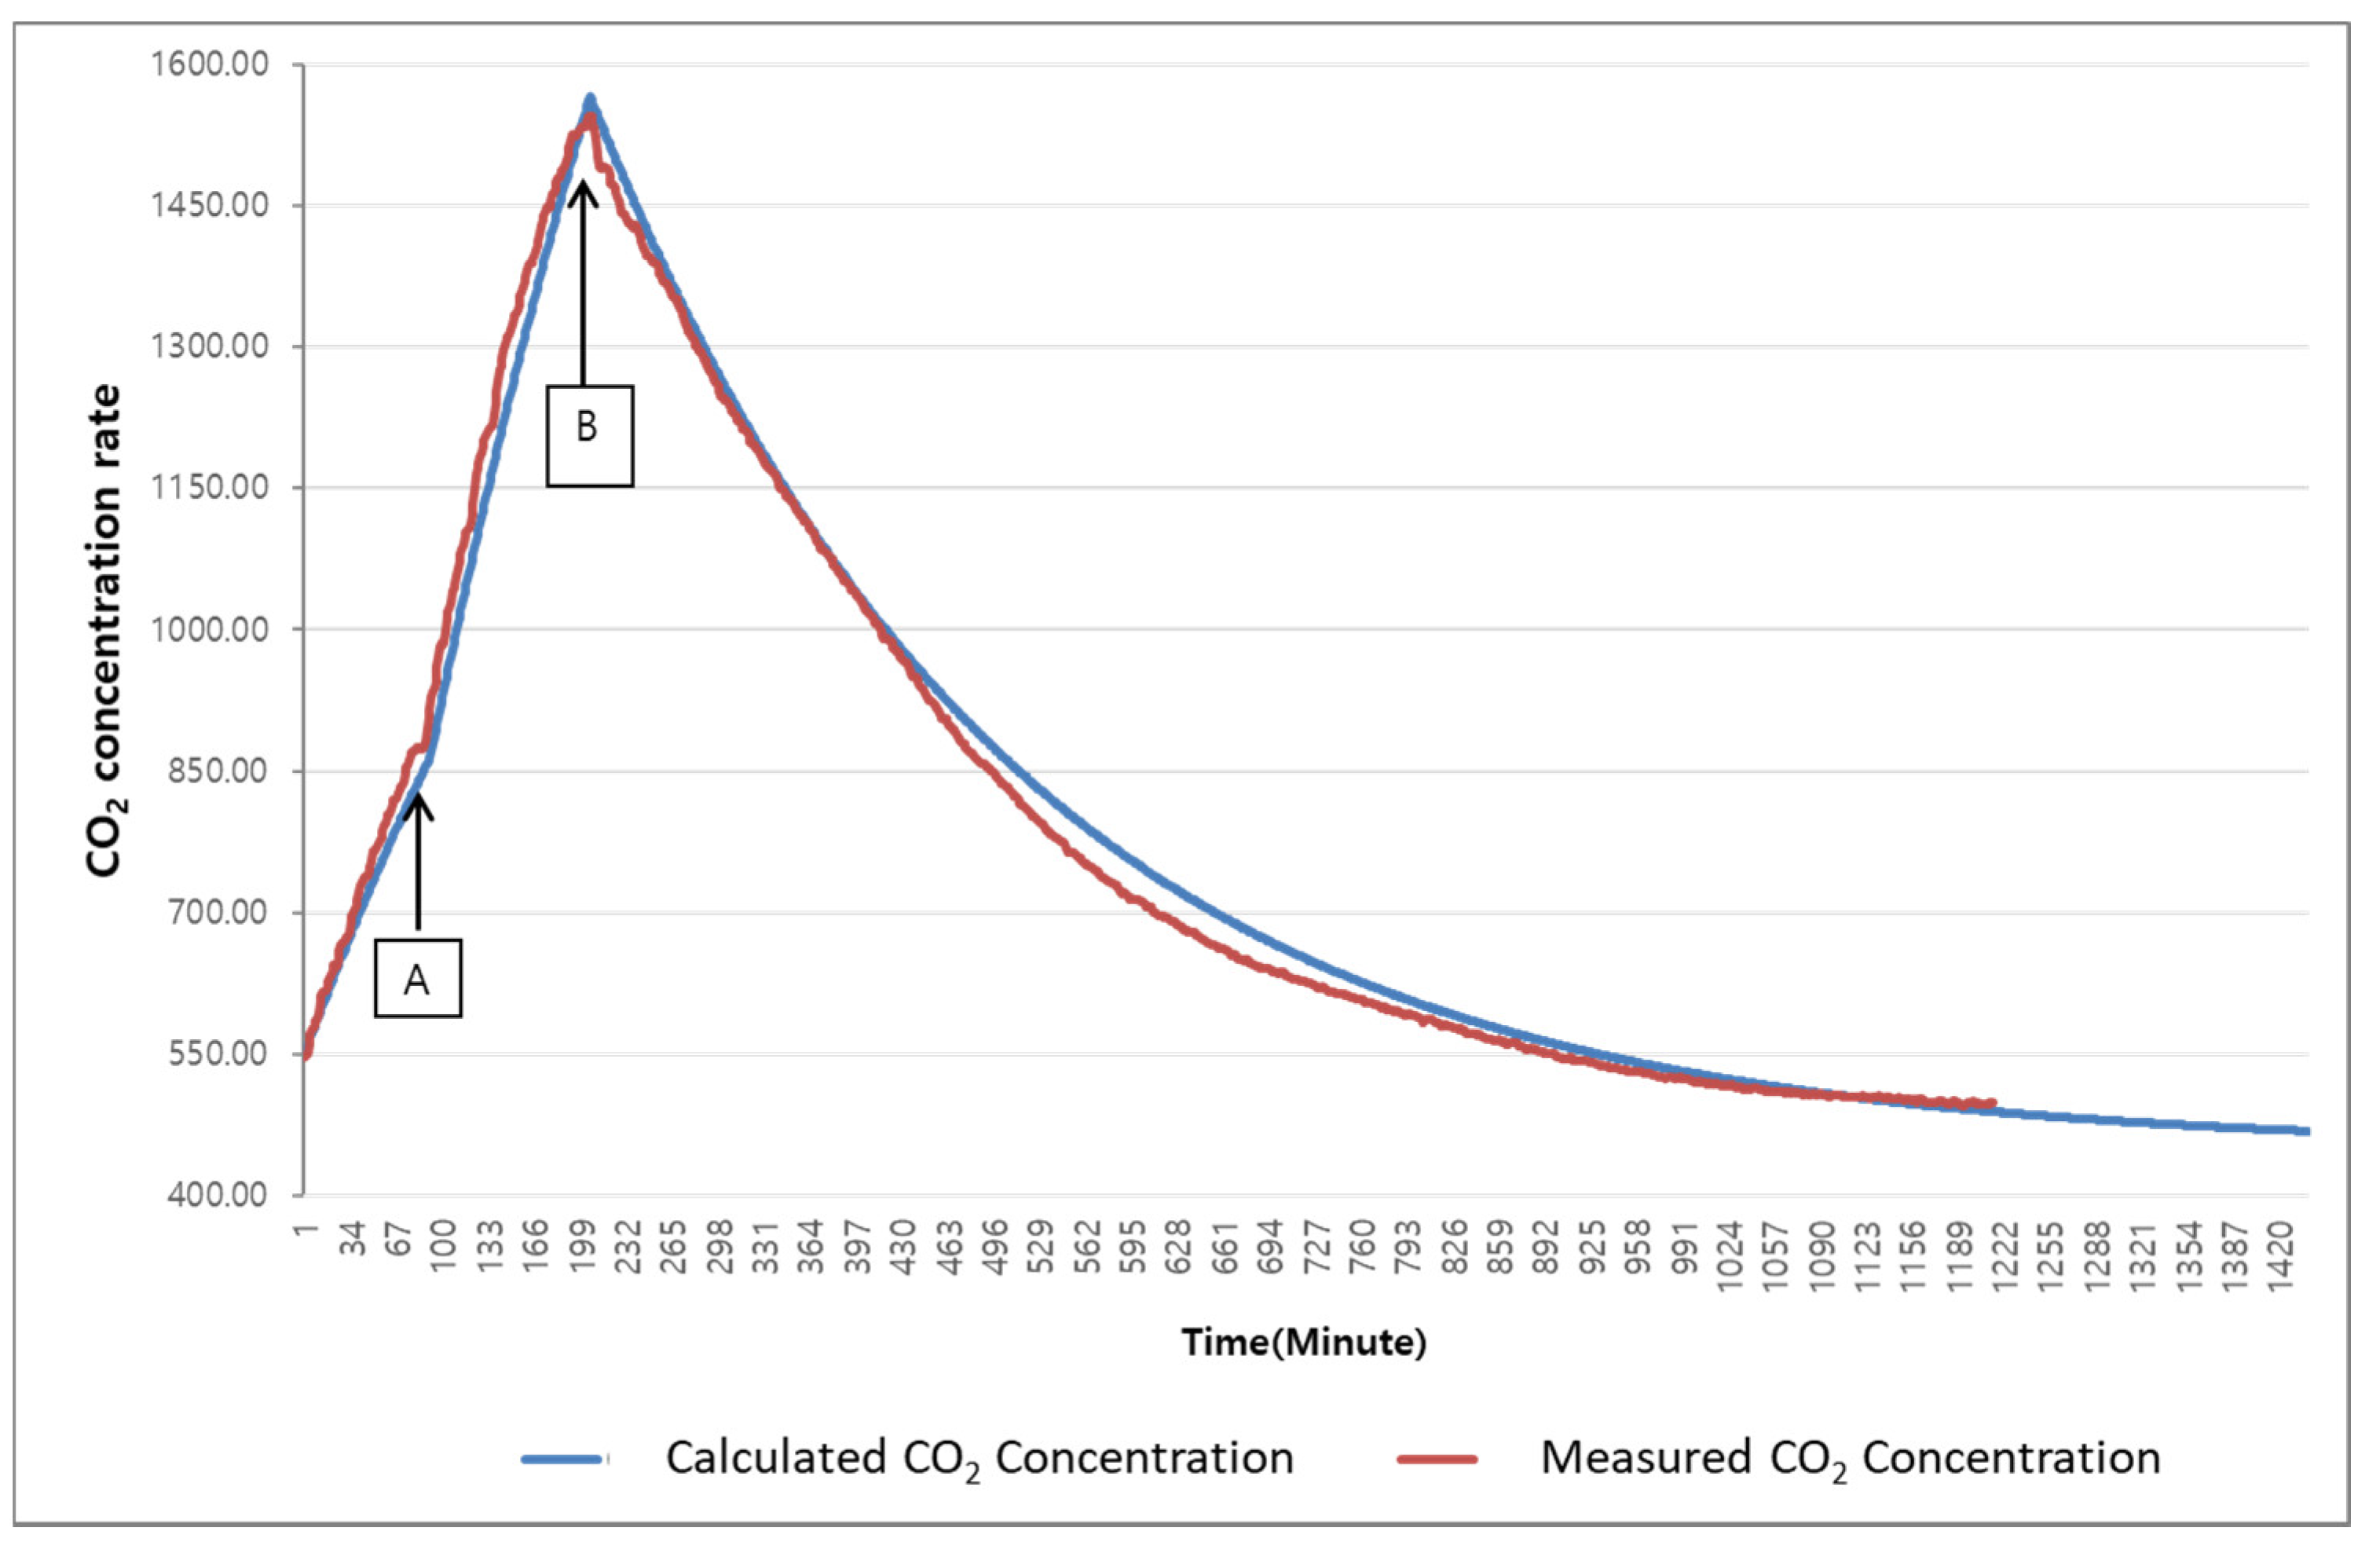
Based on the set amount of carbon dioxide generated per capita, the CO2 concentration per minute was calculated according to the number of occupants. In Figure 15, the orange curve represents the actual data measured using the CO2 sensor, and the blue curve represents the calculated result based on the CO2 emissions per capita. There was one occupant initially; another person entered the experimental space after Point A, and the two occupants left at Point B. Both the data and result demonstrated very similar trends, and the CO2 concentration decreased because of infiltration from the beginning of the non-occupancy state.
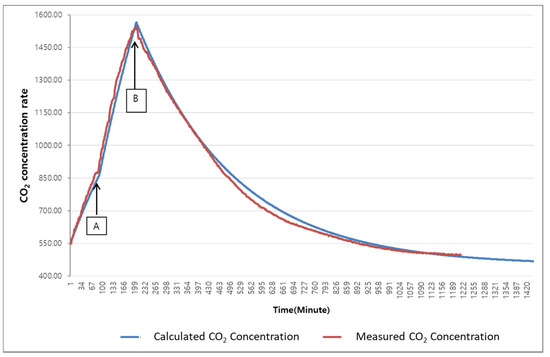
Figure 15.
Comparison of the CO2 emission results.
Figure 16 shows the regression analysis results for the rate of increase in the CO2 concentration measured and the calculated emission results, and Figure 17 presents the regression analysis results for the rate of decrease in these two quantities. In both cases, the R-squared value exceeded 0.99, indicating the high significance of the two datasets. Nevertheless, the accuracy of the calculated data was degraded, as the air change rate due to infiltration was unknown. The above method is not suitable for use in cases where the air change rate is unknown.
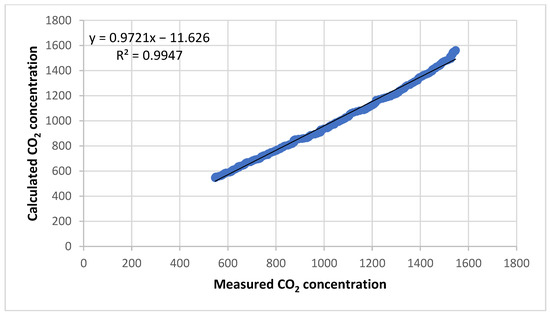
Figure 16.
Rate of increase in CO2 concentration.
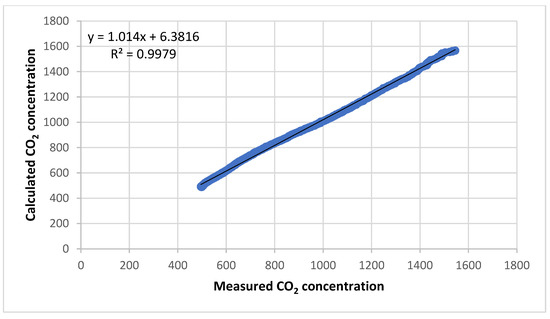
Figure 17.
Rate of decrease in CO2 concentration.
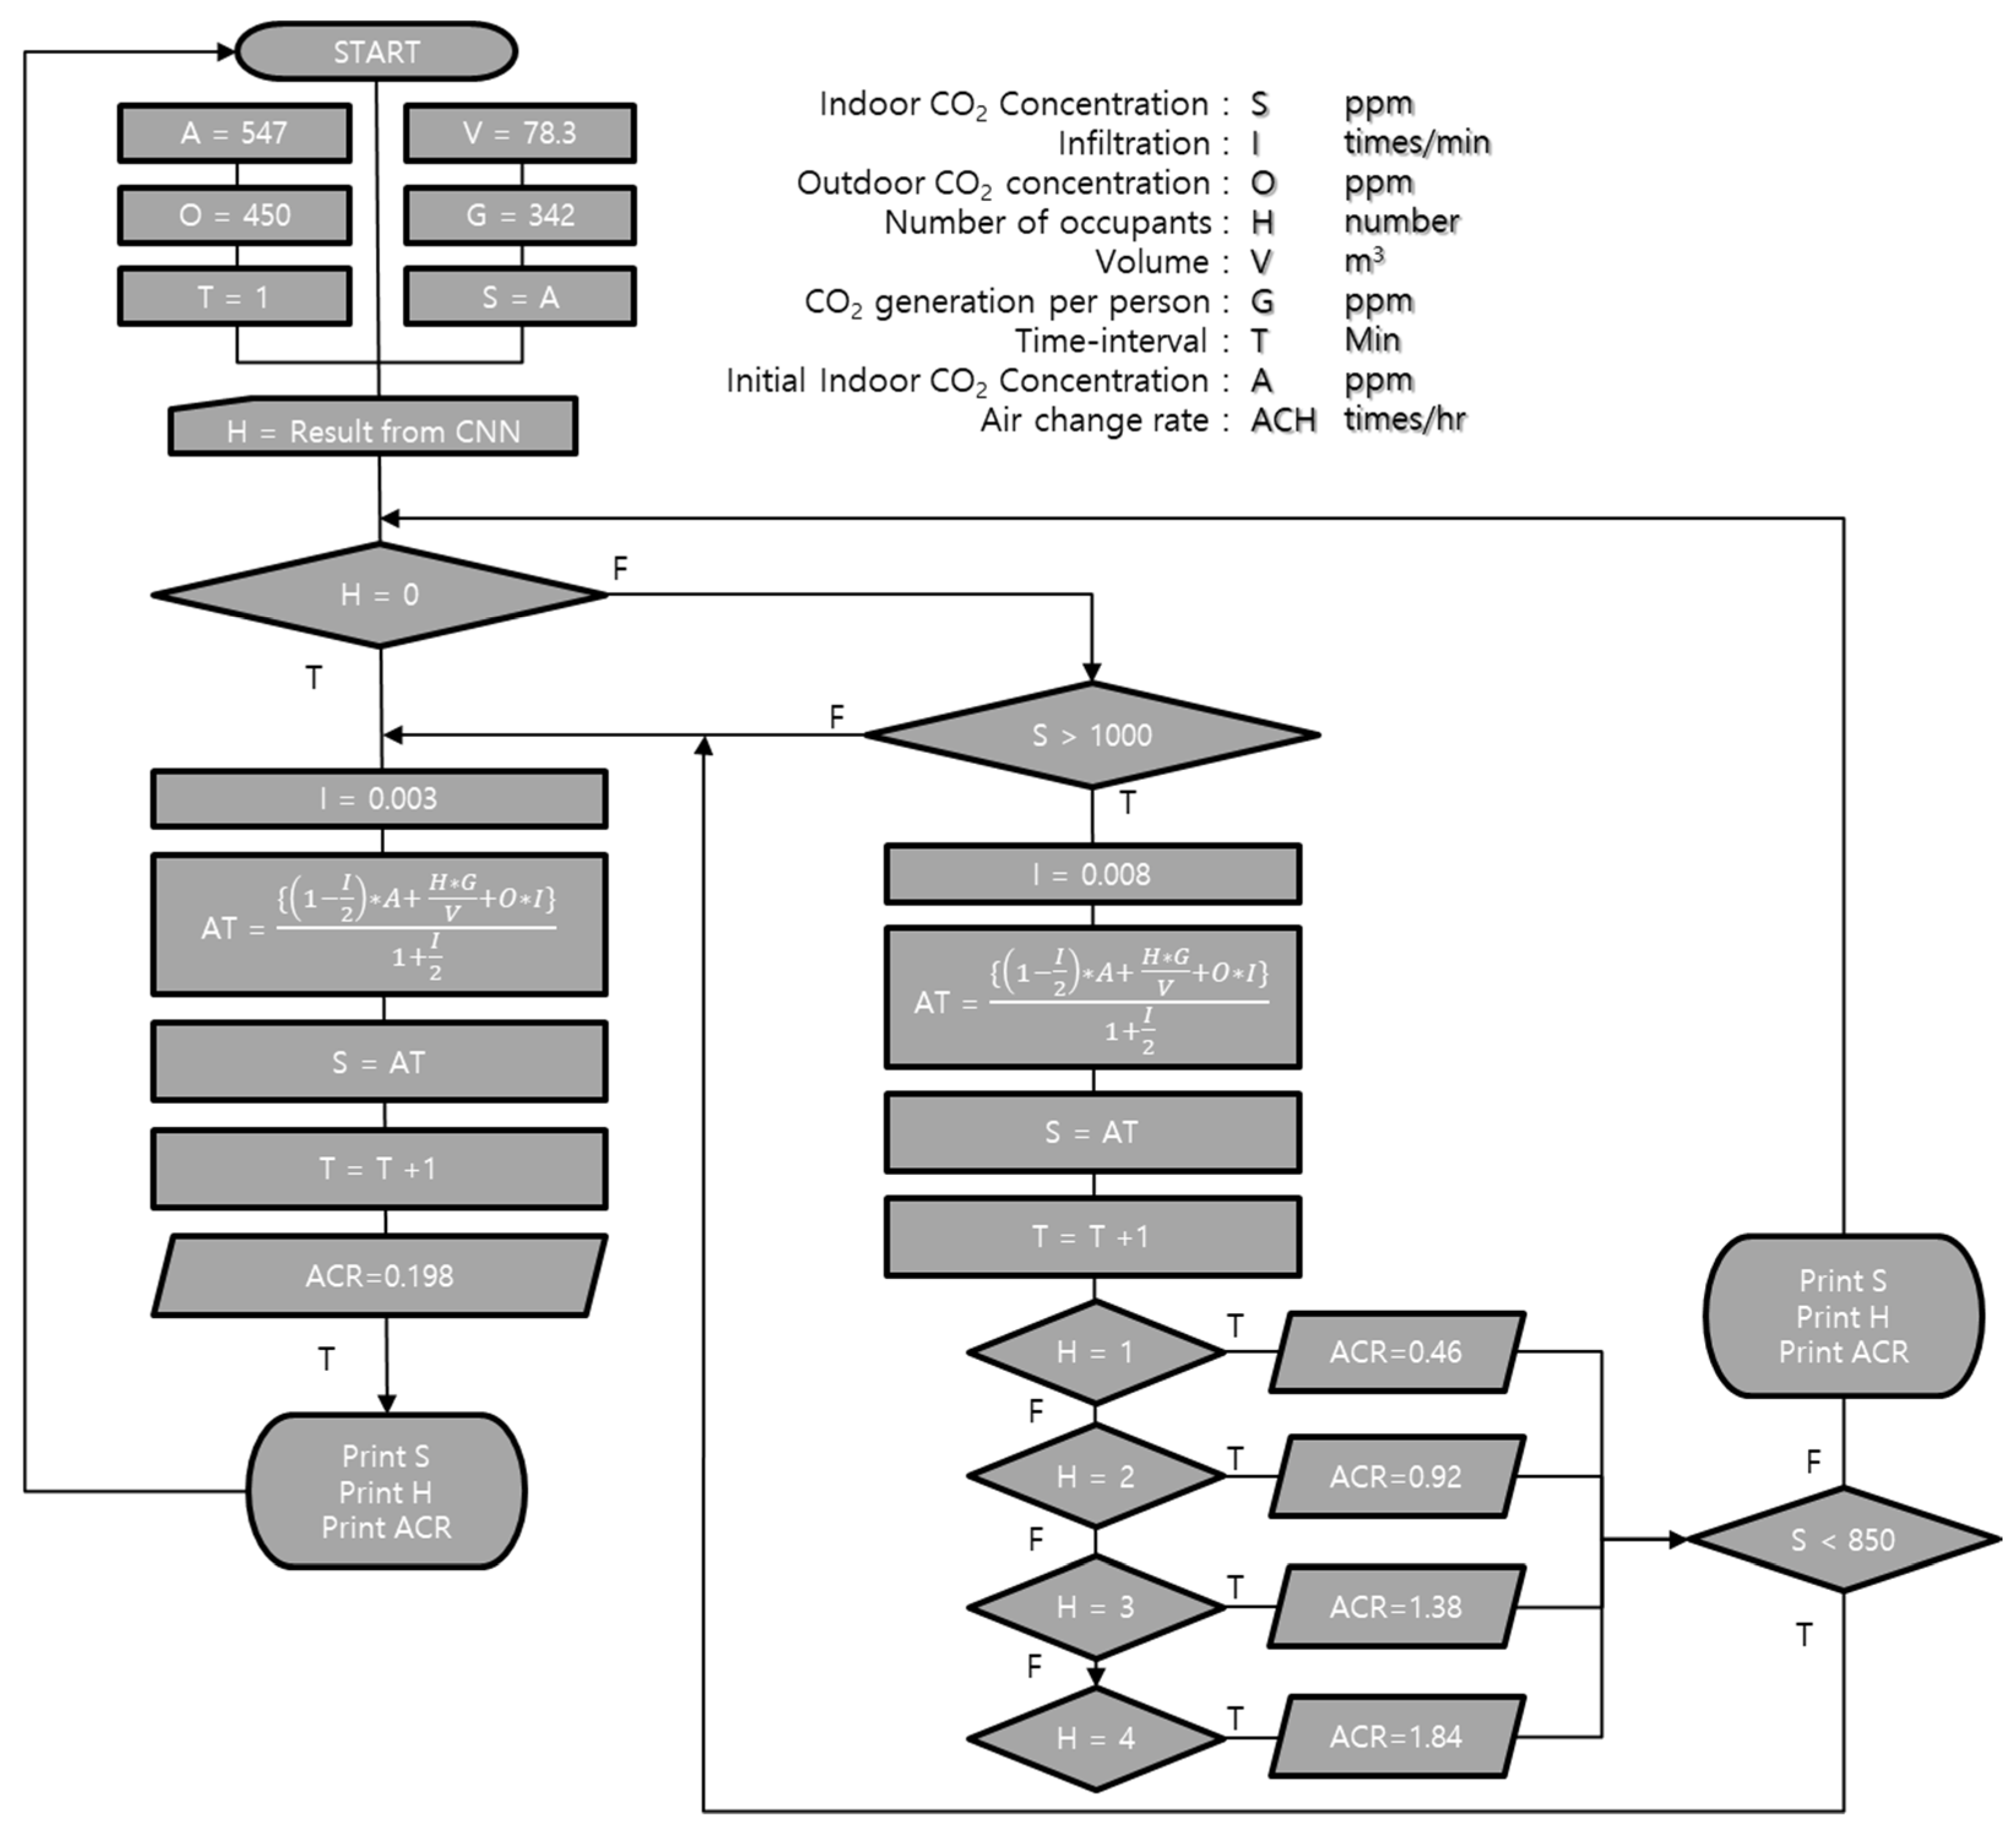
3.2.3. Real-Time Ventilation Control Algorithm
This study intended to suggest a real-time ventilation control algorithm for the living space by calculating the CO2 concentration based on the number of occupants detected using an IoT device. Many previous studies have been conducted on the ventilation criteria considering air quality. ASHRAE 62.1 presents the ventilation set-points according to indices such as building type, occupant status, and set-point. Domestic buildings must comply with the maintenance standards according to the type of building and pollutants in accordance with the Indoor Air Quality Control Act, and the CO2 concentration must be maintained below 1000 ppm. Proposing a ventilation set-point based on the CO2 concentration might not consider the other environmental factors affecting the human body, however, because controlling the ventilation based on the CO2 concentration would also discharge other pollutants and maintain indoor air comfort.
Table 7 shows the initial input data used in the ventilation control algorithm, which can be largely divided into basic data and data that require actual measurements. The basic data include the information that can be obtained from drawings, standards, reference materials, etc., without conducting separate measurements, and the other data can be obtained only by measuring the CO2 concentration in the non-occupancy state prior to installing the IoT device. As the algorithm components that required measurement had a very large effect on the CO2 concentration and were essential elements that enabled the cumulative management of CO2 concentration data, they had to be measured. In Table 7, air change rates are set differently depending on the number of people. This is because the indoor carbon dioxide concentration increases more rapidly as the number of people increases, and for this purpose, an algorithm was devised to set the amount of ventilation and operate ventilation facilities.
Table 7.
Initial values for the ventilation algorithm.
Figure 18 shows the algorithm flow chart for ventilation control. The CO2 concentration calculation result can be cumulatively updated in minutes, which allows for fast tracking and management. The initial setting of the algorithm was decided based on the input values in Table 5. Subsequently, the algorithm was set to determine the occupancy and operate the ventilation system according to the number of occupants to meet the ventilation requirements. The ventilation requirements suitable for the number of occupants should be calculated based on the carbon dioxide generated per capita. The ventilation requirement was set to supply ventilation at the rate of 0.46 times/h (36 m3) for one occupant to 1.84 times/h (144 m3) for as many as four occupants.

Figure 18.
Ventilation algorithm.
An algorithm was set up to operate the ventilation system based on the calculated CO2 concentration data through the following process. First, the presence or absence of occupants was determined to maintain the air change rate at 0.198 times/h when there was no occupant or when the CO2 concentration did not exceed 1000 ppm even in the presence of occupants. When occupants were present, ventilation was provided from the instant when the CO2 concentration exceeded 1000 ppm. At this time, the air change rate was applied by considering the ventilation requirement for the number of occupants. After the IoT device created for this study was turned on, all calculation results for the CO2 concentration could be accumulated and stored until the device was turned off. Therefore, the device could function as a carbon dioxide sensor during operation.
The result calculated in the IoT device is converted into an operation signal and sent to the ventilation device for ventilation suitable for the number of occupants. The amount of ventilation (ACR) calculated for each number of people can be identified in Table 5 or the ACR value can be matched for each H value in the algorithm. In addition, a display function was included to enable continuous monitoring of the situation in minutes.
The most important part of Figure 18 is calculating AT. The first is that the AT value must be configured to be calculated by reflecting the passage of time and fresh air from outdoors. The second is that external air flowing into the room also contains carbon dioxide. Therefore, the mass balance equation (Table 8) was used to accurately calculate the indoor carbon dioxide concentration. [44]
Table 8.
Mass balance equation.
The CO2 emission generated indoors was 17.74 ppm/min based on the maximum occupancy of four people. The scheme proposed in this study revealed that the amount of CO2 generated between the time when the CO2 concentration exceeded 1000 ppm and the time when the air was supplied was very small. As the effect of the CO2 concentration occurring at this time on the room was insignificant, the proposed scheme was considered to allow for real-time control.
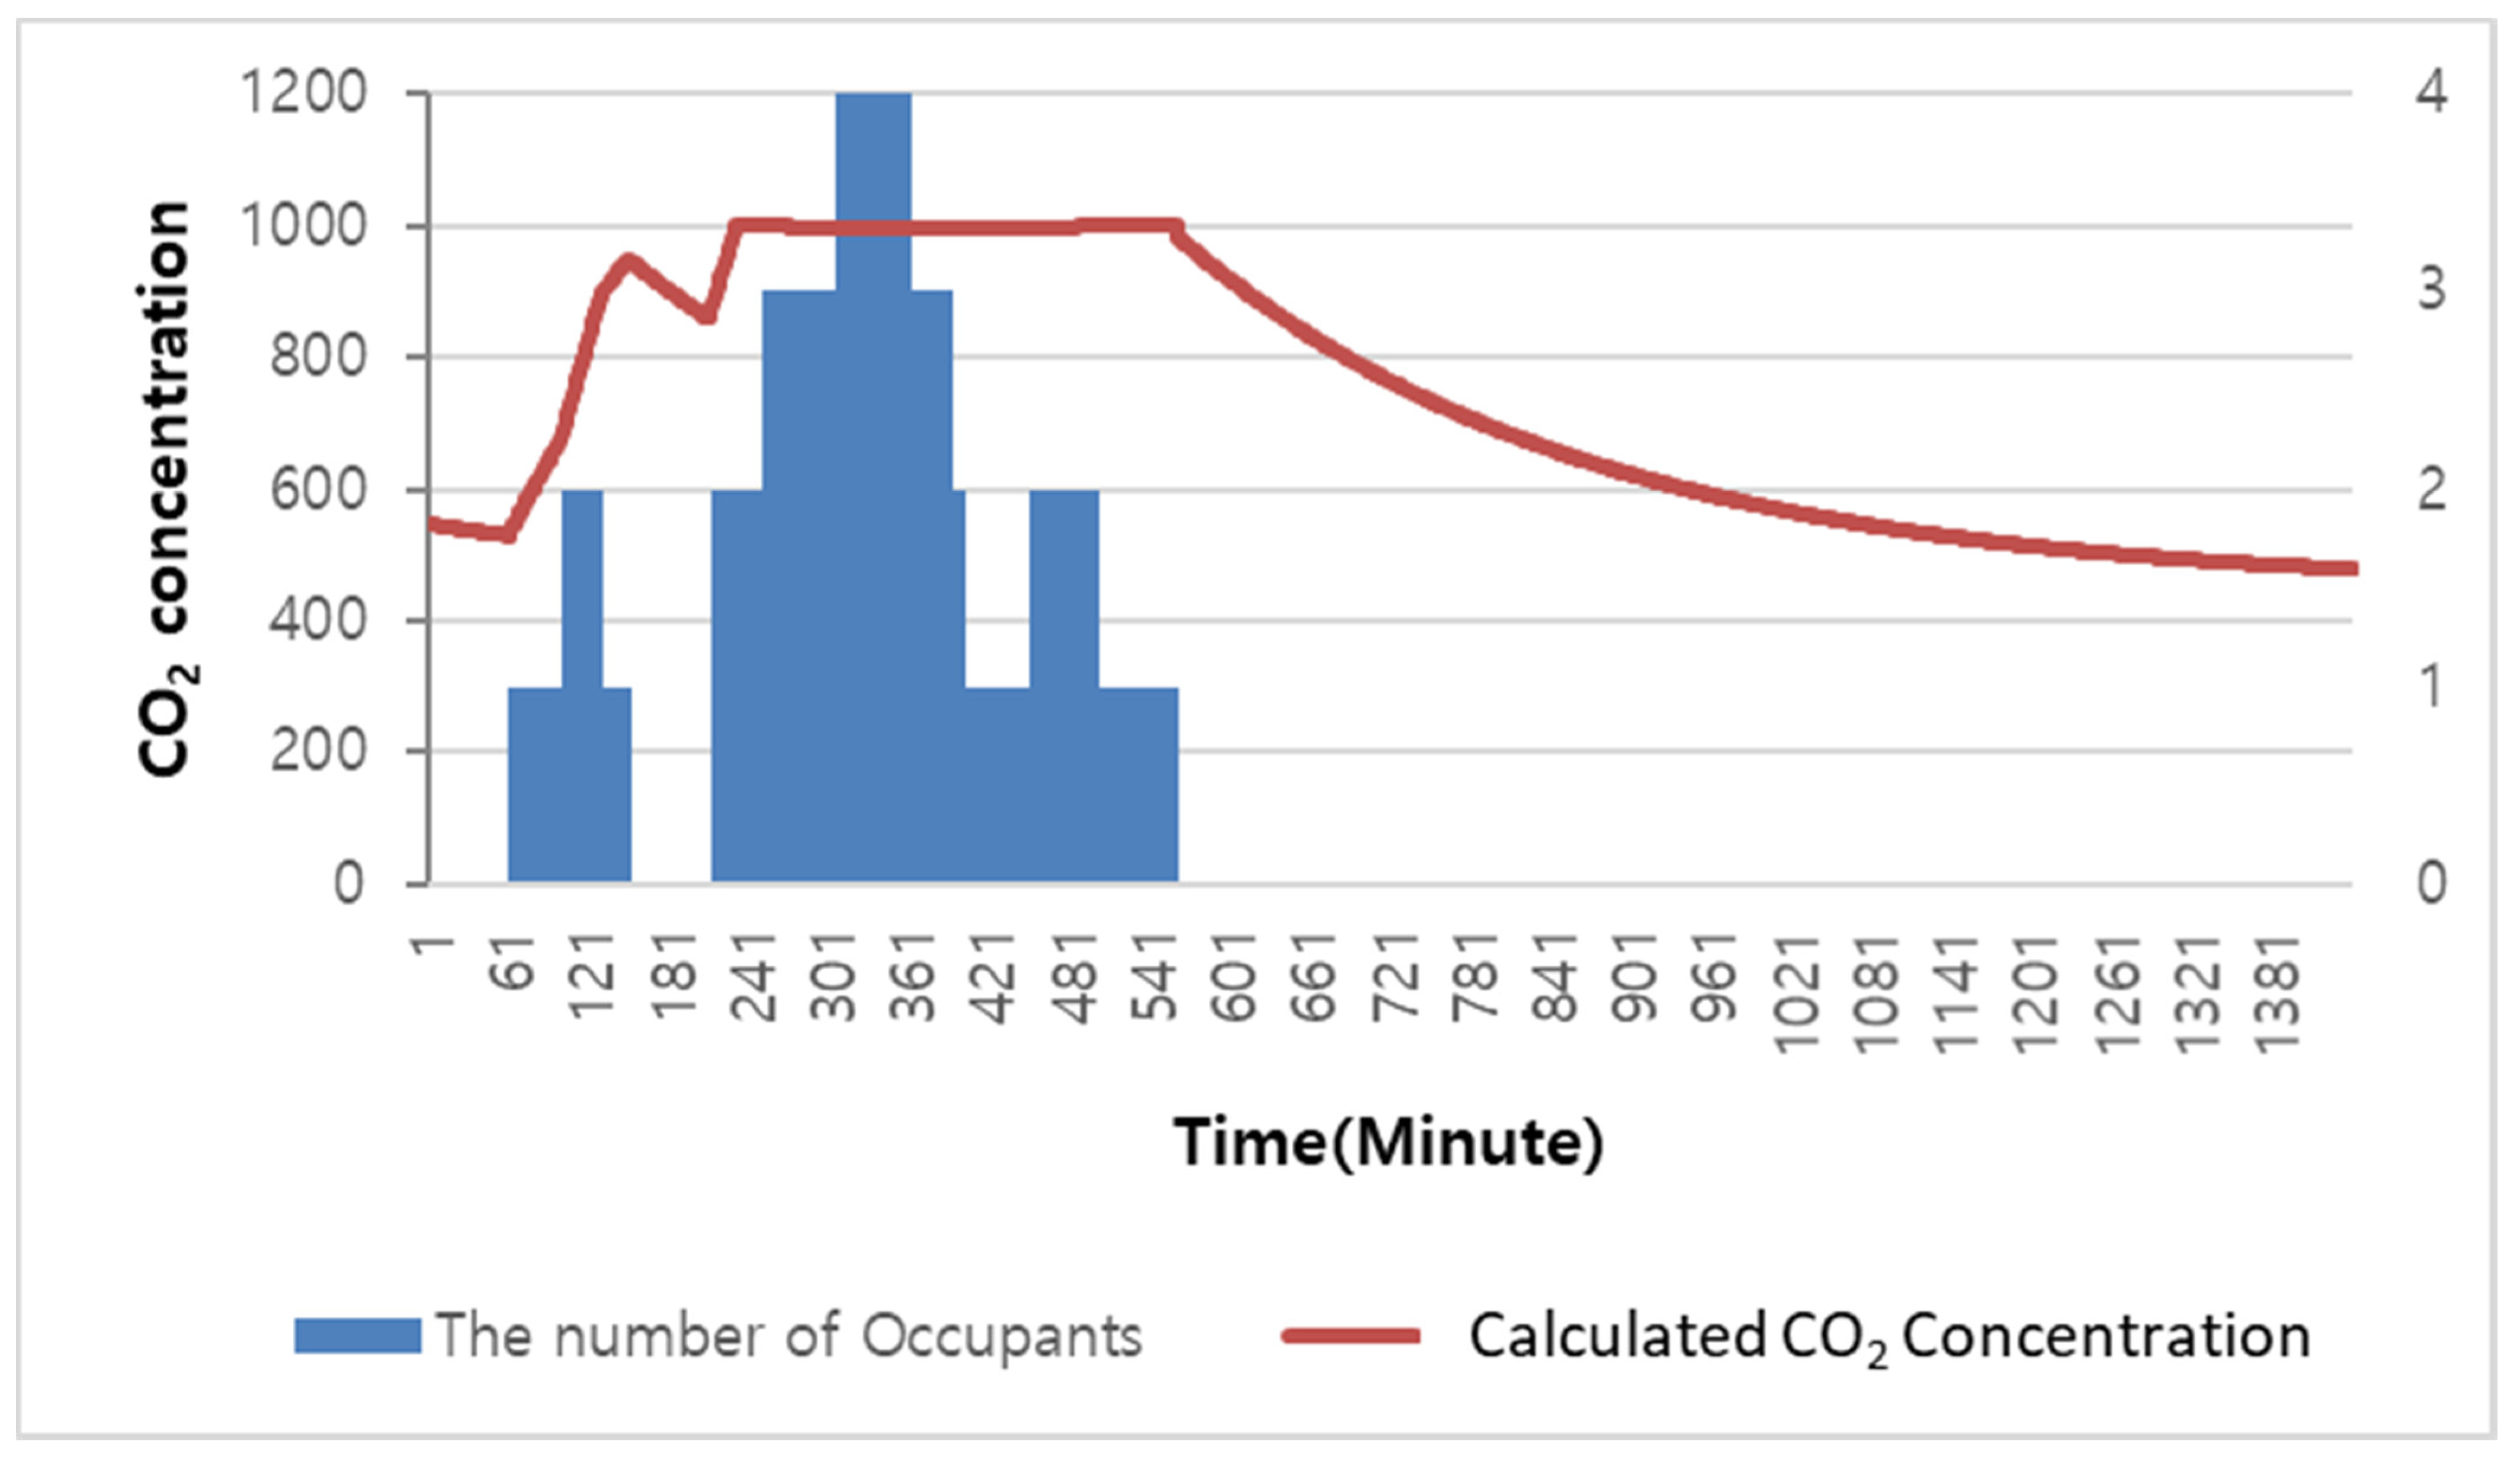
Figure 19 shows a graph of the change in CO2 concentration and the ventilation system status for the hypothetical occupant scenario reflected in the algorithm. The number of occupants was set to a maximum of four, and the situations in which an occupied room became unoccupied, or the number of occupants increased or decreased, were considered. The rise in CO2 concentration occurred progressively with the number of occupants. When the number of occupants decreased to 0, the CO2 concentration was less than 1000 ppm, and it decreased further owing to air exchange by infiltration. Later, ventilation was provided as the CO2 concentration increased owing to the presence of two occupants and exceeded 1000 ppm. At this time, ventilation control suitable for the number of occupants was performed to maintain the CO2 concentration at 1000 ppm until the space became unoccupied. After the start of the unoccupied state, the CO2 concentration gradually decreased because of air exchange by infiltration, converging to 450 ppm, which is the CO2 concentration of outdoor air. These results suggest that the IoT device can replace a carbon dioxide sensor as long as the number of occupants and the measured initial input data are accurate.
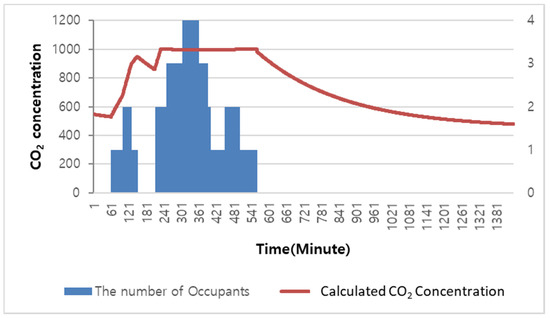
Figure 19.
CO2 concentration and the ventilation system status.
3.3. Discussion and Summary
In this study, image data were collected from the Pi camera by connecting image sensors to the IoT device, and surface temperature data were collected using an IR array sensor. The indoor environment information was obtained with this configuration. In addition, this study proposed a scheme for real-time ventilation control by considering air quality based on the occupant data and real-time thermal comfort status monitored using the surface temperature. A comparison of the operating temperature based on the surface temperature with the operating temperature based on the global temperature showed that the coefficient of determination was close to 0.95. The calculated CO2 concentration based on the number of occupants and the measurement result using a CO2 concentration sensor showed a coefficient of determination close to 0.99, indicating high significance.
Because the operative temperature is an index for thermal comfort and the CO2 concentration is an index for air quality, the scheme using an IoT device, proposed in this study, appeared to sufficiently consider occupant comfort. This meant that it was possible to collect multi-purpose and multidimensional indoor environment information beyond the limits of single-purpose, one-dimensional control reference detection by actively utilizing the characteristics of IoT technology instead of using it as a sensor device with a wireless communication function. In addition, the results of this study suggest that the proposed scheme can overcome the temporal and spatial lags caused by physical limitations related to the installation location of the sensor for collecting indoor environment data based on reasonable building operation standards.
Table 9 summarizes the available methods for the camera and IR array sensors. The data corresponding to the camera and IR array sensor are depicted separately, and four steps were developed to process the raw data. The result for each step can be obtained by calculation or by using the algorithm. More specifically, when the output of Step 1 is obtained as the result of the calculation or algorithm, it can be used to obtain the output of Step 2. If the output of Step 4 is obtained by proceeding sequentially, 30 types of outputs can be obtained in a short time from the IR array sensor, and if a Pi camera is used, 14 types of outputs can be obtained in a short time. If the performance of the IoT devices is ensured, outputs can be obtained more quickly from the two types of sensors; however, when actually controlling the equipment for cooling, heating, and ventilation, there would be time points of use and time points of non-use depending on the characteristics of the output. This necessitates classification of the outputs; however, this requires the premise that there is a log function that does not delete but continuously tracks and manages the data at the time points of non-use of the equipment.
Table 9.
Variety of purposes using the IoT device with camera and IR array sensor.
4. Conclusions
4.1. Highlights and Implications
In this study, the number of people in a building space was measured using an image sensor, and based on this count, the CO2 concentration was tracked and managed. When these results were compared with those obtained from an actual CO2 measuring instrument, very meaningful results were obtained. It was concluded that this method is more applicable and accurate than the method of estimating the number of people based on the CO2 concentration. Although this study was limited to determining the time to start the simple operation of ventilation equipment, the method provided the ventilation starting time with a high accuracy. Furthermore, the results indicate that the method can measure the operative temperature, indicating the occupants’ comfort status, using the IR array sensor regardless of the sensor’s location. This is an attractive feature because the globe temperature sensor is difficult to use as it causes major inconvenience for occupants owing to the location at which it needs to be installed. Using the method developed in this study, this challenge can be addressed.
We encourage practitioners to follow the information collection methods presented in Table 8 and the procedures provided in this paper. Further empirical studies on the energy savings and comfort improvement effects are required. As the energy saving control performed by increasing the efficiency of building operation and the operation control to meet the demands of the occupants for indoor comfort are inversely proportional to each other, it is very difficult to satisfy both requirements. The proper application of technological innovation, especially IoT technology, being achieved in the fourth industrial revolution, rather than simply using the wireless communication function of the IoT technology, will allow these conflicting requirements to be successfully managed.
4.2. Future Work
The thermal image obtained with a high-performance IR array sensor can represent the shape of the occupant more accurately, allowing occupant data collection while ensuring privacy. However, high-performance thermal sensors are very expensive, and they are difficult to apply in terms of market competitiveness. This is because the IoT device used in the experiment covers an area of 23 m2 with a length of 3.5 m and a width of 6.5 m, and for larger spaces, we need to increase the number of installed devices. Therefore, it is desirable to install a large number of IoT devices to obtain accurate and precise results, but if expensive thermal cameras are used for this, the total cost of devices will increase exponentially, which reduces affordability. The thermo-hygrometer was an expensive device in the early days of its invention, but it has now become inexpensive and has improved in accuracy. Thus, with further advances in technology over time, it will be possible to overcome these limitations.
The CNN algorithm was applied to IoT devices by using Python-based open-source coding information. In this study, only the occupant data were extracted from the images using the CNN algorithm. Avoiding the imposition of this constraint will allow for the detection of not only heat sources such as laptops and computers in the image, but also objects associated with the occupants’ activity. The reason for detecting objects associated with the occupants’ activity is that the metabolic equivalent of task (MET) value changes depending on the activity, and the value of the internal heat gain generated from the occupant changes according to the MET value, resulting in different cooling, heating, and ventilation requirements. Additional comfort-related indices such as activity (MET) and amount of clothing (clo) can be collected based on this function, and the characteristics of the open-source CNN algorithm will allow for universal utilization with no additional adjustment required for installing IoT devices.
Regarding the extensibility of the Pi camera, it will be possible to detect all objects such as PCs and laptops by lifting the limit set for the object detection function of CNN to detect only humans. It will be possible to let the Pi camera play the role of an illuminance sensor for indoor lighting control by classifying the level of brightness with respect to the light entering the space from outside. It can also be used simultaneously for other purposes such as safety and crime prevention. However, it can be useless without light (visible light) owing to the limitations of the general camera functions. Because the IR sensor operates on IR rather than visible light, it can be used even in a dark space without light. In terms of operation, it will be possible to classify an occupant’s activity by observing the heat status of the occupant, and it will be possible to calculate the amount of heat generated more accurately by measuring the temperature of the devices.
Author Contributions
Methodology, J.J., D.-O.W. and L.J.; data curation, writing—original draft preparation, J.L. and S.-B.L.; writing—review and editing, J.L. and S.-B.L. All authors have read and agreed to the published version of the manuscript.
Funding
This work was supported by “Human Resources Program in Energy Technology” of the Korea Institute of Energy Technology Evaluation and Planning (KETEP), granted financial resource from the Ministry of Trade, Industry & Energy, Republic of Korea. (No. 20194010000070).
Institutional Review Board Statement
Not applicable.
Informed Consent Statement
Not applicable.
Acknowledgments
I would like to express my gratitude to Sung-Bok Leigh for allowing me to grow through this study. Also, I would like to express my gratitude to Lars Junghans and Deok-Oh Woo for helping me complete the experiments and research in Michigan to the end.
Conflicts of Interest
The authors declare no conflict of interest.
References
- Minoli, D.; Sohraby, K.; Occhiogrosso, B. IoT considerations, requirements, and architectures for smart buildings—Energy optimization and next-generation building management systems. IEEE Internet Things J. 2017, 4, 269–283. [Google Scholar] [CrossRef]
- Jia, M.; Komeily, A.; Wang, Y.; Srinivasan, R.S. Adopting Internet of Things for the development of smart buildings: A review of enabling technologies and applications. Autom. Constr. 2019, 101, 111–126. [Google Scholar] [CrossRef]
- Farhad, M.; Hashem, A. Intelligent buildings: An overview. Energy Build. 2020, 223, 110192. [Google Scholar] [CrossRef]
- Gao, X.; Pishdad-Bozorgi, P.; Shelden, D.R.; Tang, S. Internet of Things enabled data acquisition framework for smart building applications. J. Constr. Eng. Manag. 2021, 147, 04020169. [Google Scholar] [CrossRef]
- Ahmad, M.W.; Mourshed, M.; Mundow, D.; Sisinni, M.; Rezgui, Y. Building energy metering and environmental monitoring—A state-of-the-art review and directions for future research. Energy Build. 2016, 120, 85–102. [Google Scholar] [CrossRef] [Green Version]
- Ibaseta, D.; García, A.; Álvarez, M.; Garzón, B.; Díez, F.; Coca, P.; Del Pero, C.; Molleda, J. Monitoring and control of energy consumption in buildings using WoT: A novel approach for smart retrofit. Sustain. Cities Soc. 2021, 65, 102637. [Google Scholar] [CrossRef]
- Thermal Environmental Conditions for Human Occupancy; ANSI/ASHRAE Standard 55-2010; American Society of Heating, Refrigerating and Air-Conditioning Engineers: Atlanta, GA, USA, 2010.
- Korea Energy Agency. Available online: https://www.energy.or.kr/web/kem_home_new/info/data/law.asp (accessed on 17 November 2021).
- Frontczak, M.; Wargocki, P. Literature survey on how different factors influence human comfort in indoor environments. Build. Environ. 2011, 46, 922–937. [Google Scholar] [CrossRef]
- Al Horr, Y.; Arif, M.; Katafygiotou, M.; Mazroei, A.; Kaushik, A.; Elsarrag, E. Impact of indoor environmental quality on occupant well-being and comfort: A review of the literature. Int. J. Sustain. Built Environ. 2016, 5, 1–11. [Google Scholar] [CrossRef]
- Coulby, G.; Clear, A.; Jones, O.; Godfrey, A. A Scoping Review of Technological Approaches to Environmental Monitoring. Int. J. Environ. Res. Public Health 2020, 17, 3995. [Google Scholar] [CrossRef]
- Shigaki, J.S.-I.; Yashiro, T. BIM and Automation of Building Operations in Japan: Observations on the State-of-the-Art in Research and Its Orientation. In International Conference on Computing in Civil and Building Engineering; Toledo Santos, E., Scheer, S., Eds.; Springer: Cham, Switzerland, 2021; Volume 98, pp. 879–894. [Google Scholar] [CrossRef]
- Plageras, A.P.; Psannis, K.E.; Stergiou, C.; Wang, H.; Gupta, B.B. Efficient IoT-based sensor BIG Data collection–processing and analysis in smart buildings. Future Gener. Comput. Syst. 2018, 82, 349–357. [Google Scholar] [CrossRef]
- Song, D.S.; Kim, J.W. Lot-based building system remote control technology. Mag. SAREK 2018, 47, 24–30. Available online: http://www.dbpia.co.kr/journal/articleDetail?nodeId=NODE07551863 (accessed on 17 November 2021).
- Li, W.; Logenthiran, T.; Phan, V.-T.; Woo, W.L. Implemented IoT-based self-learning home management system (SHMS) for Singapore. IEEE Internet Things J. 2018, 5, 2212–2219. [Google Scholar] [CrossRef]
- Ray, P.P. Internet of Things cloud enabled MISSENARD index measurement for indoor occupants. Measurement 2016, 92, 157–165. [Google Scholar] [CrossRef]
- Zhang, X.; Pipattanasomporn, M.; Chen, T.; Rahman, S. An IoT-based thermal model learning framework for smart buildings. IEEE Internet Things J. 2020, 7, 518–527. [Google Scholar] [CrossRef]
- Salamone, F.; Belussi, L.; Danza, L.; Ghellere, M.; Meroni, I. An open source “smart lamp” for the optimization of plant systems and thermal comfort of offices. Sensors 2016, 16, 338. [Google Scholar] [CrossRef] [Green Version]
- Zhang, W.; Hu, W.; Wen, Y. Thermal comfort modeling for smart buildings: A fine-grained deep learning approach. IEEE Internet Things J. 2019, 6, 2540–2549. [Google Scholar] [CrossRef]
- Yu, J.; Kim, M.; Bang, H.-C.; Bae, S.-H.; Kim, S.-J. IoT as a applications: Cloud-based building management systems for the Internet of Things. Multimed. Tools Appl. 2016, 75, 14583–14596. [Google Scholar] [CrossRef]
- Veselý, M.; Cieszczyk, A.; Zhao, Y.; Zeiler, W. Low Cost Infrared Array as a Thermal Comfort Sensor. In Proceedings of the CISBAT 2015 International Conference, Lausanne, Switzerland, 9–11 September 2015; Scartezzini, J.-L., Ed.; Ecole Polytechnique Fédérale de Lausanne (EPFL): Lausanne, Switzerland, 2015; Volume 1, pp. 393–398. [Google Scholar]
- Anand, P.; Singh, Y.; Selwal, A.; Singh, P.K.; Felseghi, R.A.; Raboaca, M.S. IoVT: Internet of Vulnerable Things? Threat Architecture, Attack Surfaces, and Vulnerabilities in Internet of Things and Its Applications towards Smart Grids. Energies 2020, 13, 4813. [Google Scholar] [CrossRef]
- Marques, G.; Saini, J.; Dutta, M.; Singh, P.K.; Hong, W.C. Indoor Air Quality Monitoring Systems for Enhanced Living Environments: A Review toward Sustainable Smart Cities. Sustainability 2020, 12, 4024. [Google Scholar] [CrossRef]
- Meng, Y.-B.; Li, T.-Y.; Liu, G.-H.; Xu, S.-J.; Ji, T. Real-time dynamic estimation of occupancy load and an air-conditioning predictive control method based on image information fusion. Build. Environ. 2020, 173, 106741. [Google Scholar] [CrossRef]
- Khan, S.; Rahmani, H.; Shah, S.A.A.; Bennamoun, M. A guide to convolutional neural networks for computer vision. Synth. Lect. Comput. Vcision 2018, 8, 1–207. [Google Scholar] [CrossRef]
- Cardinale, Y.; Blanco, E. Occupant activity detection in smart buildings: A review. Int. J. Wirel. Mob. Netw. 2020, 12, 81–104. [Google Scholar] [CrossRef]
- Naser, A.; Lotfi, A.; Zhong, J.; He, J. Heat-Map Based Occupancy Estimation Using Adaptive Boosting. In Proceedings of the 2020 IEEE International Conference on Fuzzy Systems (FUZZ-IEEE), Glasgow, UK, 19–24 July 2020; IEEE: Piscataway, NJ, USA, 2020; pp. 1–7. [Google Scholar] [CrossRef]
- Beltran, A.; Erickson, V.L.; Cerpa, A.E. ThermoSense: Occupancy Thermal Based Sensing for HVAC Control. In Proceedings of the 5th ACM Workshop on Embedded Systems For Energy-Efficient Buildings, Roma, Italy, 11–15 November 2013; Association for Computing Machinery (ACM): New York, NY, USA, 2013; pp. 1–8. [Google Scholar] [CrossRef]
- Steffan, J.; Fiege, L.; Cilia, M.; Buchmann, A. Towards Multi-Purpose Wireless Sensor Networks. In Proceedings of the 2005 Systems Communications (ICW’05, ICHSN’05, ICMCS’05, SENET’05), Montreal, QC, Canada, 14–17 August 2005; Dini, P., Lorenz, P., Soulhi, S., Cherkaoui, S., Mynbaev, D., Rodrigues, J.J., Hafid, A., Zepernick, H.-J., Zheng, J., Eds.; IEEE Computer Society: Los Alamitos, CA, USA, 2005; pp. 336–341. [Google Scholar] [CrossRef]
- del Cid, P.J.; Michiels, S.; Joosen, W.; Hughes, D. Middleware for Resource Sharing in Multi-Purpose Wireless Sensor Networks. In Proceedings of the 2010 IEEE International Conference on Networked Embedded Systems for Enterprise Applications, Suzhou, China, 25–26 November 2010; IEEE: Piscataway, NJ, USA, 2010; pp. 1–8. [Google Scholar] [CrossRef]
- Gubbi, J.; Buyya, R.; Marusic, S.; Palaniswami, M. Internet of Things (IoT): A vision, architectural elements, and future directions. Future Gener. Comput. Syst. 2013, 29, 1645–1660. [Google Scholar] [CrossRef] [Green Version]
- Persily, A.; de Jonge, L. Carbon dioxide generation rates for building occupants. Indoor Air 2017, 27, 868–879. [Google Scholar] [CrossRef] [PubMed]
- Patchava, V.; Kandala, H.B.; Babu, P.R. A Smart Home Automation Technique with Raspberry Pi Using IoT. In Proceedings of the 2015 International Conference on Smart Sensors and Systems (IC-SSS), Bangalore, India, 21–23 December 2015; IEEE: Piscataway, NJ, USA, 2015; pp. 1–4. [Google Scholar] [CrossRef]
- Nguyen, H.-Q.; Ton Thi, K.L.; Bui, D.M.; Huh, E.-N. Low Cost Real-Time System Monitoring Using Raspberry Pi. In Proceedings of the 2015 Seventh International Conference on Ubiquitous and Future Networks, Sapporo, Japan, 7–10 July 2015; pp. 857–859. [Google Scholar] [CrossRef]
- Gade, R.; Moeslund, T.B. Thermal cameras and applications: A survey. Mach. Vis. Appl. 2014, 25, 245–262. [Google Scholar] [CrossRef] [Green Version]
- Laussmann, D.; Helm, D. Air change measurements using tracer gases: Methods and results. Significance of air change for indoor air quality. In Chemistry, Emission Control, Radioactive Pollution and Indoor Air Quality; Mazzeo, N., Ed.; IntechOpen: London, UK, 2011; ISBN 978-953-51-5174-6. [Google Scholar] [CrossRef] [Green Version]
- Pei, G.; Rim, D.; Schiavon, S.; Vannucci, M. Effect of sensor position on the performance of CO2-based demand controlled ventilation. Energy Build. 2019, 202, 109358. [Google Scholar] [CrossRef] [Green Version]
- Raykov, Y.P.; Ozer, E.; Dasika, G.; Boukouvalas, A.; Little, M.A. Predicting Room Occupancy with a Single Passive Infrared (PIR) Sensor through Behavior Extraction. In Proceedings of the 2016 ACM International Joint Conference on Pervasive and Ubiquitous Computing, Heidelberg, Germany, 12–16 September 2016; Association for Computing Machinery (ACM): New York, NY, USA, 2016; pp. 1016–1027. [Google Scholar] [CrossRef] [Green Version]
- Bochkovskiy, A.; Wang, C.-Y.; Liao, H.-Y.M. YOLOv4: Optimal Speed and Accuracy of Object Detection. arXiv 2020, arXiv:2004.10934v1. [Google Scholar]
- Hajizadeh, R.; Farhang Dehghan, S.; Golbabaei, F.; Jafari, S.M.; Karajizadeh, M. Offering a model for estimating black globe temperature according to meteorological measurements. Meteorol. Appl. 2017, 24, 303–307. [Google Scholar] [CrossRef] [Green Version]
- Han, J.; Bae, J.; Jang, J.; Baek, J.; Leigh, S.-B. The derivation of cooling set-point temperature in an HVAC system, considering mean radiant temperature. Sustainability 2019, 11, 5417. [Google Scholar] [CrossRef] [Green Version]
- Derby, M.M.; Hamehkasi, M.; Eckels, S.; Hwang, G.M.; Jones, B.; Maghirang, R.; Shulan, D. Update of the scientific evidence for specifying lower limit relative humidity levels for comfort, health, and indoor environmental quality in occupied spaces (RP-1630). Sci. Technol. Built Environ. 2016, 23, 30–45. [Google Scholar] [CrossRef]
- Grün, G.; Trimmel, M.; Holm, A. Low humidity in the aircraft cabin environment and its impact on well-being—Results from a laboratory study. Build. Environ. 2012, 47, 23–31. [Google Scholar] [CrossRef]
- Tran, D.T.; Alleman, L.Y.; Coddeville, P.; Galloo, J.C. Indoor particle dynamics in schools: Determination of air exchange rate, size-resolved particle deposition rate and penetration factor in real-life conditions. Indoor Built Environ. 2017, 26, 1335–1350. [Google Scholar] [CrossRef]


Publisher’s Note: MDPI stays neutral with regard to jurisdictional claims in published maps and institutional affiliations. |
© 2022 by the authors. Licensee MDPI, Basel, Switzerland. This article is an open access article distributed under the terms and conditions of the Creative Commons Attribution (CC BY) license (https://creativecommons.org/licenses/by/4.0/).