1. Introduction
Modern power supply systems comprise a large number of measuring and control devices interacting with power elements (electricity transmission lines, transformers, motors, etc.), and they can be transformed into a class of cyber-physical systems. The concept of cyber-physical power supply systems (CPPSS) is based on deep integration of computing resources into physical processes [
1] and the use of intelligent algorithms in control devices of power elements.
The establishment and research of cyber-physical energy systems and power supply systems are the focus of a significant number of works. For example, ref. [
1] addresses the issues of CPPSS cybersecurity analysis. The authors of [
2] consider the concept of CPPSS to ensure stability. The CPPSS reliability assessment and analysis are discussed in [
3,
4]. In [
5,
6], modeling and various control methods of CPPSS are presented.
The CPPSS concept also implies the possibility of fast and reliable integration of DG plants operating near electricity consumers [
7,
8,
9]. These DG plants can rely on traditional [
10,
11] and renewable [
12,
13] energy sources.
The use of DG plants in CPPSS will help reduce the load of the supply network equipment and electricity transmission losses, as well as increase the reliability of power supply to consumers and the quality of electricity [
14,
15]. DG plants operating based on synchronous generators (SGs), for which an automatic voltage regulator (AVR) and an automatic speed regulator (ASR) of the rotor are used, are quite widespread. For the rapid integration of DG plants, it is necessary to solve the problem of adjusting these interconnected regulators using the proportional-integral-derivative (PID) control law [
16]. For this, intelligent technologies can be used, for example, genetic algorithms.
The work, ref. [
17], presents the implementation of PID controller tuning with such heuristic methods as the differential evolution and genetic algorithm. Researchers in [
16,
18] employ advanced genetic algorithms to tune PID controllers. The determination of optimal settings for automatic control systems involves identifying a dynamic object and calculating interrelated controller-tuning parameters that meet a given optimality criterion. At the same time, the obtained tuning of regulators with typical linear control laws, widely used in practice, may prove nonoptimal as a result of a change in the operating mode of the object. Therefore, it is necessary to determine the optimal settings of the controllers for all possible operating modes of a dynamic object, which is associated with labor-intensive calculations of a large number of interrelated parameters.
There is another approach, which is based on predictive algorithms [
19] ensuring the controller operation according to the calculated forecast of control error. Predictive control models are used in power electronics [
20,
21] and in the control of asynchronous [
22,
23] and synchronous [
24,
25] motors. The presented studies employ complex predictive models with a finite set of controls, which require microprocessor technology and complex calculations for implementation. At the same time, forecasting is quite easily implemented with a linear model using the two controlled variable values: the current one and the previous one. The comparison of various predictive control algorithms given in [
26] shows that linear algorithms can compete with the best nonlinear ones. A universal nonsearch method for tuning linear predictive PID controllers is presented in [
27]. Numerous studies have shown the advantages of using the linear predictive model in PID controllers. For example, in [
28], linear predictive PID controllers are effectively employed in a single-loop control system for a boiler superheater. In [
29], the advantages of a control system with a prediction module are shown and recommendations are given for choosing the optimal prediction time for controlling the thermal process. Greater efficiency is provided by linear predictive controllers used in the control of DG plants: gas turbine [
30], turbogenerator [
31], and hydrogenerator [
32]. The studies presented in these papers suggest that a linear predictive model used in AVRs and ASRs of DG plants can significantly improve the quality of control without laborious tuning of the controllers.
The use of a large number of DG plants with several units in CPPSS requires solving the problem of their group control to ensure an optimal load and takes into account the zones of undesirable work. For this, predictive regulators can also be used [
32]. However, numerous studies on complex computer models were required before the practical application of predictive algorithms. The purpose of the studies was to determine the effect of the predictive group voltage and frequency regulators proposed for DG plants on the operating modes of the power supply system. At the same time, the performance of predictive regulators was compared with conventional local AVRs and ASRs, as well as with a traditional group active power regulator. The studies were carried out in MATLAB on a model of an isolated power supply system (PSS) with gas turbine plants (GTPs) and an asynchronous electric motor. We also dealt with a model of a PSS with a small hydroelectric power plant (HPP) connected to a large electric power system (EPS).
Below is a description of the voltage and frequency regulation method for a group of small power-synchronous generators using predictive controllers. There is also a description of computer models of DG plants, the proposed group predictive controllers, and the traditional group active power controller. The computer simulation results are presented for various operating modes of the considered power supply systems.
2. Method of Group Voltage and Frequency Regulation of Synchronous Generators and Description of Computer Models of the Proposed Predictive Controllers
A forecasting algorithm used in typical regulators (for example, AVRs and ASRs) allows their tuning by one parameter—the forecast time. In this case, the linear predictive PID controller consists of two links connected in series: the PID controller itself and the linear predictive link.
The transfer function of the linear predictive link is represented in the following form [
26,
31]:
where
is a predictor time constant;
s is the Laplace operator.
To determine the time constants of the predictive links in AVRs and ASRs of an individual aggregate of the DG plant, we propose to use the frequency of natural oscillations of the rotor of one of the generators [
33,
34] (this rotor is assumed to be the main one):
where
is the SG voltage, p.u.; δ is an angle between the voltage and the EMF of the generator,
, el. degrees;
is an inductive resistance of the generator along the longitudinal axis, p.u.;
is a nominal angular frequency of rotation of the SG rotor, rad/s;
is an equivalent constant of mechanical inertia of the unit, s.
The time constants of the predictive links in AVRs and ASRs are determined by the value inversely proportional to
, i.e.,
.
Figure 1 shows the block diagram of the proposed system for regulating the voltage and frequency of DG plants using predictive AVRs and ASRs for an individual aggregate. The following transfer functions correspond to individual blocks:
WG is a transfer function of the SG;
WE is a transfer function of the exciter;
WT is a turbine transfer function;
WAVR is a transfer function of the AVR;
WASR is a transfer function of the ASR;
Wp is a predictive link transfer function.
The following variables are also present in
Figure 1:
Uz is a given SG voltage; Δ
U is a voltage deviation from the given value;
Uf is a voltage on the SG excitation winding; ω
z is a given value of the SG rotor speed; Δω is a deviation of the current value of frequency, ω, from the given value;
Pm is a mechanical power on the turbine shaft;
If is a current in the SG excitation winding. According to expression (2), the frequency,
fp, and the time constant of the predicting link,
Tp, depend on the load angle, δ, of the SG. When changing the operating mode, the control system proposed in
Figure 1 automatically calculates the prediction time and reconfigures the predictive links for the AVR and the ASR.
One of the generators in the group of similar aggregates of the DG plant can be taken as the main one, and the time constants of all predicting links can be determined by the load angle, δ, of this generator. The main generator method allows us to build a group predictive automatic speed regulator (GPASR) and a group predictive automatic voltage regulator (GPAVR) (
Figure 2).
Figure 2 shows a block diagram of the group regulation of the predictive AVR and ASR. The influence of the regulators on the SG is carried out through the predictive links,
and
, the time constants of which are calculated automatically and are corrected if the load mode changes. This process occurs simultaneously for all parallel generators in the group.
Local ASRs of generators (the
WASR block in
Figure 1 and
Figure 2) were modeled by regulators with PID control algorithms described by the following transfer function:
where
Kp,
Ki, and
Kd are adjusting coefficients of the ASR.
The diagram of the model for the predictive ASR that can automatically calculate and change the prediction time constant is shown in
Figure 3. The diagram consists of blocks that determine the gains and transfer functions of individual regulation channels: a PID regulator and a predictive link with an amplifier.
The model of the predictive AVR (the
WAVR block and the
Wp block connected in series in
Figure 1) also provides automatic calculation of time constants of the predictive links and can change them in different operating modes, depending on the load angle, δ, of the main generator. We propose installing the predictive links in the AVR separately in the voltage and frequency control channels. The diagram of the computer model of the proposed predictive AVR is shown in
Figure 4. It is supposed to install a linear predictive link, similar to the predictive ASR with automatic calculation and correction of the prediction time (
Figure 3), between the inputs and outputs indicated in
Figure 4 as dU_pd, Uf1 and dw_pd, Uf.
The predictive links in the GPASR and the GPAVR were taken into account separately for each generator, and the blocks for determining the prediction time had a common connection according to the load angle, δ, of the main generator. General diagrams of computer models of the proposed GPASR and GPAVR are shown in
Figure 5. A separate channel with a predictive link in the GPASR and the GPAVR is a series connection of an amplifier with a transfer function,
, and a linear predictive link with a transfer function determined by expression (1). This is implemented in the GPASR and the GPAVR diagrams as a parallel connection of the block,
, multiplied by the prediction time,
, and an amplifier block. The block parameters in the simulation were taken as follows:
;
s.
Thus, the impacts of the DG plants on the turbines are carried out through the predictive links built into the GPASR, the input signals of which are the output signals of the local ASR generators (PID1, PID2, PID3 in
Figure 5a) and the load angle, δ, of the main generator. The output signals of the GPAS (
Pm1,
Pm2,
Pm3) determine the mechanical power of the turbines of the DG plant aggregates. A distinctive feature of the GPAVR is that its predictive links are obtained built in the separate channels for regulating the AVR by voltage (inputs dU_PD1, dU_PD2, dU_PD3 and outputs Uf11, Uf12, Uf13 in
Figure 5b) and by frequency (inputs dw_PD1, dw_PD3, dw and the outputs Uf1, Uf2, Uf3 in
Figure 5b).
3. Description of the Computer Model of the Group Active Power Regulator
At the present time, large power plants exploit a microprocessor-based system for a group regulation of active and reactive power (GRARP), one of the subsystems of which is a group active power regulator (GAPR). A simplified block diagram of the simulated GAPR subsystem is shown in
Figure 6. The power setting for a group of aggregates in a normal plant layout is formed by a system of the following components (
Figure 6):
The scheduled setpoint, which is entered in accordance with the plant load schedule through the scheduled power setpoint device (SPSD).
The unscheduled power setpoint, which comes from the upper control system through the unscheduled power setpoint device (UPSD).
The manual power setting in which the setpoint change input can be supplied from the plant emergency control system.
Setting the power by the frequency regulator while taking into account the droop.
The output signal from the frequency regulator, taking into account the droop, is determined as follows:
where
is a frequency deviation, Hz;
is a droop (the range of the droop choice is from 4 to 10%);
is a unit power of an aggregate, MW;
is a number of aggregates.
The common power setpoint for a group of aggregates is defined as
where
is a scheduled power setpoint, MW;
is an unscheduled power setpoint, MW;
is a power when operating with a droop, MW;
is a manual setpoint, MW;
is an individual power of units operating outside the group, MW.
Among the aggregates connected to the GAPR, the power is distributed in the active load distribution control unit evenly, taking into account the border of the aggregates’ operation zones (
Figure 6). Further, the GAPR output signal is sent in the form of a setpoint to the turbine control mechanism (TCM) of the station aggregate.
A simplified diagram of the model for the described GAPR system built in MATLAB is shown in
Figure 7. All signals in the model are used in relative units. In this GAPR model, the load power across the aggregates is distributed evenly without taking into account the zones of undesirable operation. In simulation, the droop was taken as
S = 4%.
4. Results of Simulation for an Isolated PSS with a GTP
We simulated the work of an isolated PSS with three similar GTPs operating in parallel. The diagram of the isolated PSS model developed in MATLAB is shown in
Figure 8. In the isolated PSS, static active-inductive and asynchronous loads operated through electricity transmission lines (blocks ‘Line’ in
Figure 8), Line 1 and Line 2, with a length of 0.2 km and 1 km, respectively. The model provided for the introduction of a perturbation in the form of connecting an additional active-inductive load with a power of 1.944 +
j0.67 MVA, starting an asynchronous electric motor (AEM) with a power of 670 kW (AD 670 kW in
Figure 8), and three-phase short-circuit (SC) using the Three-Phase Fault block. The normal steady-state mode with the load of each generator at 37% was taken as the initial one.
The GTP uses models of two-shaft gas turbines (Gas Turbine blocks in
Figure 8). Its diagram is shown in
Figure 9 [
35]. The nominal power of the simulated gas turbines was 2.5 MVA. In the simulation, the following values of the transfer coefficients were taken, the coefficient of power amplification of the gas generator turbine,
Kt = 0.55 and the gear ratio of the reducer,
Kr = 5.56.
The SG exciter (Excitation System block in
Figure 8) was simulated by the following transfer function typical for a thyristor exciter [
34]:
.
The model of a three-phase synchronous machine from MATLAB’s SimPowerSystems package was used as the SG.
Table 1 presents the SG parameters (Synchronous Machine blocks in
Figure 8), as well as their regulators (ASR and Prognostic voltage regulator blocks in
Figure 8) used in the simulation.
The equivalent constant of mechanical inertia of the GTP (of the turbine and the generator) was Tje = 3.76 s.
In accordance with the given SG parameters, the time constants of the predictive links of the GPASR and the GPAVR were determined by the frequency of natural oscillations of the aggregator rotor using the expression .
The following normal and emergency modes of operation of the PSS were considered:
- (1)
start-up of AEM with a power of 670 kW;
- (2)
connection of an active-inductive load with a power of 1.944 + j0.67 MVA;
- (3)
consumers’ three-phase short circuit with a duration of 0.6 s.
It should be noted that for Modes 2 and 3 in the PSS, the AEM was already working. It is also required to emphasize that the adjusting of the AVR and ASR generators in all considered modes and ways of regulation did not change.
The simulation results for the startup of a powerful AEM in the form of time dependences for voltage, rotor speed, and load angle of the main SG are shown in
Figure 10, which compares the transient characteristics obtained for various systems that regulate the voltage and frequency of the GTP. The results show that the use of group regulation, when compared to local regulation, achieves the following effects: (i) the voltage transient time decreases by 1.5 s and the voltage overshoot decreases by 8% (
Figure 10a, Characteristics 1 and 3); (ii) the oscillatory speed of rotation of the SG rotor significantly decreases (
Figure 10b, Characteristics 1 and 3); (iii) the rotor speed transient time decreased by 4 s and the rotor speed overshoot decreased by 3% (
Figure 10b, Characteristics 1 and 3); (iv) the transient time and overshoot of the SG load angle are also reduced.
The use of predictive algorithms, even with local regulation of the GTPs, provide some additional effects: (i) the voltage transient time decreases by 2.5 s, and the voltage overshoot decreases by 30% (
Figure 10a, Characteristics 1 and 2); (ii) the rotor speed transient time decreases by 7 s and the rotor speed overshoot decreases by 3.4% (
Figure 10b, Characteristics 1 and 2); (iii) the load angle, δ, of the main generator changes more smoothly (
Figure 10c); (iv) the voltage drop during the start of the AEM is significantly reduced. It should be noted that the use of GPASR and the GPAVR, in comparison with local regulation that employs predictive AVRs and ASRs, produces a noticeable effect only in voltage regulation (
Figure 10a, Characteristics 2 and 4): overshoot decreases by 10%; voltage drop is reduced by 8%.
The simulation results for connecting an additional active-inductive load in the form of time dependences of the voltage and rotation speed of the rotor of the main generator are shown in
Figure 11. The use of the GAPR and conventional AVRs reduces the transient time by 5 s and helps avoid overshoot for the rotational speed of the generator rotor (
Figure 11b, Characteristics 1 and 3). The use of the GPASR and the GPAVR, in comparison with local regulation of the GTP by predictive AVRs and ASRs, reduces the maximum voltage drop by the factor of 1.75 (
Figure 11, Characteristics 2 and 4), and in comparison with local regulation of the GTP by conventional AVRs and ASRs—by the factor of 3.5 (
Figure 11a, Characteristics 1 and 4). Predictive algorithms in AVRs also make it possible to avoid voltage fluctuations in the considered mode (
Figure 11a). Local or group predictive regulation of voltage and frequency, in comparison with the use of conventional AVRs and ASRs, helps avoid oscillation and overshoot and provides a threefold decrease in the transient time of the rotor speed of the GTP’s main generator. Hence, the frequency in an isolated PSS also reduces by one third (
Figure 11b).
The use of the GPASR and the GPAVR, in comparison with the GAPR and conventional AVRs, also improves the quality indicators of the regulation process: overshoot is avoided, and voltage drop is reduced three-fold (
Figure 11a, Characteristics 3 and 4); the failure of the generator rotor speed decreases by a factor of 1.7 (
Figure 11b, Characteristics 3 and 4).
The simulation results for a three-phase short circuit with a duration of 0.6 s are shown in
Figure 12. The time dependences show that the use of predictive algorithms reduces the transient time, overshoot, and oscillation of the voltage and rotation speed of the SG rotor (
Figure 12a,b, Characteristics 1 and 2).
The use of the GAPR system, in comparison with local regulation by conventional AVRs and ASRs, allows us to achieve great effects in regulating the rotor speed of the main generator (
Figure 12b, Characteristics 1 and 3): the transient time is reduced by 6 s; the overshoot is reduced four times; oscillation is significantly reduced. The use of the GPASR and the GPAVR, in comparison with local regulation, somewhat reduces the voltage drop and reduces the voltage transient time. However, overvoltage is observed after the short-circuit shutdown (
Figure 12a, Characteristics 2 and 4).
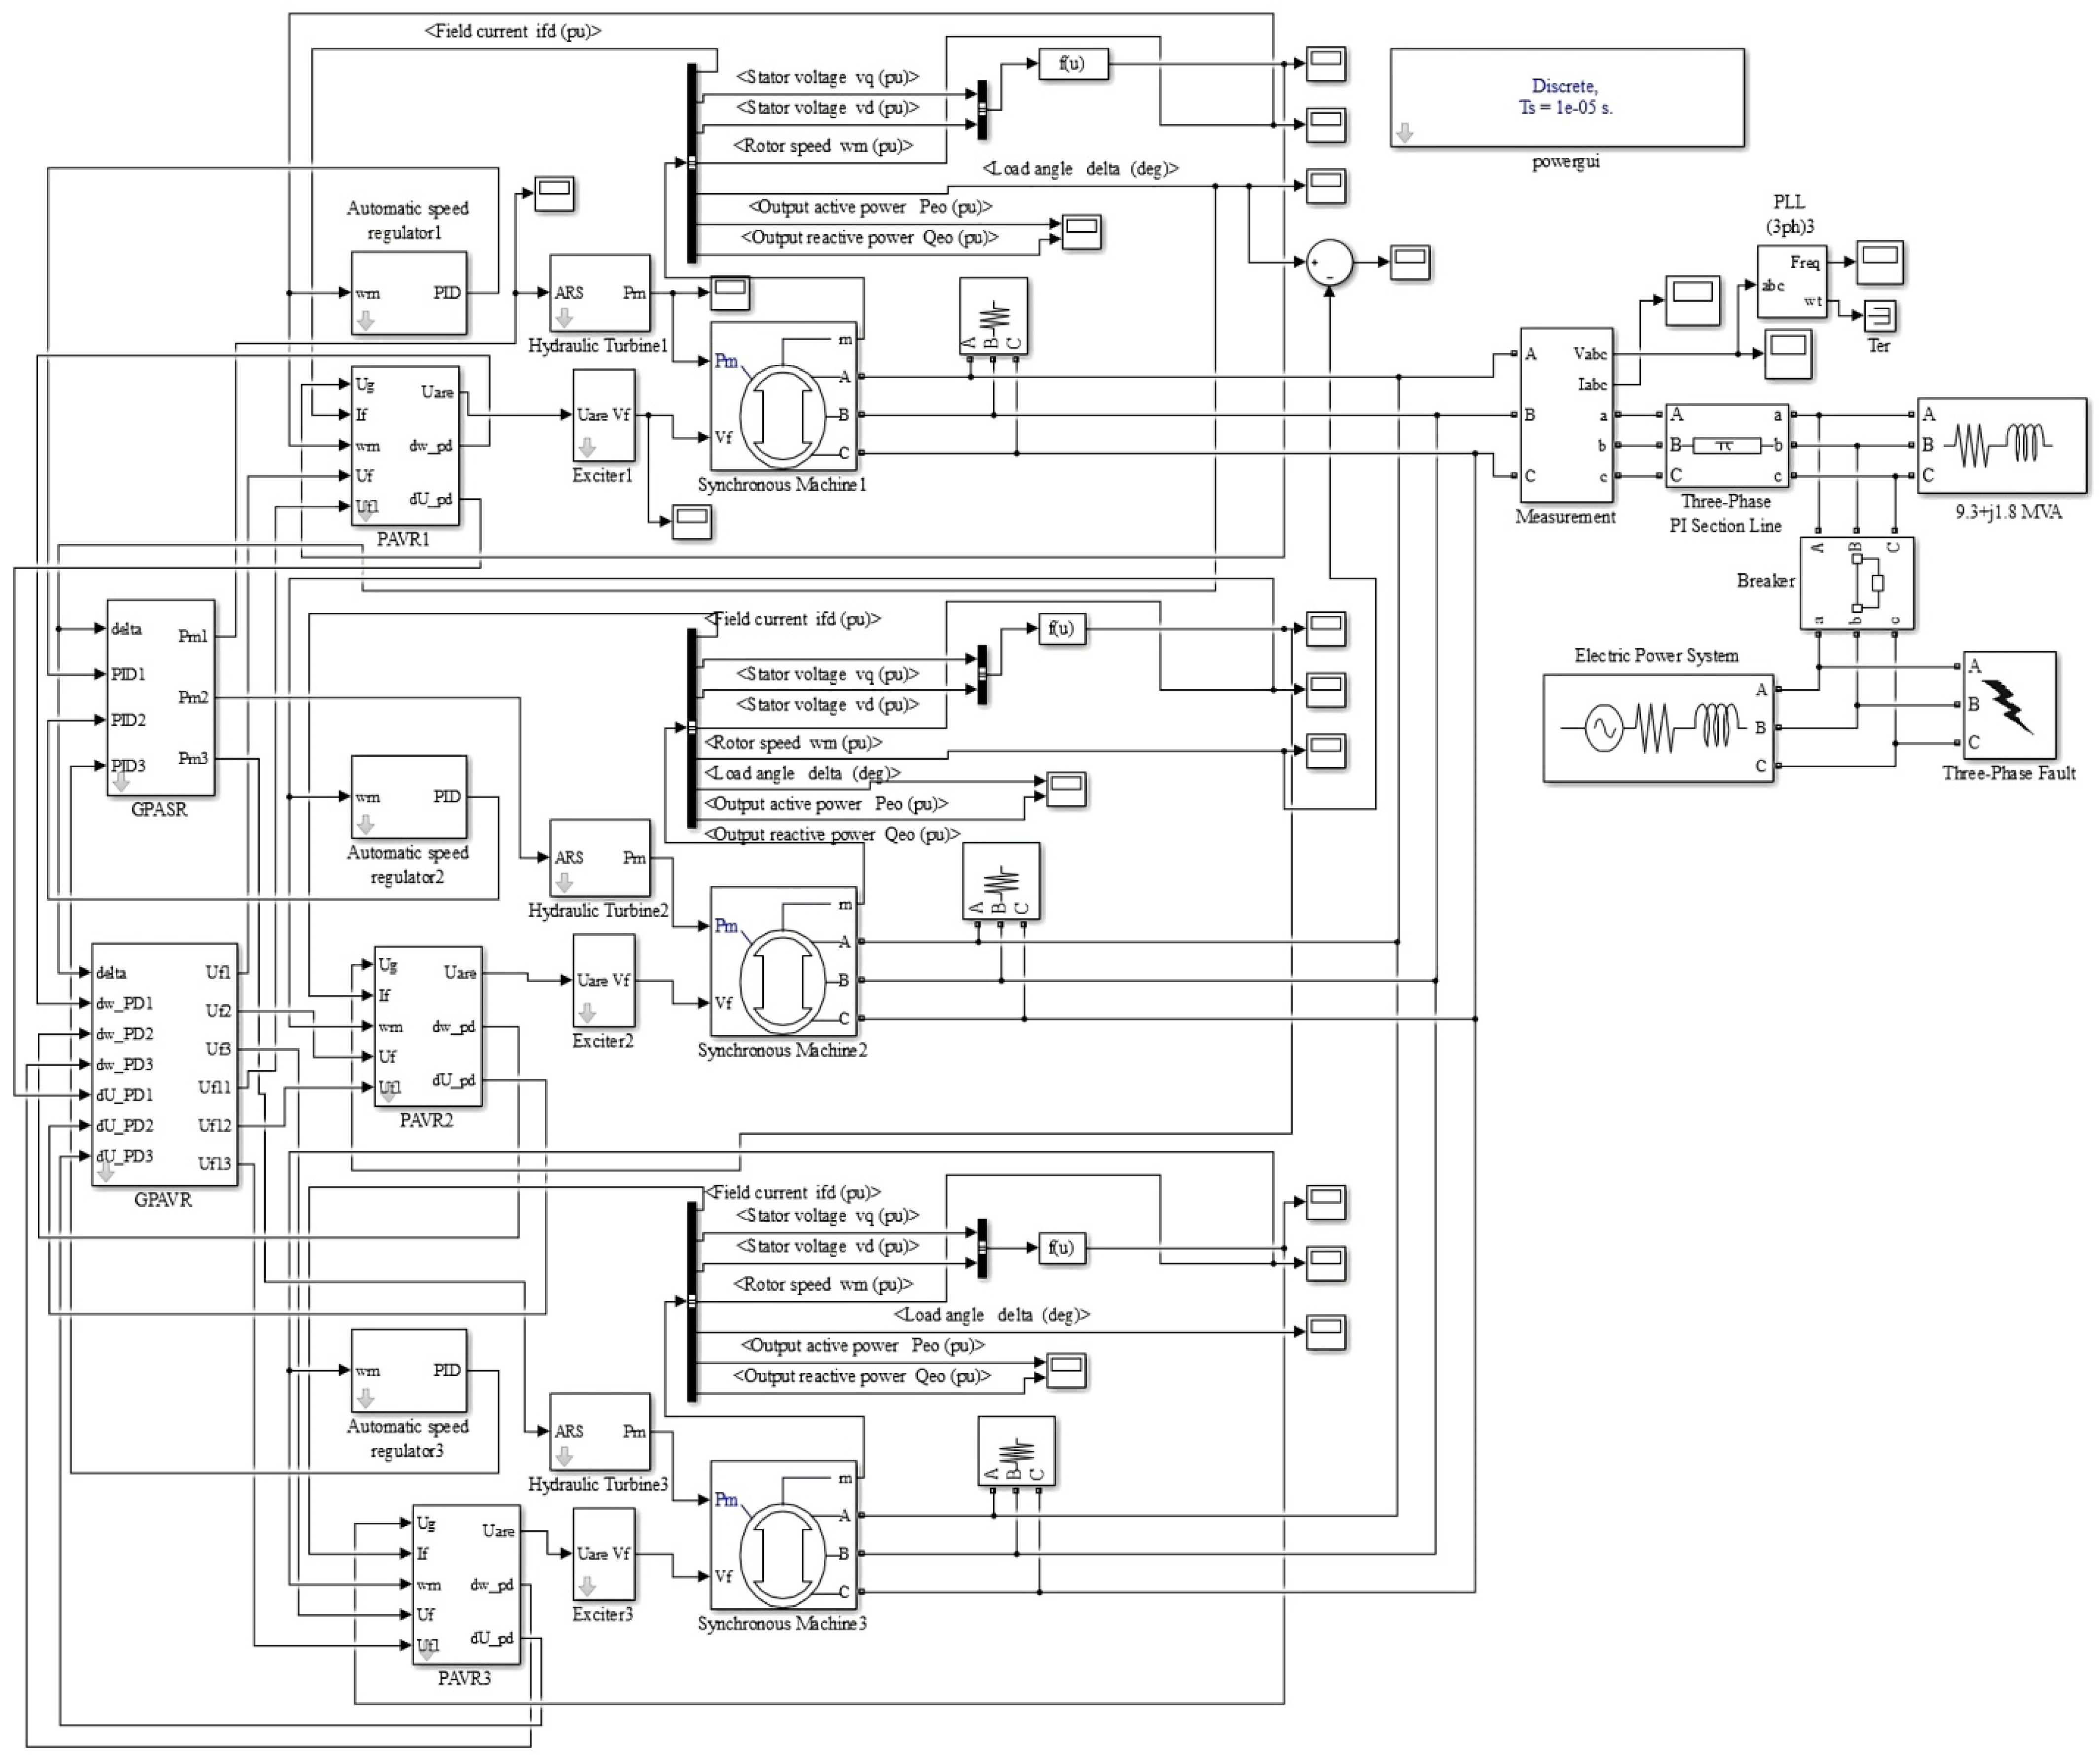
5. Simulation Results for a Power System with a Small-Scale Hydroelectric Power Plant
We carried out our studies on a computer model of the CPPSS, which comprises a small-scale hydroelectric power plant and is connected to a large EPS by a 6 kV overhead electricity transmission line (OETL) 5 km long. The model was built in MATLAB using the Simulink and SimPowerSystems packages, and its diagram is shown in
Figure 13, where we can introduce the following perturbations: disconnection from the EPS using the Breaker unit; short-time three-phase short circuit using the Three-Phase Fault block. The simulated small-scale HPP comprises three hydrogenerators with a capacity of 3.125 MVA each and a voltage of 6 kV. The load of 9.3 +
j1.8 MVA is powered at the receiving end of the OETL (
Figure 13).
The normal steady-state mode with a 50% loading of each hydrogenerator was taken as the initial one. The rest of the electricity to be received by power consumers was provided by the EPS.
The block diagram of the hydraulic turbine model with a main servomotor (Hydraulic Turbine blocks in
Figure 13) is shown in
Figure 14, which displays the corresponding transfer functions [
30].
We used the following values of the main parameters of the hydrogenerator: Xd = 2.84 p.u.; Eq = 1.1 p.u.; UG = 1 p.u.; Tje = 3.779 s. The adjustment coefficients of local regulators were taken as follows: Kp =7.55, Ki = 2, and Kd = 0.75 for the ASR; k0u = 100; k1u = 50; k1If = 1; k0w = 1.28; k1w = 0.73 for the AVR.
In accordance with the above parameters of the SG, the time constants of the predictive links of the GPASR and the GPAVR were determined by the frequency of natural oscillations of the aggregator’s rotor using the expression .
The simulation was performed for the following modes:
- (1)
disconnection from the EPS at the receiving end of the OETL;
- (2)
a 0.3 s three-phase shirt circuit at the receiving end of the OETL.
Based on the simulation results of these modes, we compared the following regulation parameters of the EPS mode: the load angles of generators, δ; the voltage on the barbuses of a small-scale HPP and the frequency of alternating current in the network when using conventional AVRs and ASRs without a predictive link with a standard setting; the GAPR system and conventional AVRs; predictive AVRs and ASRs; the GPASR and the GPAVR tuned to the resonant frequency of natural oscillations of the rotor of the main generator of a small-scale HPP. It should be noted that the adjustment of the AVR and ASR generators in all considered modes and methods of regulation did not change.
Figure 15 and
Figure 16 show the results of simulating disconnection of communication between the small-scale HPP and the EPS. The use of the GPASR and the GPAVR has a positive effect on control quality indicators in comparison with local regulation: the voltage and frequency drop in the network decreases (
Figure 15); the transient time for the network frequency decreases (
Figure 15b); there is no voltage overshoot on the barbuses of the small-scale HPP (
Figure 15a). In this case, the use of group regulation ensures elimination of fluctuations in the mutual load angle of the two generators (
Figure 16). This has a positive effect on intra-group movements, which contributes to an increase in the stability of the parallel operation of generators.
Therefore, the use of the GPASR and the GPAVR is highly effective in regulating the network voltage and frequency once the EPS is disconnected, and we do not have to address the issue of adjusting up local regulators.
Figure 17 and
Figure 18 show the time dependences of the parameters of the EPS mode under a three-phase short circuit with a duration of 0.3 s. The simulation results show that the use of the GPASR and the GPAVR improves control quality indicators in comparison with local regulation via conventional or predictive AVRs and ASRs: the voltage transient time and the voltage overshoot on the barbuses of the small-scale HPP are significantly reduced (
Figure 17a); the voltage fluctuation significantly decreases after the short circuit shutdown (
Figure 17a); the frequency transient time and overshoot in the network are significantly reduced (
Figure 17b); the network frequency oscillation decreases (
Figure 17b). The use of the GAPR, GPASR, and GPAVR under the short-term short-circuit ensures elimination of fluctuations in the mutual load angle of two generators of the small-scale HPP, which has a positive effect on the uniformity of aggregate loading and intra-group movement at the plant (
Figure 18). Group regulation via predictive AVRs and ASRs provides the following benefits over local regulation: the transient time of voltage and frequency decreases by 0.5 s after the short circuit shutdown (
Figure 17a,b, Characteristics 2 and 4); the voltage overshoot is reduced by 25% after the short circuit shutdown (
Figure 17a, Characteristics 2 and 4); the frequency overshoot decreases by 1% (
Figure 17b, Characteristics 2 and 4); the network frequency drop after the short circuit shutdown is reduced by a factor of 2.2 (
Figure 17b, Characteristics 2 and 4).
Therefore, the simulation results confirmed that using group predictive voltage and frequency regulators of DG plants is highly effective and improves the control quality of the EPS parameters in various operating modes.
6. Conclusions
The study has examined the possibility of using group voltage and frequency regulators that employ linear predictive links with automatically changing prediction time depending on the load angle, δ, of the synchronous generator in various distributed generation plants.
Summarizing the results of computer simulation, the following conclusions can be made:
The use of group predictive voltage and frequency regulators for gas turbine plants, compared to local regulation of conventional AVRs and ASRs and the traditional system of group active power regulators, can significantly improve the quality of control process in a start mode of a powerful electric motor, when an additional static load is connected and in the case of a short-term three-phase short circuit in an off-grid power supply system.
The use of group predictive voltage and frequency regulators for a small hydropower plant has a positive effect on the quality of control compared to local regulation of conventional or predictive AVRs and ASRs, as well as the traditional group active power regulators in the modes of disconnecting the tie line with the EPS and close short-term three-phase short circuit.
The use of a joint control of both conventional and predictive AVRs and ASRs makes it possible to exclude fluctuations in the mutual load angle of two generators of a small hydroelectric power plant in all modes at issue, which positively affects intragroup motions and increases the stability of the parallel operation of generators.
Thus, the proposed method for the formation and adjustment of group predictive voltage and frequency regulators, based on the determination of the resonant oscillation frequency of the rotor of the main generator, provides acceptable quality indicators of the control process while maintaining the previous settings of local regulators. This approach is applicable in voltage and frequency control in cyber-physical power supply systems with distributed generation plants.
Further research will aim to determine the effect of group predictive voltage and frequency regulators of synchronous generators in the power supply system with distributed generation plants with different mechanical inertia constants of the units. It is also necessary to further consider the operation of the proposed group predictive controllers, taking into account the undesirable operating parameters of the units.


