Article

Assessing the Energy Consumption and Driving Range of the QUIET Project Demonstrator Vehicle

1
Joint Research Centre, European Commission, 21027 Ispra, Italy
2
Honda R&D Europe GmbH, Carl-Legien-Str. 30, 63073 Offenbach, Germany
3
AVL Thermal and HVAC GmbH, 74076 Heilbronn, Germany
*
Author to whom correspondence should be addressed.
Energies 2022, 15(4), 1290; https://doi.org/10.3390/en15041290
Submission received: 7 December 2021 / Revised: 27 January 2022 / Accepted: 5 February 2022 / Published: 10 February 2022

Abstract

:
This article summarises the experimental testing campaign performed at the Joint Research Centre (JRC) on the demonstrator battery electric vehicle (BEV) of the European Union Horizon 2020 research project QUIET. The project, launched in October 2017, aimed at developing an improved and energy-efficient electric vehicle with increased driving range under real-world driving conditions, focusing on three areas: improved energy management, lightweight materials with enhanced thermal insulation properties, and improved safety and comfort. A heating, venting, and air conditioning (HVAC) system based on the refrigerant R290 (propane), a phase change material (PCM) thermal storage system, infrared heating panels in the near field of the passengers, lightweight materials for seat internal structures, and composite vehicle doors with a novel atomically precise manufacturing (APM) aluminium foam are all the breakthrough technologies installed on the QUIET demonstrator vehicle. All these innovative technologies allow the energetic request for cooling and heating the cabin of the demonstrator vehicle under different driving conditions and the weight of the vehicle components (e.g., doors, windshields, seats, heating, and air conditioning) to be reduced by about 28%, leading to an approximately 26% driving range increase under both hot (40 °C) and cold (−10 °C) weather conditions.

1. Introduction

The reduction of greenhouse gas (GHG) emissions will be one of the most important urgencies of 21st century, as stated by the Paris Agreement during COP21 [1] and the European Green Deal [2] aiming towards a 90% cut in European Union GHG emissions by 2050 [3,4]. The transport sector accounts for about one fourth of European Union GHG emissions and the EC White Paper ‘‘Roadmap to a Single European Transportation Area’’ [5] lists 10 goals to be reached in the next decades. They include the reduction of the percentage of conventional internal combustion engine (ICE) vehicles in urban transport to 50% by 2030, eliminating them in the cities by 2050, and covering 30% of freight road transport over 300 km to other modes (e.g., rail or waterborne transport) by 2030, to be increased to 50% by 2050. For light duty vehicles, one of the attractive long-term decarbonizing solutions seems to be represented by battery electric vehicles (BEVs) [6] and consumer acceptance is increasing significantly [7]. On this purpose, several literature studies are addressing the life-cycle assessment of electrified vehicles in relation to the different energy mix of worldwide countries [8,9,10,11]. The cleaner electric energy production will be in the future, by increasing the share of low global warming potential (GWP) solutions, the more benefits can be retrieved with the use of electrified vehicles.
However, BEVs are still not totally recognized by all users as a complete substitute to conventional ICE vehicles because of the intrinsic trade-offs, i.e., driving range limitations, recharging point availability, and charging times.
Differently from conventional ICE vehicles, in which the A/C compressor is driven as an engine accessory and wasted heat can be recovered for cabin conditioning, the energy consumption from the heating, venting, and conditioning (HVAC) system highly influences BEV driving range. This is particularly valid in low-temperature environments for BEVs using high-voltage positive thermal coefficient (HV-PTC) resistive heaters (5 kW or more) [12]. Since the coefficient of performance of HV-PTC heaters can have at most a value of 1, this can lead to the huge power demand for the HVAC system. With respect to the certified range, obtained in chassis dynamometer test cells with a controlled environment at 23 °C, the vehicle range can be reduced by up to 60% for low temperature conditions [13,14,15] and up to 10–15% in warm ambient conditions. This phenomenon has also been studied by the simulation tool (TEMA) developed by the Joint Research Centre (JRC) to support the assessment of low carbon road transport policies [16,17] in Europe.
The present work focuses on the outcomes of the QUIET project (QUalifying and Implementing a user‐centric designed and EfficienT electric vehicle), a European Union Horizon 2020 research project aiming at developing and implementing user-centric design solutions in electric vehicles for optimised energy efficiency in different environmental driving conditions [18]. Five different countries [19] represented by 13 multi-disciplinary and complementary partners from industry and research participated towards the QUIET project consortium. A Honda B-segment electric vehicle validator has been equipped with new technologies that are still not in mass production BEVs, which is designed and qualified to enable a reduction in energy needed for cooling and heating the cabin of an electric vehicle under different ambient driving conditions. This was achieved by exploiting the synergies of a technology portfolio in the areas of user-centric design with enhanced passenger comfort and safety Figure 1, AREA I), lightweight materials with enhanced thermal insulation properties (Figure 1, AREA II), and optimised vehicle energy management (Figure 1, AREA III). Presented here is a list of the breakthrough technologies enabling lowering of the energy consumption thanks to the weight reduction or the improvement of the efficiency of the HVAC system:
  • HVAC system based on the refrigerant R290 (propane);
  • Phase change material (PCM) thermal storage system;
  • Infrared heating panels in the near field of the passengers;
  • Redesigned seat internal structures using lightweight materials, such as aluminium and magnesium (15% weight reduction);
  • Glass or carbon fibre composite vehicle doors with a novel APM aluminium foam (20% weight reduction and NVH optimisation);
  • Human–machine interface (HMI) specialised on EVs for easy and efficient interaction with the thermal and energy management.
A weight saving of about 28% of vehicle components (e.g., doors, glazing, seats, HVAC) was achieved, resulting in a total 5% vehicle weight reduction.
For modern vehicles, the integration of each component in the overall system is becoming very important. The interconnections between powertrain, energy storage, power conversion and transmission, and HVAC system must be carefully exploited at early design stages, as evidenced by Wei et al. in [20], since it can allow benefits in efficiency and energy consumption, and, finally, reduce the total cost of ownership for each customer. QUIET project spent a lot of its effort on the development of these innovative technologies, but also on the overall integration into the demonstrator, developing optimised energy management strategies to control each component efficiently [21,22] and a dedicated human–machine interface (HMI) with a touchscreen monitor to easily interact with passengers (Figure 2).
Figure 1. Expected reduction in energy consumption and weight in each of the three areas of the QUIET project [18,19]. Image © The QUIET project [23].
Energies 15 01290 g001
The resulting demonstrator vehicle has been qualified in its improved energy performance by a test campaign performed at the Joint Research Centre (JRC) Vehicle Emission Laboratories (VeLA) in Ispra (Italy) [24]. Results of these tests are compared in terms of energy consumptions, driving range, and efficiency, with the characterisation testing performed on the baseline vehicle at the start of the QUIET project [14] to assess the overall energy performance improvements.

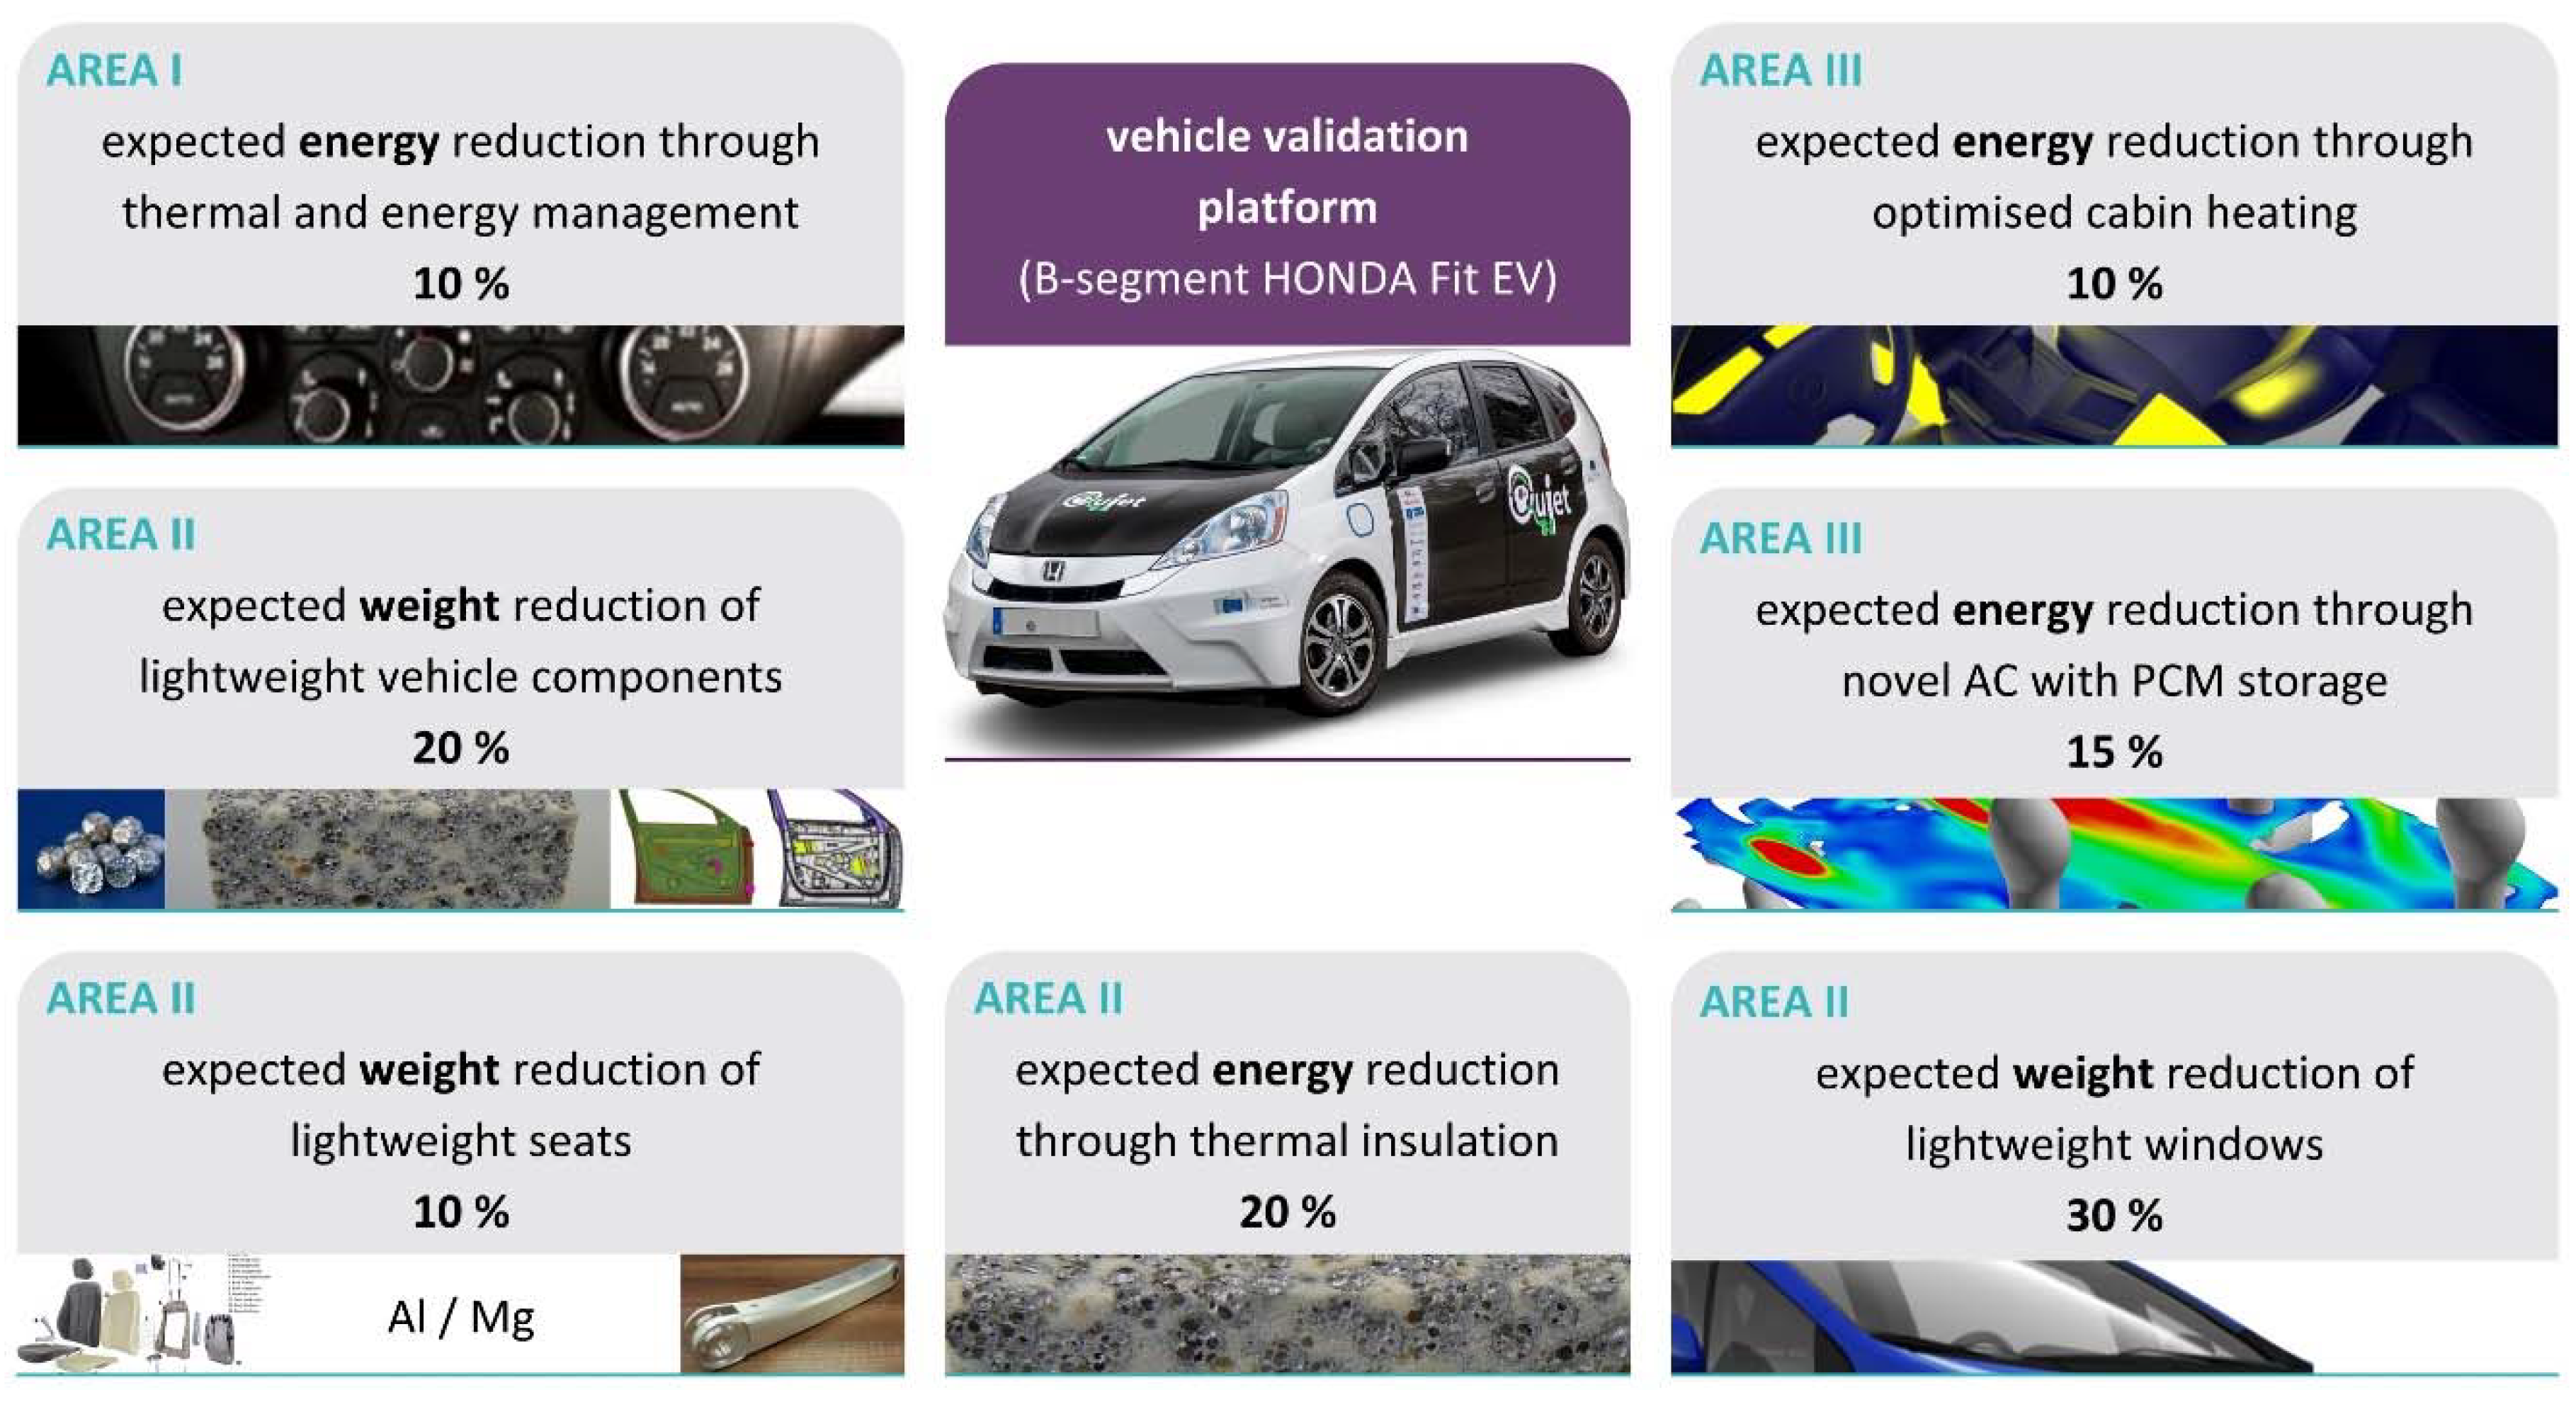
2. Overview of the Implemented Technologies

In the QUIET project, different innovative technologies were investigated and installed on the demonstrator vehicle, such as an innovative refrigerating fluid for cooling the vehicle cabin, together with an energy-saving heat pump operation for heating, advanced thermal storages based on phase change materials, power films for infrared (IR) radiative heating, and materials for improved thermal insulation of the passenger compartment.
  • Heat pump and propane
The demonstrator vehicle features a reversible refrigeration system used as a heat pump for heating in the winter and for cooling in the summer in the passenger cabin, still maintaining high energy efficiency to preserve the driving range [25]. A heat pump is an efficient way to utilise the available waste heat by different thermal sources and extract energy from the ambient environment, heating from a lower temperature level to a usable cabin-heating temperature level [26]. Moreover, the standard refrigerating fluid (R134a) is replaced by the propane R290. The possibility of replacing the standard refrigerating fluid (R134a) has been widely studied and validated by modelling and experimental studies in the literature. One of the most promising fluids to replace R134a seems to be the propane (R290) used as pure gas or blended with other HC species [27,28]. This HC-based gas has a low GWP and enables heat pump operation of the HVAC with higher cooling performances when compared with R134a due to the improved low-pressure level, especially at low ambient temperatures of −10 to −20 °C [25].
The refrigerant circuit developed for QUIET demonstrator is very compact to achieve a refrigerant charge less than 150 g of R290 (nontoxic HC gas) to meet the safety prescriptions for the installation of the system [25]. Furthermore, the distribution of the heat energy is performed via coolant-carrying secondary circuits, so that the fluid is exchanging heat with a water circuit, which, in turn, works with a condenser and an evaporator. As a result, the refrigerant-carrying components run decoupled from the cabin, so that the risk of influx of the flammable refrigerant into the vehicle cabin is completely avoided, or even a complete encapsulation of the refrigeration circuit is feasible and a great operational flexibility is allowed, since the water circuits are switchable to direct the heat flow to the point where it is needed for the respective operating point [25]. The compressor and the heater are directly connected to the high voltage system of the vehicle. The existing high voltage (HV) heater was kept in the system to complement in the transients and for very low temperatures.
  • Advanced Thermal Storage
An efficient way to condition the passenger compartment is not to waste heat or recover previously developed heat to be used for boosting the HVAC system performances, particularly in the transient operating modes. This promising method comes from building application [29,30] and is based on collecting of heat in suitable systems by means of phase change materials (PCM). Many sources of heat are available in BEVs, for example, solar heat loads or heat developed during battery charging. The collected heat can then be used for conditioning the vehicle cabin when the vehicle is started again. One way to implement the mentioned thermal storage can be the adoption of phase change materials (PCM) for storing wasted thermal energy [31,32]. Differently than for construction applications, in vehicles, a high loading/unloading power rate is required, which is challenging, as the PCMs exhibit low heat conductivities.
In the QUIET demonstrator vehicle, a prototype PCM-based thermal storage system developed by the Fraunhofer Institute for Manufacturing Technology and Advanced Materials (IFAM) was installed and tested as part of the improved performance of the HVAC system [33]. This PCM-based thermal storage system can deliver around 500 W of heat power for a period of 5 min (42 Wh minimum capacity). The maximum allowed storage size, including insulation, is 490 × 275 × 80 mm and the usable temperature range of the storage medium for these applications needs to be between 15 °C and 20 °C. The PCM was combined with aluminium foam, with strut-lamella geometries produced with a particular squeeze casting process; these were manufactured and their power output dependent on the fluid flow of the coolant system was compared during charging and discharging. This casting process of the aluminium structure ensures high efficiency, as well as the possibility to integrate in situ the heat transfer fluid pipes, allowing a good metal bonding and thermal contact. The developed PCM storage system shows good performances and fits the HVAC system requirements.
Through a modelling of the HVAC system of a BEV, allowing for several heat sources to be arbitrarily connected, Jeffs et al. analysed in [34] the potentialities and trade-offs of each different source (motor, transmission, battery, thermal storage, cabin exhaust). In particular, the motor, the thermal storage, and cabin exhaust recovery prove to be crucial for the best implementation of a heat pump system in BEVs. In fact, these components have no temperature-based efficiency trade-off, and so heat can be removed with little cost. From the study, it appears that a complex heat pump with multiple possible working modes that is properly tuned reduces total electrical energy consumption when operated over a range of temperatures. The ideal working condition of such a multivariable system should be dynamically optimised with the objective of tuning the best operational mode path for a set of scenarios. The target function should not only focus on the total electric energy expenditure, but would also involve a balance with a passenger comfort parameter and remaining driving range. As a further improvement with respect to an optimal control approach explored by Lahlou et al. in [35], a connected BEV, having set a defined road trip in the GPS navigation aid system and knowing the traffic level and the environmental conditions, could estimate in real time the energy needed for traction and the energy available for regulating the thermal comfort. This possibility was simulated by the author in [36] for different traffic and weather condition scenarios, and different initial battery states of charge.
  • Lightweight materials and infrared radiative heating
Further focus in QUIET project was on lightweight glasses and composites for windows and closures, as well as light metal aluminium or magnesium seat components [19]. Moreover, infrared heating panels were explored and were installed in the demonstrator vehicle to be used in the heating transient occurrences. From a comfort point of view, IR radiation heating allows a reduced air temperature at the same comfort level with respect to convective heating, hence allowing higher energy efficiencies.
  • User-centric design and optimisation
The optimised energy management strategies, such as preconditioning and zonal cooling/heating of the passenger cabin, and the user-centric designed cooling/heating modules further enhance the thermal performance of the vehicle. These strategies were implemented in a vehicle control unit enhanced by a novel human–machine interface (HMI), which, beyond being intuitive and user friendly, also considers diverse users’ needs, accounting for gender and ageing society aspects [19]. The evaluation of the impact of the adopted solutions for increasing the HVAC system’s effectiveness and energy efficiency has been studied through a new methodology based on enhanced thermal comfort and predicted mean vote (PMV), avoiding computational fluid dynamics (CFD), high computational costs, and/or time-consuming experimental investigations [37]. This innovative method is integrating the CFD models of the vehicle cabin within 1D thermal and comfort models, with the target of applying available synergies in thermal and comfort modelling. This method proves to be significant for the optimisation of the HVAC systems for BEVs and offers substantial computational time and effort savings. The methodology offers the capability to evaluate the performance of different scenarios and technologies implemented, which would otherwise need a large experimental campaign [19].
The QUIET project also made an estimate of the costs of some of its innovative components (i.e., advanced foam materials and new lightweight components, doors, and seats [38]) and investigated the possible impact of the QUIET approach applied to vehicles of different segments (i.e., B-SUV segment, C segment, D segment, and D-SUV segment) [18]. Each of these segments represents a popular BEV model currently on sale in Europe. The energy efficiency of the HVAC system is more relevant for smaller cars with a relatively low driving resistance in respect to larger cars, but they usually have space and price constraints limiting the adoption of advanced component solutions.
The overall aim of QUIET project was to decrease the energy needed for conditioning the cabin of the demonstrator vehicle under different driving conditions by at least 30% with respect to the values of the baseline vehicle, and to reduce the weight of vehicle components (e.g., doors, windshields, seats, heating, and air conditioning) by about 20%, leading to a minimum of 25% driving range increase under both hot (40 °C) and cold (−10 °C) environmental conditions. To verify the performance of the demonstrator vehicle in achieving these objectives, the reference values of the baseline vehicle were established as a starting point during the first phase of the project with a dedicated test campaign [14].

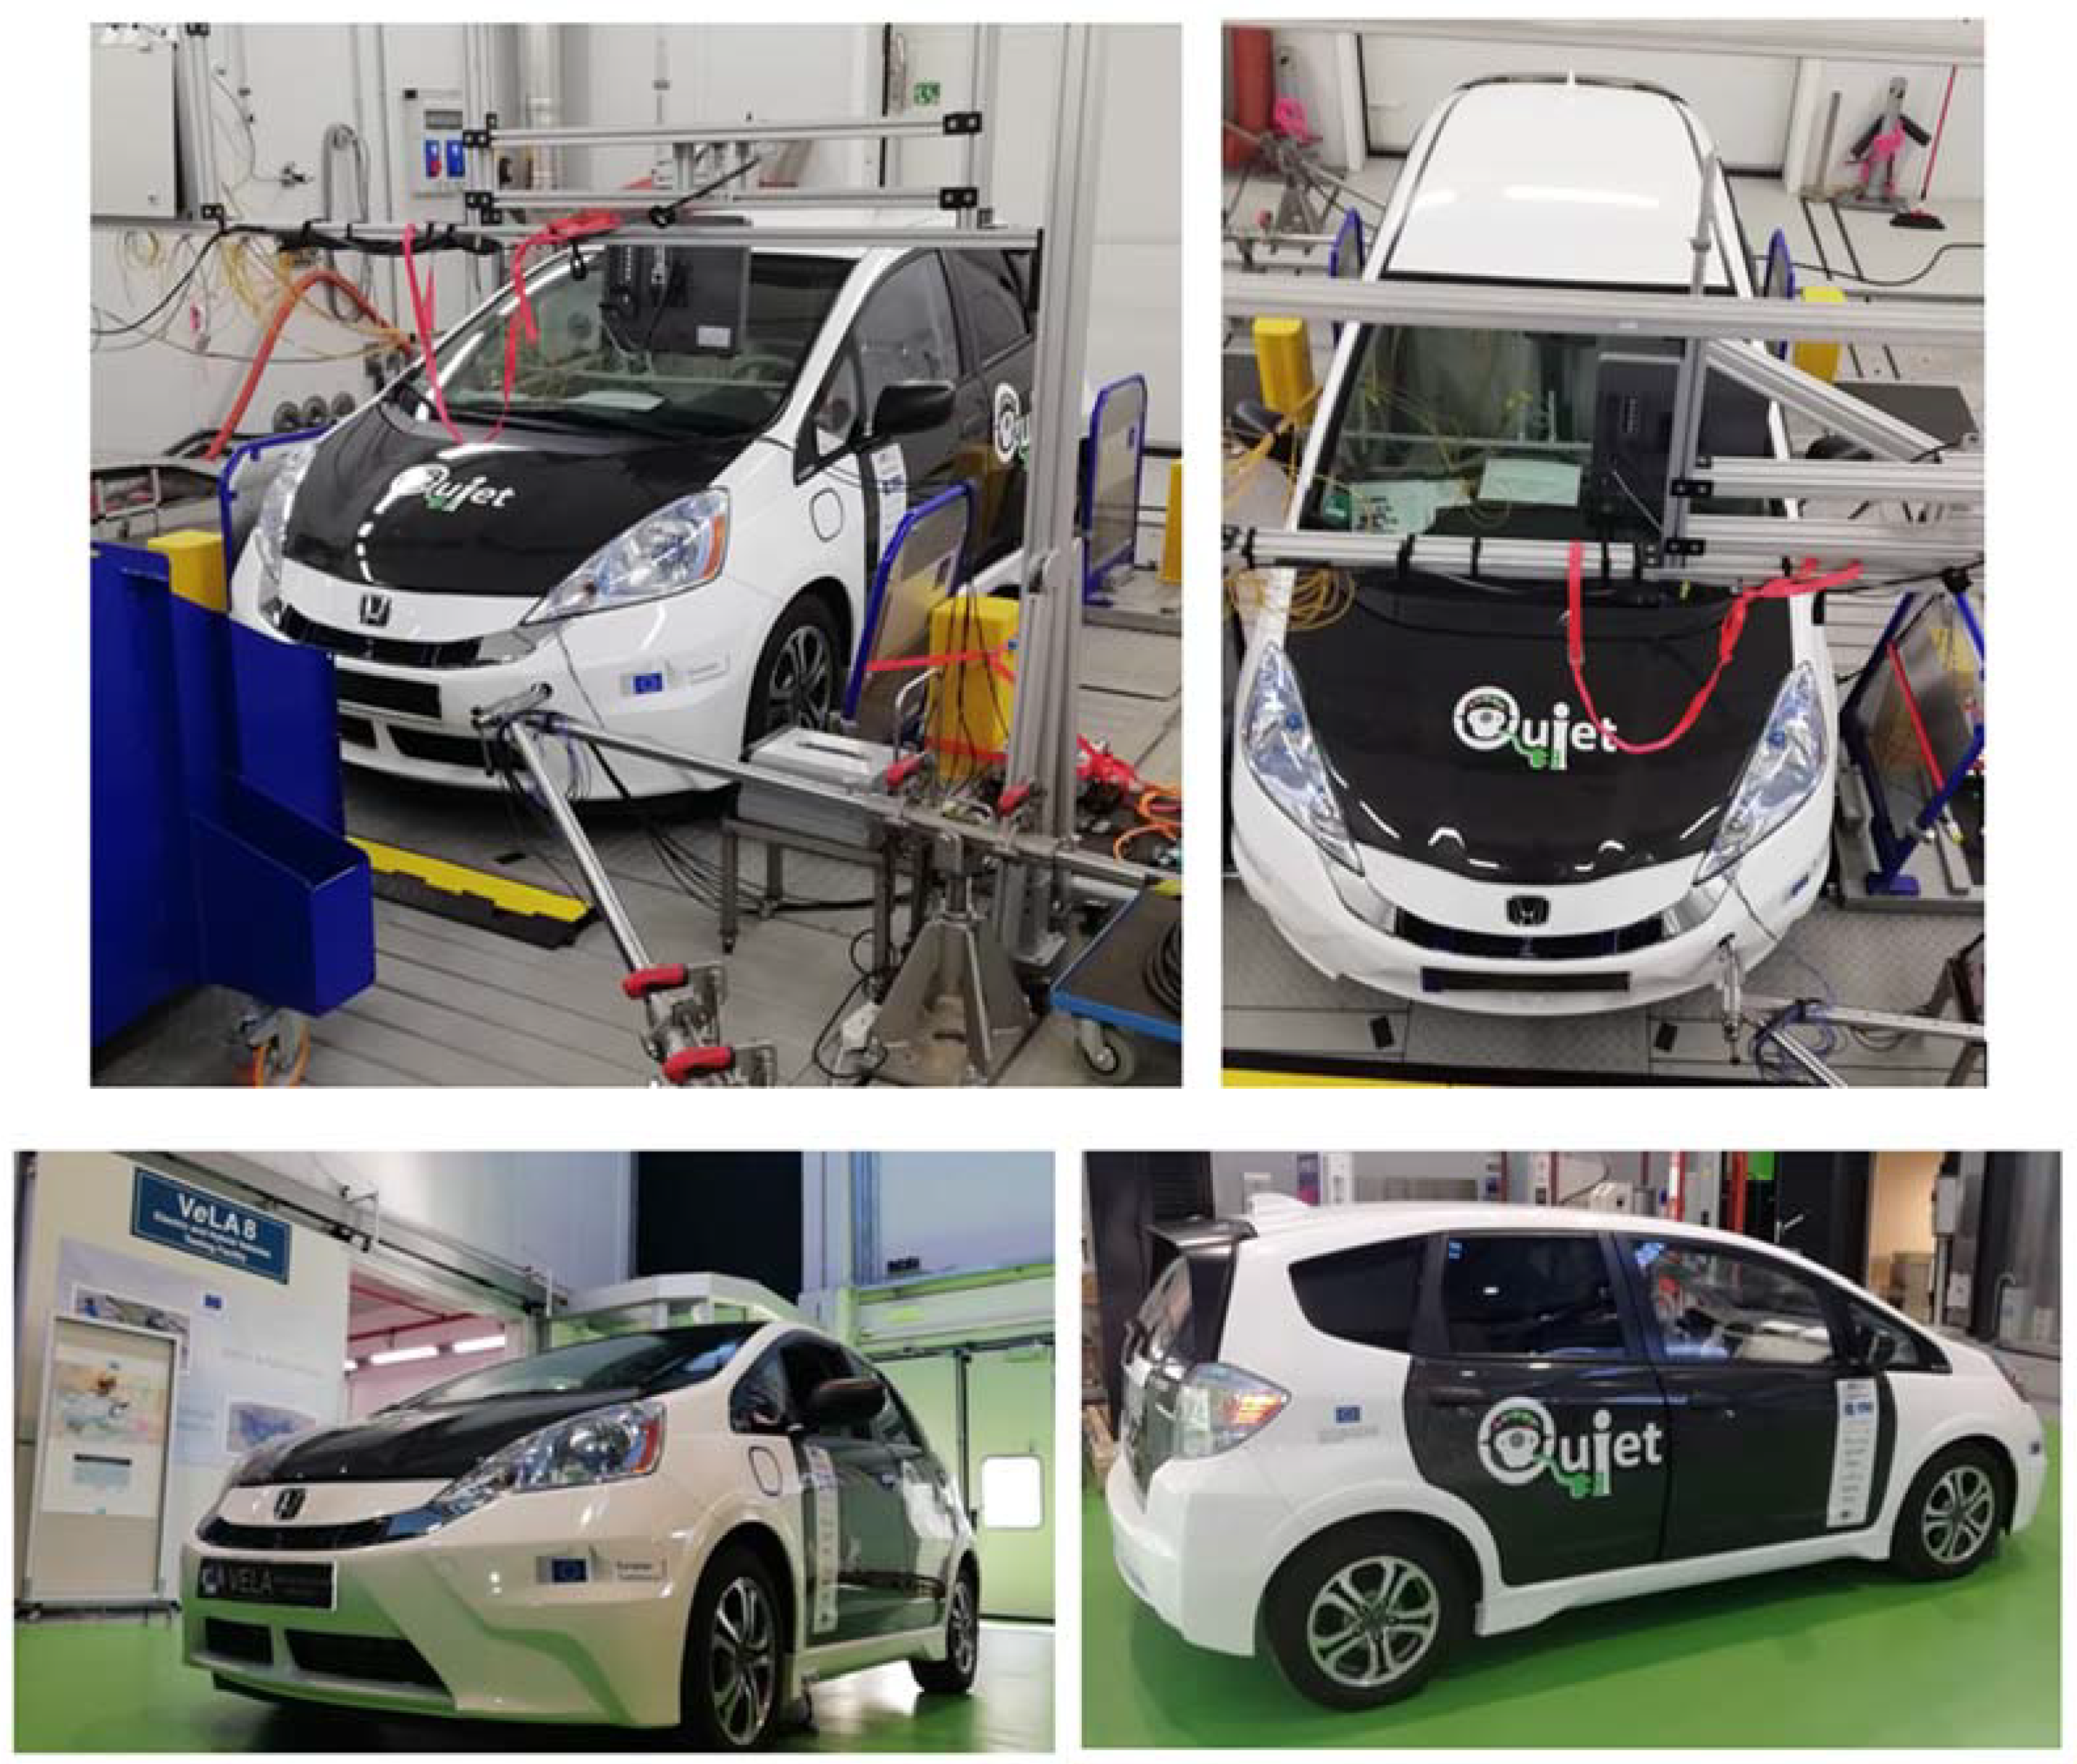
3. Experimental Set-Up

3.1. Test Vehicle and Laboratory

The QUIET baseline vehicle (HONDA B segment EV) was tested in 2018 at the JRC Vehicle Emission Laboratories (VeLA) in Ispra (Italy) [14]. A new test campaign took place in March and April 2021 to test the resulting improvements in energy consumption, driving range, and energy efficiencies after the design, development, and integration of the mentioned innovative technologies in the demonstrator vehicle.
The tests were performed in VeLA-8 facility, which features a 4 × 4 chassis dynamometer (independent roller benches) with a nominal power per axle of 300 kW that can achieve full road simulation up to 260 km/h and accelerations up to 10 m/s2. The inertia range varies from 250 up to 4500 kg, while the wheelbase can be modified according to the vehicle from 1800 mm up to 4600 mm. The laboratory is suitable for passenger vehicles and light-duty trucks testing, both for a conventional fuel engine, and full-electric and hybrid vehicles. It features all the relevant technologies to reproduce the same conditions as those occurring on the road, and measurement systems to acquire related variables:
  • Vehicle-speed coupled blower;
  • Driver’s aid system with a data logger for real-time acquisition of signals;
  • Precision power analyser used for the electrical components;
  • Flow controlling devices;
  • Emission measurement system for gases, PM, and PN (raw and diluted emission).
Environmental conditions can be set through a powerful climatization system, allowing the control of ambient temperature from −30 °C to 50 °C and of humidity. The VeLA-8 emissions measurement system is also customised to allow reliable hybrid vehicle testing during the phases when the combustion engine is switched off. A description of the testing facility is reported in [15,39].
Figure 3 shows the demonstrator vehicle in the JRC testing facility and some details of the vehicle installation on the chassis dynamometer. The tested vehicle is a 2013-year model with a total of 69,733 kilometres before starting the tests. The vehicle’s main characteristics are summarised in Table 1. It is a 5-seat vehicle, powered by a synchronous electric motor rated at 75 kW maximum power and 256 Nm maximum torque in front-wheel driving mode. The vehicle features a 432-cell lithium-ion battery (lithium titanium oxide anode), accounting for a 20 kWh nominal capacity and approximately 331 V nominal voltage [40]. The temperatures of the powertrain components are controlled by a water-cooling system, while the battery pack only has an air-cooling system, which, in normal operation, works on the natural airflow around the battery modules and is helped, if necessary, by the activation at low speed and high temperature of two battery fans. The location of the air outlets inside the vehicle is shown in Figure 4 [41].
The conventional HVAC system of the baseline vehicle was modified to a heat pump system operated with propane (R290) as the working fluid, as explained above. The actual vehicle test mass was 1540 kg, including additional tools and monitoring equipment, of which 856.5 kg was on the front axle and 683 kg on the rear axle. Despite the weight reduction of 28% of vehicle components (e.g., doors, windshields, seats, heating, and air conditioning), there is a total weight reduction of 5% at the vehicle level because of the additional components and monitoring systems installed on the vehicle.

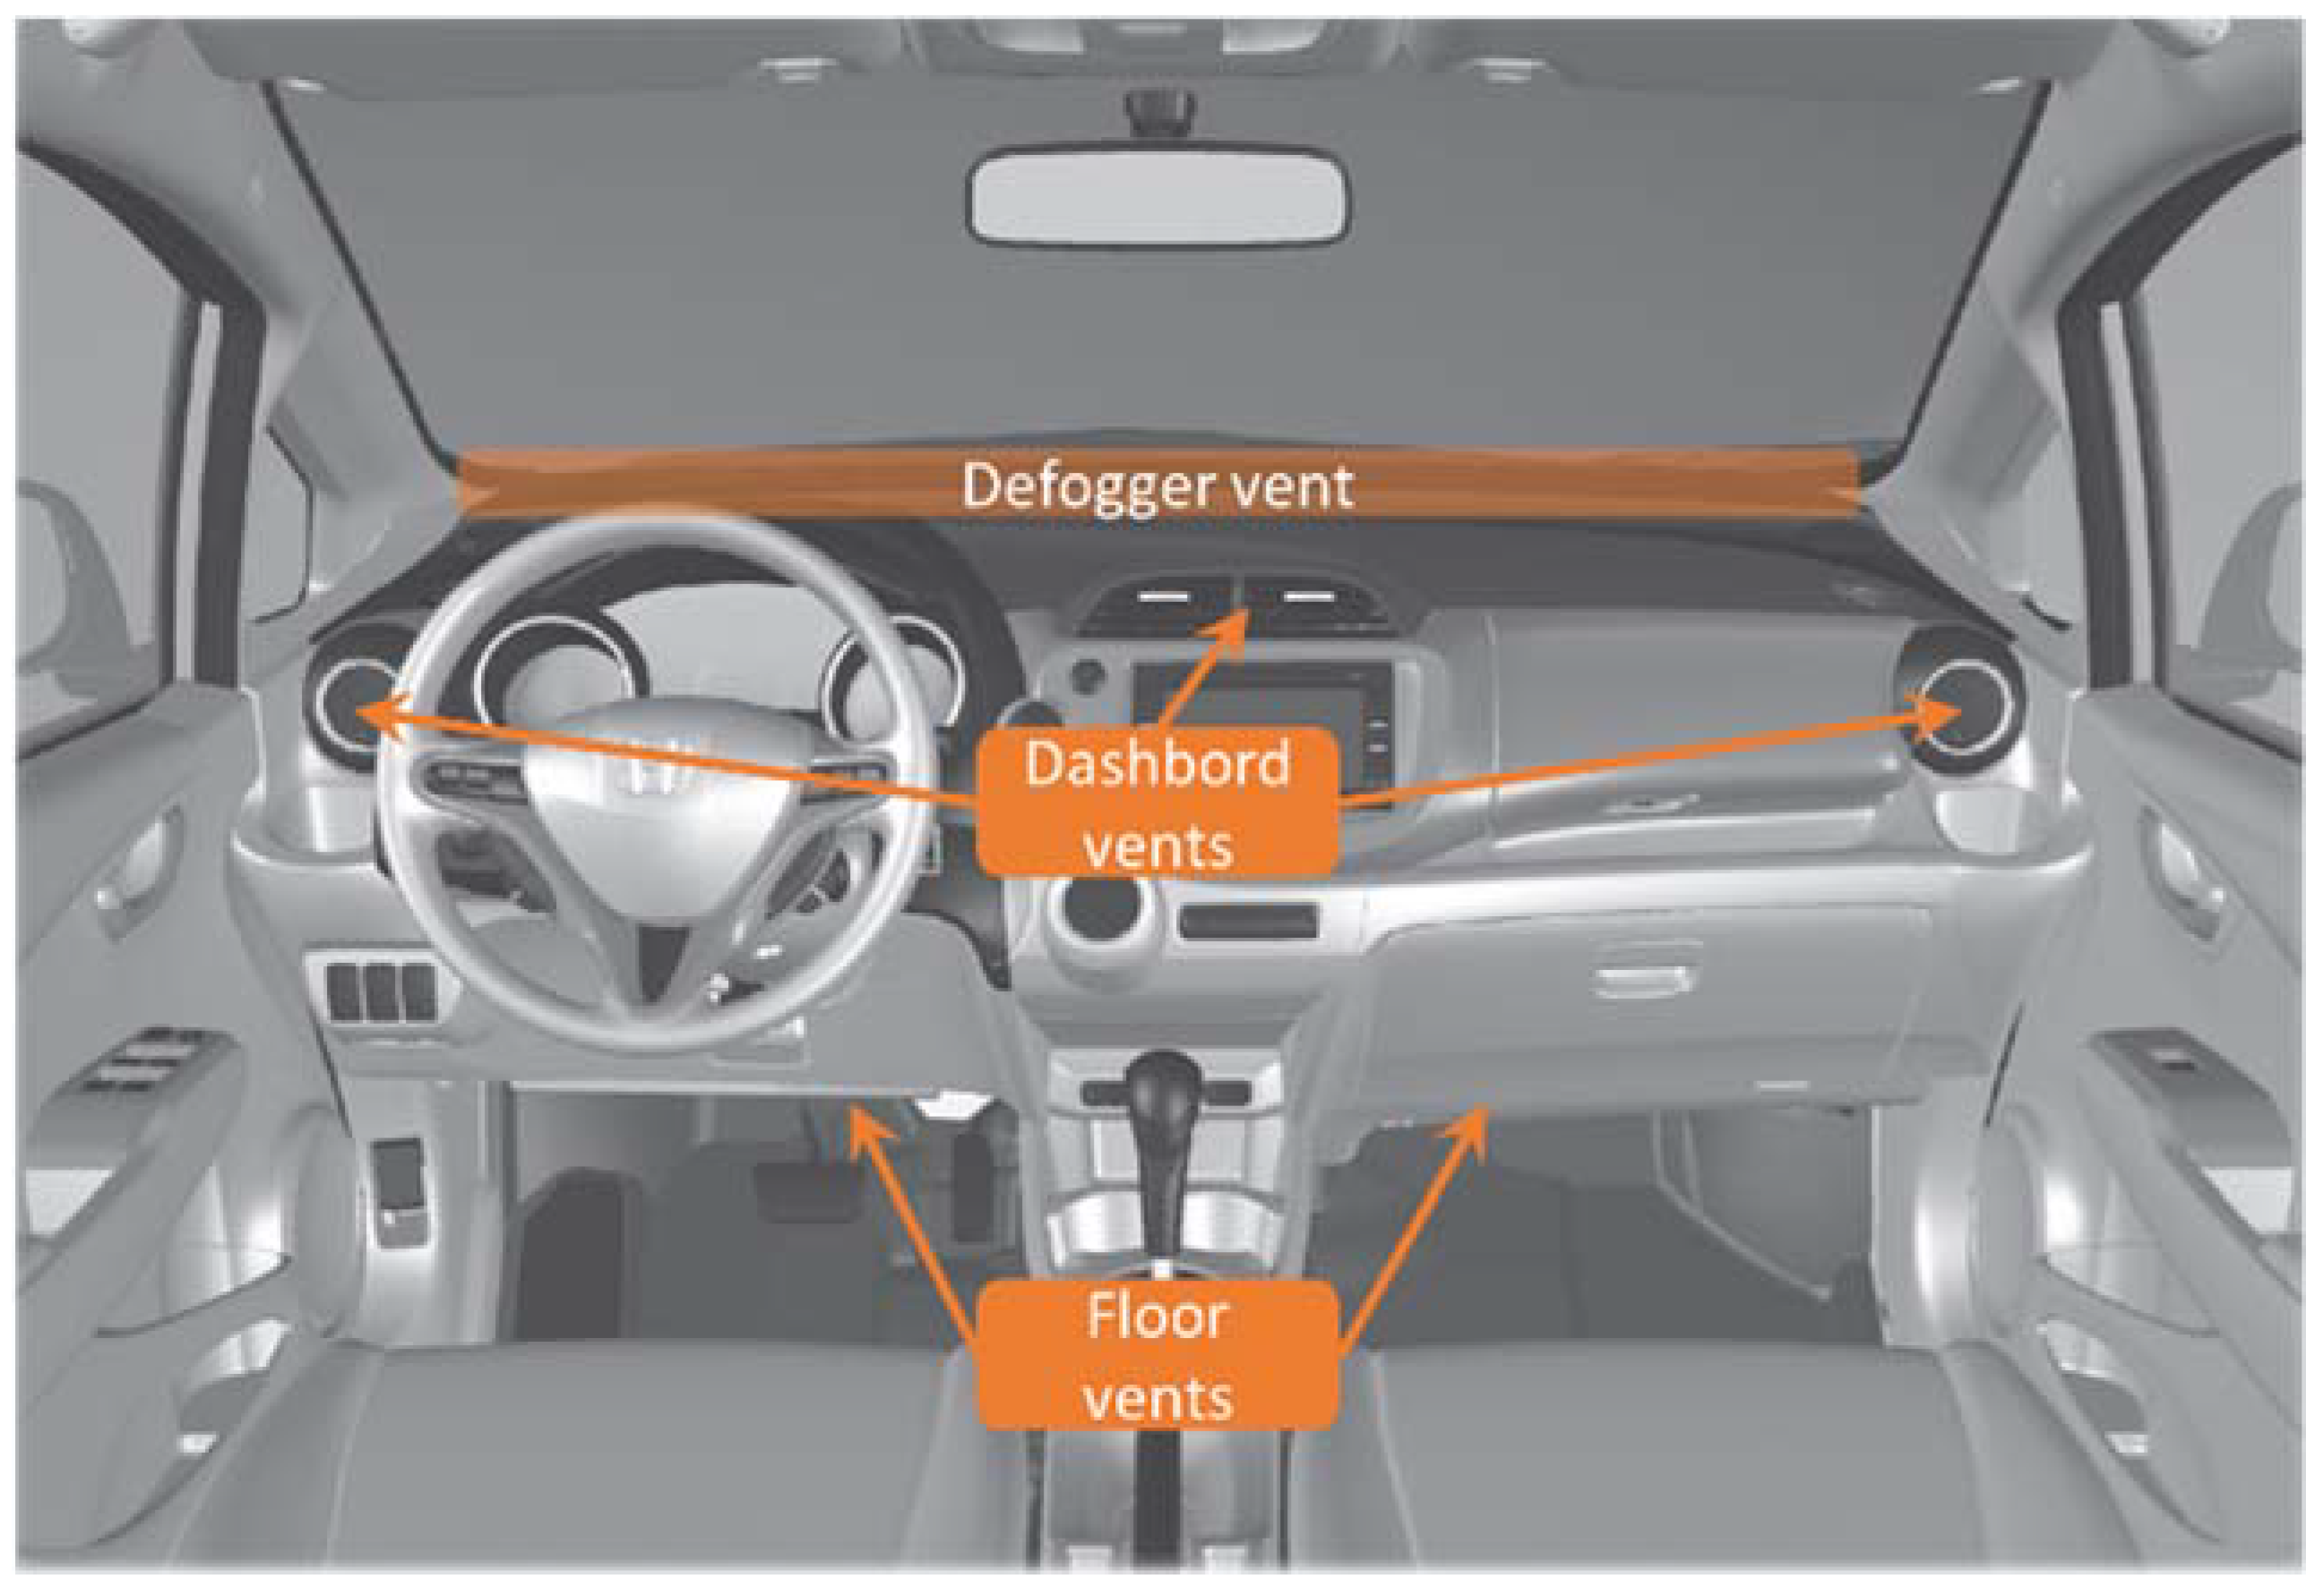
3.2. Measurement Points

During testing, the energy flows were monitored at different locations within the vehicle to derive the consumptions and the efficiencies. A comprehensive description of the measurement locations can be found in the schematic representation in Figure 5 and Table 2.
The measurement at M1 is acquired directly on the 6.6 kW AC recharging station, i.e., the electric energy required to recharge the battery. The measurement at M2 is acquired both via the vehicle CANbus and via a current clamp directly mounted on the battery output power-line and voltage measurement from the CANbus. The measurement at M4 is acquired from the dynamometer; at M5, only via CANbus, as at M3; whereas, at M6, it is acquired both via the vehicle CANbus and via a current clamp and voltage measurement from the CANbus. The 12 V battery was also monitored via a current clamp and voltage measurement. The data were either stored on the internal memory of the power analyser or acquired in real time by the laboratory data logger.
Additionally, the cabin compartment has been instrumented with temperature sensors to monitor the performance of the HVAC system following the European MAC test procedure [42], and a dummy passenger is installed with thermocouples fitted in specific body locations to test the modified HVAC system from the thermal comfort perspective (Figure 6).
The results from both the CAN current and CAN voltage measurements (Case 1) and from the AC/DC clamps for current and CAN voltage measurements (Case 2) will be presented in this publication.

3.3. Test Driving Cycles

The following driving cycles were applied during the testing of the demonstrator vehicle for measuring the energy consumptions, as depicted in Figure 7:
  • The Worldwide harmonized Light-duty Test Cycle (WLTC) [43,44];
  • The Mobile Air Conditioning (MAC) [42];
  • The Worldwide harmonized Light-duty Shorten Test Procedure (WLTP STP) [43,44].
The results of the Worldwide harmonized Light-duty Test Procedure (WLTP) and the MAC tests will be reported.
The WLTC is the European homologation driving cycle for the light-duty vehicles (LDVs) [43,44]. It was created to reflect the real-world vehicle operations more closely than the previous NEDC cycle. The WLTC is composed of 4 phases, designed to represent the urban, the rural, the extra-urban, and the highway conditions, respectively. Stated here are some details on the phases’ duration and length (Figure 7): low speed (589 s and 3.09 km), medium speed (433 s and 4.76 km), high speed (455 s and 7.16 km), and extra-high speed (323 s and 8.25 km). To test the BEV driving ranges, the consecutive cycle test (CCT) procedure is applied, in which, starting with fully charged battery, the WLTC is repeated up to when the break-off criterion is reached, which, for BEVs, represents a battery fully depleting. This occurs when the trace on the driver’s aid cannot be followed anymore by the driver; the driving shall be interrupted and the vehicle brought to standstill. During the demonstrator vehicle tests, the CCT procedure was applied at different ambient temperatures (23 °C, −10 °C, and 40 °C) without and with the HVAC system in operation to analyse how driving range and distance-specific energy consumption change in the different conditions.
To analyse the impact on the energy consumption of the HVAC system, the MAC testing procedure has been applied [42]. The MAC cycle is composed of 3 phases of constant speed segments: the 1st one is a preconditioning phase in which the HVAC system is ON and the vehicle is driven at constant speed-up to reach the stabilisation of the temperature in the passenger compartment; the 2nd and 3rd phases are identical in constant speed values, but with, respectively, the HVAC system switched on and off as a means of comparison in the total vehicle energy consumption. Phase 1 consists of a constant speed segment (90 km/h) with approximately 30 min duration, while phases 2 and 3 have an approximately 16 min duration each, spent half at a constant speed of 50 km/h and half at 100 km/h (Figure 7). The MAC procedure prescribes a cell temperature of 25 °C, and a target temperature for the cabin to be reached by the HVAC system of the vehicle set below 15 °C in a specific location between the driven and the passenger seat. The minimum HVAC system mass flow rate should be 230 kg/h, monitoring the passenger compartment temperature in seven control locations: four positioned on the dashboard and three at the rear of the front seats—behind the heads of the driver and of the passenger and in the midpoint between the seats (Figure 6).
A modified version of the MAC test procedure has also been applied at −10 °C, with the HVAC system in heating mode, and with the phase 1 reduced to 15 min driving plus 15 min in idle (keeping the HVAC system switched on) to ensure enough battery capacity to perform phases 2 and 3, as shown in Figure 7. The WLTP STP for pure electric vehicle driving range determination [43,44] has also been applied to collect more data on the vehicle performance. The STP consists of two dynamic segments (DS1 and DS2), together with two constant speed segments (CSSM and CSSE) ( Figure 7). The dynamic segments DS1 and DS2 are necessary to calculate the energy consumption of the considered phase. The constant speed segments CSSM and CSSE are meant to diminish the test duration by discharging the battery in a faster way than with the CCT procedure. The test cycle is designed based on the vehicle characteristics.
Table 3 summarises the tests performed on the demonstrator vehicle. The vehicle is recharged after each driving range test using the 6.6 kW on-board AC charger.

4. Results and Discussion

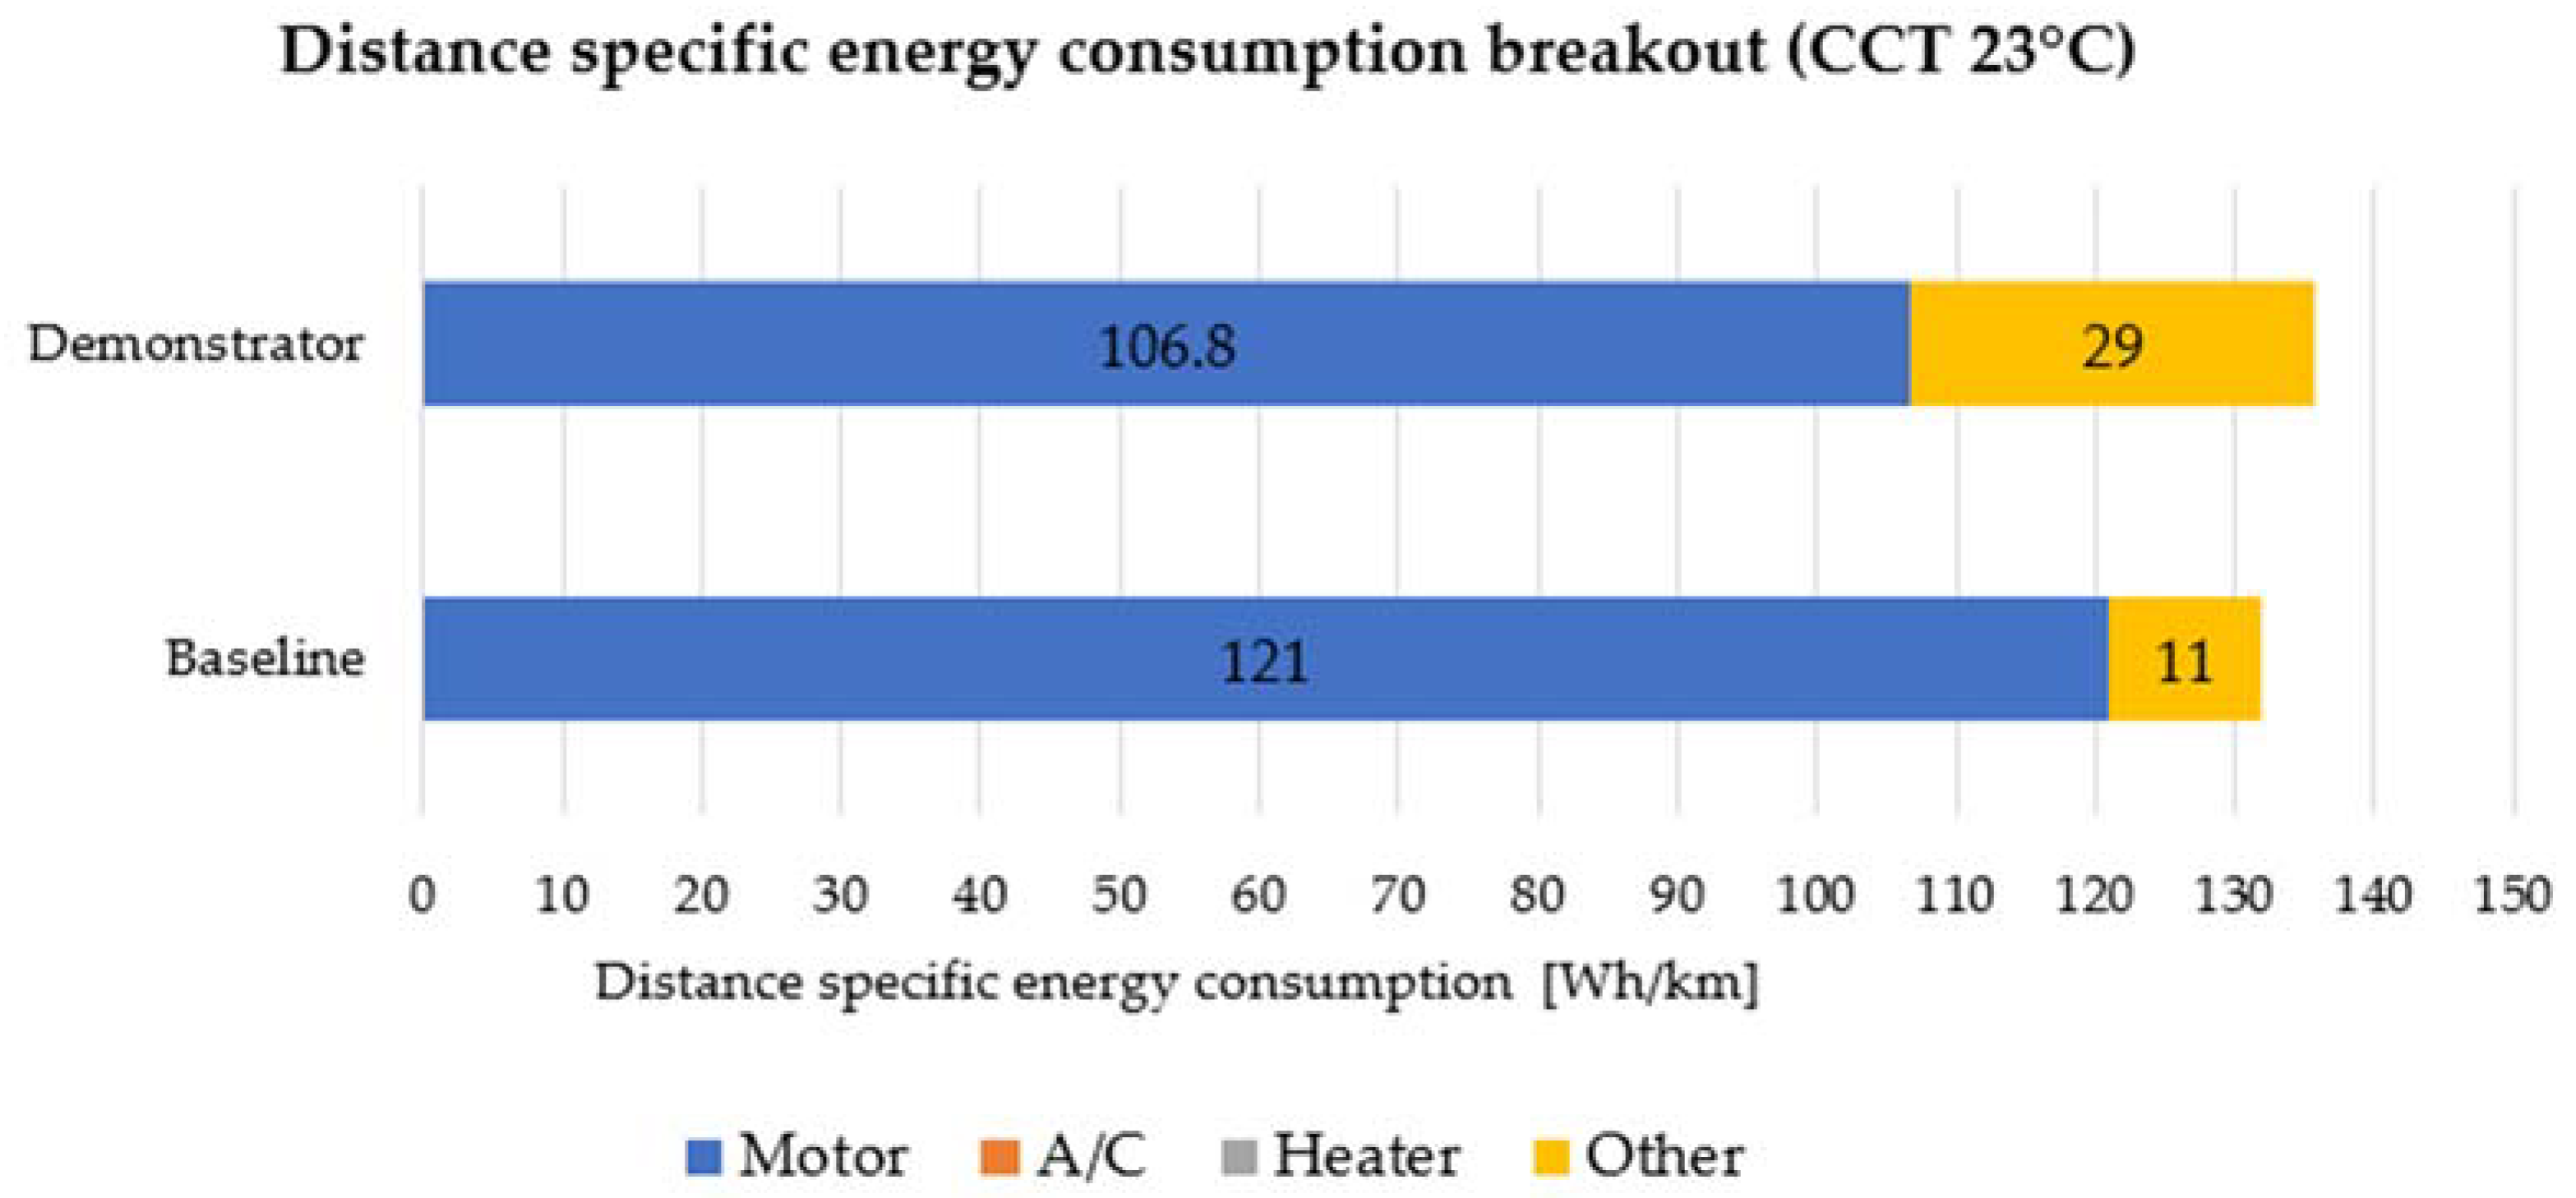
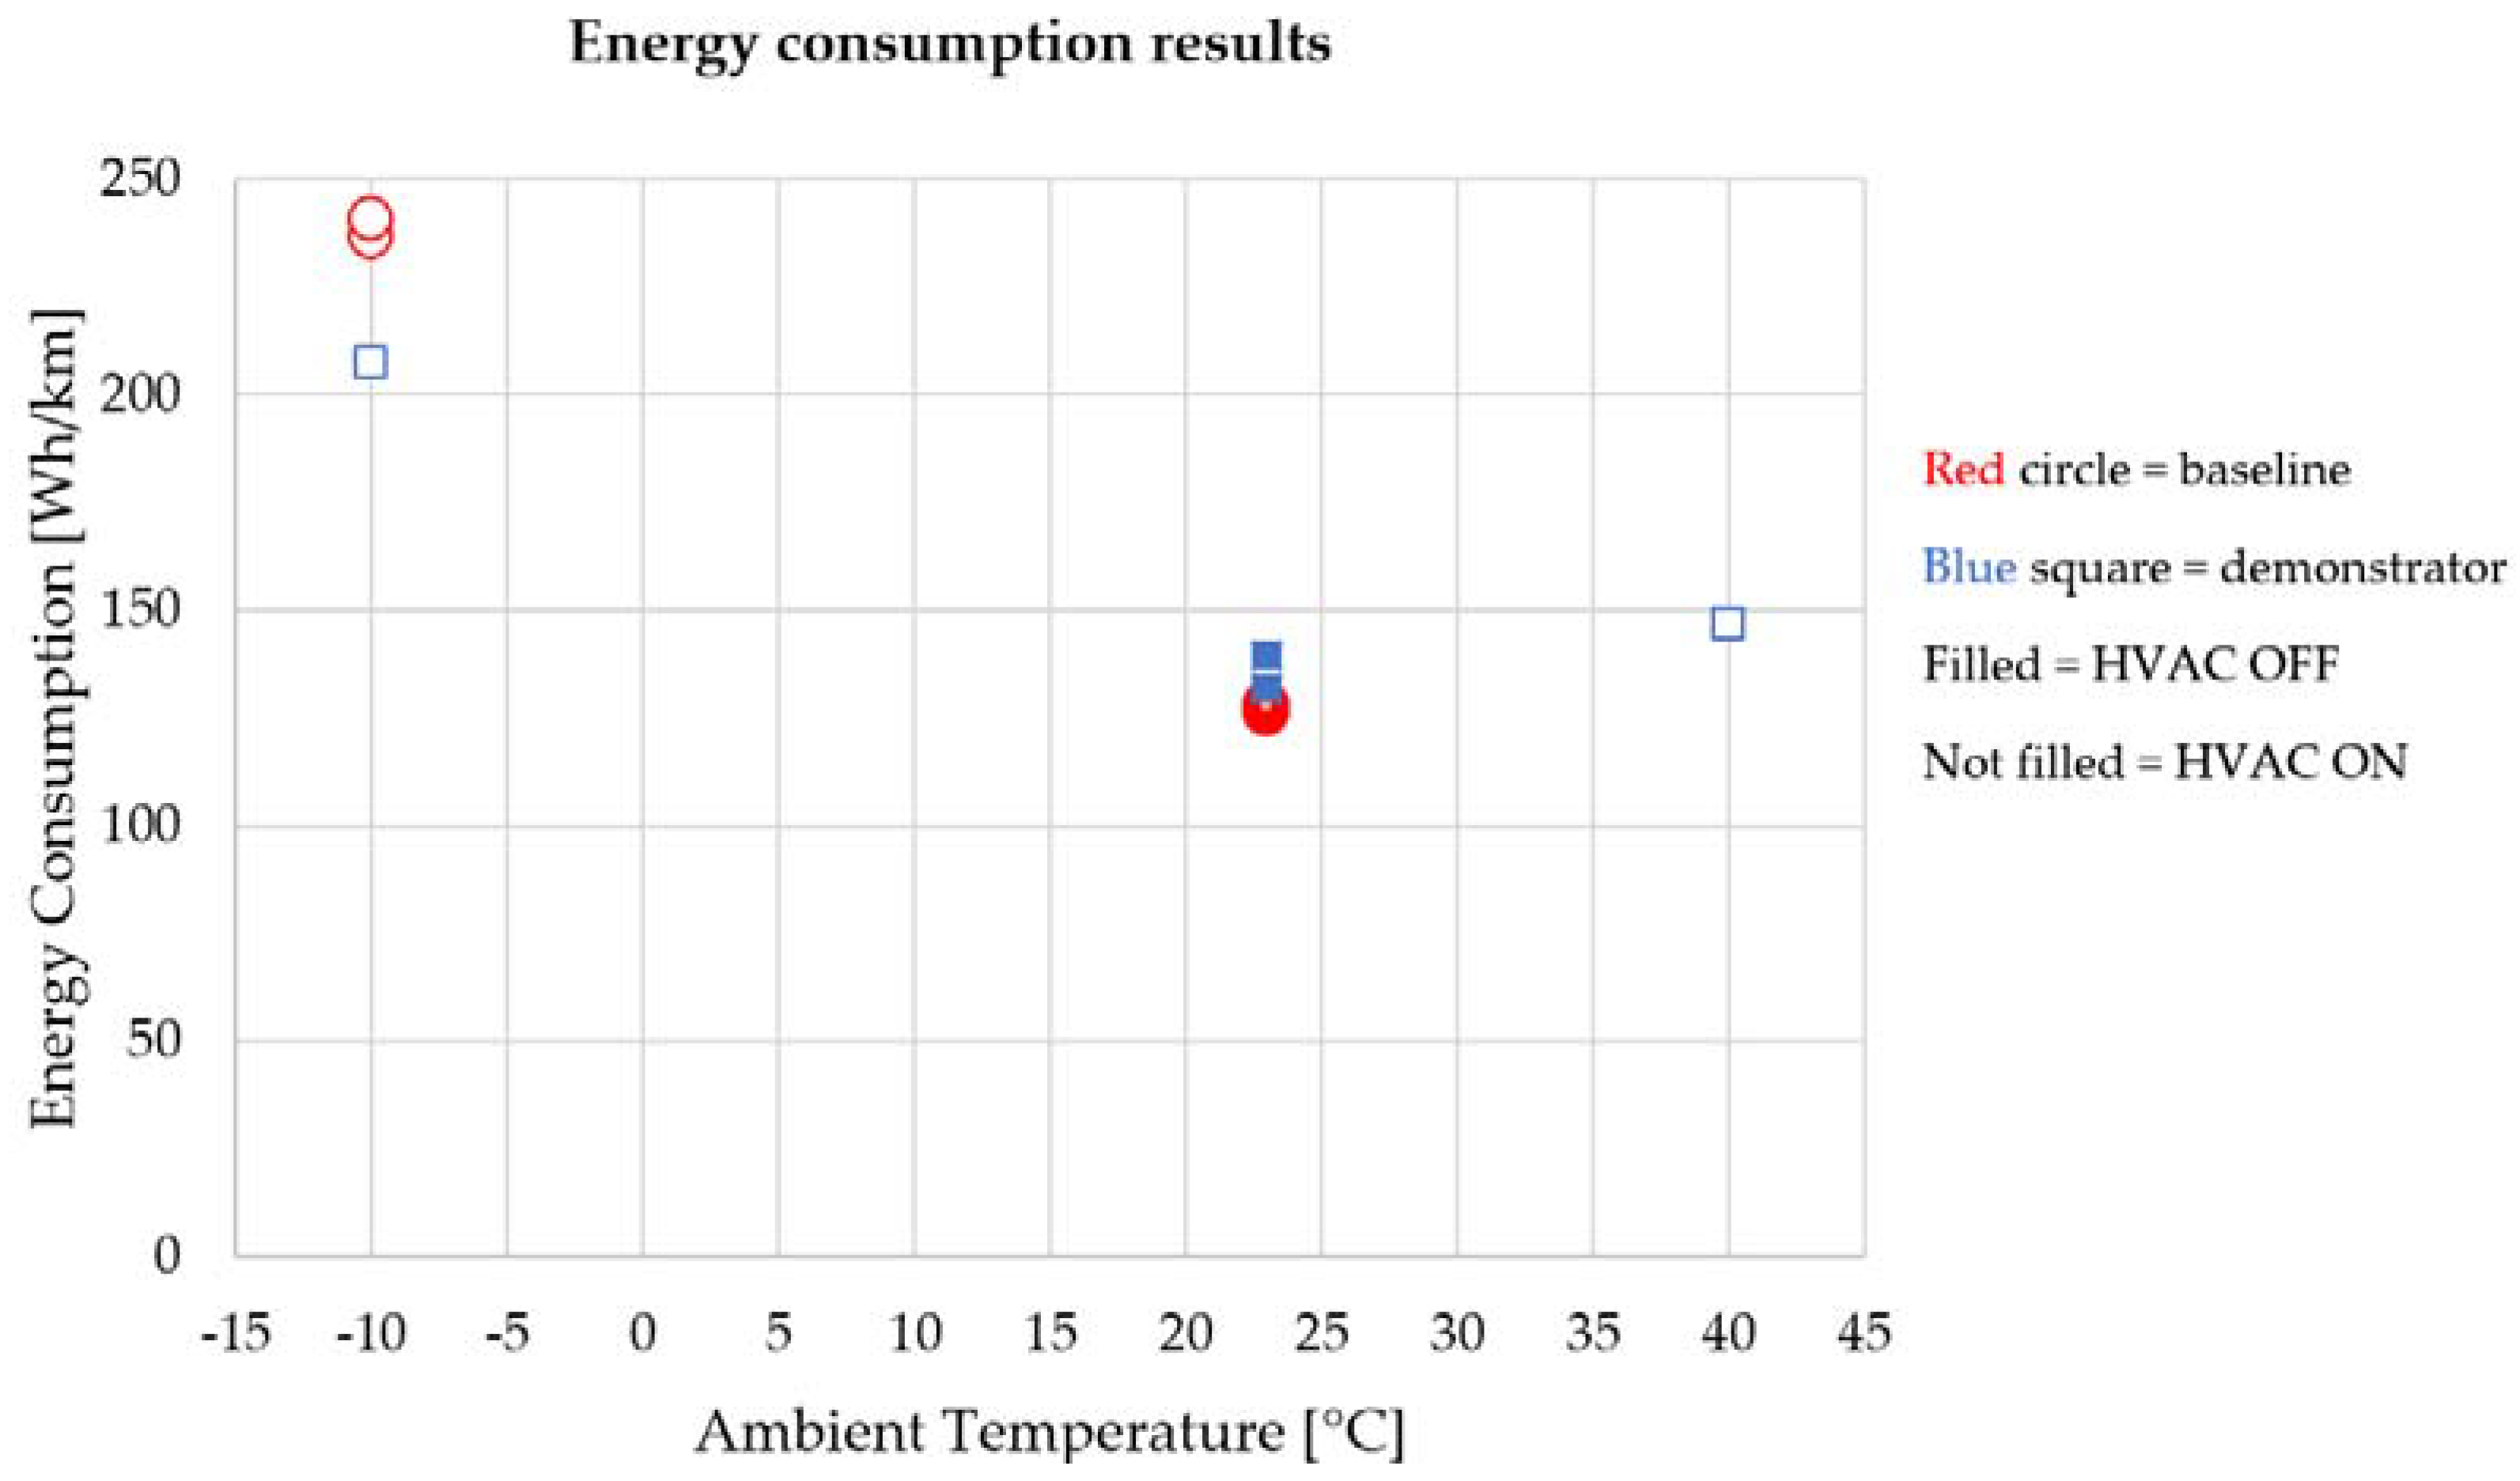
4.1. WLTP Consecutive Cycle Test Energy Consumption Results

The WLTP CCT procedure [43,44] has been applied at 23 °C without HVAC contribution and at −10 °C and 40 °C with the HVAC system set, respectively, in heating and cooling mode to obtain the distance-specific energy consumption of the demonstrator vehicle in different ambient conditions and explore the limitations and strengths of the test procedure when applied at different temperatures than 23 °C. The HVAC system is switched on immediately before the beginning of the test without performing the cabin temperature preconditioning.
The electric energy variation of all rechargeable electric energy storage systems (REESS) has been monitored for each phase by integrating over time the measured voltage and current, and the energy consumption is calculated by both dividing the variation of the electric energy of the REESS by the driven distance for each phase and applying a K-weighting factor, as per the WLTP [43,44].

4.1.1. Energy Consumption at 23 °C

Table 4 reports the energy consumption values for the CCT tests for both the baseline and the demonstrator vehicle for the test conducted at 23 °C with the HVAC system switched off. Energy consumptions are calculated at the battery level, so the efficiency loss during charge is not considered. The energy consumption values for the demonstrator vehicle range approximately between 130 and 136 Wh/km, slightly higher values than the baseline vehicle ones (i.e., 3.5%). Despite there being an improvement in the energy consumption of the electric motor, 106.8 Wh/km in the demonstrator versus 116–121 Wh/km in the baseline vehicle (Figure 8), there is an increase in the total vehicle energy consumption due to the extra weight and energy consumption of the measurement systems installed in the demonstrator. The energy consumption during the last driven cycle is almost the same in both vehicles. Each result has also been expressed into an equivalent value in litres of gasoline per 100 km (i.e., litres/100 km, see values in parenthesis) by using the conversion proposed by the Environmental Protection Agency [45]. The energy content of the gasoline fuel has been assumed equal to 8.90 kWh/litre (i.e., 115 kbtu/gallon). The calculated consumption ranges from 1.5 to 1.53 l/100 km (combined data), without including the effect of the inefficiencies during the recharge (i.e., from the grid to the battery). If these additional energy losses are included, a higher energy consumption would be derived.
The energy recuperation ratio for WLTP CCT is also calculated both at the battery and at the electric motor (EM) level. At the battery level, it is computed by dividing the electric energy charging the battery by the one discharging the battery measured by current and voltage (at measurement point M2), while, at the EM level, it is calculated by dividing recuperated energy at the electric motor by the driving energy (at measurement point M3). These ratios provide a rapid evaluation of the effect of the energy recuperation on the total energy consumption for each cycle and test conditions. The energy recuperation at the battery level is lower than that at the EM level, accounting for the energy losses between the battery and the EM (i.e., power lines and inverter). The recuperation ratio of the demonstrator vehicle at the battery level showed slightly lower values with respect to the vehicle baseline (i.e., 22% against 24% at room ambient temperature). The difference between the two measurement modes (Case 1 and Case 2) is approximately 2–5% at 23 °C.

4.1.2. Energy Consumption at −10 °C

The energy consumption of the demonstrator vehicle at −10 °C with the HVAC system in heating mode was estimated by combining the energy consumption of the demonstrator vehicle at −10 °C during a WLTP test without the HVAC system in operation, lasting 3600 s (two WLTC cycles), with the HVAC system energy consumption recorded during a static test consisting of warming up the vehicle cabin at −7 °C, lasting 3139 s. The static power consumption of the measurement equipment installed in the vehicle was subtracted from the total power consumption of the vehicle (approximately 200 W). An ideal thermal transfer from the chiller to the cabin heat exchanger was assumed. The energy consumption of the HV battery, A/C compressor, and heater has been derived for 3600 s, obtaining approximately 9757 Wh total energy consumed at the battery level for a test of two WLTC at −10 °C with the HVAC system in operation, resulting in approximately 207.6 Wh/km distance-specific energy consumption.
Table 5 summarises the results of Repetition #3 of the WLTP CCT test at −10 °C with the HVAC system switched on of the baseline vehicle [14]. Both the whole combined energy consumption and the WLTP K-weighted value from the start of the test up to the break-off criteria are reported. The distance-specific energy consumption ranged from approximately 236 Wh/km to 240 Wh/km, 12% more than the demonstrator vehicle.
Table 6 shows the energy consumption of the demonstrator vehicle at −10 °C for two consecutive WLTC without the HVAC system in operation, measured according to Case 1 and Case 2. The energy consumption ranges between 140 and 145 Wh/km. The HVAC system in heating mode increases the energy consumption by about 70–80% for the baseline vehicle and by approximately of 52–60% for the demonstrator. By comparing Table 5 and Table 6, it is also evident that, in the tests with HVAC switched on, a lower battery recuperation ratio is encountered; this can probably be explained through a direct flow of energy going to the HVAC system and not being recovered and stored through the battery.
The differences between the two measurement modes (Case 1 and 2) showed higher variability for the low temperature tests, i.e., 11–14% at −10 °C in respect to 3–5% recorded at 23 °C.

4.1.3. Energy Consumption at 40 °C

During the demonstrator vehicle test campaign at the JRC, the recirculation flap position stopped in a mixed mode, neither completely open nor closed. The QUIET system showed an AC compressor consumption of 5.4 kWh, while the baseline system showed an energy consumption of 1.4 kWh. Since a reduction factor of about 4.5 is observed between partial fresh air and recirculation mode in previous tests’ data, it was estimated that AC compressor consumption in the QUIET vehicle decreased to 1.2 kWh in the recirculation mode [18]. From the test results, a total battery consumption of 18.440 kWh was estimated for the four WLTC. Subtracting the measurement system energy load of approximately 400 Wh for the whole four WLTC cycles and applying the energy reduction factor to the AC measured energy consumption, as calculated above, a distance-specific energy consumption of approximately 147.3 Wh/km was derived. The results for the specific energy consumption are reported graphically in Figure 9.

4.2. MAC Test Energy Consumption Results

The MAC testing procedure aims to evaluate the effect of the HVAC system on the whole vehicle energy consumption [42]. The results are summarized in Table 7, both for the demonstrator and the baseline vehicle. The results of the application of the MAC test procedure at −10 °C are reported only for the baseline vehicle [14]. The ratio between the energy consumption from phases 2 and 3 is reported to evaluate the contribution on the energy consumption of the HVAC system in operation. The demonstrator vehicle shows an increase in the energy consumption due to the HVAC system being in cooling mode at 25 °C, ranging between +14% and +18%, while the baseline vehicle shows approximately a +12% increase in the energy consumption in the cooling mode, and a +71% increase in heating mode at −10 °C. The increasing of the energy consumption in the demonstrator is higher in respect to the one observed for the baseline vehicle.

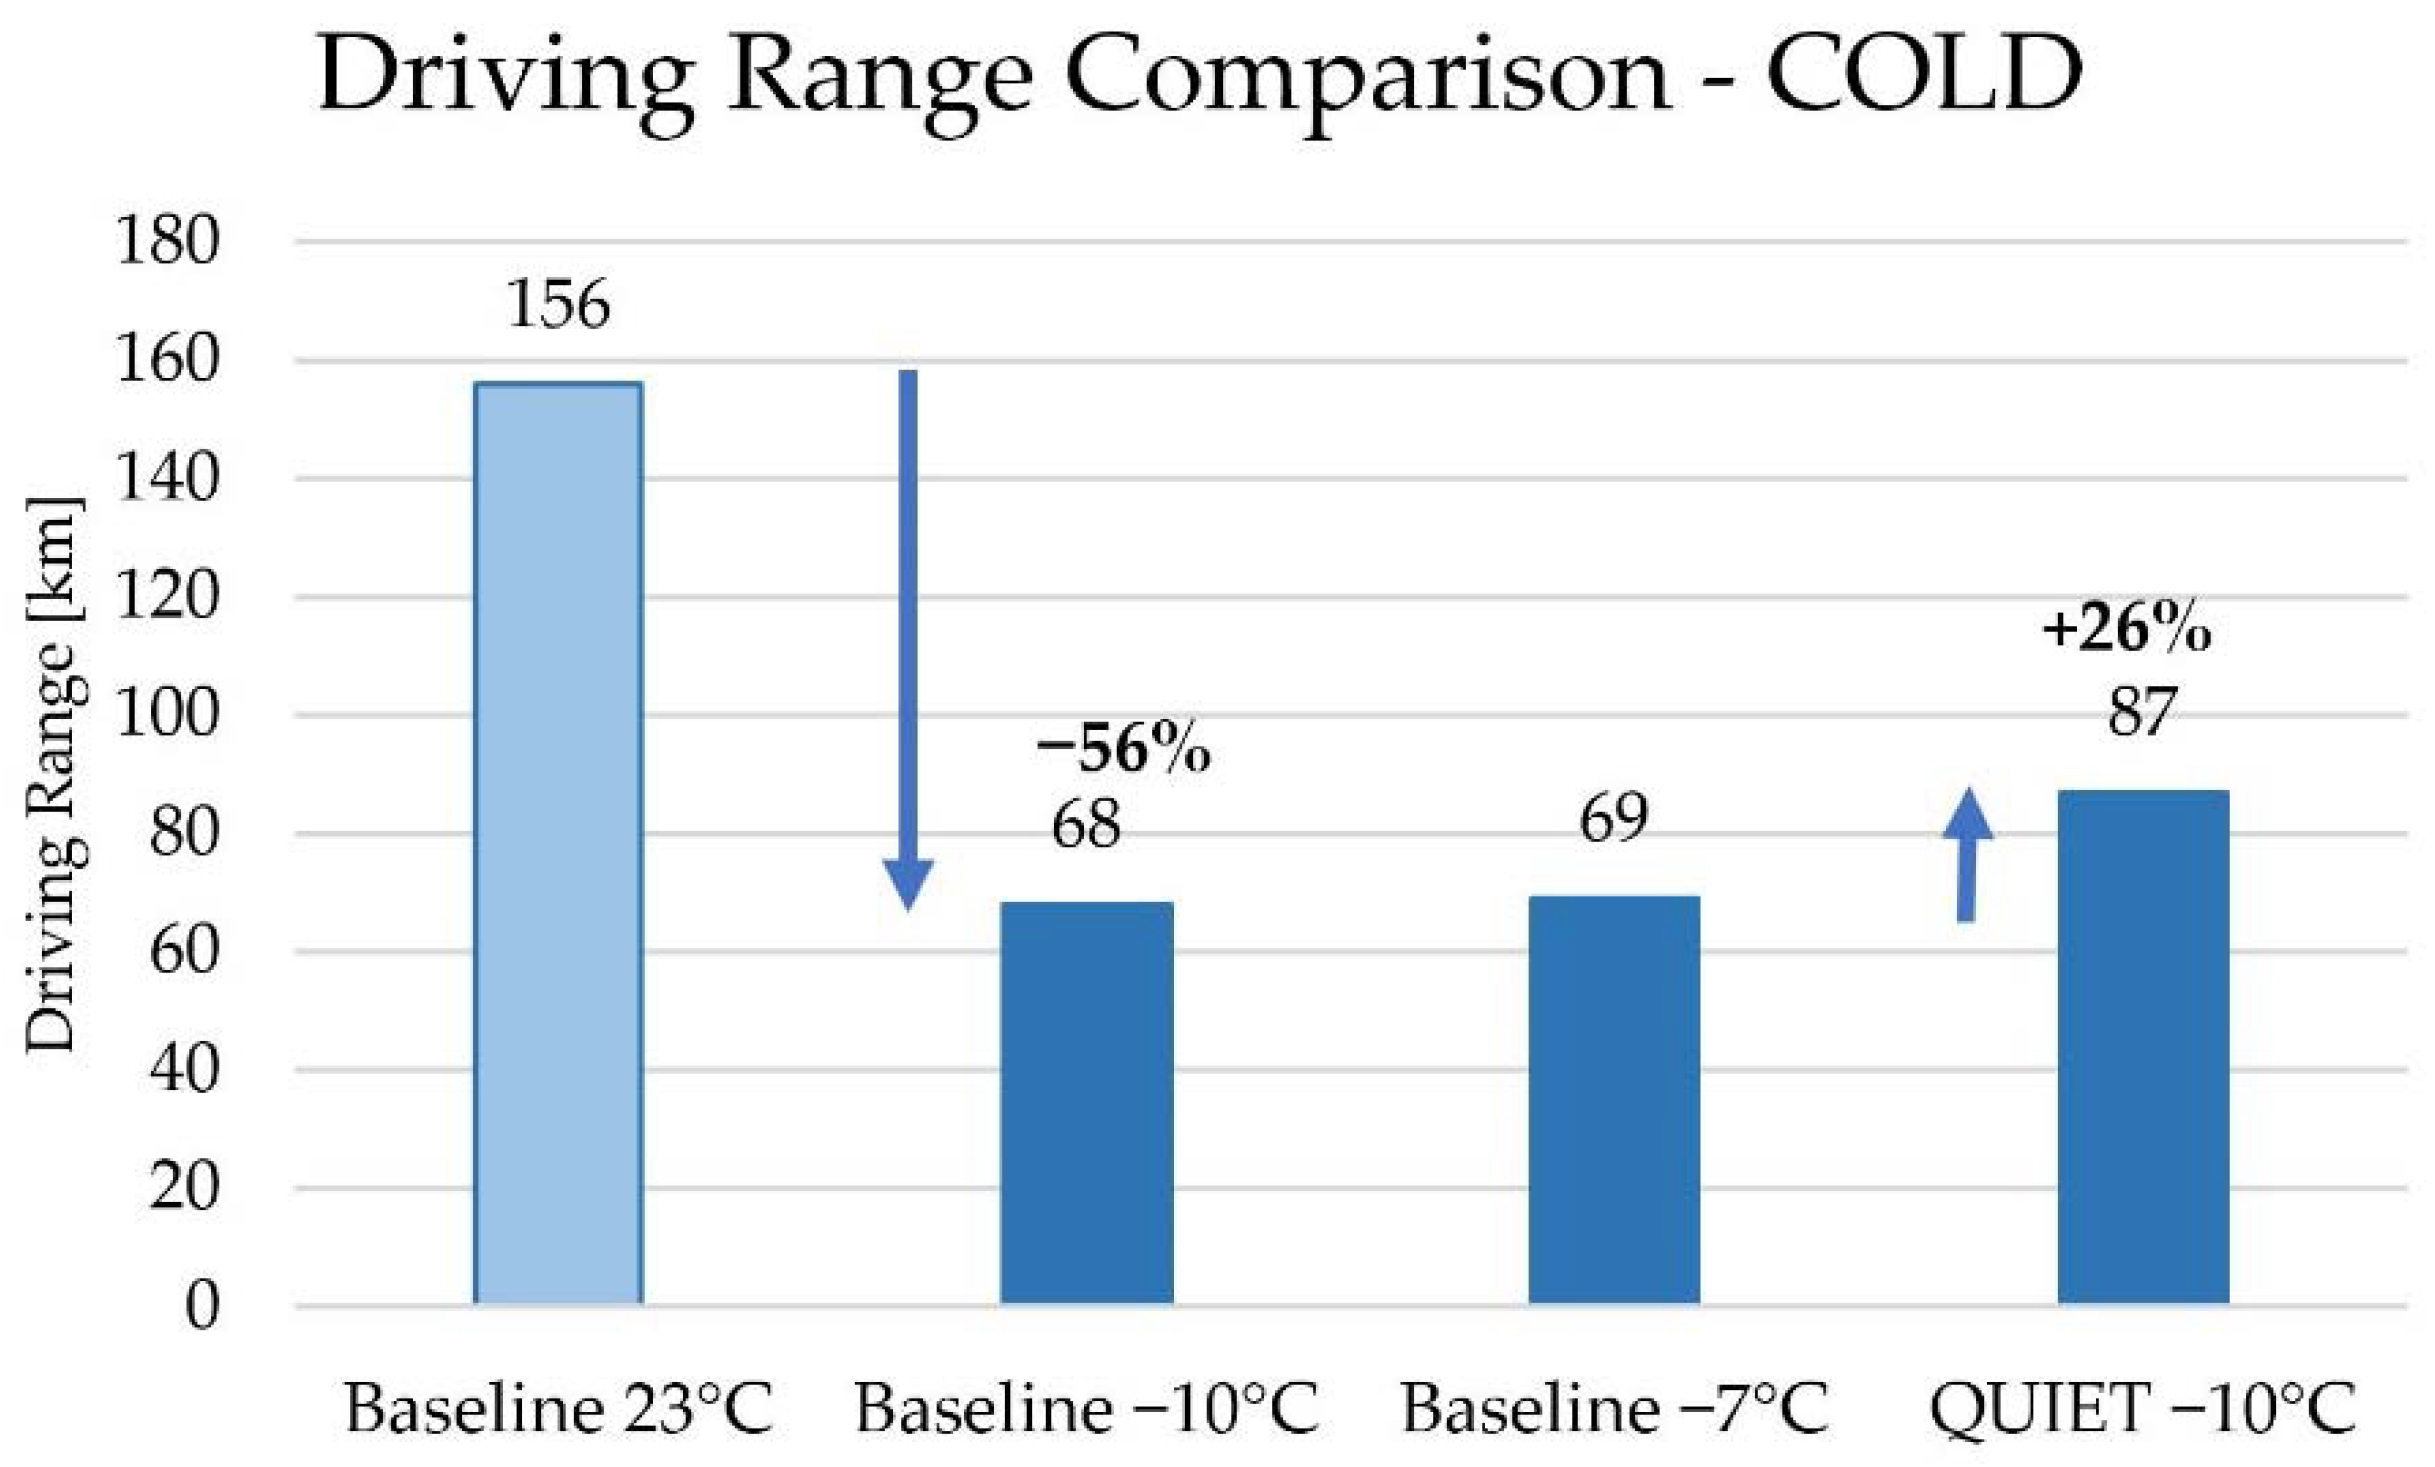
4.3. Driving Range Results

4.3.1. WLTP Consecutive Cycle Test Driving Range Results

The WLTP CCT driving range is derived for all the performed CCT tests at 23 °C, −10 °C, and 40 °C and reported in Table 8. For the −10 °C and 40 °C tests, only the cumulative distance driven up till break-off is reached is reported, with the K-weighted coefficients only defined in the WLTP for the test at 23 °C. The WLTP CCT pure electric range (PER) is computed by dividing the usable battery energy (i.e., the variation in the battery energy over the complete test procedure) over the K-weighted energy consumption [43,44]. The results at 23 °C show a decreased driving range for the demonstrator vehicle with respect to the baseline, that is, 136 km against 155 and 156 km for the baseline. This might be related to the aging of the battery in the vehicle, since the UBE recorded during the demonstrator tests (18,103 Wh) was lower than the one recorded for the baseline (20,164 Wh).
At −10 °C, knowing that the UBE during the baseline vehicle tests was about 16.18 kWh, assuming a constant power consumption of the HVAC system estimated as explained above for the energy consumption estimate, it is possible to calculate how many kilometres can be driven in total at −10 °C with the HVAC system in operation. The total driven distance for the demonstrator vehicle was derived to be 86.8 km [15,19].
The baseline vehicle showed a 56% reduction in the range when tested at −10 °C with the HVAC system switched on in respect to its test at 23 °C. The demonstrator vehicle shows a lower percentage reduction, approximately 36%. Comparing the two values at cold conditions, an improvement of the driving range of 26% is reached. This result is in line with the QUIET project targets and the simulation results of the starting phase of the project [19].
For the high temperature tests at 40 °C, the energy consumption has been estimated according to the assumptions made in chapter 4.1.3. The driving range for the demonstrator was derived by dividing the UBE available during the baseline vehicle tests at 40 °C by the specific energy consumption. A constant HVAC system consumption and an ideal thermal transient from the chiller to the cabin heat exchanger were assumed. A total driven distance between 137 and 140 km was calculated for the test at 40 °C, close to the same value as the baseline vehicle.
Figure 10 and Figure 11 show a comparison between the driving range values obtained for both the baseline and the demonstrator vehicle at cold and warm ambient temperature.

4.3.2. Multi-Cycle Approach for Estimating the Driving Range

Table 9 presents the driving range estimates obtained by simply dividing the nominal battery capacity (20 kWh) with the energy consumption values measured during CCT tests, reported in Table 4, Table 5, Table 6, as per the abbreviated test procedure [15,46,47]. This simplified method can only give an estimate of the vehicle range. The use of the nominal battery capacity might lead to an overestimated driving range in respect to the WLTP CCT.
The driving range results for the demonstrator and the baseline vehicles obtained with the first WLTC cycle at the ambient temperature are comparable, being, respectively, 147 km for the demonstrator and 152 km for baseline, while, for the low temperature WLTC tests with the HVAC system switched on in heating mode, a higher driving range is calculated for the demonstrator featuring the improved HVAC system (i.e., 77 km for the baseline and 112 km for the demonstrator).

4.3.3. WLTP City Driving Range Results

The city driving range for the CCT tests conducted at 23 °C applying the WTLP city test cycle has also been derived, both for the baseline and the demonstrator vehicle. The vehicle selected for the QUIET project is a HONDA B segment EV, a vehicle conceived for urban mobility, where the BEVs are growing in consensus and market share. Due to the lower energy consumption of the low-speed phases, the derived city range is higher. For the baseline vehicle, the city driving range results are approximately 211 km, 35% higher than the WLTP driving range of 156 km, while, for the demonstrator vehicle, it is 188 km, 38% higher than the WLTP driving range of 136 km.

5. Discussion and Conclusions

This article presents the main outcomes of the European Union Horizon 2020 QUIET project, aiming at developing a prototype B-segment battery electric vehicle with improved energy consumption and driving range, thermal comfort, and user interfaces. This was achieved by integrated innovative technologies with improved energy management, lightweight materials with enhanced thermal insulation properties, and enhancing safety and comfort.
The energy consumption was measured following the WLTP, but also by specific tests designed to verify the effectiveness of the prototypal components, such as by applying low- and high-temperature tests and the MAC procedure, to investigate the influence of the HVAC system on the energy consumption and driving range of the demonstrator.
The results showed that the developed features integrated and qualified in a Honda B-segment electric vehicle validator enable a reduction in the energy necessary for heating the passenger compartment of the electric vehicle under different operating conditions by approximately 12–14% compared to the Honda baseline vehicle. These efforts lead to an approximately 26% driving range increase under cold (−10 °C) weather conditions and to approximately the same driving range in hot (40 °C) weather conditions. This result is in line with the targets and the simulation results of the QUIET project. The improvement in the energy consumption and driving range is encountered when the HVAC system is operated in heating mode, with the heat pump in operation, exploiting the efficiency gains by introducing this technology that is not conventional nowadays in the production vehicles.
Investigations on the possible impact of the QUIET approach applied to vehicles of different segments (i.e., B-SUV segment, C segment, D segment, and D-SUV segment) indicate that the energy efficiency of the HVAC system is more relevant for smaller cars with a relatively low driving resistance. This results in a lower energy consumption from the drivetrain, leading to a higher relative importance of the HVAC. For larger cars, especially SUVs, this balance is shifted. Due to the higher energy demand needed for overcoming the driving resistances, the drivetrain is responsible for a higher portion of the overall vehicle energy demand. Therefore, the energy consumption from the HVAC has a lower relevance.
Due to the time restrictions for the project, it was not possible to test the demonstrator vehicle extensively at high- and low-environment conditions with the HVAC system in operation for a long time period. Therefore, it would be interesting to experimentally test the demonstrator vehicle in this respect in future work.
The QUIET project has explored the possibility of integrating advanced innovative technologies in electric vehicles to enhance the efficiency and the energy performances in different environmental conditions. The results might support the verification and the development of next-generation electric vehicle technologies and type approval regulations.

Author Contributions

Conceptualization, methodology, formal analysis, data curation, E.P. and S.J.; writing—original draft preparation, G.L.P.; writing—review and editing, E.P.; review and editing, G.L.P., E.P., M.O., M.C., C.F., S.J., A.B., B.T., D.B. and T.H. All authors have read and agreed to the published version of the manuscript.

Funding

The QUIET project has received funding from the European Union’s Horizon 2020 research and innovation programme under grant agreement No. 769826. The content of this publication is the sole responsibility of the authors and does not necessarily represent the view of the European Commission or its services.

Institutional Review Board Statement

Not applicable.

Informed Consent Statement

Not applicable.

Data Availability Statement

The data presented in this study are available on request from the corresponding author.

Acknowledgments

The authors would like to acknowledge the essential contribution of the JRC VELA laboratory staff and all the partners in the project.

Conflicts of Interest

The authors declare no conflict of interest.

Abbreviations

A/CAir conditioning
ACAlternating current
APMAtomically Precise Manufacturing
BEVBattery electric vehicle
CANController area network
CCTConsecutive cycle test
CFDComputational fluid dynamics
CSSConstant speed segment
DCDirect current
EMElectric motor
GHGGreenhouse gases
GPSGlobal positioning system
GWPGlobal warming potential
HCHydrocarbon
HMIHuman–machine interface
HVHigh voltage
HVACHeating, ventilation, and air conditioning
HV-PTCHigh-voltage positive thermal coefficient
ICEInternal combustion engine
IFAMFraunhofer Institute for Manufacturing Technology and Advanced Materials
IRInfrared
JRCJoint Research Centre
MACMobile air conditioning
NEDCNew European Driving Cycle
NVHNoise Vibration Harshness
ODPOzone depleting potential
PCMPhase change material
PMParticulate mass
PMVPredicted mean vote
PNParticulate number
STPShortened test procedure
SUVSport utility vehicle
QUIETQUalifying and Implementing a user-centric designed and EfficienT electric vehicle
VELAVehicle emission laboratories
WLTPWorldwide harmonized Light-duty Test Procedure

References

  1. European Commission. Paris Agreement COP21. 2015. Available online: https://ec.europa.eu/clima/policies/international/negotiations/paris_en (accessed on 6 December 2021).
  2. European Commission. European Green Deal. Available online: https://ec.europa.eu/commission/presscorner/detail/en/ip_19_6691 (accessed on 6 December 2021).
  3. European Commission. Sustainable and Smart Mobility Strategy–Putting European Transport on Track for the Future. 9 December 2020. Available online: https://eur-lex.europa.eu/legal-content/EN/TXT/?uri=CELEX:52020DC0789 (accessed on 6 December 2021).
  4. European Commission. Sustainable Mobility the European Green Deal. December 2021. Available online: https://ec.europa.eu/commission/presscorner/detail/en/fs_19_6726 (accessed on 6 December 2021).
  5. European Commission. Roadmap to a Single European Transport Area—Towards a Competitive and Resource Efficient Transport System. 28 March 2011. Available online: https://eur-lex.europa.eu/legal-content/EN/TXT/?uri=CELEX%3A52011DC0144 (accessed on 6 December 2021).
  6. E-Fools: Why E-Fuels in Cars Make No Economic or Environmental Sense. April 2021. Available online: https://www.bundestag.de/resource/blob/842490/8b933a33b2c9fdedac375996de237bbf/Artikel-1-Jekaterina-Boening-data.pdf (accessed on 6 December 2021).
  7. International Energy Agency (IEA). Global EV Outlook 2021. 2021. Available online: https://www.iea.org/reports/global-ev-outlook-2021 (accessed on 6 December 2021).
  8. Shafique, M.; Azam, A.; Rafiq, M.; Luo, X. Life cycle assessment of electric vehicles and internal combustion engine vehicles: A case study of Hong Kong. Res. Transp. Econ. 2021, 101112. [Google Scholar] [CrossRef]
  9. Shafique, M.; Luo, X. Environmental life cycle assessment of battery electric vehicles from the current and future energy mix perspective. J. Environ. Manag. 2022, 303, 114050. [Google Scholar] [CrossRef]
  10. Helmers, E.; Weiss, M. Advances and critical aspects in the life-cycle assessment of battery electric cars. Energy Emiss. Control Technol. 2017, 5, 1–18. [Google Scholar] [CrossRef] [Green Version]
  11. European Commission Directorate-General for Climate Policy Directorate C-Climate Strategy, Governance and Emissions from Non-Trading Sectors Unit C4—Road Transport. Determining the environmental impacts of conventional and alternatively fuelled vehicles through LCA. 2020. Available online: https://op.europa.eu/it/publication-detail/-/publication/1f494180-bc0e-11ea-811c-01aa75ed71a1 (accessed on 6 December 2021).
  12. Hyeon Park, M.; Chul Kim, S. Heating Performance Characteristics of High-Voltage PTC Heater for an Electric Vehicle. Energies 2017, 10, 1494. [Google Scholar] [CrossRef] [Green Version]
  13. Zhang, T.; Gao, C.; Gao, Q.; Wang, G.; Liu, M.; Guo, Y.; Xiao, C.; Yan, Y. Status and development of electric vehicle integrated thermal management from BTM to HVAC. Appl. Therm. Eng. 2015, 88, 398–409. [Google Scholar] [CrossRef]
  14. Paffumi, E.; Otura, M.; Centurelli, M.; Casellas, R.; Brenner, A.; Jahn, S. Energy Consumption, Driving Range and Cabin Temperature Performances at Different Ambient Conditions in Support to the Design of a User-Centric Efficient Electric Vehicle: The QUIET Project. In Proceedings of the 14th SDEWES Conference, Dubrovnik, Croatia, 1–6 October 2019; p. 18. [Google Scholar]
  15. De Gennaro, M.; Paffumi, E.; Martini, G.; Manfredi, U.; Vianelli, S.; Ortenzi, F.; Genovese, A. Experimental Test Campaign on a Battery Electric Vehicle: Laboratory Test Results (Part 1). Int. J. Altern. Powertrains 2015, 4, 1. [Google Scholar] [CrossRef]
  16. De Gennaro, M.; Paffumi, E.; Martini, G.; Scholz, H. A pilot study to address the travel behaviour and the usability of electric vehicles in two Italian provinces. Case Stud. Transp. Policy 2014, 2, 116–141. [Google Scholar] [CrossRef]
  17. DeGennaro, M.; Paffumi, E.; Martini, G. Big Data for Supporting Low-Carbon Road Transport Policies in Europe: Applications, Challenges and Opportunities. Big Data Res. 2016, 6, 11–25. [Google Scholar] [CrossRef]
  18. Paffumi, E.; Wang, J.; Nunnendorf, V.; Jahn, S. Quiet Deliverable D5.4. QUIET-QUalifying and Implementing a User-Centric Designed and EfficienT Electric Vehicle. 2021. Available online: https://www.quiet-project.eu/wp-content/uploads/2021/06/QUIET-D54_public_HP.pdf (accessed on 6 December 2021).
  19. QUIET-QUalifying and Implementing a User-Centric Designed and EfficienT Electric Vehicle. Quiet Flyer. 2021. Available online: https://www.quiet-project.eu/wp-content/uploads/2021/04/flyer.pdf (accessed on 6 December 2021).
  20. Wei, C.; Hofman, T.; Caarls, E.I.; van Iperen, R. A Review of the Integrated Design and Control of Electrified Vehicles. Energies 2020, 13, 5454. [Google Scholar] [CrossRef]
  21. Cvok, I.; Ratković, I.; Deur, J. Optimisation of Control Input Allocation Maps for Electric Vehicle Heat Pump-based Cabin Heating Systems. Energies 2020, 13, 5131. [Google Scholar] [CrossRef]
  22. Cvok, I.; Ratković, I.; Deur, J. Multi-Objective Optimisation-Based Design of an Electric Vehicle Cabin Heating Control System for Improved Thermal Comfort and Driving Range. Energies 2021, 14, 1203. [Google Scholar] [CrossRef]
  23. A European Union Funded Project Coordinated by AIT Austrian Institute of Technology. Quiet Web Page. Available online: https://www.quiet-project.eu/media/ (accessed on 6 December 2021).
  24. European Commission. Vehicle Emissions Laboratories. Available online: https://ec.europa.eu/jrc/en/research-facility/vehicle-emissions-laboratory-vela (accessed on 6 December 2021).
  25. Drage, P.; Hinteregger, M.; Zotter, G.; Šimek, M. Cabin Conditioning for Electric Vehicles. ATZ Worldw. 2019, 121, 44–49. [Google Scholar] [CrossRef]
  26. Kim, K.Y.; Kim, S.C.; Kim, M.S. Experimental studies on the heating performance of the PTC heater and heat pump combined system in fuel cells and electric vehicles. Int. J. Automot. Technol. 2012, 13, 971–977. [Google Scholar] [CrossRef]
  27. Shrivastava, A.P.; Dahake, M.R. Performance Analysis of Automobile Air Conditioning System using Propane (R290). Int. Res. J. Eng. Technol. (IRJET) 2016, 3, 1344–1347. [Google Scholar]
  28. Kandhaswamy, K.; Periasamy, S.; Maylsamy, S.; Thangavel, S. Experimental investigations on automobile air conditioners working with R134a and R290/R600a as an alternative. Therm. Sci. 2017, 21, 515–522. [Google Scholar] [CrossRef] [Green Version]
  29. Osterman, E.; Tyagi, V.; Butala, V.; Rahim, N.; Stritih, U. Review of PCM based cooling technologies for buildings. Energy Build. 2012, 49, 37–49. [Google Scholar] [CrossRef]
  30. Souayfane, F.; Fardouna, F.; Biwole, P.-H. Phase change materials (PCM) for cooling applications in buildings: A review. Energy Build. 2016, 129, 396–431. [Google Scholar] [CrossRef]
  31. Jha, K.K.; Badathala, R. Low Temperature Thermal Energy Storage (TES) System for Improving Automotive HVAC. Technical Report for SAE 2015World Congress & Exhibition. 2015. Available online: https://www.sae.org/publications/technical-papers/content/2015-01-0353/ (accessed on 6 December 2021).
  32. LaClair, T.; Gao, Z.; Abdelaziz, O.; Wang, M.; Wolfe, E.; Craig, T. Thermal Storage System for Electric Vehicle Cabin Heating-Component and System Analysis. Technical Report for SAE 2016 World Congress and Exhibition. 2016. Available online: https://www.sae.org/publications/technical-papers/content/2016-01-0244/ (accessed on 6 December 2021).
  33. Baumeister, J.; Weise, J.; Myslicki, S.; Kieseritzky, E.; Lindenberg, G. PCM-Based Energy Storage System with High Power Output Using Open Porous Aluminum Foams. Energies 2020, 13, 23. [Google Scholar] [CrossRef]
  34. Jeffs, J.; McGordon, A.; Picarelli, A.; Robinson, S.; Tripathy, Y.; Widanage, W.D. Complex Heat Pump Operational Mode Identification and Comparison for Use in Electric Vehicles. Energies 2018, 11, 2000. [Google Scholar] [CrossRef] [Green Version]
  35. Lahlou, A.; Ossart, F.; Boudard, E.; Roy, F.; Bakhouya, M. Optimal Management of Thermal Comfort and Driving Range in Electric Vehicles. Energies 2020, 13, 17. [Google Scholar] [CrossRef]
  36. Lahlou, A.; Ossart, F.; Boudard, E.; Roy, F.; Bakhouya, M. A Real-Time Approach for Thermal Comfort Management in Electric Vehicles. Energies 2020, 13, 15. [Google Scholar] [CrossRef]
  37. Basciotti, D.; Dvorak, D.; Gella, I. A Novel Methodology for Evaluating the Impact of Energy Efficiency Measures on the Cabin Thermal Comfort of Electric Vehicles. Energies 2020, 13, 3872. [Google Scholar] [CrossRef]
  38. “Quiet Deliverables D3.1 D3.2 D3.3,” QUIET-QUalifying and Implementing a User-Centric Designed and EfficienT Electric Vehicle. 2021. Available online: https://www.quiet-project.eu/dissemination/ (accessed on 6 December 2021).
  39. Paffumi, E.; De Gennaro, M.; Martini, G.; Manfredi, U.; Vianelli, S.; Ortenzi, F.; Genovese, A. Experimental Test Campaign on a Battery Electric Vehicle: On-Road Test Results (Part 2). SAE Int. J. Altern. Powertrains 2015, 4, 2. [Google Scholar] [CrossRef]
  40. American Honda Motor Co. Honda Fit EV Emergency Response Guide. 2012. Available online: https://techinfo.honda.com/rjanisis/pubs/web/ACI48132.pdf (accessed on 6 December 2021).
  41. American Honda Motor Co., Inc. 2013–2014 Fit EV Online Reference Owner’s. 2012. Available online: http://techinfo.honda.com/rjanisis/pubs/OM/AH/AX91414OM/enu/X91414OM.PDF (accessed on 6 December 2021).
  42. DG Enterprise and Industry under Framework Service Contract ENTR/05/18/2010. MAC Test Procedure to Be Used in a Pilot Phase, Final Report of the Project “Collection and Evaluation of Data and Development of Test Procedures in Support of Legislation on Mobile Air Conditioning (MAC) Efficiency and Gear Shift Indicators (GSI)”. 2010. Available online: http://www.unece.org/fileadmin/DAM/trans/doc/2010/wp29grpe/MACTP-01-06e.pdf (accessed on 6 December 2021).
  43. UNECE. Global Technical Regulation No. 15 Worldwide Harmonized Light Vehicles Test Procedure. 2014. Available online: https://www.unece.org/fileadmin/DAM/trans/main/wp29/wp29r-1998agr-rules/ECE-TRANS-180a15e.pdf (accessed on 6 December 2021).
  44. European Commission. Commission Regulation (EU) 2017/1151. Available online: https://eur-lex.europa.eu/legal-content/EN/TXT/?uri=celex%3A32017R1151 (accessed on 6 December 2021).
  45. Environmental Protection Agengy (EPA). EV Label. 2019. Available online: https://fueleconomy.gov/ (accessed on 6 December 2021).
  46. Meyer, N.; Whittal, I.; Christenson, M.; Loiselle-Lapointe, A. The impact of the driving cycle and climate on electrical consumption and range of fully electric passengers vehicles. In Proceedings of the EVS26-International Battery, Hybrid and Fuel Cell Electric Vehicle Symposium, Los Angeles, CA, USA, 6–9 May 2012. [Google Scholar]
  47. SAE International Surface Vehicle Recommended Practice. Battery Electric Vehicle Energy Consumption and Range Test Procedure. SAE Standard J1634. 2012. Available online: https://www.sae.org/standards/content/j1634_201210/ (accessed on 6 December 2021).
Figure 2. Detail of the touchscreen HMI [23]. Image © Honda R&D Europe (Deutschland).
Energies 15 01290 g002
Figure 3. QUIET demonstrator tested at the JRC Ispra VeLA 8 facility [18,23,24]. Image © European Union, 2021.
Energies 15 01290 g003
Figure 4. Air outlet locations [41]. Image ©Honda R&D Europe (Deutschland).
Energies 15 01290 g004
Figure 5. Schematic representation and measurement points.
Energies 15 01290 g005
Figure 6. Cabin temperature sensors [18,23]. Image © European Union, 2021.
Energies 15 01290 g006
Figure 7. Driving cycles adopted: WLTC, MAC, and WLTP STP [42,43,44].
Energies 15 01290 g007
Figure 8. Distance specific energy consumption (CCT at 23 °C) of the demonstrator and baseline vehicles.
Energies 15 01290 g008
Figure 9. Energy consumption results of the baseline and demonstrator vehicle at different ambient temperatures from the WLTP CCT tests.
Energies 15 01290 g009
Figure 10. Driving range comparison at cold ambient temperature.
Energies 15 01290 g010
Figure 11. Driving range comparison at warm ambient temperature.
Energies 15 01290 g011
Table 1. Test vehicle characteristics [14].
ArchitectureVehicle Demonstrator
PropulsionSynchronous electric motor
Max. Power (kW)75
Max. Torque (N∙m)256
Mass (kg)1540
Battery20 kWh–432 Li-Ion cells
331 V (nominal voltage)
Table 2. Detail of measurement locations [14] (see Figure 5).
Measurement Point LabelDescription
M1Energy from the grid to the high-voltage battery (Wh)
(acquired directly on the recharging station)
M2Current (A) and Voltage (V), from the high-voltage battery feeding the inverter, the low-voltage auxiliary systems, and the heating and A/C systems
(acquired both by CANbus and current clamp measurements)
M3Rotational speed (rpm) and torque (N∙m) of the electric motor
(acquired by CANbus)
M4Energy at the wheel (Wh)
(acquired by the dyno)
M5Current (A) and Voltage (V), from the high-voltage battery to the heater
(acquired by CANbus)
M6Current (A) and Voltage (V), from the high-voltage battery to the A/C compressor
(acquired both by CANbus and current clamp measurement)
Table 3. Laboratory and on-road driving tests.
CycleAmbient TemperatureHVAC
WLTP CCT23 °Coff
WLTP CCT−10 °CAUTO mode
2 seats occupied
25 °C enforced (heating)
WLTP CCT40 °CAUTO mode
2 seats occupied
26 °C enforced (cooling)
WLTP STP23 °Coff
MAC25 °CAUTO mode
2 seats occupied
15 °C enforced (cooling)
MAC−10 °CAUTO mode
2 seats occupied
22 °C enforced (heating)
Table 4. Energy consumption results for the WLTP CCT at 23 °C for the baseline [14] and the demonstrator vehicle. Results for the two measurement cases (Case 1—CAN current and CAN voltage measurements; Case 2—AC/DC clamp for current and CAN voltage measurements).
TAmb. = 23 °C
HVAC OFF
Demonstrator TestsBaseline Tests (Rep. #1)
Case 1Case 2Case 1Case 2
WLTC
(Wh/km)
(l/100 km)
WLTC
(Wh/km)
(l/100 km)
WLTC
(Wh/km)
(l/100 km)
WLTC
(Wh/km)
(l/100 km)
Cycle 1 combined136.0
(1.53)
138.2
(1.55)
131.3
(1.47)
128.7
(1.43)
Cycle 2 combined131.0
(1.47)
137.9
(1.54)
129.6
(1.46)
126.7
(1.41)
Cycle 3 combined130.4
(1.46)
138.4
(1.55)
129.4
(1.45)
127.4
(1.42)
Cycle 4 combined132.8
(1.49)
139.7
(1.57)
129.2
(1.45)
127.0
(1.41)
Cycle 5 combined130.8
(1.47)
138.4
(1.55)
130.7
(1.47)
128.5
(1.43)
Cycle 6 combined//131.9
(1.48)
128.8
(1.43)
Total from start up to break-off criteria combined131.6
(1.48)
139.4
(1.57)
128.6
(1.44)
125.
(1.40)
Total from start up to break-off criteria WLTP
(K-weighted values)
133.1
(1.50)
138.5
(1.56)
130.3
(1.46)
127.8
(1.44)
Rec. Ratio (Battery)22.9%22.9%24.3%25.5%
Table 5. Energy consumption results (Wh/km) for the WLTP CCT at −10 °C (HVAC on) for the baseline vehicle [14]. Results for the two measurement cases (Case 1—CAN current and CAN voltage measurements; Case 2—AC/DC clamp for current and CAN voltage measurements).
TAmb. = −10 °C
HVAC ON
Baseline Vehicle Tests (Rep. #3)
Case 1Case 2
WLTC
(Wh/km)
(l/100 km)
WLTC
(Wh/km)
(l/100 km)
Cycle 1 combined258.9
(2.91)
264.6
(2.97)
Cycle 2 combined227.6
(2.56)
233.2
(2.62)
Total from start up to break-off criteria combined235.9
(2.65)
186.8
(2.10)
Total from start up to break-off criteria WLTP
(K-weighted values)
240.5
(2.70)
249.9
(2.81)
Rec. Ratio (Battery)8.9% 6.9%
Table 6. Energy consumption results (Wh/km) for the WLTP CCT tests at cold temperatures of the demonstrator vehicle without the HVAC system in operation. Results for the two measurement cases (Case 1—CAN current and CAN voltage measurements; Case 2—AC/DC clamp for current and CAN voltage measurements).
TAmb. = −10 °C
HVAC OFF
Demonstrator Tests
Case 1Case 2
WLTC
(Wh/km)
(l/100 km)
WLTC
(Wh/km)
(l/100 km)
Cycle 1 combined159.42
(1.79)
163.36
(1.83)
Cycle 2 combined145.88
(1.64)
149.91
(1.68)
Total from start up to break-off criteria combined140.79
(1.58)
144.70
(1.63)
Total from start up to break-off criteria WLTP
(K-weighted values)
152.63
(1.71)
156.59
(1.76)
Rec. Ratio (Battery)18.15%18.15%
Table 7. Energy consumption results (MAC).
Demonstrator VehicleBaseline Vehicle
Case 1Case 2Case 1Case 2Case 1Case 2
MAC
(Wh/km)
(l/100 km)
MAC
(Wh/km)
(l/100 km)
MAC
(Wh/km)
(l/100 km)
MAC
(Wh/km)
(l/100 km)
MAC
(Wh/km)
(l/100 km)
MAC
(Wh/km)
(l/100 km)
TAmb. = 25 °CPhase 1
HVAC ON
175.8
(1.97)
168.6
(1.89)
172.7
(1.94)
171.3
(1.92)
143.3
(1.61)
117.1
(1.32)
Phase 2
HVAC ON
155.1
(1.74)
148.8
(1.67)
153.6
(1.73)
152.9
(1.71)
140.9
(1.58)
107.6
(1.21)
Phase 3
HVAC OFF
131.1
(1.47)
116.7
(1.31)
134.2
(1.51)
130.2
(1.46)
128.1
(1.44)
96.0
(1.08)
Ratio+18.3%+27.5%+14.4%+17.4%+10.0%+12.1%
TAmb. = −10 °CPhase 1
HVAC ON
////301.7
(3.39)
298.9
(3.36)
Phase 2
HVAC ON
////237.3
(2.66)
234.0
(2.63)
Phase 3
HVAC OFF
////146.7
(1.65)
136.9
(1.54)
Ratio////+61.7%+71.0%
Table 8. Driving range test results for the WLTP CCT procedure at the different ambient temperatures.
Demonstrator Test Baseline Tests
Case 1Case 2Case 1Case 2Case 1Case 2Case 1Case 2
Driving Range (km)Driving Range (km)Driving Range (km)Driving Range (km)
TAmb. = 23 °C
HVAC OFF
WLTP CCT
up to break-off K-weighted
136.08136.44154.43154.10154.74124.10149.24148.90
WLTP CCT
up to break-off Not weighted
136.61156.50156.78148.76
TAmb. = −10 °C
HVAC ON
Estimated WLTP CCT
up to break-off Not weighted
86.86863.9863.93
TAmb. = 40 °C
HVAC ON
Estimated WLTP CCT
up to break-off Not weighted
137–140137//
Table 9. Multi-cycle driven range results.
Demonstrator TestsBaseline Tests
WLTC
23 °C HVAC OFF
(km)
WLTC
−10 °C HVAC OFF
(km)
WLTC
−10 °C
HVAC ON
(km)
WLTC
23 °C HVAC OFF
(km)
WLTC
−10 °C HVAC ON
(km)
Cycle 1147.04125.46111.66152.3777.26
Cycle 2152.64137.10/154.3787.88
Cycle 3153.36//154.55/
Cycle 4150.61//154.77/
Cycle 5152.94//152.99/
Cycle 6///151.64/
WLTP CCT136512615668
Publisher’s Note: MDPI stays neutral with regard to jurisdictional claims in published maps and institutional affiliations.

