Article

Optimized Control Strategy for Photovoltaic Hydrogen Generation System with Particle Swarm Algorithm

1
Electrical Engineering Department, Yanshan University, Qinhuangdao 066000, China
2
Institute of Electrical Engineering, Chinese Academy of Sciences, Beijing 100190, China
3
State Grid Beijing Electric Power Company, Beijing 100031, China
4
State Grid Jiaxing Electric Power Supply Company, Jiaxing 314033, China
5
Department of Energy Technology, Aalborg University, 9220 Aalborg, Denmark
*
Author to whom correspondence should be addressed.
Energies 2022, 15(4), 1472; https://doi.org/10.3390/en15041472
Submission received: 9 January 2022 / Revised: 2 February 2022 / Accepted: 15 February 2022 / Published: 17 February 2022
(This article belongs to the Section F3: Power Electronics)

Abstract

:
Distributed generation is a vital component of the national economic sustainable development strategy and environmental protection, and also the inevitable way to optimize energy structure and promote energy diversification. The power generated by renewable energy is unstable, which easily causes voltage and frequency fluctuations and power quality problems. An adaptive online adjustment particle swarm optimization (AOA-PSO) algorithm for system optimization is proposed to solve the technical issues of large-scale wind and light abandonment. Firstly, a linear adjustment factor is introduced into the particle swarm optimization (PSO) algorithm to adaptively adjust the search range of the maximum power point voltage when the environment changes. In addition, the maximum power point tracking method of the photovoltaic generator set with direct duty cycle control is put forward based on the basic PSO algorithm. Secondly, the concept of recognition is introduced. The particles with strong recognition ability directly enter the next iteration, ensuring the search accuracy and speed of the PSO algorithm in the later stage. Finally, the effectiveness of the AOA-PSO algorithm is verified by simulation and compared with the traditional control algorithm. The results demonstrate that the method is effective. The system successfully tracks the maximum power point within 0.89 s, 1.2 s faster than the traditional perturbation and observation method (TPOM), and 0.8 s faster than the incremental admittance method (IAM). The average maximum power point is 274.73 W, which is 98.87 W higher than the TPOM and 109.98 W more elevated than the IAM. Besides, the power oscillation range near the maximum power point is small, and the power loss is slight. The method reported here provides some guidance for the practical development of the system.

1. Introduction

In recent years, photovoltaic power generation has developed by leaps and bounds, and its importance is self-evident [1,2]. As natural clean energy, Solar energy has the advantages of low pollution, low cost, and strong availability. Thus, it has become one of the most popular renewable energies worldwide. However, the main problem of renewable energy sources is uninterruptable energy storage. The storage of energy in batteries is not an efficient, conventional method. Therefore, storage of the energy as hydrogen has been proposed as a new solution. However, converting electricity to hydrogen energy and connecting it to the grid, and the necessary technology investments complicate this transformation. Solar collectors and solar cells are two different methods of absorbing solar power available today. Today, this energy can absorb only 20–25% efficiently with various solar cells. Solar radiation changes over time and is not always stable. These disadvantages make it necessary to use a storage system. The conventional storage systems are inadequate and inefficient for the storage of such high energy. Consequently, systems that can convert solar energy into hydrogen become attractive [3,4].
The existing research on electrolysis water concerning hydrogen production projects primarily focuses on alkaline electrolysis systems and Polymer Electrolyte Membrane (PEM) electrolysis. PEM electrolysis has several advantages over conventional alkaline electrolysis systems because of its ecological cleanliness, simplicity, high efficiency, and accessible production capacity [5,6,7]. The present work is aimed at the bottleneck problems restricting the development of renewable energy, including wind and solar, such as the intense volatility, intermittence, and instability of renewable energy power generation; poor electrical energy inadequate for grid connection; and prevailing wind and light abandonment caused by the local load that cannot be absorbed. Hydrogen energy has the advantages of large-scale, long-term storage, wide application, many consumption channels, less environmental pollution, and low requirements for power supply quality due to the hydrogen production load. Converting the waste wind and light of renewable energy into hydrogen energy for storage can effectively improve the utilization rate of renewable energy and reduce the phenomenon of waste wind and sunlight. Combining solar energy, electric energy, and hydrogen energy to establish a system and realize the coordinated dispatch of multiple types of power in the system is conducive to improving energy utilization, reducing the cost of energy supply, and providing new ideas and channels for solving the energy crisis and environmental pollution worldwide. Given the urgent survival problems, such as the gradual decline of non-renewable energy reserves and ecological pollution, multi-energy complementarity is the only course for energy utilization under the new situation. As a form of multi-energy complementarity, the photohydrogen system has achieved extensive research and application scope with the maturity of technology and the continuous improvement of system functions. The orbital of the outermost layer of Pt is in an unfilled state. Its special electronic arrangement makes it easy to adsorb reactant molecules and become the active catalytic center. As a catalyst material for oxygen reduction, Pt can effectively reduce the high overpotential in the process of oxygen reduction and minimize the loss of battery voltage and output power.
Many scientists and researchers have paid attention to the optimization and modeling of various blocks forming the photovoltaic–electrolysis system to obtain the best hydrogen production performance. In particular, Garcia-Valverde optimized the system by coupling the PV module and electrolysis by integrating a controlled power converter. Garrigos combined maximum power point tracking (MPPT) and output current control to optimize the entire system, such as photovoltaic–electrolysis and a direct current to direct current (DC/DC) converter. Bousquet et al. [8] developed an empirical approach to model a generative electrolysis or fuel cell. They put forward a dynamic model of PEM electrolysis and evaluated it by Gorgun. Thomas and Nelson [3] optimized the efficiency of the PV–electrolysis system by adapting the voltage and the maximum power of the PV to the voltage generated by the PEM electrolysis operation. Marshall [3] developed a new catalyst for PEM electrolysis for high hydrogen production. The authors utilized the P&O MPPT algorithm with a PI controller as a solution of the sensitive controller and emphasized the role of DC/DC buck converters. However, they did not optimize the MPPT algorithm to improve the efficiency of solar energy [9].
DC/DC converters are becoming critical for energy conversion. A solution has been suggested to obtain hydrogen gas from water electrolysis and store this gas by compression [10,11]. There are three typical types of electrolytic hydrogen production equipment: proton exchange membrane (PEM) electrolytic cells, high-temperature solid oxide electrolytic cells, and alkaline electrolytic (AE) cells. Some scholars have devoted efforts in related fields. However, they ignored photovoltaic sources and electrolysis loads, or efficient controllers for nonlinear electrolysis loads [9]. Some scholars have studied similar problems, but did not provide more precise details and solutions. Some researchers did not include such simulation and control methods to optimize such systems, nor did they give more detailed simulation results and efficiency analysis. Some proposed a different topology and control method to solve this problem [12]. Generally, there is almost no comprehensive research on electrolytic hydrogen production systems and no detailed solution.
Reference [13] proposed a differential evolution algorithm based on partially shielded photovoltaic modules to improve the tracking efficiency. Reference [8] proposed a maximum power point tracking control algorithm based on the ant colony algorithm, effectively solving the tracking problem of local maximum power points. Literature [14] proposed the MPPT method based on the genetic algorithm to improve the tracking efficiency of the system and effectively track the maximum global power. In reference [15], a firefly algorithm was proposed for the photovoltaic system under partial shade to effectively improve the tracking performance. Wen Xian [10] proposed an improved MPPT tracking algorithm based on the traditional mountain climbing method to enhance the tracking efficiency of the photovoltaic system. However, its large amount of data calculation and algorithm rules lead to low efficiency and increase the cost of the whole system, so it is not suitable for practical engineering. The algorithm proposed in reference [11] combines the cuckoo algorithm and particle swarm optimization (PSO) algorithm, improving the optimization accuracy to a certain extent; however, the mathematical model is complex and not conducive to practical operation. The PSO algorithm proposed in references [9,16] only improves the weight change optimization process, and the shadow case’s improvement effect has limitations. At present, there is only a single optimization method to improve the efficiency of solar energy with a hydrogen converter and improve the utilization rate of solar energy with an improved optimization algorithm. Still, there is no optimization method to combine the two methods [5,9].
An adaptive online adjustment PSO (AOA-PSO) is proposed to solve the above problems. The innovation of this paper lies in two aspects. On the one hand, a linear adjustment factor is adopted. This improved method can quickly derive a new maximum power point voltage. When the environment changes, the search range of MPPT voltage can be adjusted adaptively. On the other hand, recognition is introduced, and the particle position is compared with the set value. The particles with a good recognition effect will directly enter the next iteration better than the set value, and the particles with a poor recognition effect will be replaced with their best position in history. In this way, the PSO algorithm can maintain the search accuracy and speed later. Finally, a simulation model is established in Simulink, and the system is tested on the experimental platform. Compared with the waveform of the traditional MPPT control algorithm, the feasibility of the proposed method and the innovation of the algorithm are verified.

2. Characteristic Analysis and Control of the Photovoltaic Hydrogen Generation System

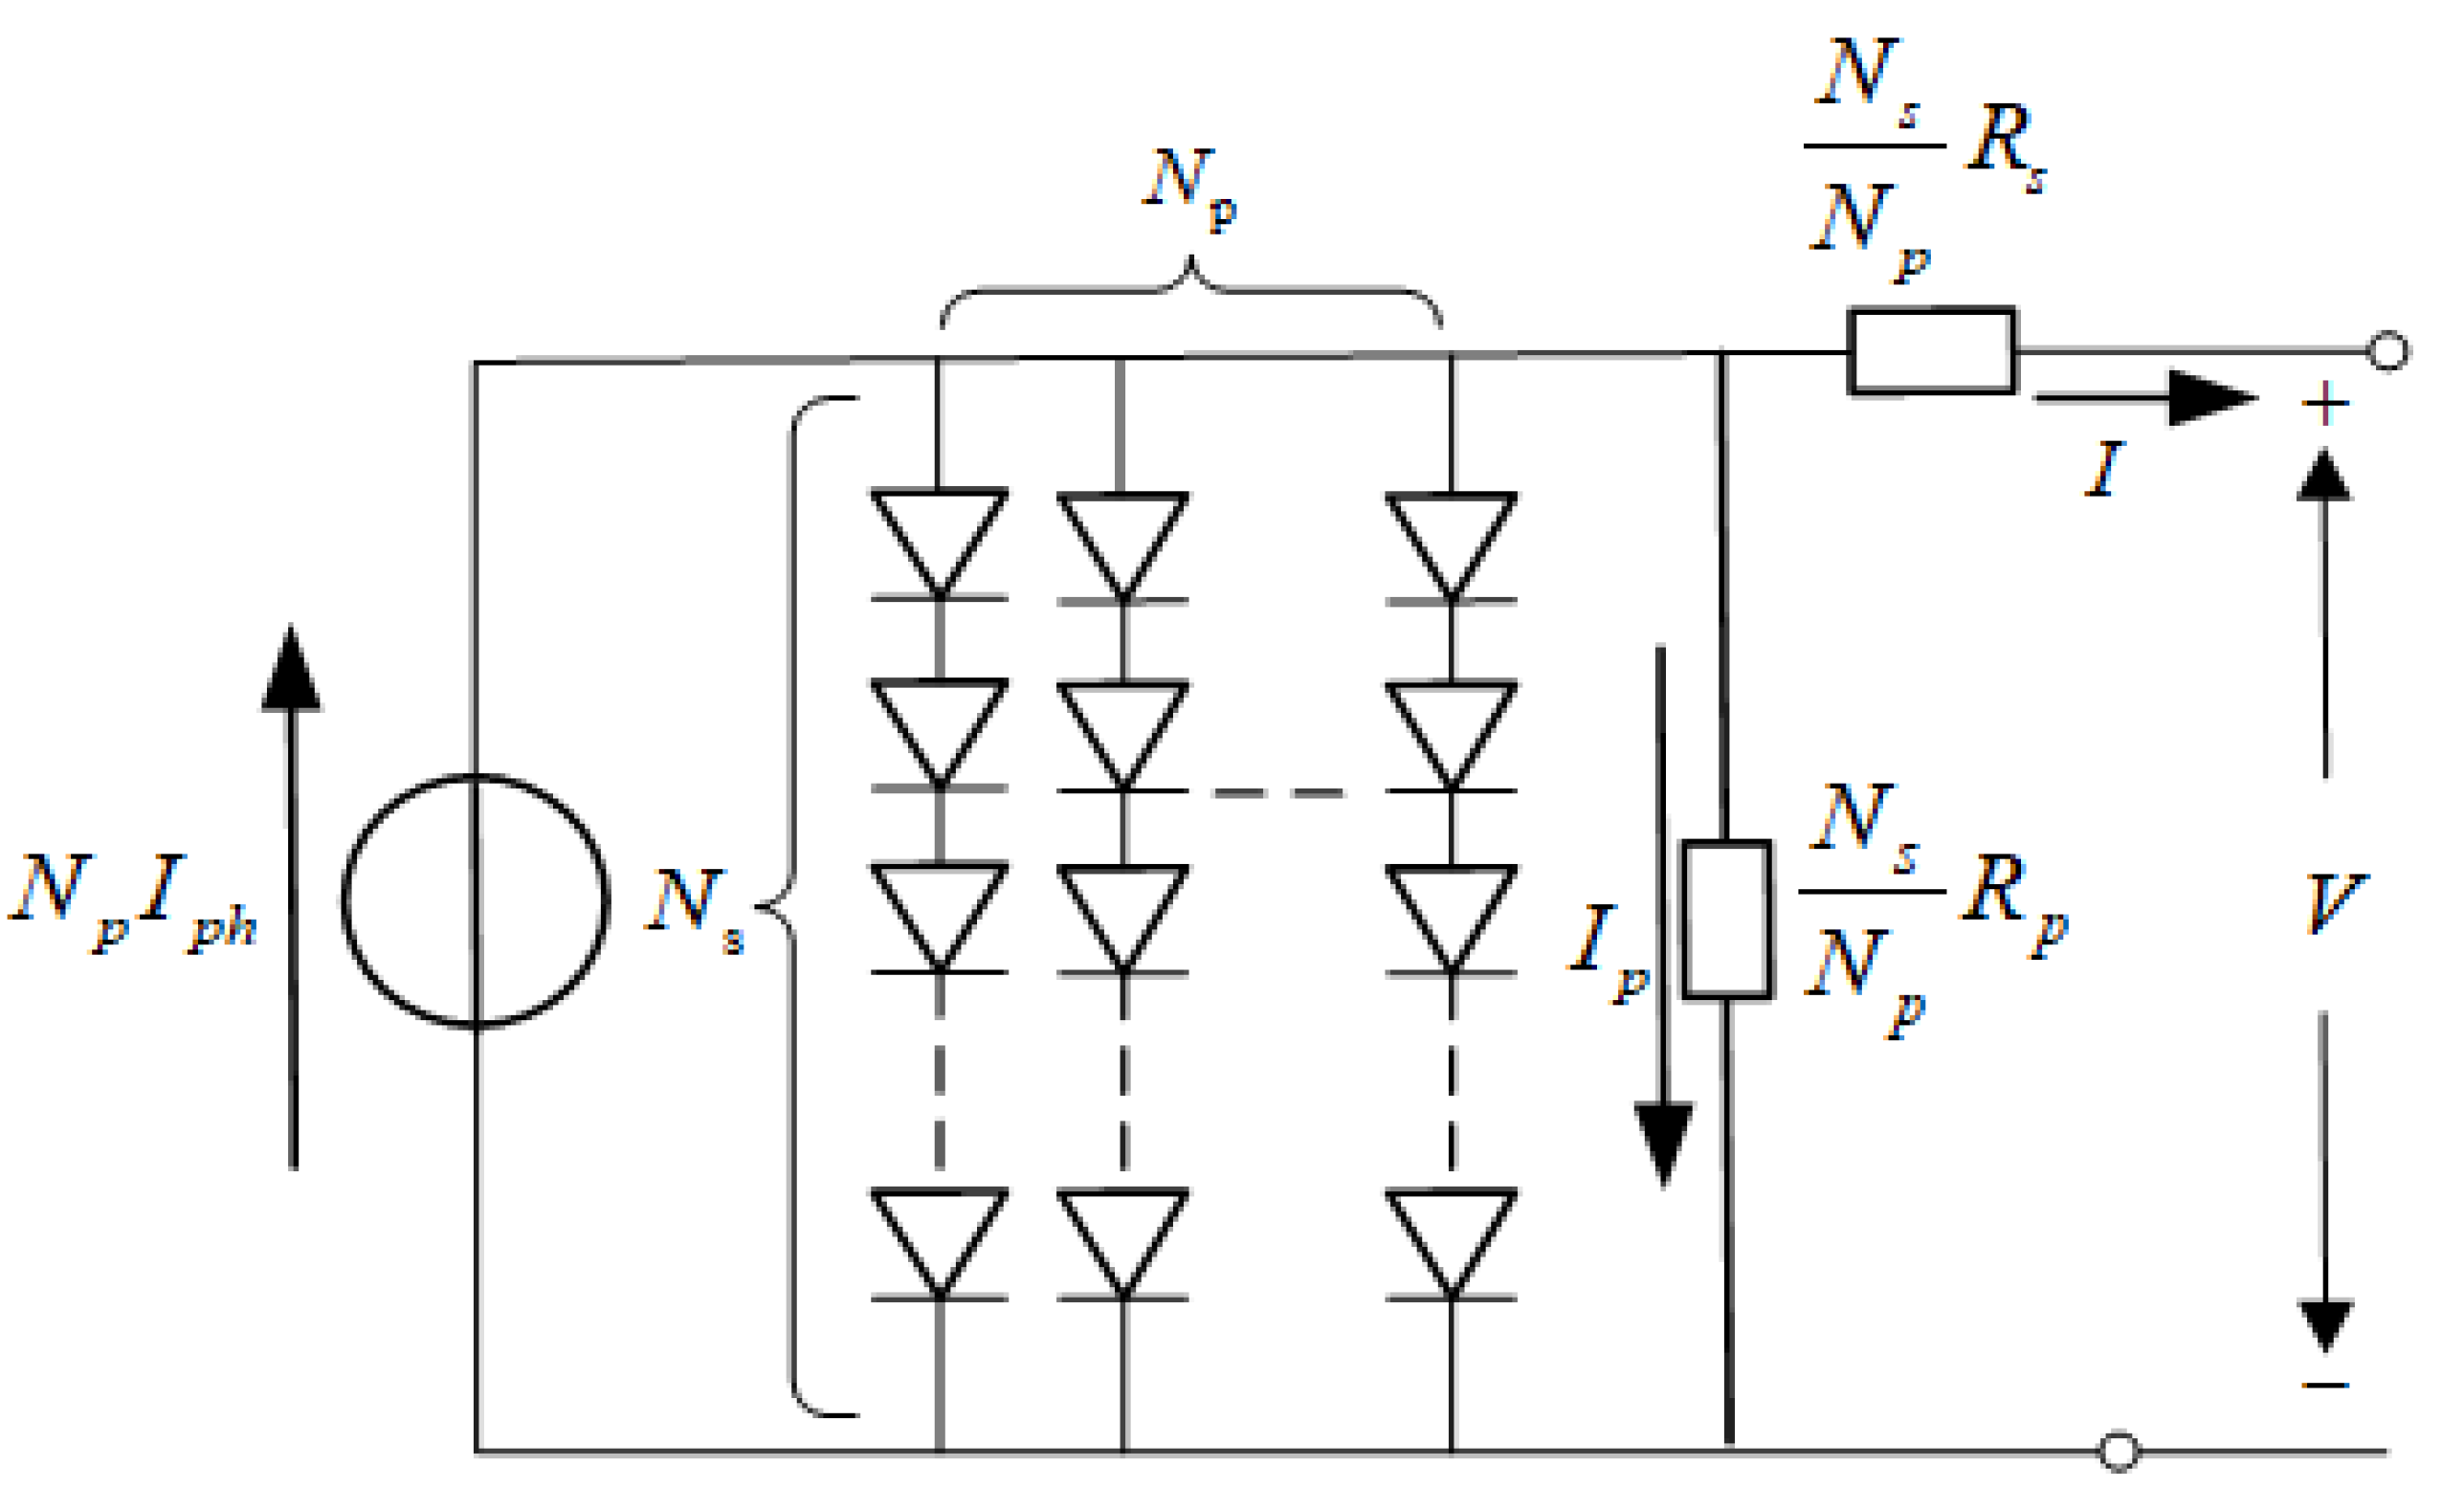
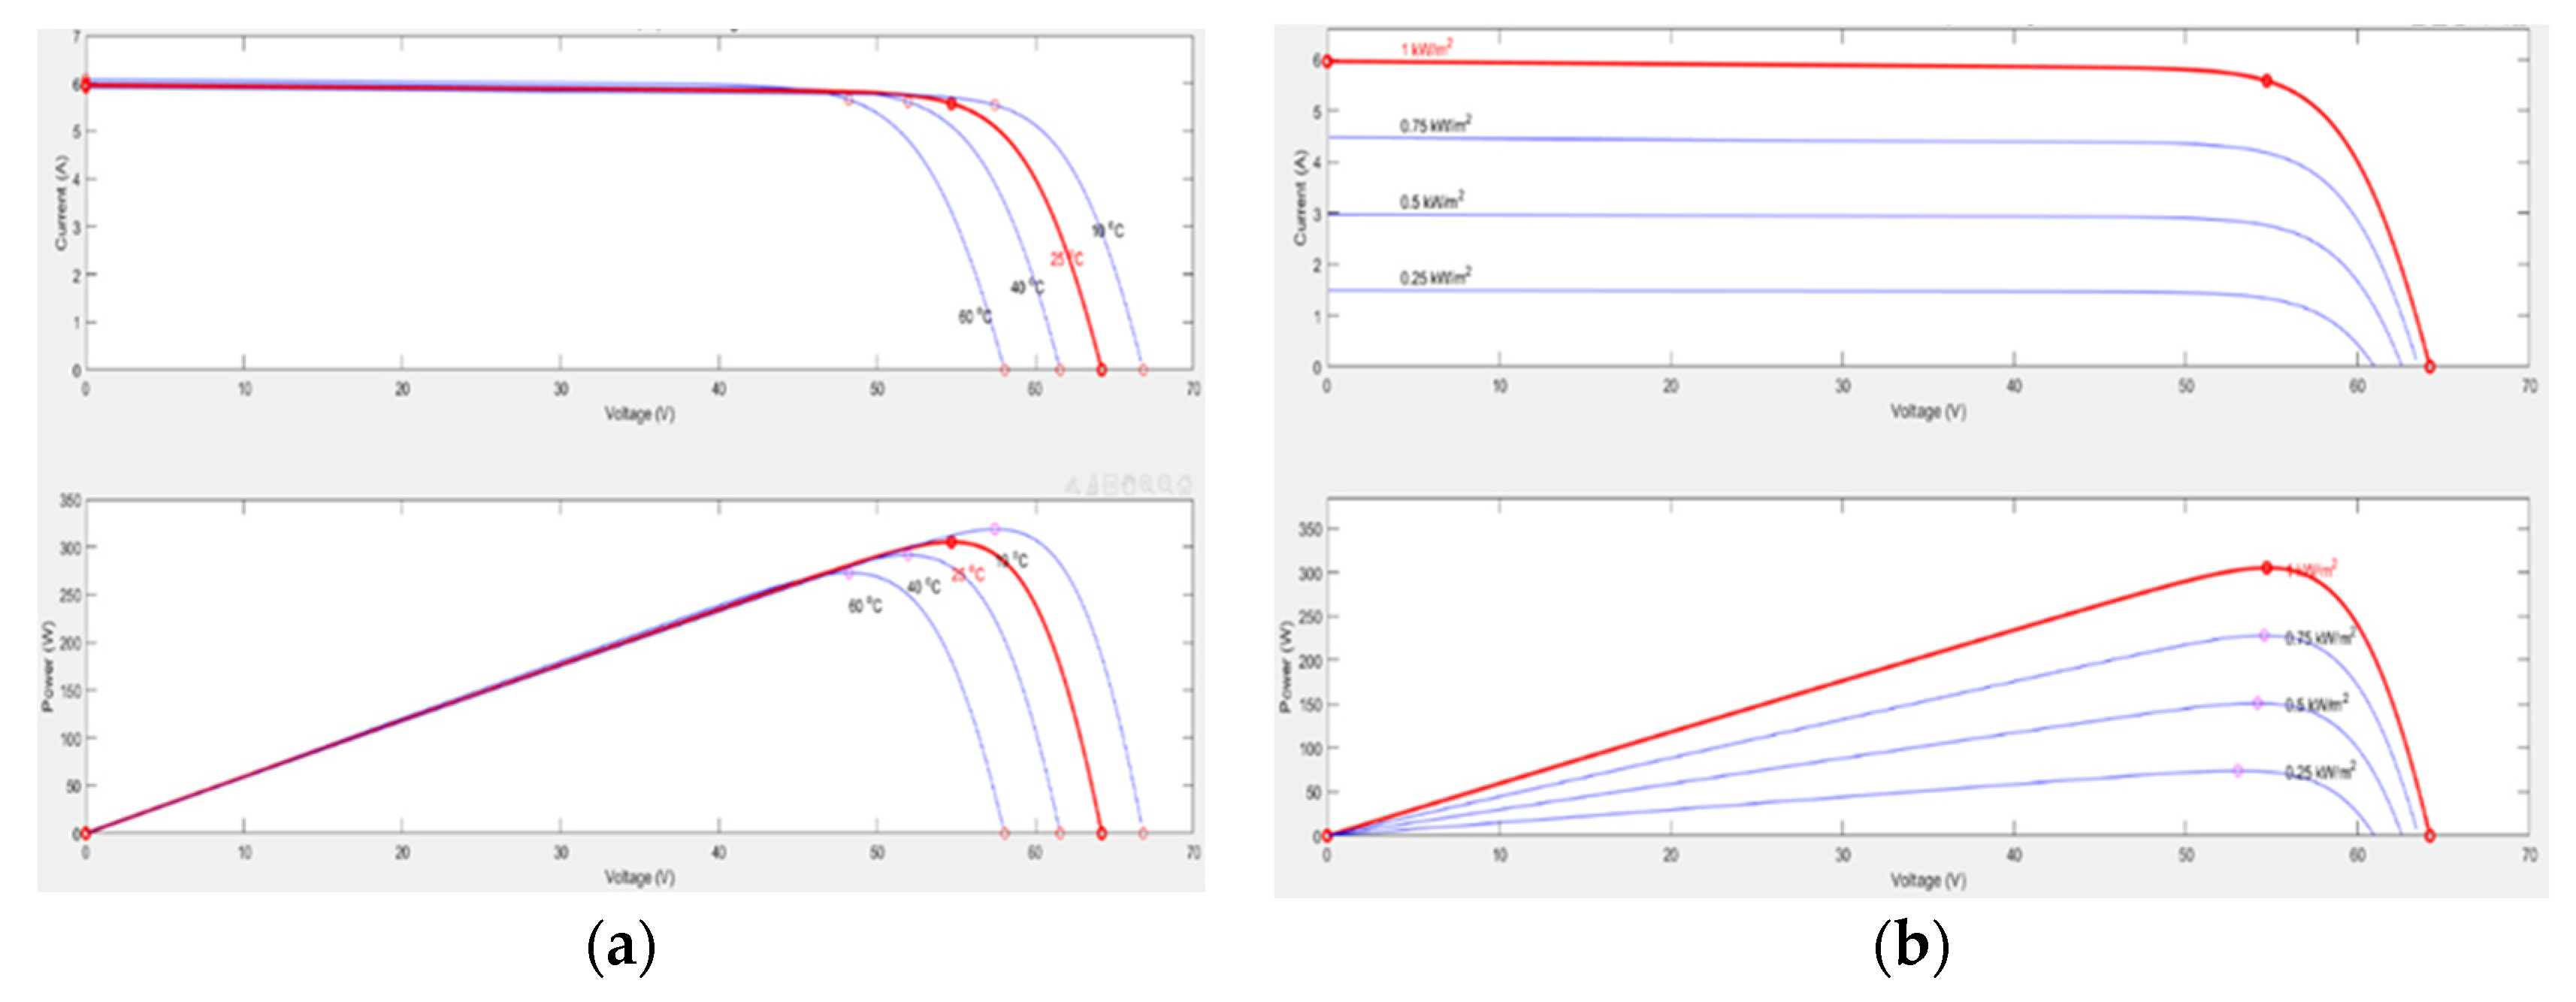
2.1. Mathematical Model and Characteristic Analysis of Photovoltaic Cells

A photovoltaic module consists of several solar cells connected in series or parallel to achieve the desired voltage and current levels. A solar panel cell is essentially a PN semiconductor junction that can generate DC when exposed to light. The simple single diode model shown in Figure 1 is adopted here [16], achieving the balance between clarity and precision.
The equivalent circuit of the general model consists of a photo current ( I p h ), a diode, a parallel resistance ( R p ) expressing a leakage current, and a series resistance ( R s ) due to the contacts between the semiconductors and the metal parts. This equivalent circuit is depicted in Figure 1.
Kirchhoff’s law is applied. The current in Figure 1 is calculated according to Equation (1).
I = I p h I D I p
In Equation (1), I p h represents the current generated by light or the photocurrent, and I p denotes the current flowing in the parallel resistor, which can be described as:
I p = V + R s I R p
The power of a typical photovoltaic cell at 0.5 V is less than 2 W, so cells must be connected in series–parallel on a module to produce sufficient power [3]. As presented in Figure 2, a photovoltaic array is a group of several photovoltaic modules electrically connected in series ( N s cells) and in parallel ( N p columns) to generate the required current and voltage.
The voltage–current characteristics of a photovoltaic module can be expressed as:
I p v = N p I p h N p I s d [ exp ( q ( V p v N s + I R s N p ) K T n ) 1 ] ( N p V p v N s + I R s ) R p
P = I p v × V p v
Light and temperature will affect the output performance of the cell. Figure 3 reveals the packaging model of photovoltaic cells established in the simulation environment according to the internal mathematical model.
The test temperatures were 10 °C, 25 °C, 40 °C, and 60 °C. Figure 4b shows the relationship between the output characteristics of the photovoltaic cells and light intensity when the ambient temperature remains unchanged at 25 °C. The tested light intensities were 250 W/m², 500 W/m², 750 W/m², and 1000 W/m². Comprehensive analysis indicated that the output characteristics of photovoltaic cells were easily affected by external environmental conditions, showing obvious nonlinear characteristics; the influence of light intensity on the maximum output power was far greater than that of environmental temperature on the maximum output power. It can be seen from Figure 4c that the hydrogen production rate of the alkaline electrolytic cell was proportional to the current of the electrolytic cell, and the hydrogen production rate per unit time also increased with the increase of the current.
Figure 5 shows the photovoltaic system reported here. An intelligent MPPT algorithm based on PSO and AOA-PSO was utilized, as explained in Section 3. These algorithms aim to compensate for the limitations of conventional maximization algorithms, which cannot find the overall maximum, especially during a partial shading phenomenon. Regardless of the partial shading profile, it can find the maximum power point on the power–voltage characteristic (Ppv) of a photovoltaic system. This characteristic is usually referred to as Ppv = f (Vpv). The algorithm was applied to the semiconductor switch of the boost converter installed to connect the photovoltaic panels to the DC link. Specifically, the duty cycle of this device was adjusted according to the output of the intelligent MPPT algorithm. In this paper, Vout represents the voltage required to charge the cell.
The parameters of the Simulink package model are set to test the output characteristics of photovoltaic cells. Experiments suggest that the P–U change of the photovoltaic cells is a single-peak characteristic curve. Its power changed positively with the voltage initially, while changing negatively after reaching the threshold. The voltage can be optimized according to this law. If the photovoltaic cell continues to work in the maximum power state, the working efficiency of the photovoltaic power generation system can be improved [9]. When the system is working in the maximum power tracking mode, it will turn on the switch to collect voltage and current signals. Then, the collected current and voltage are sent to the top power tracking module. The reference value is obtained through the corresponding algorithm, and the reference value is compared with the actual value of the sample. The comparison results are input into the proportional-integral regulator. The proportional integral regulator generates a control signal after the pulse width modulation (PWM) processing. The control signal is used for maximum power control and sent to the boost conversion circuit to complete tracking. The PWM signal is input into the boost converter circuit to realize constant voltage control. MPPT model is the core of the photovoltaic system. Multimodal MPPT is mainly divided into two categories. The photovoltaic array can be reassembled according to the output characteristics and transformed into a single peak maximum power tracking problem [21]. The principle of this method is still the single-peak MPPT algorithm, so they have the same advantages and disadvantages. The other is the control method based on artificial intelligence, conforming to the modern control theory, which has good adaptability to nonlinear problems and has good adaptability to global search. However, the development of multi-peak maximum power tracking is still restricted by multiple factors, such as the timeliness of monitoring and the correctness and effectiveness of the global search method [22,23].

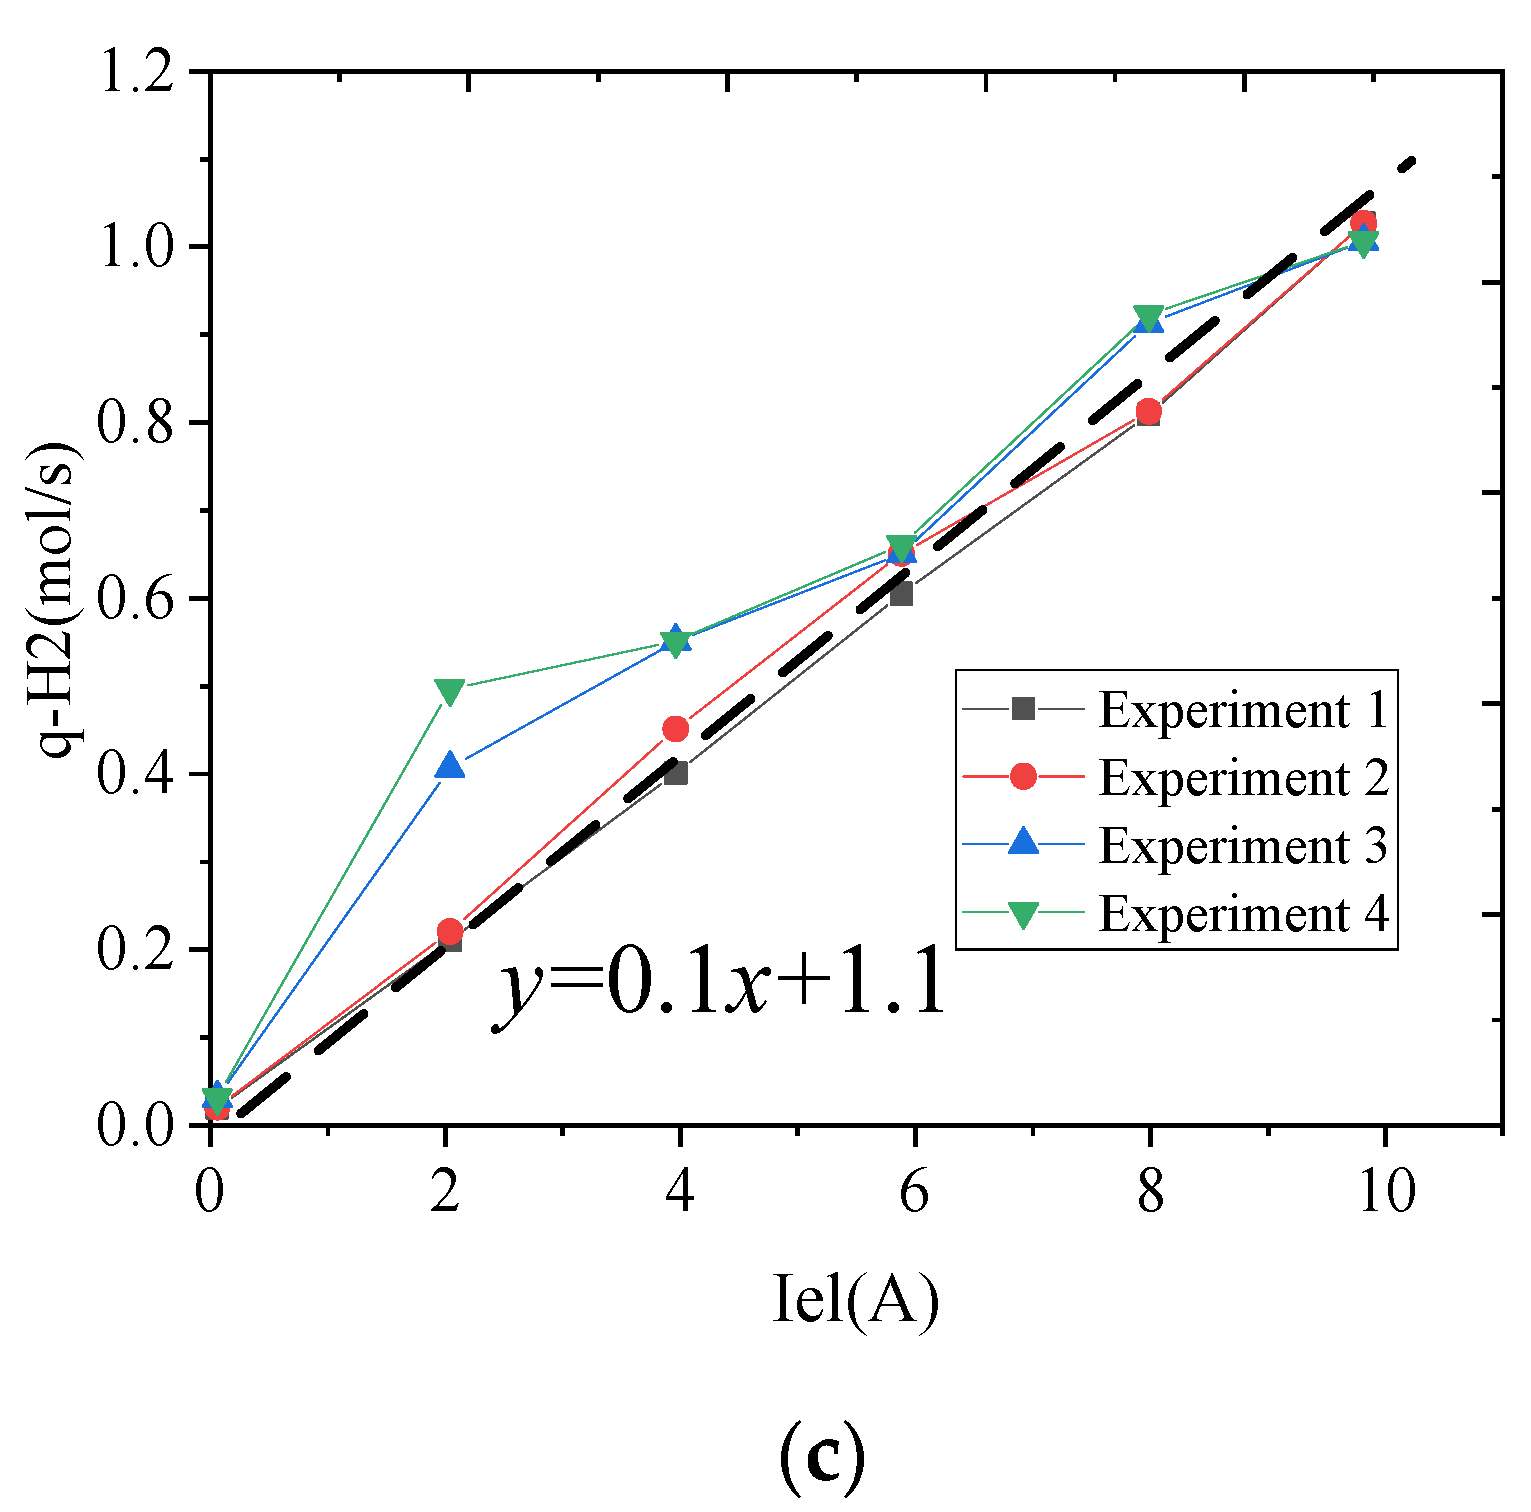
2.2. Electrolysis Load Model

The electrolyzer behaves as a nonlinear resistance during the chemical reaction in reality. This nonlinearity depends on the chemical composition of the solution, the pressure of the electrolyzer stack, temperature, and the other parameters that exist during the chemical reaction. The derived nonlinear mathematical model of the electrolyzer depends on the parameters given in Equation (5).
R e = R e o [ 1 + α ( I e I e b a s e ) β ]
In Equation (5), Reo represents the initial resistance and its value is 0.08 Ω, and α and β stand for constant values relying on the nonlinear characteristics of the electrolyze model. The value of α ranges between 0.35 and 0.65, and that of β ranges from 2 to 4 in typical applications, which are substituted into Equation (6). Equation (6) indicates the relationship between electrolysis resistance and electrolysis current. The electrolysis nonlinear load model was simulated in MATLAB/Simulink using Equation (6), as shown in Figure 5.
R e = 0.08 [ 1 + 0.5 ( I e 50 ) 3 ]
Combining a photovoltaic power generation system with a hydrogen production system can significantly reduce the energy loss of solar energy and improve the utilization efficiency of solar energy.
Figure 6 shows the overall simulation model of the photovoltaic hydrogen generation system.
The system exchanges power with each energy unit through the converter during operation. Figure 6 shows the power flow diagram of the photovoltaic power generation system in the independent operation mode.

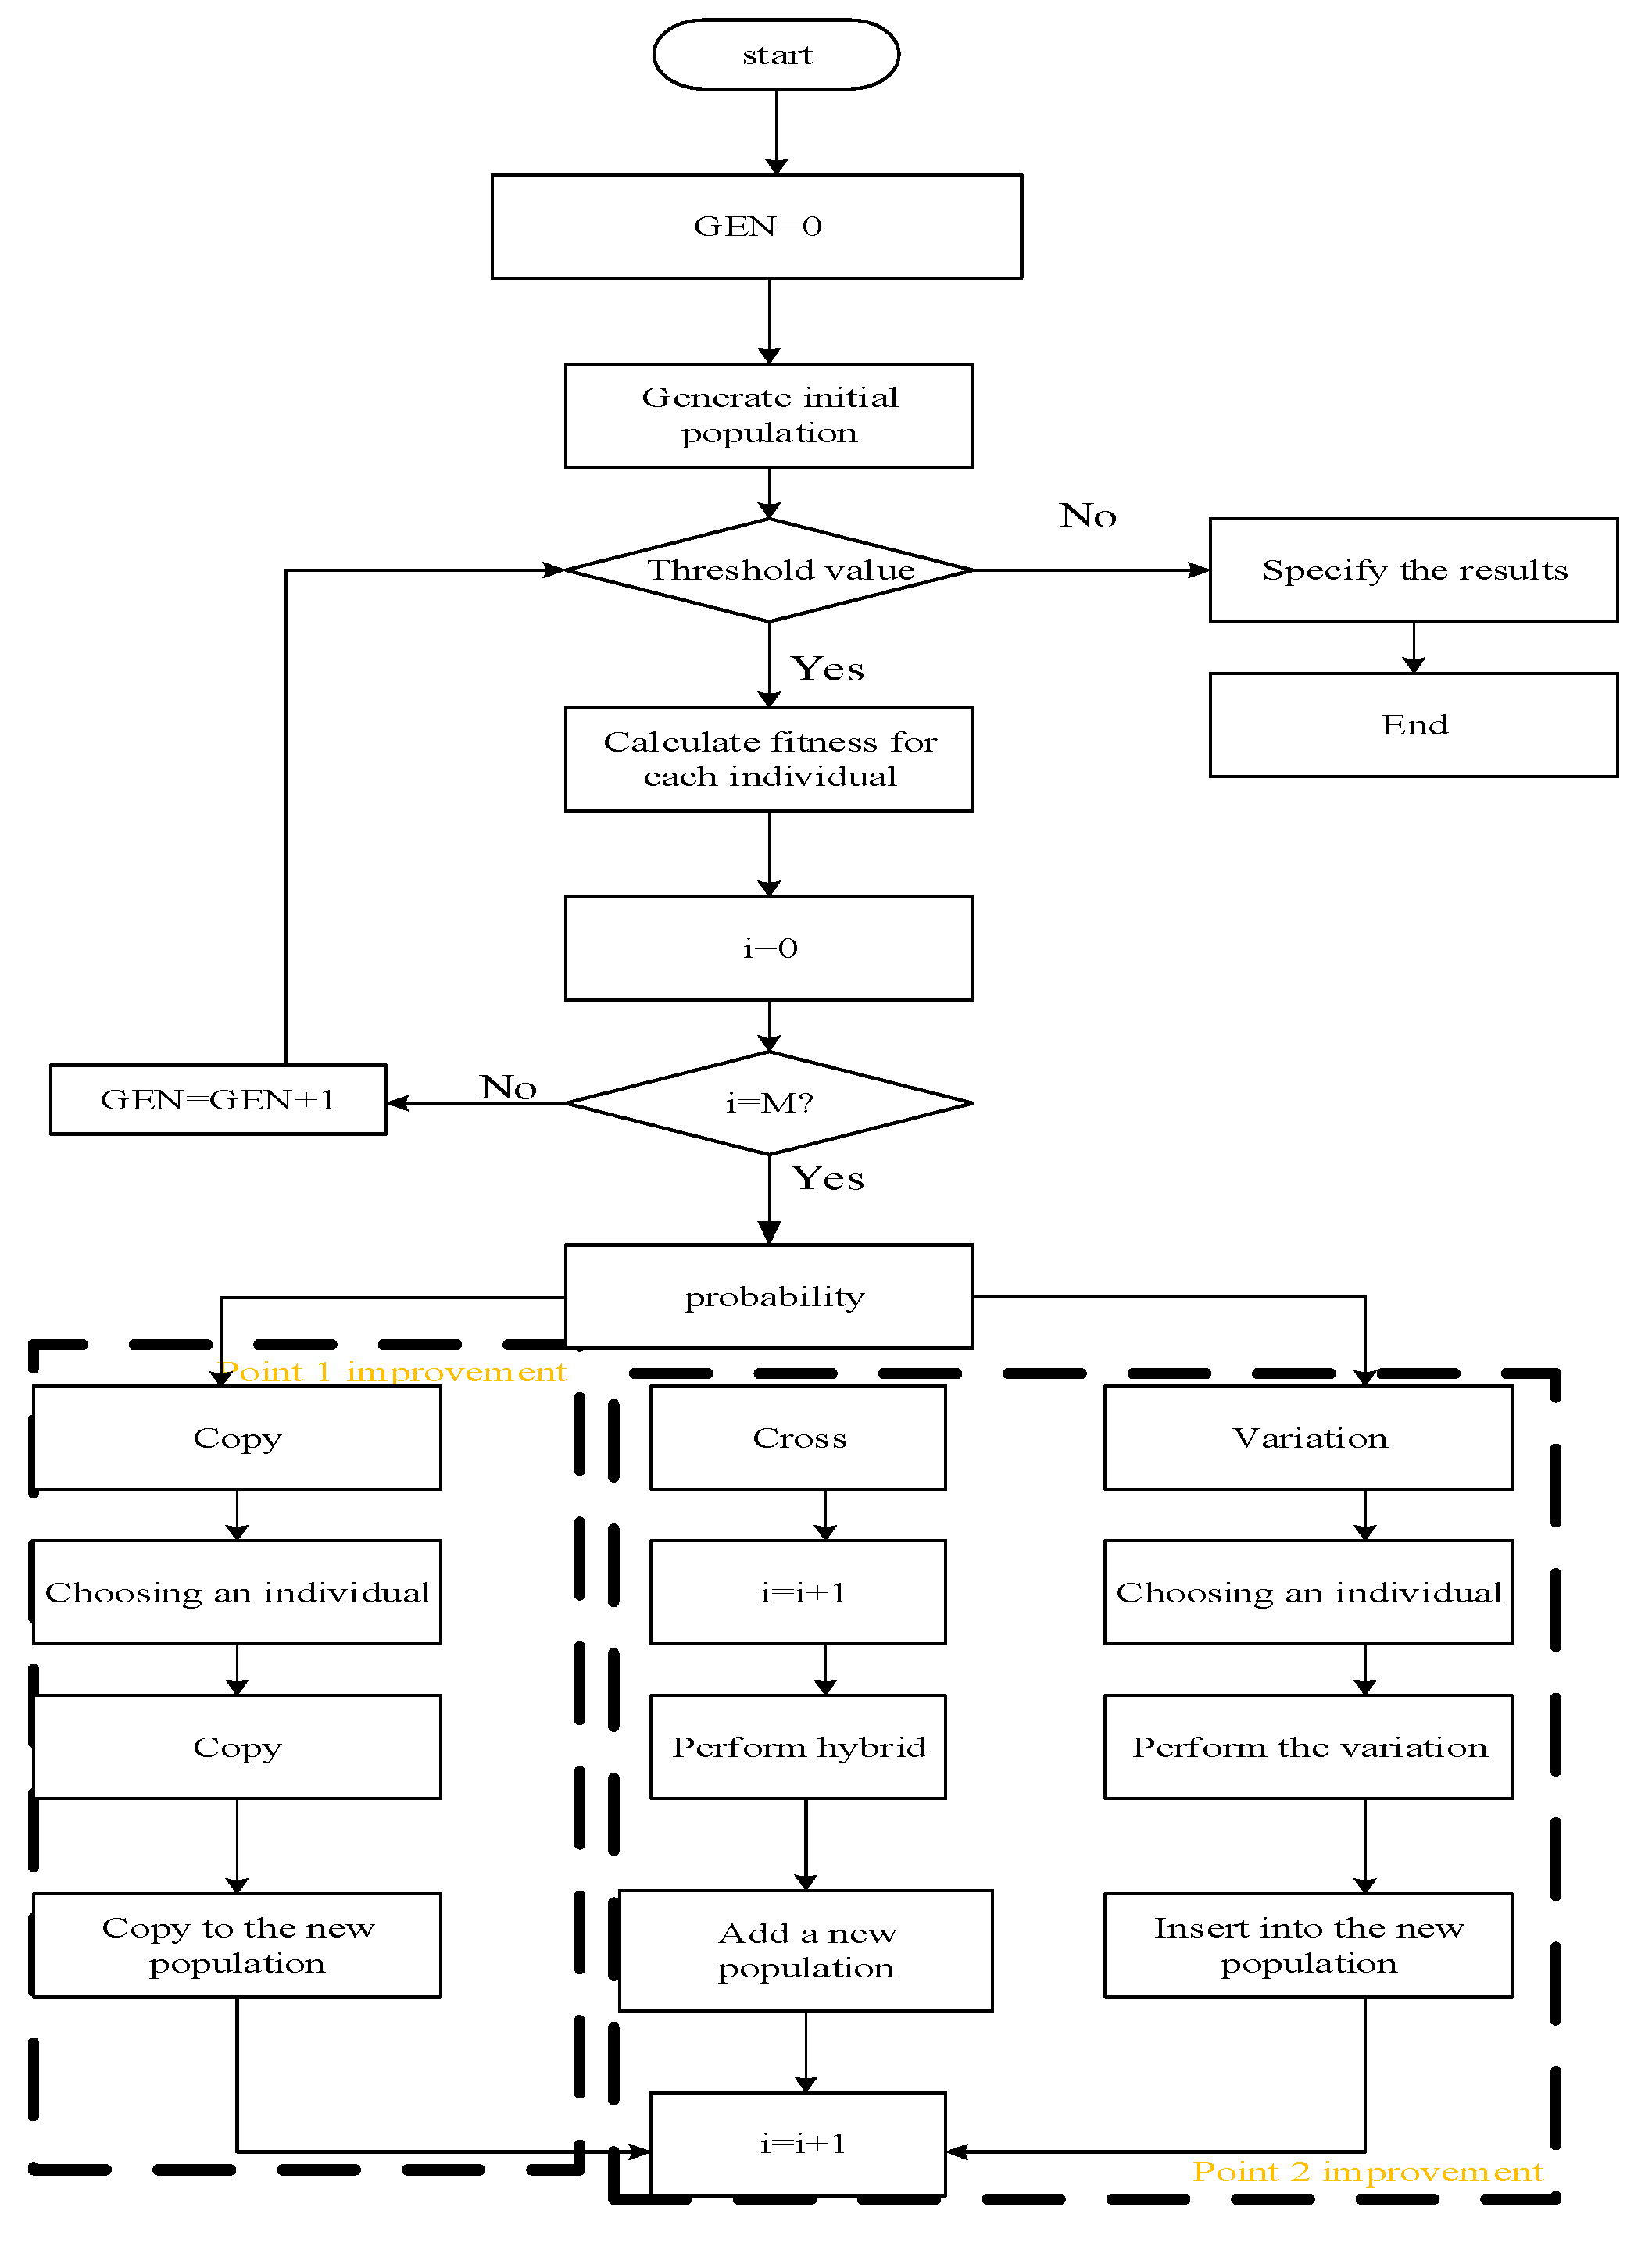
2.3. PSO Algorithm and Improved PSO Algorithm

In recent years, intelligent algorithms applied to photovoltaic power generation systems have been widely studied, among which the PSO algorithm is one of the most effective algorithms [24,25]. The cell’s output voltage is the flying particle continuously moving towards the maximum power point. The update of the flight velocity and flight position of each particle can be written as:
v i k + 1 = w v i k + c 1 r 1 ( p i k X i k ) + c 2 r 2 ( p g k X i k )
x i k + 1 = x i k + v i k + 1
where w denotes the inertia weight, while c 1 and c 2 are the acceleration constant, and r 1 and r 2 are random numbers between 0 and 1. Besides, i is the ith particle, and k refers to the number of iterations. Meanwhile, X i k indicates the position of the ith particle in the kth cycle, v i k is the position of the ith particle in the kth cycle, and p g k stands for the optimal global value of the kth cycle. Moreover, p i k is the optimal value of the individual particle in the kth cycle. The individual particle is updated according to Equation (9).
p i k + 1 = { p i k f ( x i k + 1 ) f ( p i k ) x i k + 1 f ( x i k + 1 ) f ( p i k )
p g k + 1 = { x i k + 1 f ( x i k + 1 ) f ( p g k ) p g k f ( x i k + 1 ) f ( p g k )
The particle with higher velocity is farther away from the maximum power point, while the particle with lower velocity is closer to the maximum power point. After several iterations of the control loop, all particles gradually gather and oscillate in a small range, and the maximum power point is determined. Figure 6 shows the traditional and improved process of the PSO algorithm.
The selection of the initial value of the algorithm plays a crucial role in the application of the PSO algorithm to the real-time control of MPPT. The selected initial value should contain more compelling information, avoid focusing on local voltage, and be distributed in the effective output voltage range as evenly as possible. Furthermore, the number of particles must also be considered. Compared with the traditional MPPT control algorithm, the basic PSO algorithm can achieve faster and more accurate control in complex environments. However, compared with the conventional MPPT algorithm, the basic PSO algorithm is more complex, has more parameters, and depends more on the initial particle setting. In some cases, it also has shortcomings, such as low precision and divergence. Therefore, many scholars focus on improving the performance of the PSO algorithm and put forward many performance improvement methods, such as using the random function to generate the initial value of particles. Although the application of the PSO algorithm has made significant progress, its application in photovoltaic power generation control technology is still in its infancy. Therefore, it is crucial to study a more effective control system algorithm [26].
According to the basic PSO algorithm, when the photovoltaic power generation system reaches stability, the particles almost converge at the maximum power point, so each particle loses ergodicity. The valuable information content will be dramatically reduced. Suppose the temperature and light intensity in the environment suddenly change or occlusion occurs. In that case, the algorithm may fall into a local maximum point and misjudge, resulting in the energy loss of the whole system. Therefore, the judgment conditions need to be set so that, when the environmental factors suddenly change, the basic PSO algorithm restarts the initialization program to find another maximum power point, as shown in Figure 7.
Based on the above analysis, four particles are used here to describe the algorithm, as shown in Equations (11) and (12).
| Δ v k | = | U 1 ( k ) U 1 ( k 1 ) , U 2 ( k ) U 2 ( k 1 ) , U 3 ( k ) U 3 ( k 1 ) , U 4 ( k ) U 4 ( k 1 ) | < Δ V
| p k p k 1 | p k 1 > Δ P
Equation (11) determines whether the system is in a stable state. If the speed of the four particles is less than ΔV, the system is considered to converge near the maximum power point. At this time, the particle swarm program is stopped, and the voltage reference value of the DC side controller is identified as the optimal value for eliminating the steady-state error. When the battery output voltage remains constant but the output power changes, it can be judged that the environment has a mutation, as shown in Equation (12). In this case, the algorithm needs to initialize the program. This method can effectively prevent the PSO algorithm from falling into the local maximum under harsh environments and shadow occlusion. No matter how the climate changes, the system will be reasonably optimized in the open-circuit voltage range, which will bring significant oscillation to the system.
In Equation (11), U ( k ) denotes the voltage of the particle in the kth cycle, Δ v k refers to the speed of each particle, and ΔK represents the steady-state judgment constant of the environment. In Equation (12), ΔP refers to the threshold constant of the environmental assessment, p k 1 represents the real-time change rate of power, and p k denotes the cyclic output power of the system in the kth cycle.
According to the analysis of the output characteristics of the battery, the ratio of the maximum power change ΔP of the battery to the maximum power point voltage change is a constant value and is not affected by light. Therefore, to reduce the optimal oscillation of the above algorithm, a new maximum power point voltage was derived by the logical relationship among the real-time power change, the linear slope, and the old maximum power point voltage, which can be expressed as Equation (13).
X n e w = X o l d 1 K 1 ( P o l d M P P P )
In Equation (13), X n e w denotes the new maximum power point voltage, while X o l d means the old maximum power point voltage. Denote K 1 as the linear slope, Δ = Δ P M P P / Δ U M P P , P o l d M P P as the old MPP power, and P as the real-time power. The analysis of the P–U curve of photovoltaic cells indicates that, when the light intensity increases, the new maximum power point is located on the right side of the original high-power point, meaning that the slope increases. On the contrary, when the light intensity decreases, the new maximum power point is located on the left side of the original high-power point, and the linear slope is significantly smaller than that when the light intensity increases; in other words, the slope decreases. Therefore, the change value of light was calculated by Equation (14).
k 1 = { k 1             i f Δ P > 0 k 1 / 2       i f Δ P < 0
In Equation (14), ΔP denotes the real-time power change rate.
The concept of recognition was introduced into the PSO algorithm. Recognition used here refers to identifying excellent and harmful particles. The position of bad particles is improved after recognition, and the position of suitable particles is iterated into a better place. Firstly, particle recognition is defined as the ratio of the optimal trajectory value of each particle to the optimal global value of the group and is mathematically expressed as Equation (15):
r i k = f ( P i k ) f ( P g k ) × 100 %
X i K + 1 = {           P i k             r i k < α X i k + 1 + X i k 2     r i k α
The recognition is an objective understanding of particles through their understanding and group communication. Therefore, the recognition r i k is used to judge the particle’s spatial geographical location. The identification method was set as Equation (15). Set α = 50%, and recognition r i k ∈ [0, 1]. The greater the recognition value, the better the particle’s spatial location, and the closer it is to the currently searched global maximum. On the contrary, the smaller the recognition value, the worse the particle’s own spatial location, and the farther it is from the best location. α was set to 50% to objectively reflect the actual situation. Of course, this value can also be partially increased or decreased. After comparing the recognition with α, it exceeded 50%, which indicates that it is good to obtain the current position by comparing with itself and group particles. Therefore, Equation (16) can be used for a better search. 1. If r i k < α = 50%, the particle obtains its poor spatial position through its communication with other particles in the group. 2. In the basic PSO, the inertia coefficient w represents the particle operating amplitude, which plays an important role in searching for the optimal value. In the initial stage of the algorithm, the particles gather. At this time, a slightly larger weight can reduce the possibility of particles falling into local optimization. In the later stage, the high degree of particle evolution and reducing the weight w are more conducive to accelerating the search speed and improving the accuracy. Therefore, the study will improve w . The improved w is defined as Equation (17), and k is the current number of iterations:
w = 1 0.1 k
Finally, the derived update of flight velocity and flight position of each particle are shown in Equations (18) and (19)
v i k + 1 = ( 1 0.1 k ) v i k + c 1 r 1 ( p i k X i k ) + c 2 r 2 ( p g k X i k )
x i k + 1 = x i k 1 K i ( P o l d M P P P ) + v i k + 1
In Equation (19), the value of K i depends on the ratio of the change value of MPPT power to the change value of MPPT voltage, that is, the change of the linear slope.
The traditional perturbation and observation method (TPOM), incremental admittance method (IAM), fixed-value restart particle swarm optimization (FVR-PSO) algorithm, and AOA-PSO algorithm were tested on the experimental platform. Besides, the intelligent power module was used as a BOOST circuit to perform the MPPT control experiment. The testing time was 3 pm on a day in mid-March, and the ambient temperature was 26 °C. This experiment was carried out under uneven natural light to test the algorithm’s performance under the condition of blocking the photovoltaic array. In the investigation, the interference step was 0.5 V and the reference voltage was 40 V.
Under natural conditions, the open-circuit voltage of the photovoltaic array measured by the instrument was 55 V. The parameters of the PSO algorithm are shown in Table 1. The AOA-PSO algorithm and FVR-PSO algorithm were tested under the condition that the sampling interval of the system was 0.1 s.

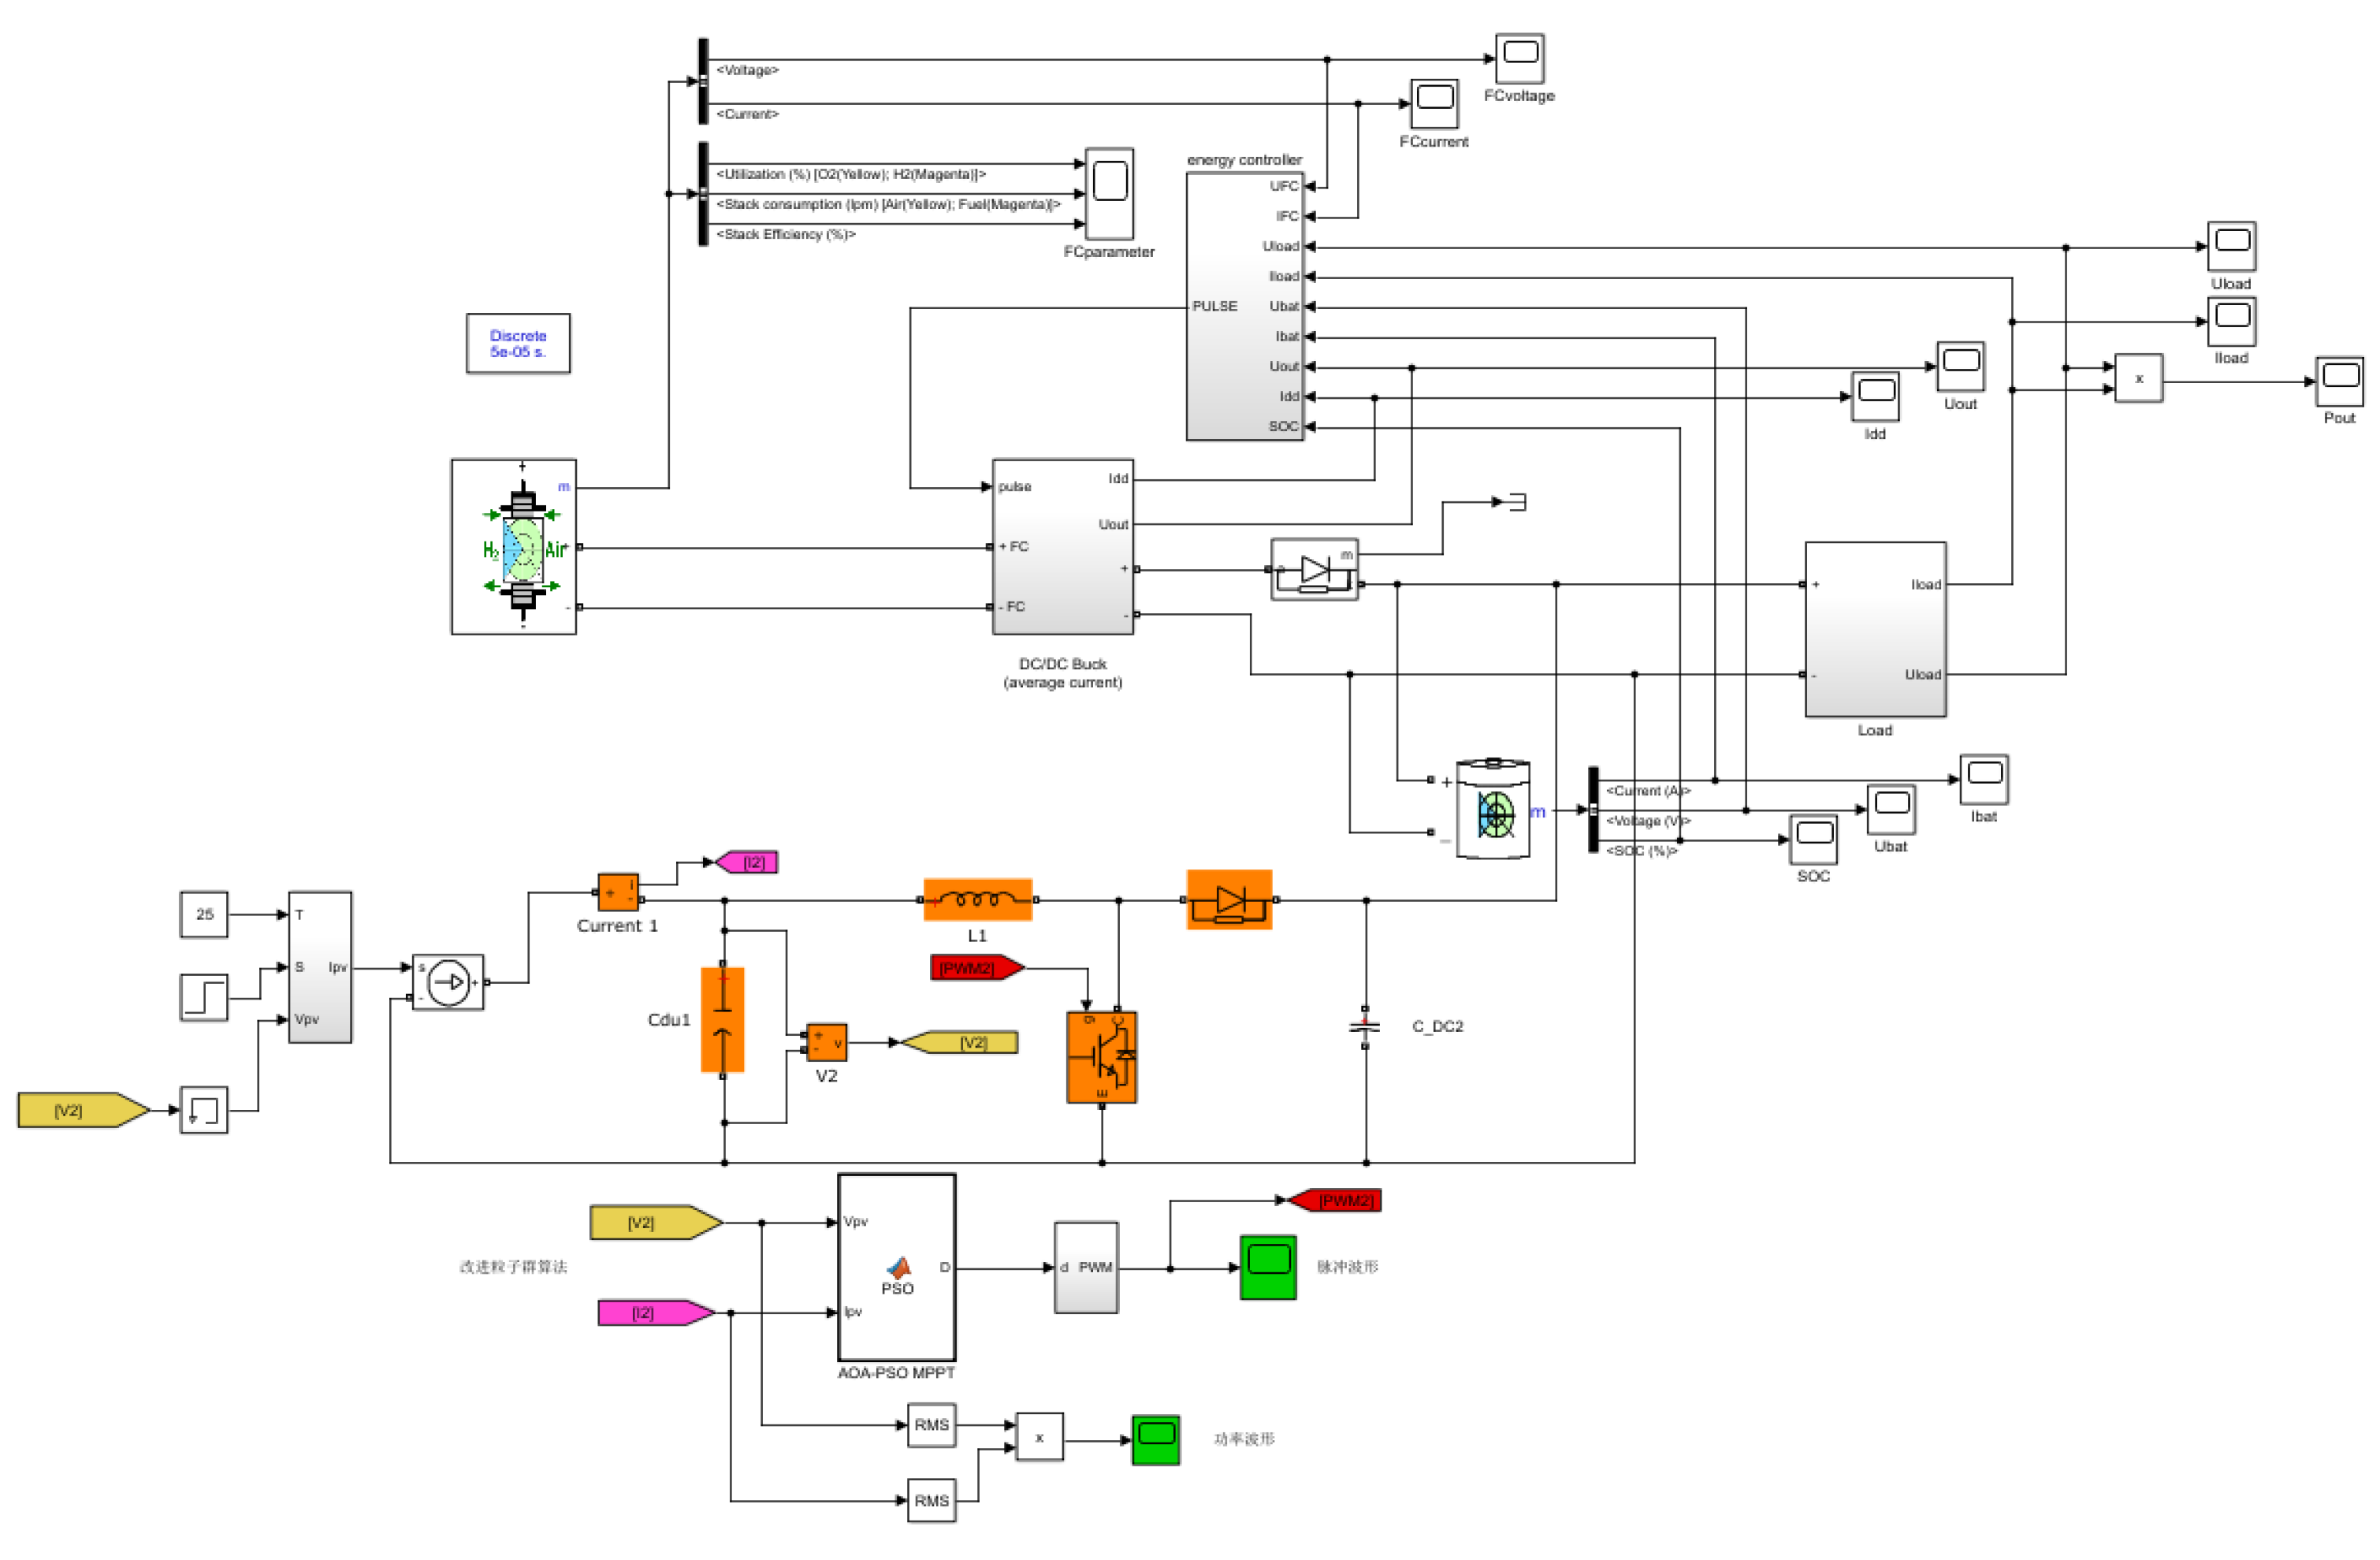
3. System Test and Analysis

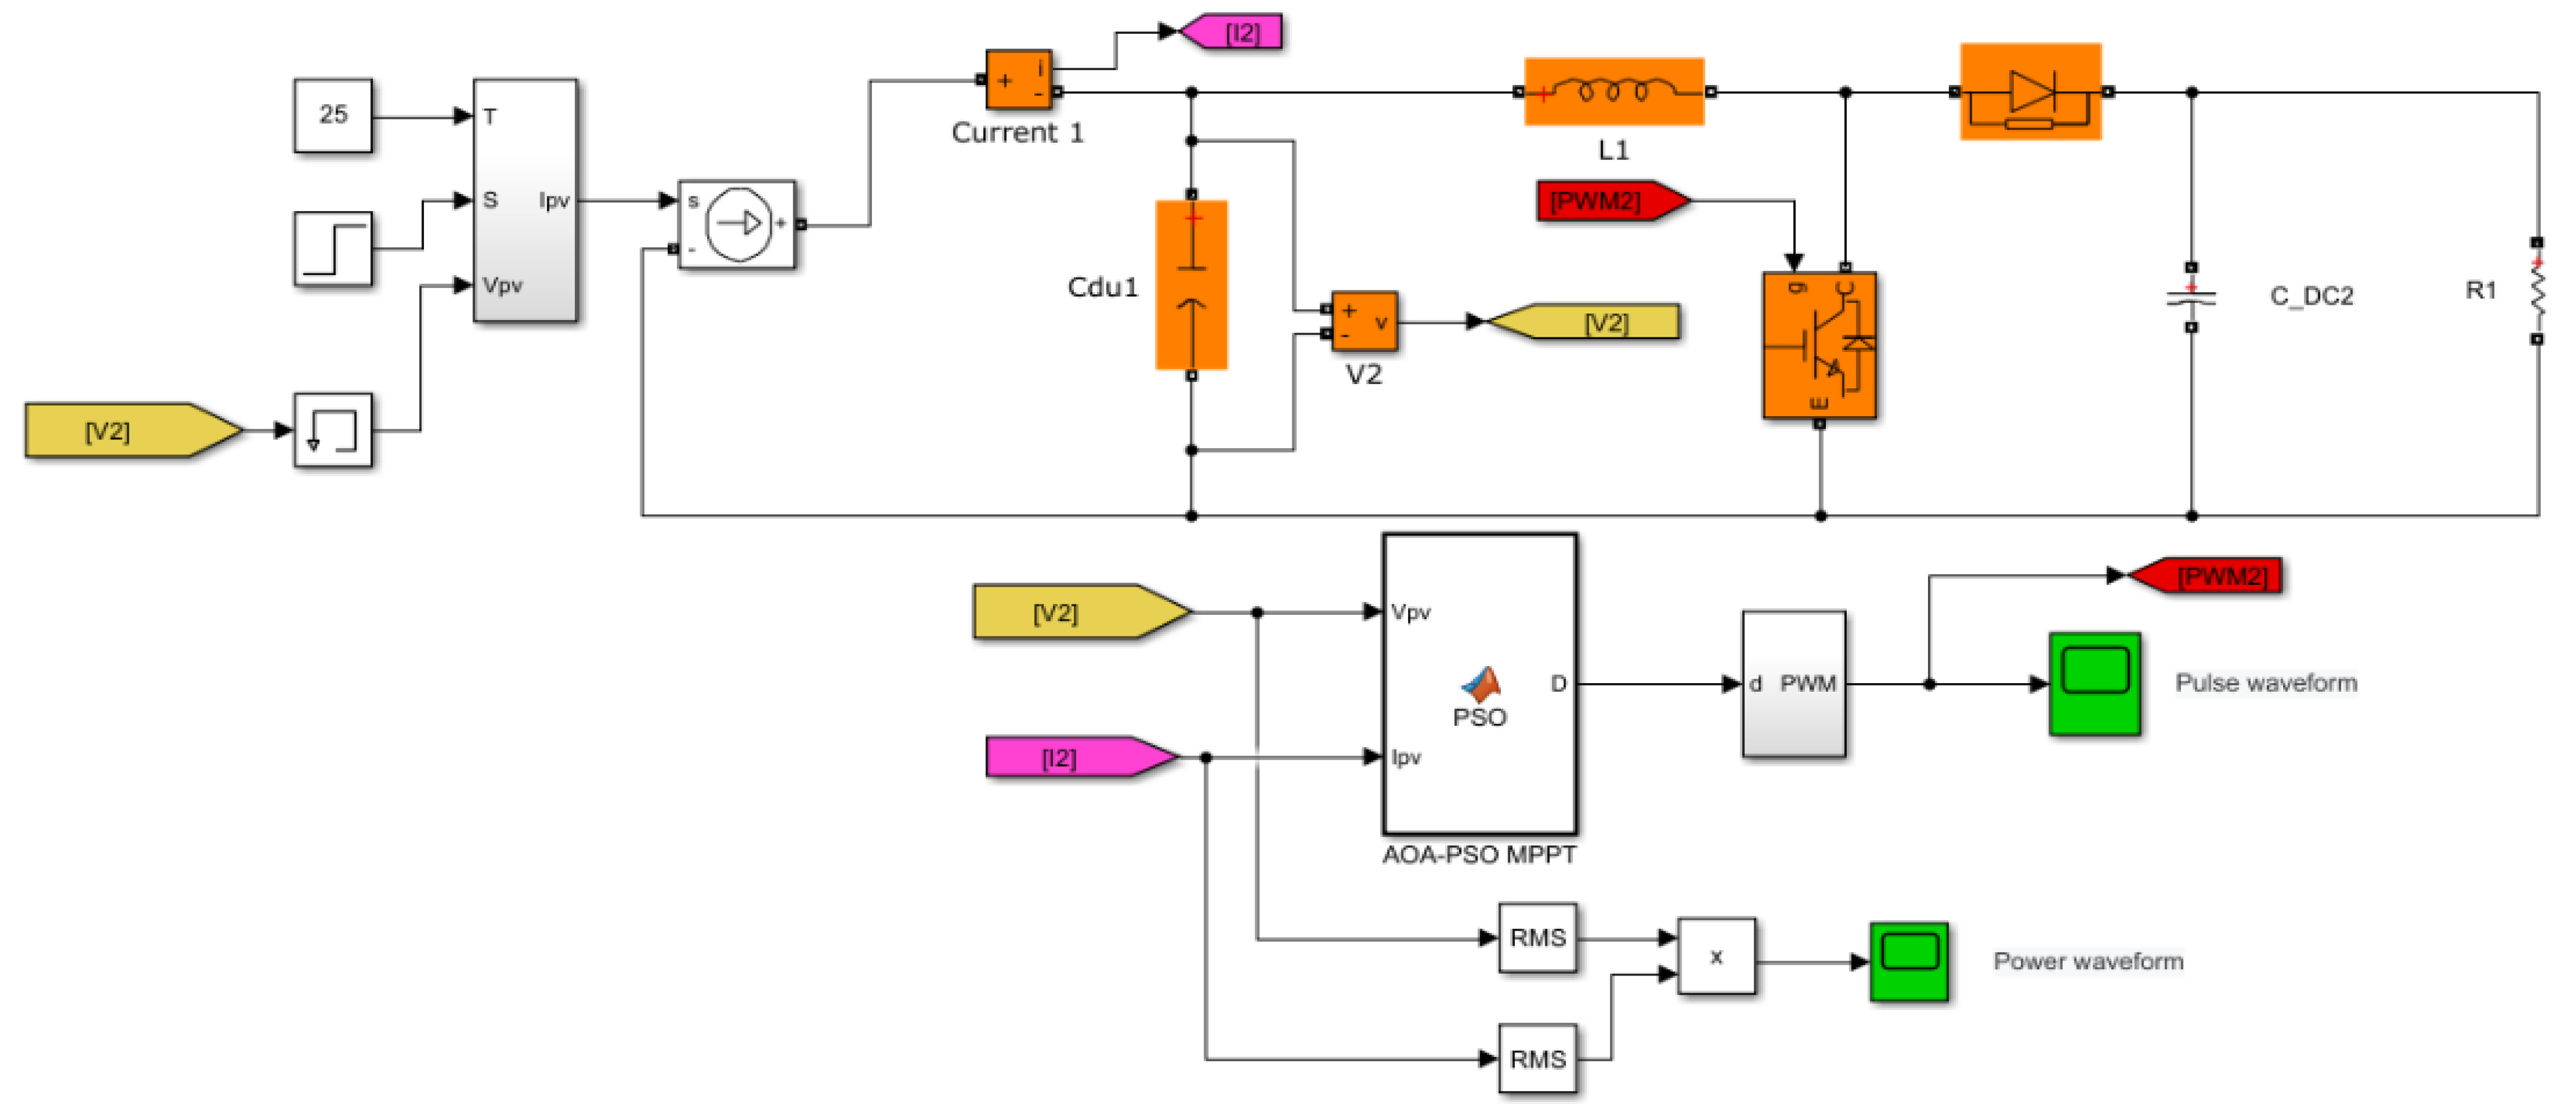
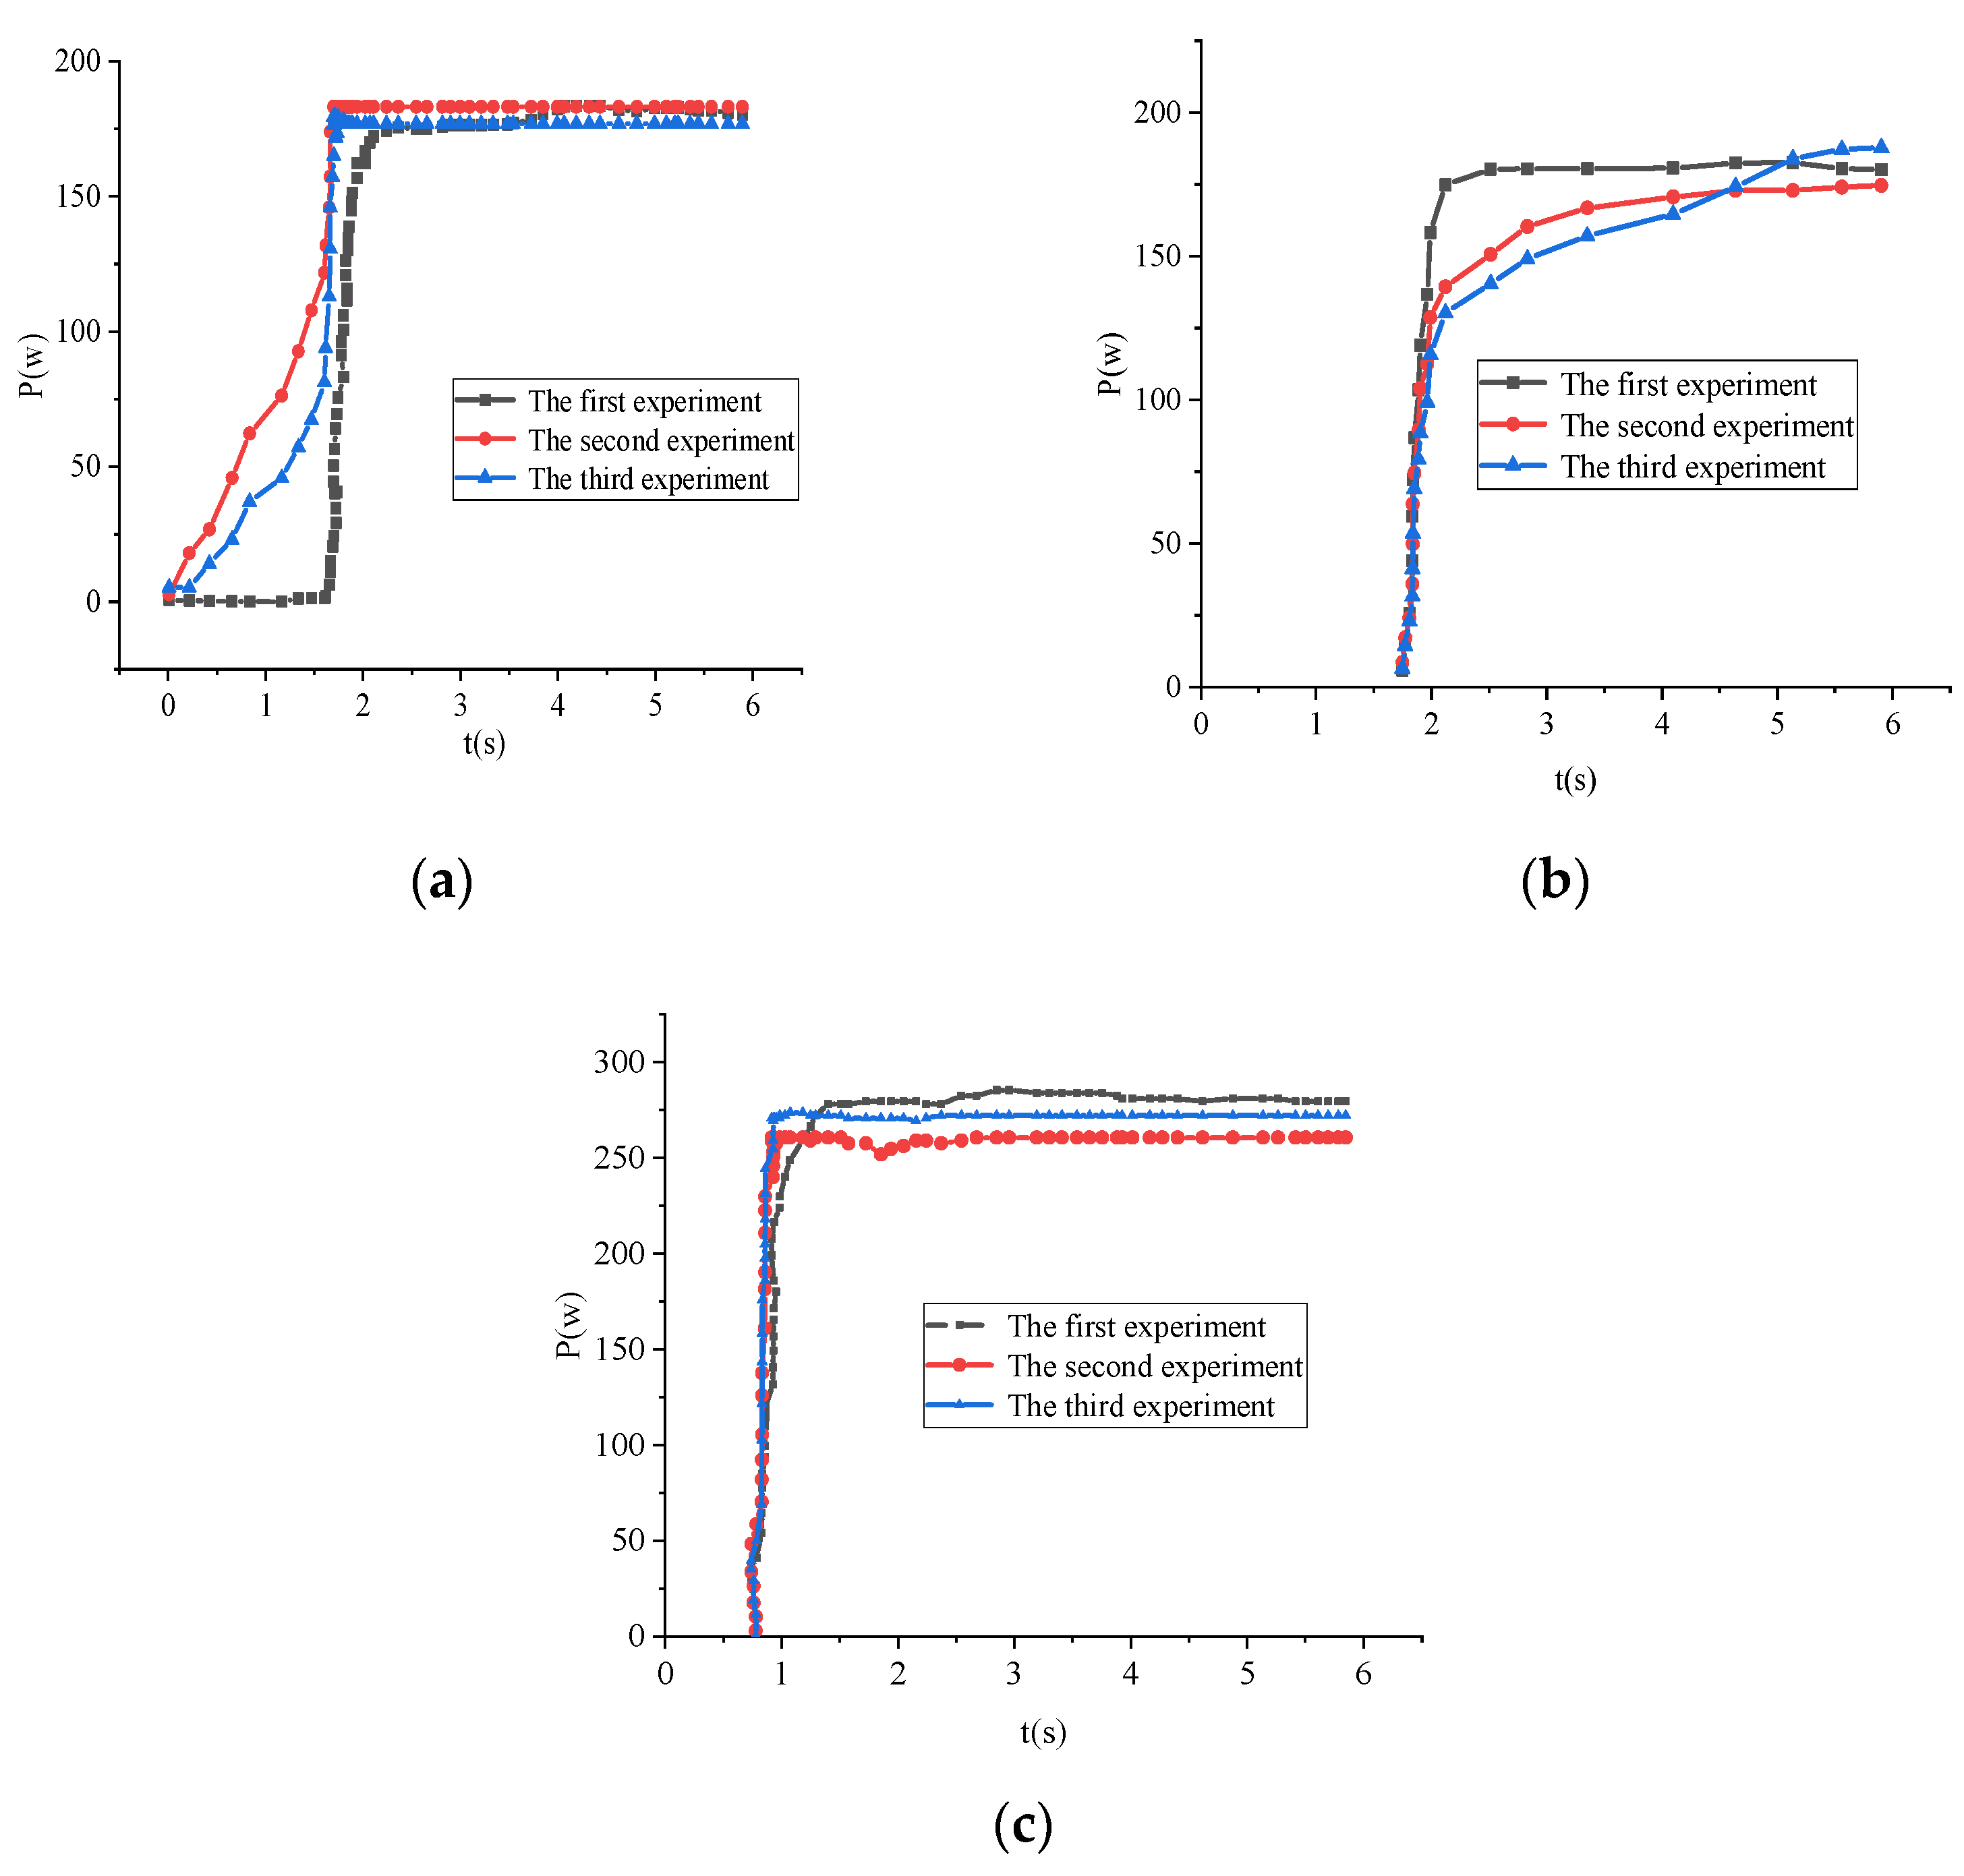
3.1. Experimental Test and Analysis of the Photovoltaic MPPT Control System

Figure 8 indicates the experimental results of TPOM, IAM, and AOA-PSO.
Table 2 presents a comparative study among the three MPPT algorithms for different aspects.
The curve of TPOM in Figure 8a suggested that the system successfully found the maximum power point in about 1.85 s, slow to keep up with the maximum power point. The average tracked maximum power point power was 175.86 W. As the curve of IAM in Figure 8b presents, the system successfully found the maximum power point about 1.61 s after operation. The average tracked maximum power point power was 164.75 W. Although the tracking time of IAM to the maximum power point was faster than that of the TPOM, the power oscillation of the IAM after the tracking to the maximum power point was more significant than that of the TPOM; that is to say, its power loss was more than that of the TPOM. It can be seen from Table 2 that the efficiencies of the TPOM and IAM control algorithms were only 61.71% and 57.81%. Therefore, these two methods fall into the local maximum power point and are inefficient. The curve of the AOA-PSO algorithm in Figure 8c demonstrated that the system successfully tracked the maximum power point in 0.89 s, 1.2 s faster than TPOM and 0.8 s faster than IAM. AOA-PSO’s average maximum power point was 274.73 W, 98.87 W higher than that of TPOM and 109.98 W higher than that of IAM. In addition, the power oscillation ranges near the maximum power point and power loss were small, presenting the advantages of this algorithm.

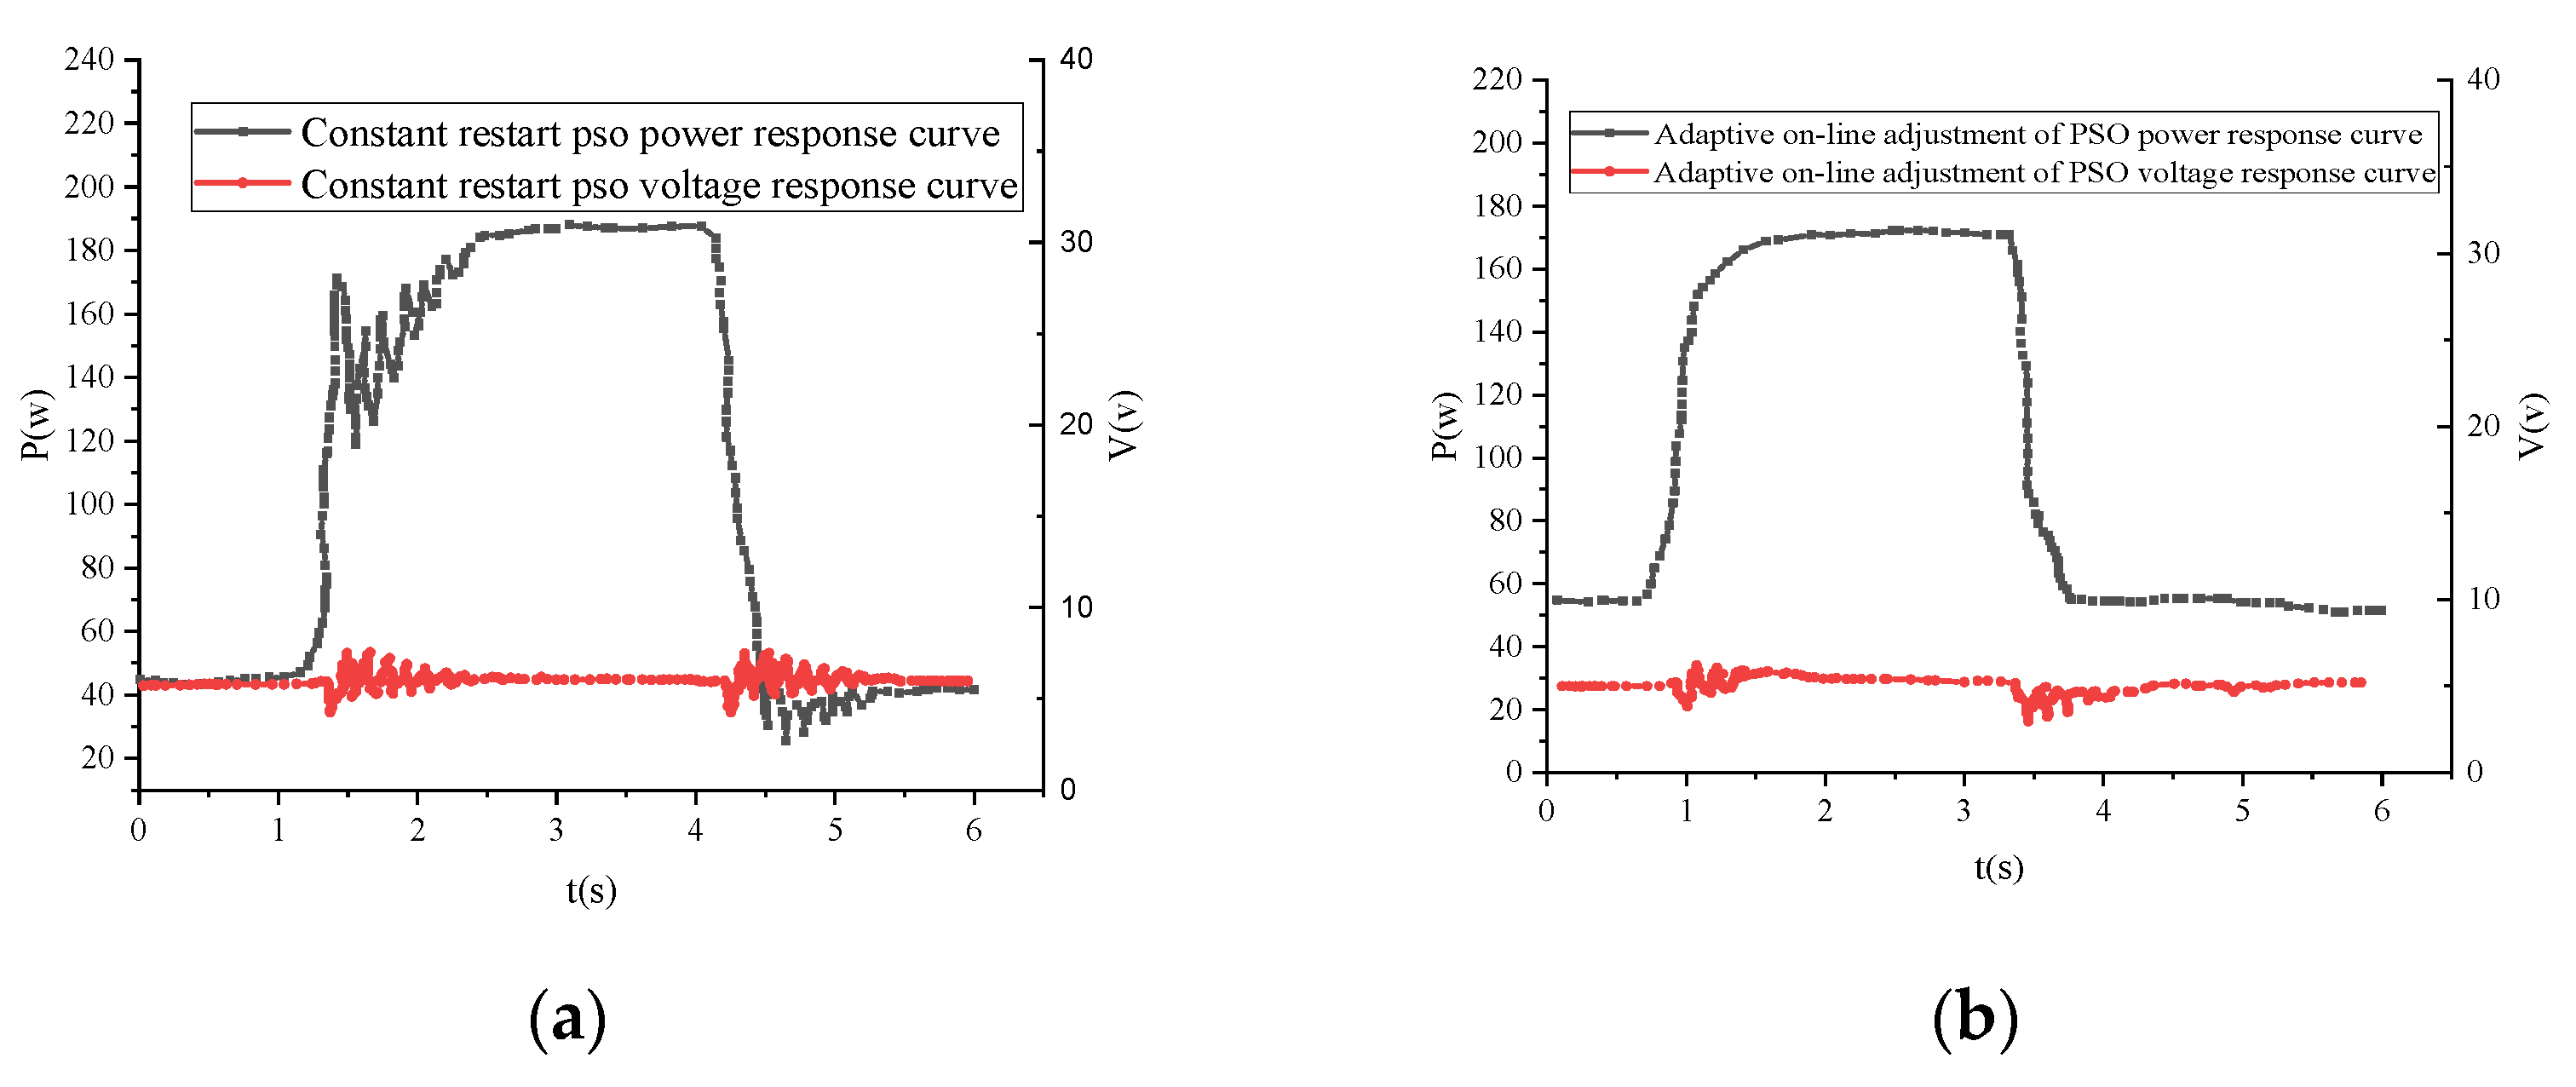
3.2. Analysis of the Experimental Results of the AOA-PSO Algorithm and FVR-PSO Algorithm

The experimental control results of the PSO algorithms are shown in Figure 9.
Table 3 presents a comparative study between the two MPPT algorithms for different aspects.
Figure 9a is the power and voltage response curve of the FVR-PSO algorithm. This method effectively realized the control in a complex environment. Consequently, after searching for about 1.5 s and 2.4 s, the system entered the steady state and worked stably at the maximum power point. However, power and voltage oscillations obviously produced considerable power losses. Figure 9b is the power and voltage response curve of the AOA-POS algorithm. The algorithm was added to a linear factor valued at 16. The experimental results show that the system finds the new maximum power point after 1 s and 1.5 s. The steady-state oscillation of the above two methods was almost eliminated. They were 0.5–0.9 s faster than the traditional PSO algorithm, and the power loss was much smaller than the traditional PSO algorithm.
The experimental test results of the tracking time and tracking oscillation realized by the improved PSO algorithm are shown in Figure 10 and Table 4.
The test results shown in Figure 10 show that the improved PSO algorithm has a good tracking effect on the maximum power point in the rapidly changing light intensity and shadow environment. The response time was shortened by 0.35 s. The improved algorithm effectively reduced the oscillation and energy loss of the system, which is consistent with the simulation results. Compared with the previous control strategy, the AOA-PSO control strategy reported here resulted in smooth online power, a stable DC bus voltage, and a reduced light rejection ratio. The factor significantly affecting the algorithm’s performance was the number of particles. The simulation results verify the effectiveness of the model and control strategy.

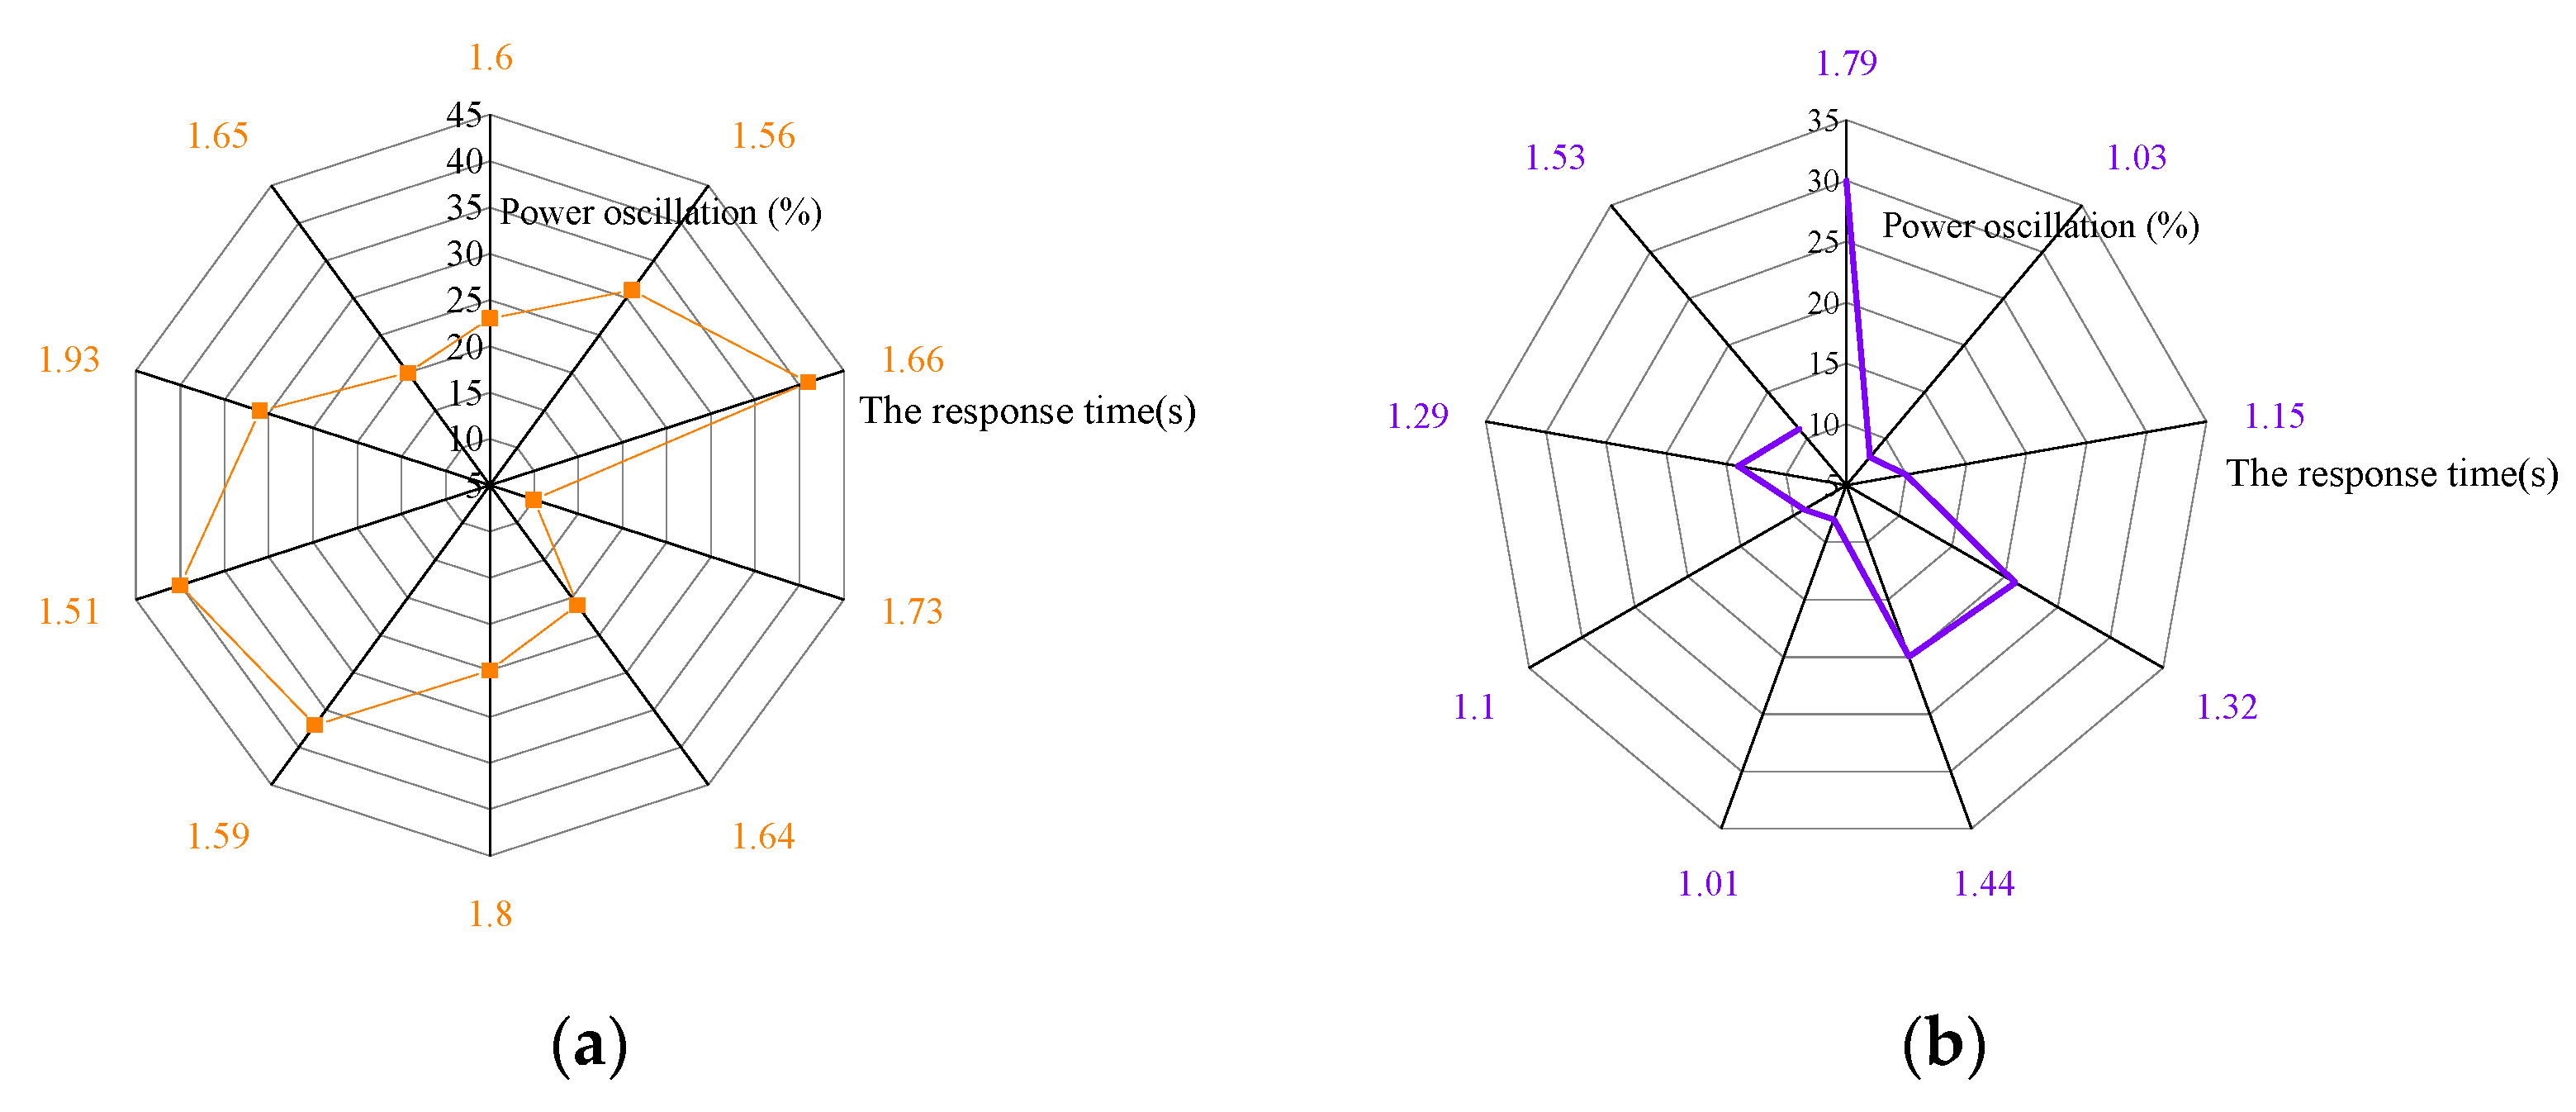
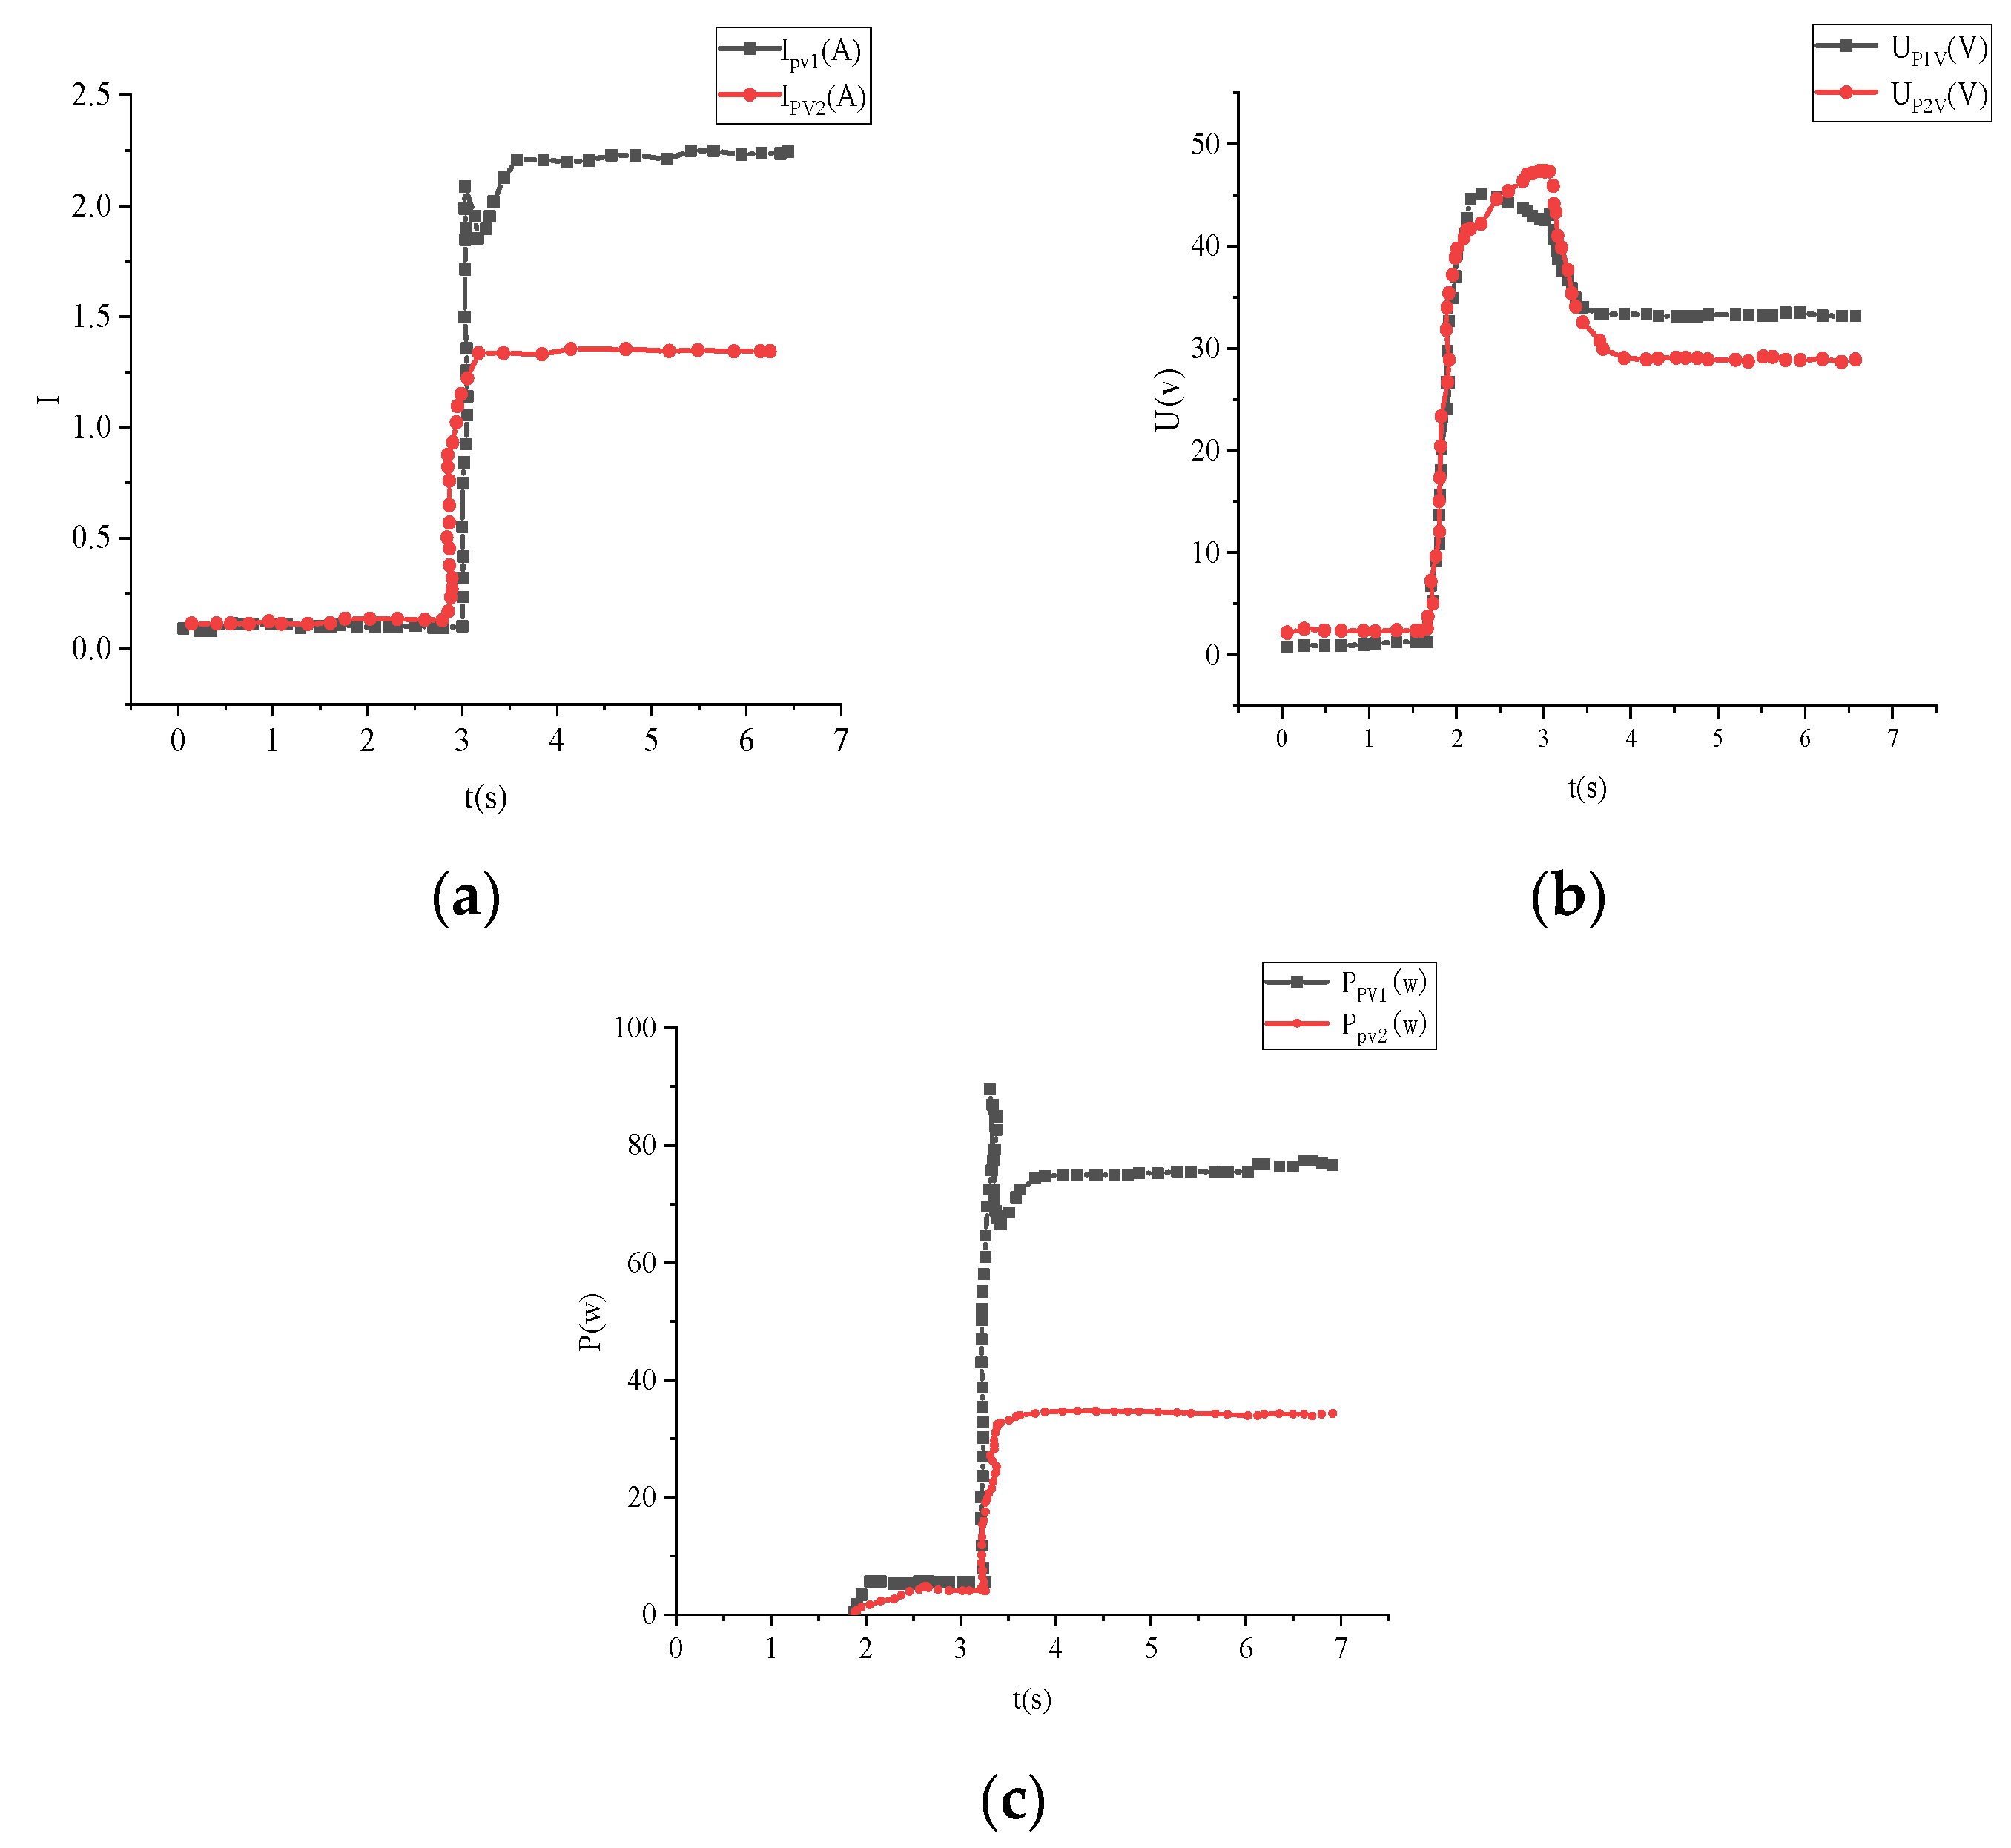
3.3. Analysis of Experimental Results of Group Control Based on the PSO Algorithm

Figure 11 provides the experimental results of the multidimensional algorithm applied to the teamwork control system.
Figure 11 shows the control results of two groups of photovoltaic cells on the photovoltaic side of the circuit. Figure 11a,b represent the output voltage curves of two photovoltaic arrays, and the maximum power point voltages were 33 V and 29 V, respectively. Figure 11c denotes the power curves for two photovoltaic arrays. At 0.35 s, the capacitor was charged to form a pulse current, generating pulse power, which passed through and reached the actual maximum power point of the system.

4. Discussion

The AOA-PSO algorithm proposed here was compared with the algorithms presented by Iskanderani et al. (2020) [27] and Liang et al. (2018) [28]. The comparison results are shown in Table 5. They indicate that the AOA-PSO algorithm achieves the smallest power oscillation range and power loss near the maximum power point than the existing algorithms, showing apparent superiority.
On the other hand, the hydrogen production from electrolyzed water has attracted extensive attention from researchers as efficient and clean energy and has promising application prospects. However, as the anode reaction of electrolytic water, the oxygen evolution reaction involves a slow electron transfer process. Therefore, developing efficient electrocatalysts to promote the anodic reaction is the key to solving this problem. NiCo-based nanocomposites are considered potential catalysts for oxygen evolution reactions because of their strong electronic coupling between different components. Future work will try to synthesize ultra-thin amorphous NiCo sulfide nano sheet composites targeted by ultra-small NiCo hydroxide particles using the reverse micelle directional self-assembly strategy for the electrochemical oxygen evolution reaction [29,30].

5. Conclusions

The control strategy of each unit model of the photovoltaic power generation hydrogen production system was studied combined with the photovoltaic power generation and hydrogen production systems. The electric energy of the photovoltaic panel is converted into the required voltage level through a DC/DC boost converter for electrolytic hydrogen production. The output of photovoltaic cells under local shadow has multi-peak nonlinear characteristics. The traditional MPPT control algorithm quickly falls into the shortcomings of local maximum power point, low efficiency, and low precision. Therefore, this paper proposes an AOA-PSO algorithm to realize global maximum power point tracking. Firstly, a linear factor was introduced into the improved PSO algorithm to implement the adaptive adjustment of restart parameters. The enhanced method can realize MPPT control quickly and accurately under rapid changes of light and temperature. Secondly, recognition was introduced, and the particle position was compared with the set value. The particles with a good recognition result will enter the next iteration better than the set value. The particles with poor recognition results will be replaced with their best position in history to maintain the search accuracy and speed in the later stage of PSO. The experimental results prove that the dynamic response time of the MPPT control system reported here was shortened by 0.4 s on average, the system oscillation was effectively reduced by 15.1%, and the energy conversion rate was improved. At present, the combination of photovoltaic power generation and hydrogen energy is still in the demonstration operation stage, and further research is needed for large-scale and commercial operations. This paper has conducted some work on the coordinated control of photovoltaic power generation systems with hybrid energy storage and achieved some research results. However, due to the limitation of research ability and time, it is inevitable to be thoughtless. The research content will be improved from the following aspects: (1) there is no comprehensive investigation into applying the PSO algorithm to MPPT control and whether this method has good dynamic performance under bad conditions; (2) this paper only considers the operation strategy of the photovoltaic hydrogen generation system under an independent operation mode when studying the energy coordination control strategy of the photovoltaic hydrogen generation system. The follow-up research will study the grid-connected and independent operation modes of the photovoltaic hydrogen generation system and the smooth switching direction of the two operation modes.

Author Contributions

Conceptualization, H.H.; methodology, H.H.; software, H.H.; investigation, All authors (H.H., Z.L., X.G., C.S., D.J., C.C., J.M.G.); writing—original draft preparation, H.H.; writing—review and editing, All authors (H.H., Z.L., X.G., C.S., D.J., C.C., J.M.G.); All authors have read and agreed to the published version of the manuscript.

Funding

This work was supported by the National Key Research and Development Program of China (2021YFB2601600), Hebei Province Natural Science Foundation (F2020203013) and Hebei Province 333 Talent Program (A202005001).

Institutional Review Board Statement

Not applicable.

Informed Consent Statement

Not applicable.

Data Availability Statement

Not applicable.

Conflicts of Interest

The authors declare no conflict of interest.

Abbreviations

The following abbreviations are used in this manuscript.
I p h Photo-generated current
I D Dark current
R p Parallel resistance
R s Series resistance
I Load current
U Load terminal voltage
I r s Diode PN node current
qElectron charge
nDiode factor curve
KBoltzmann constant
I m 0 Current of the maximum power point
U m 0 Voltage of the maximum power point
I s c Short-circuit current
U o c Open-circuit voltage
GSunshine intensity
T a i r Ambient temperature
C b a Rated capacity
U b a Rated voltage
C u c Capacitance value of the ultracapacitor
U u c Terminal voltage
E b a Energy storage capacity of the battery pack
E u c Energy storage capacity of the ultracapacitor pack
P b a Power of the battery pack
P u c Power of the ultracapacitor pack
η b a c Charging efficiency of the battery pack
η u c c Charging efficiency of the ultracapacitor pack
η b a d Discharging efficiency of the battery pack
η u c d Discharging efficiency of the ultracapacitor pack
c 1 , c 2 Acceleration constant
r 1 , r 2 Random numbers between 0 and 1
X i k Velocity of the ith particle in the kth cycle
v i k Position of the ith particle in the kth cycle
p g k Optimal global value of the kth cycle
p i k Optimal value of the individual particle in the kth cycle

References

  1. Zhang, J.; Ding, H.; Wang, B.; Guo, X.; Padmanaban, S. Active Power Decoupling for Current Source Converters: An Overview Scenario. Electronics 2019, 8, 197. [Google Scholar] [CrossRef]
  2. Xiao, X.G.; Zhang, J.; Zhou, J.; Wang, B. A New Single-Phase Transformerless Current Source Inverter for Leakage Current Reduction. Energies 2018, 11, 1633. [Google Scholar]
  3. Guo, X.; Nguyen, M.; Malinowski, M.; Tedeschi, E. Grid-connected and isolated renewable energy systems. Electronics 2021, 10, 2683. [Google Scholar] [CrossRef]
  4. Zhang, Y.; Hua, Q.S.; Sun, L.; Liu, Q. Life Cycle Optimization of Renewable Energy Systems Configuration with Hybrid Battery/Hydrogen Storage: A Comparative Study. J. Energy Storage 2020, 30, 101470. [Google Scholar] [CrossRef]
  5. Kraiem, H.; Aymen, F.; Yahya, L.; Triviño, A.; Alharthi, M.; Ghoneim, S.S.M. A Comparison between Particle Swarm and Grey Wolf Optimization Algorithms for Improving the Battery Autonomy in a Photovoltaic System. Appl. Sci. 2021, 11, 7732. [Google Scholar] [CrossRef]
  6. Dahbi, S.; Aboutni, R.; Aziz, A.; Benazzi, N.; Elhafyani, M.; Kassmi, K. Optimised hydrogen production by a photovoltaic-electrolysis system DC/DC converter and water flow controller. Int. J. Hydrogen Energy 2016, 41, 20858–20866. [Google Scholar] [CrossRef]
  7. Garrigós, A.; Lizán, J.L.; Blanes, J.M.; Gutiérrez, R. Combined maximum power point tracking and output current control for a photovoltaic-electrolyser DC/DC converter. Int. J. Hydrogen Energy 2014, 39, 20907–20919. [Google Scholar] [CrossRef]
  8. Wu, H.; Sun, Y.; Meng, Z. Application of Particle Swarm Optimization Fuzzy Controller in Maximum Power Tracking of Photovoltaic Power Generation System. Proc. CSEE 2011, 31, 52–57. [Google Scholar]
  9. Ergin Şahin, M. A photovoltaic powered electrolysis converter system with maximum power point tracking control. Int. J. Hydrogen Energy 2020, 45, 9293–9304. [Google Scholar] [CrossRef]
  10. Shi, J.; Ling, L.; Xue, F. Application of Territory Particle Swarm Optimization in Maximum Power Tracking of Photovoltaic. J. Sol. Energy 2019, 40, 2254–2260. [Google Scholar]
  11. Han, Y.; Zhang, G.; Li, Q.; You, Z.; Chen, W.; Liu, H. Hierarchical energy management for photovoltaic/hydrogen/battery island DC microgrid. Int. J. Hydrogen Energy 2019, 44, 5507–5516. [Google Scholar] [CrossRef]
  12. Lorestani, A.; Ardehali, M.M. Optimal integration of renewable energy sources for autonomous tri-generation combined cooling, heating and power system based on evolutionary particle swarm optimization algorithm. Energy 2018, 145, 839–855. [Google Scholar] [CrossRef]
  13. Bounechba, H.; Bouzid, A.; Snani, H.; Lashab, A. Real time simulation of MPPT algorithms for PV energy system. Int. J. Electr. Power Energy Syst. 2016, 83, 67–78. [Google Scholar] [CrossRef]
  14. Luo, C.; Yu, H.; Li, L. Photovoltaic Grid Connection Based on MMC Converter under Local Shadow Condition. J. Hunan Univ. Technol. 2017, 31, 49–55. [Google Scholar]
  15. Yue, M.; Wang, X. Research on Control Strategy of Ship Energy Management System Based on Hybrid GA and PSO. Int. Core J. Eng. 2020, 6, 185–193. [Google Scholar]
  16. Matthew, L.; Murray, T.; David, I. Electrica Integration of Renewable Energy into Stand Alone Power Supplies Incorporation Hydrogen Storage. Int. J. Hydrogen Energy 2007, 32, 1582–1588. [Google Scholar]
  17. Selmi, T.; Bouzguenda, M.; Gastli, A.; Masmoudi, A. MATLAB/Simulink Based Modelling of Solar Photovoltaic Cell. Int. J. Renew. Energy Res. 2012, 2, 213–218. [Google Scholar]
  18. Mendalek, N.; Al-Haddad, K. Photovoltaic system modeling and simulation, in Industrial Technology. IEEE Int. Conf. Ind. Technol. 2017, 6, 1522–1527. [Google Scholar]
  19. Chang, W.J.; Lee, K.H.; Ha, H.; Jin, K.; Kim, G.; Hwang, S.T.; Lee, H.M.; Ahn, S.W.; Yoon, W.; Seo, H.; et al. Design Principle and Loss Engineering for Photovoltaic-Electrolysis Cell System. ACS Omega 2017, 2, 1009–1018. [Google Scholar] [CrossRef]
  20. Jung, T.Y.; Kim, D.; Moon, J.; Lim, S. A Scenario Analysis of Solar Photovoltaic Grid Parity in the Maldives: The Case of Malahini Resort. Sustainability 2018, 10, 4045. [Google Scholar] [CrossRef]
  21. Sadeghi, S.; Askari, I.B. Prefeasibility techno-economic assessment of a hybrid power plant with photovoltaic, fuel cell and Compressed Air Energy Storage (CAES). Energy 2019, 168, 409–424. [Google Scholar] [CrossRef]
  22. Azahra, A.; Syahindra, K.; Aryani, D.; Jufri, F.; Ardita, I. Optimized configuration of photovoltaic and battery energy storage system (BESS) in an isolated grid: A case study of Eastern Indonesia. IOP Conf. Ser. Earth Environ. Sci. 2020, 599, 012017. [Google Scholar] [CrossRef]
  23. Guo, C.; Lu, J.; Tian, Z.; Guo, W.; Darvishan, A. Optimization of critical parameters of PEM fuel cell using TLBO-DE based on Elman neural network. Energy Convers. Manag. 2019, 183, 149–158. [Google Scholar] [CrossRef]
  24. Ma, C.; Dong, S.; Lian, J.; Pang, X. Multi-Objective Sizing of Hybrid Energy Storage System for Large-Scale Photovoltaic Power Generation System. Sustainability 2019, 11, 5441. [Google Scholar] [CrossRef]
  25. Sun, C.; Zhang, C.; Zhou, S. Simulation of Composite Energy Storage Optimization Configuration of Micro-grid Based on PSO. IOP Conf. Ser. Mater. Sci. Eng. 2019, 677, 042103. [Google Scholar] [CrossRef]
  26. Geng, S.; Tan, C.; Niu, D.; Guo, X. Optimal Allocation Model of Virtual Power Plant Capacity considering Electric Vehicles. Math. Probl. Eng. 2021, 2021, 5552323. [Google Scholar] [CrossRef]
  27. Iskanderani, A.I.M.; Mehedi, I.M.; Ramli, M.A.M.; Islam, M.R. Analyzing the Off-Grid Performance of the Hybrid Photovoltaic/Diesel Energy System for a Peripheral Village. Int. J. Photoenergy 2020, 2020, 7673937. [Google Scholar] [CrossRef]
  28. Liang, Z.; Zheng, X.S.; Wang, J.; Wang, X.; Zhang, G. Optimal Configuration of Liquid Metal Battery Energy Storage System in Photovoltaic and Hydrogen Coupled Microgrid. Autom. Electr. Power Syst. 2018, 42, 12–16. [Google Scholar]
  29. Jun, C.; Hao, L.; Yuan, C.; Li, W. Catalytic activity atlas of ternary Co–Fe–V metal oxides for the oxygen evolution reaction. J. Mater. Chem. A 2020, 8, 15951–15961. [Google Scholar] [CrossRef]
  30. Jun, C.; Hao, L.; Yuan, C.; Li, W. Co–Fe–Cr (oxy)Hydroxides as Efficient Oxygen Evolution Reaction Catalysts. Adv. Energy Mater. 2021, 11, 2003412. [Google Scholar] [CrossRef]
Figure 1. Equivalent circuit of the photovoltaic cell [17,18,19,20].
Energies 15 01472 g001
Figure 2. General photovoltaic module model.
Energies 15 01472 g002
Figure 3. Internal battery simulation diagram: (a) mathematical model inside the photovoltaic cell; (b) packaging model of the photovoltaic cell.
Energies 15 01472 g003
Figure 4. Relationship between the photovoltaic cell output characteristics and temperature: (a) output characteristic curve of the photovoltaic cell with ambient temperature under the same light intensity; (b) output characteristic curve of the photovoltaic cell with light intensity at the same ambient temperature; (c) relationship between the hydrogen generation rate and current in an electrolytic cell.
Energies 15 01472 g004aEnergies 15 01472 g004b
Figure 5. Overall control model of the photovoltaic power generation system.
Energies 15 01472 g005
Figure 6. Overall simulation model of the photovoltaic hydrogen generation system.
Energies 15 01472 g006
Figure 7. Traditional and improved PSO algorithms.
Energies 15 01472 g007
Figure 8. Experimental results of the photovoltaic MPPT control systems (a) TPOM; (b) IAM; (c) AOA-PSO.
Energies 15 01472 g008
Figure 9. Experimental control results of the PSO algorithms: (a) FVR-PSO response curve; (b) AOA-PSO response curve.
Energies 15 01472 g009
Figure 10. Experimental results of the tracking time and tracking oscillation of the PSO algorithm: (a) before improvement; (b) after improvement.
Energies 15 01472 g010
Figure 11. Experimental results of the photovoltaic side of group control: (a) pv1/pv2 current curve; (b) pv1/pv2 current curve; (c) pv1/pv2 power curve.
Energies 15 01472 g011
Table 1. Parameter setting of the PSO algorithm.
r 1 r 2 C 1 C 2 w Δ V Δ p K 1 K 2
0.94750.49541.1 μF1.1 μF0.4 s0.15 mm/s0.16 W164
Table 2. A comparative study among TPOM-MPPT, IAM-MPPT, and AOA-MPPT.
MPPT TechniquesTPOM-MPPTIAM-MPPTAOA-MPPT
Time to reach the MPP (s)1.851.610.89
Extracted Power at MPP (W)175.86164.75274.73
Tracking Efficiency (%)61.7157.8196.40
Table 3. Comparative study between FVR-PSO MPPT and AOA-PSO MPPT.
MPPT TechniquesFVR-PSOAOA-PSO
Time to Reach the MPP (s)2.41.5
Extracted Power at MPP (W)185.50215.25
Tracking Efficiency (%)74.589.45
Power Oscillation Range (W)119.36–185.50198.55–215.25
Table 4. Experimental results of the PSO tracking time and tracking oscillation.
Times 12345678910
Unimproved PSOResponse time (s)1.61.561.661.731.641.801.591.511.931.6523
Power oscillation (%)23304010212537403120
Improved PSOResponse time (s)1.231.791.031.151.321.441.011.101.291.53
Power oscillation (%)13298102120891411
Table 5. Comparison of the experimental results of different algorithms.
MPPT TechniquesAlgorithm in Reference [27] Algorithm in Reference [28]AOA-PSO
Tracking Efficiency (%)73.586.4589.45
Power Oscillation Range (W)118.26–184.50176.25–210.45198.55–215.25
Publisher’s Note: MDPI stays neutral with regard to jurisdictional claims in published maps and institutional affiliations.

