
Study on Fiber Clogging Mechanism in Sewage Pump Based on CFD–DEM Simulation


Abstract
:1. Introduction
2. CFD–DEM Coupling Method
2.1. Governing Equation
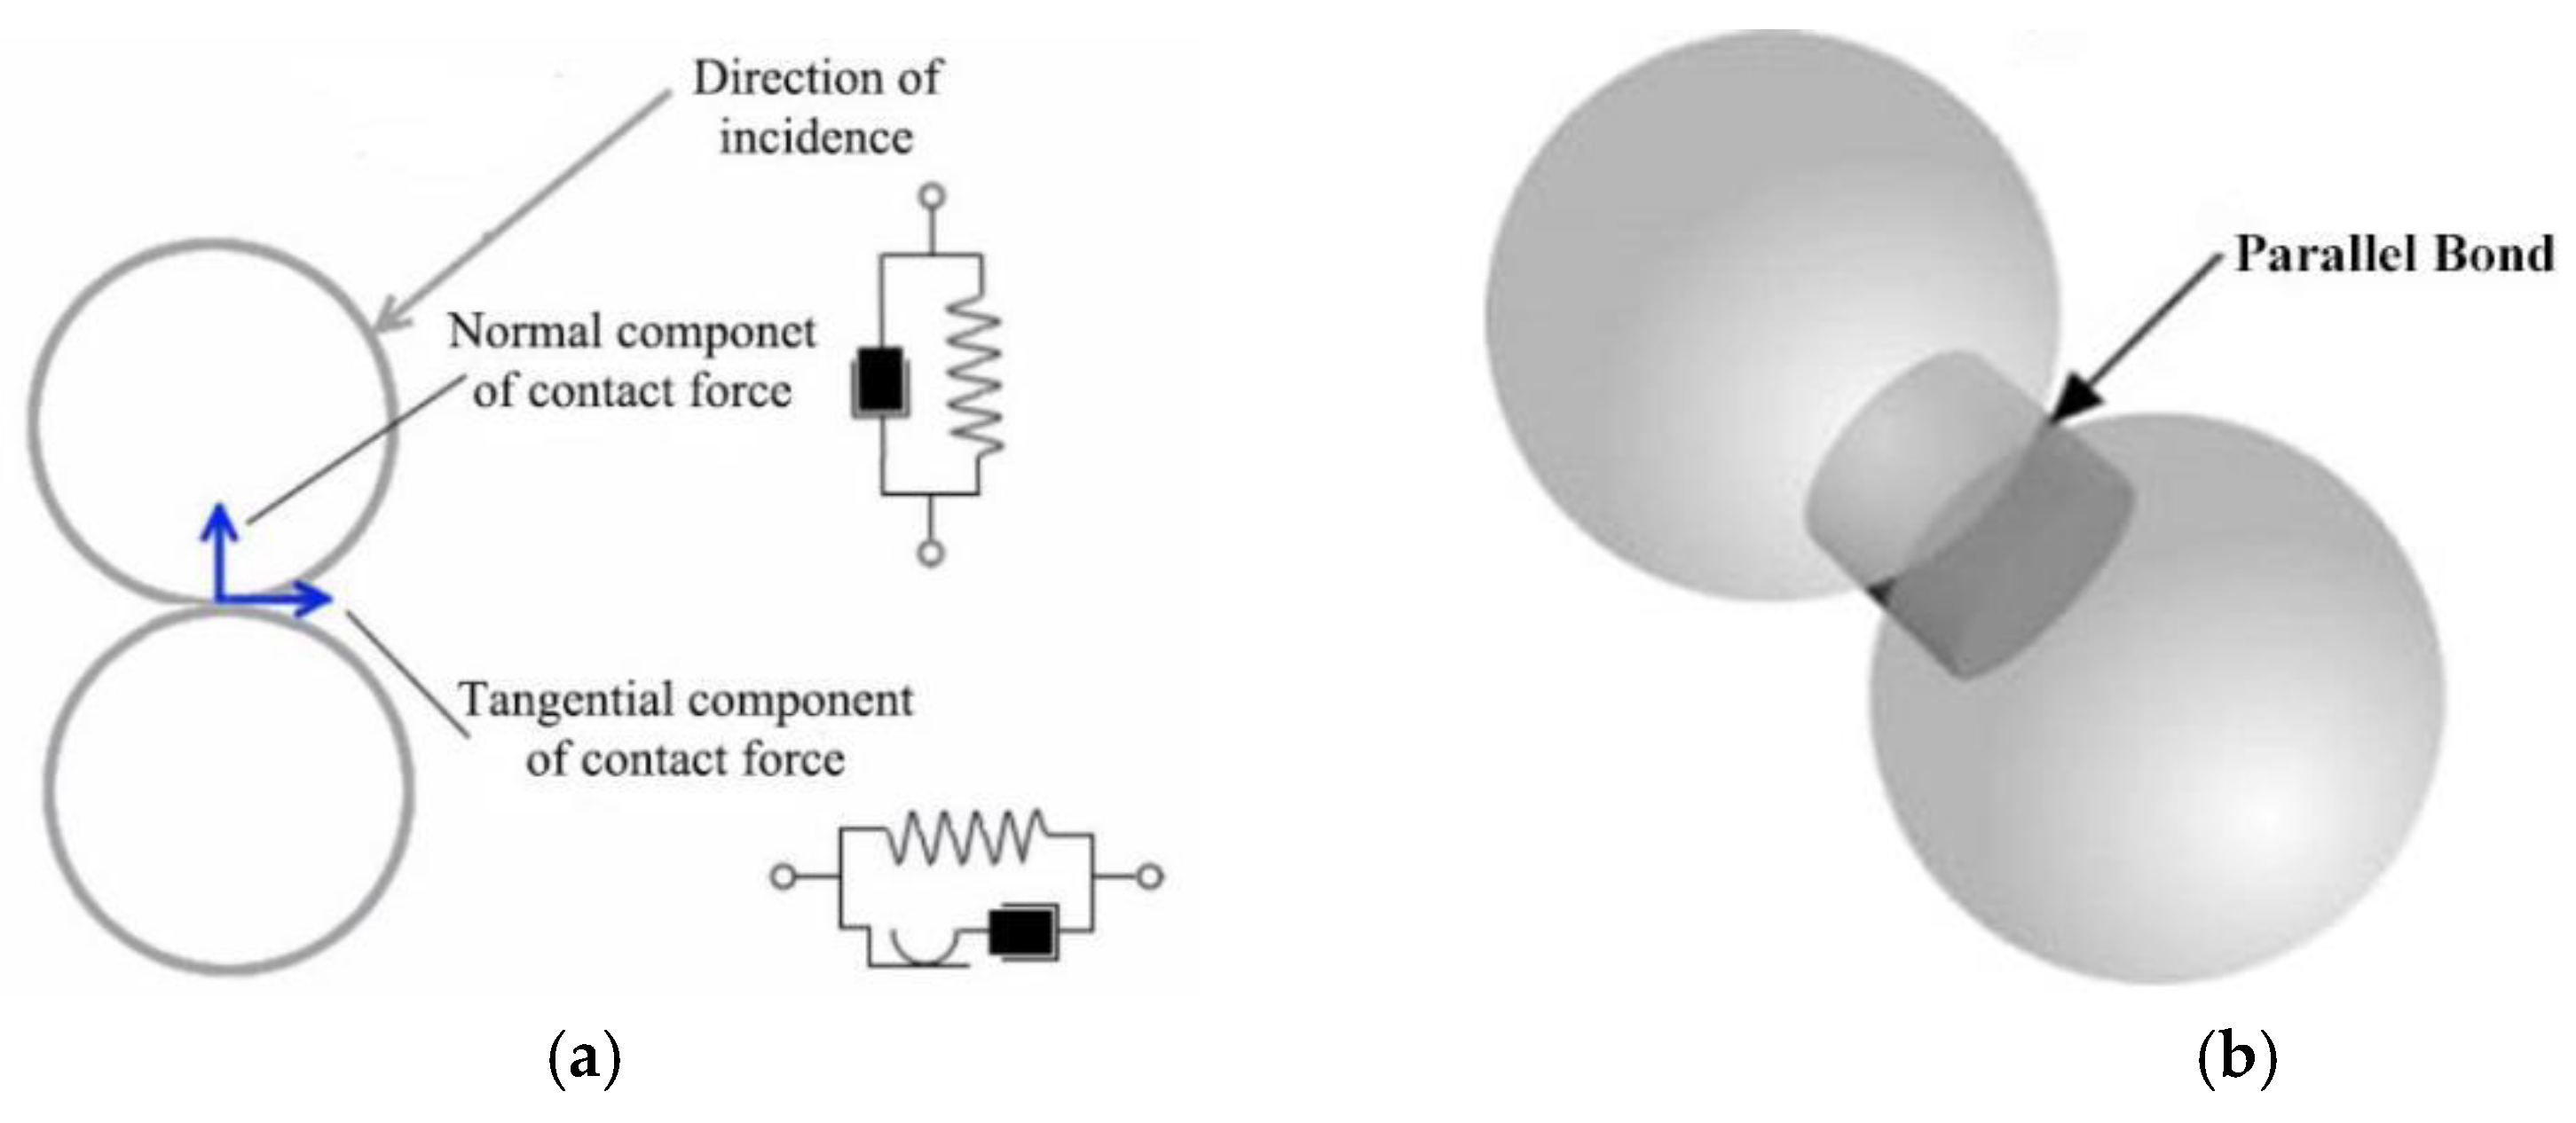
2.2. Discrete Element and Contact Model
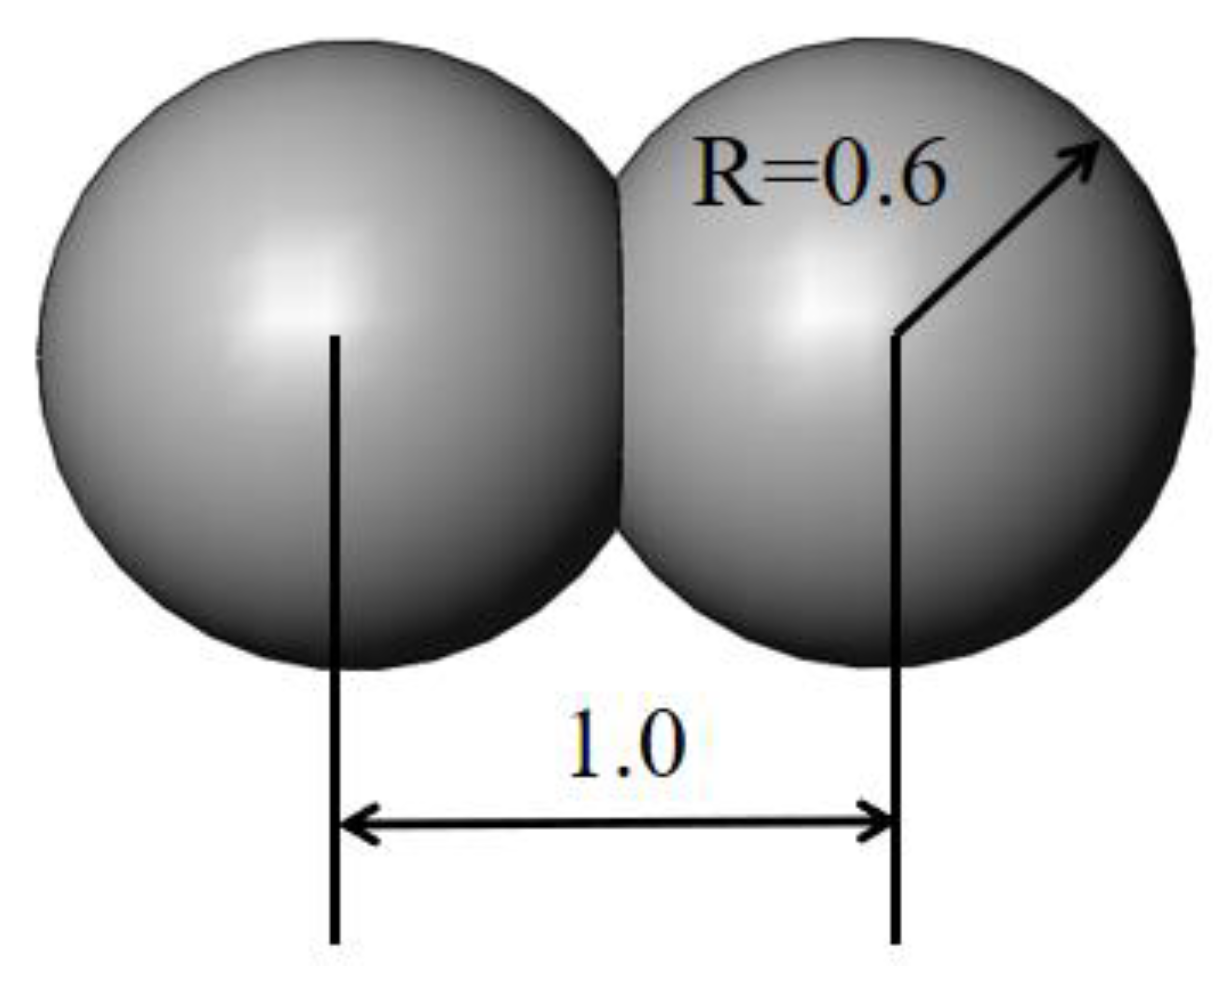
2.3. The Fiber Model
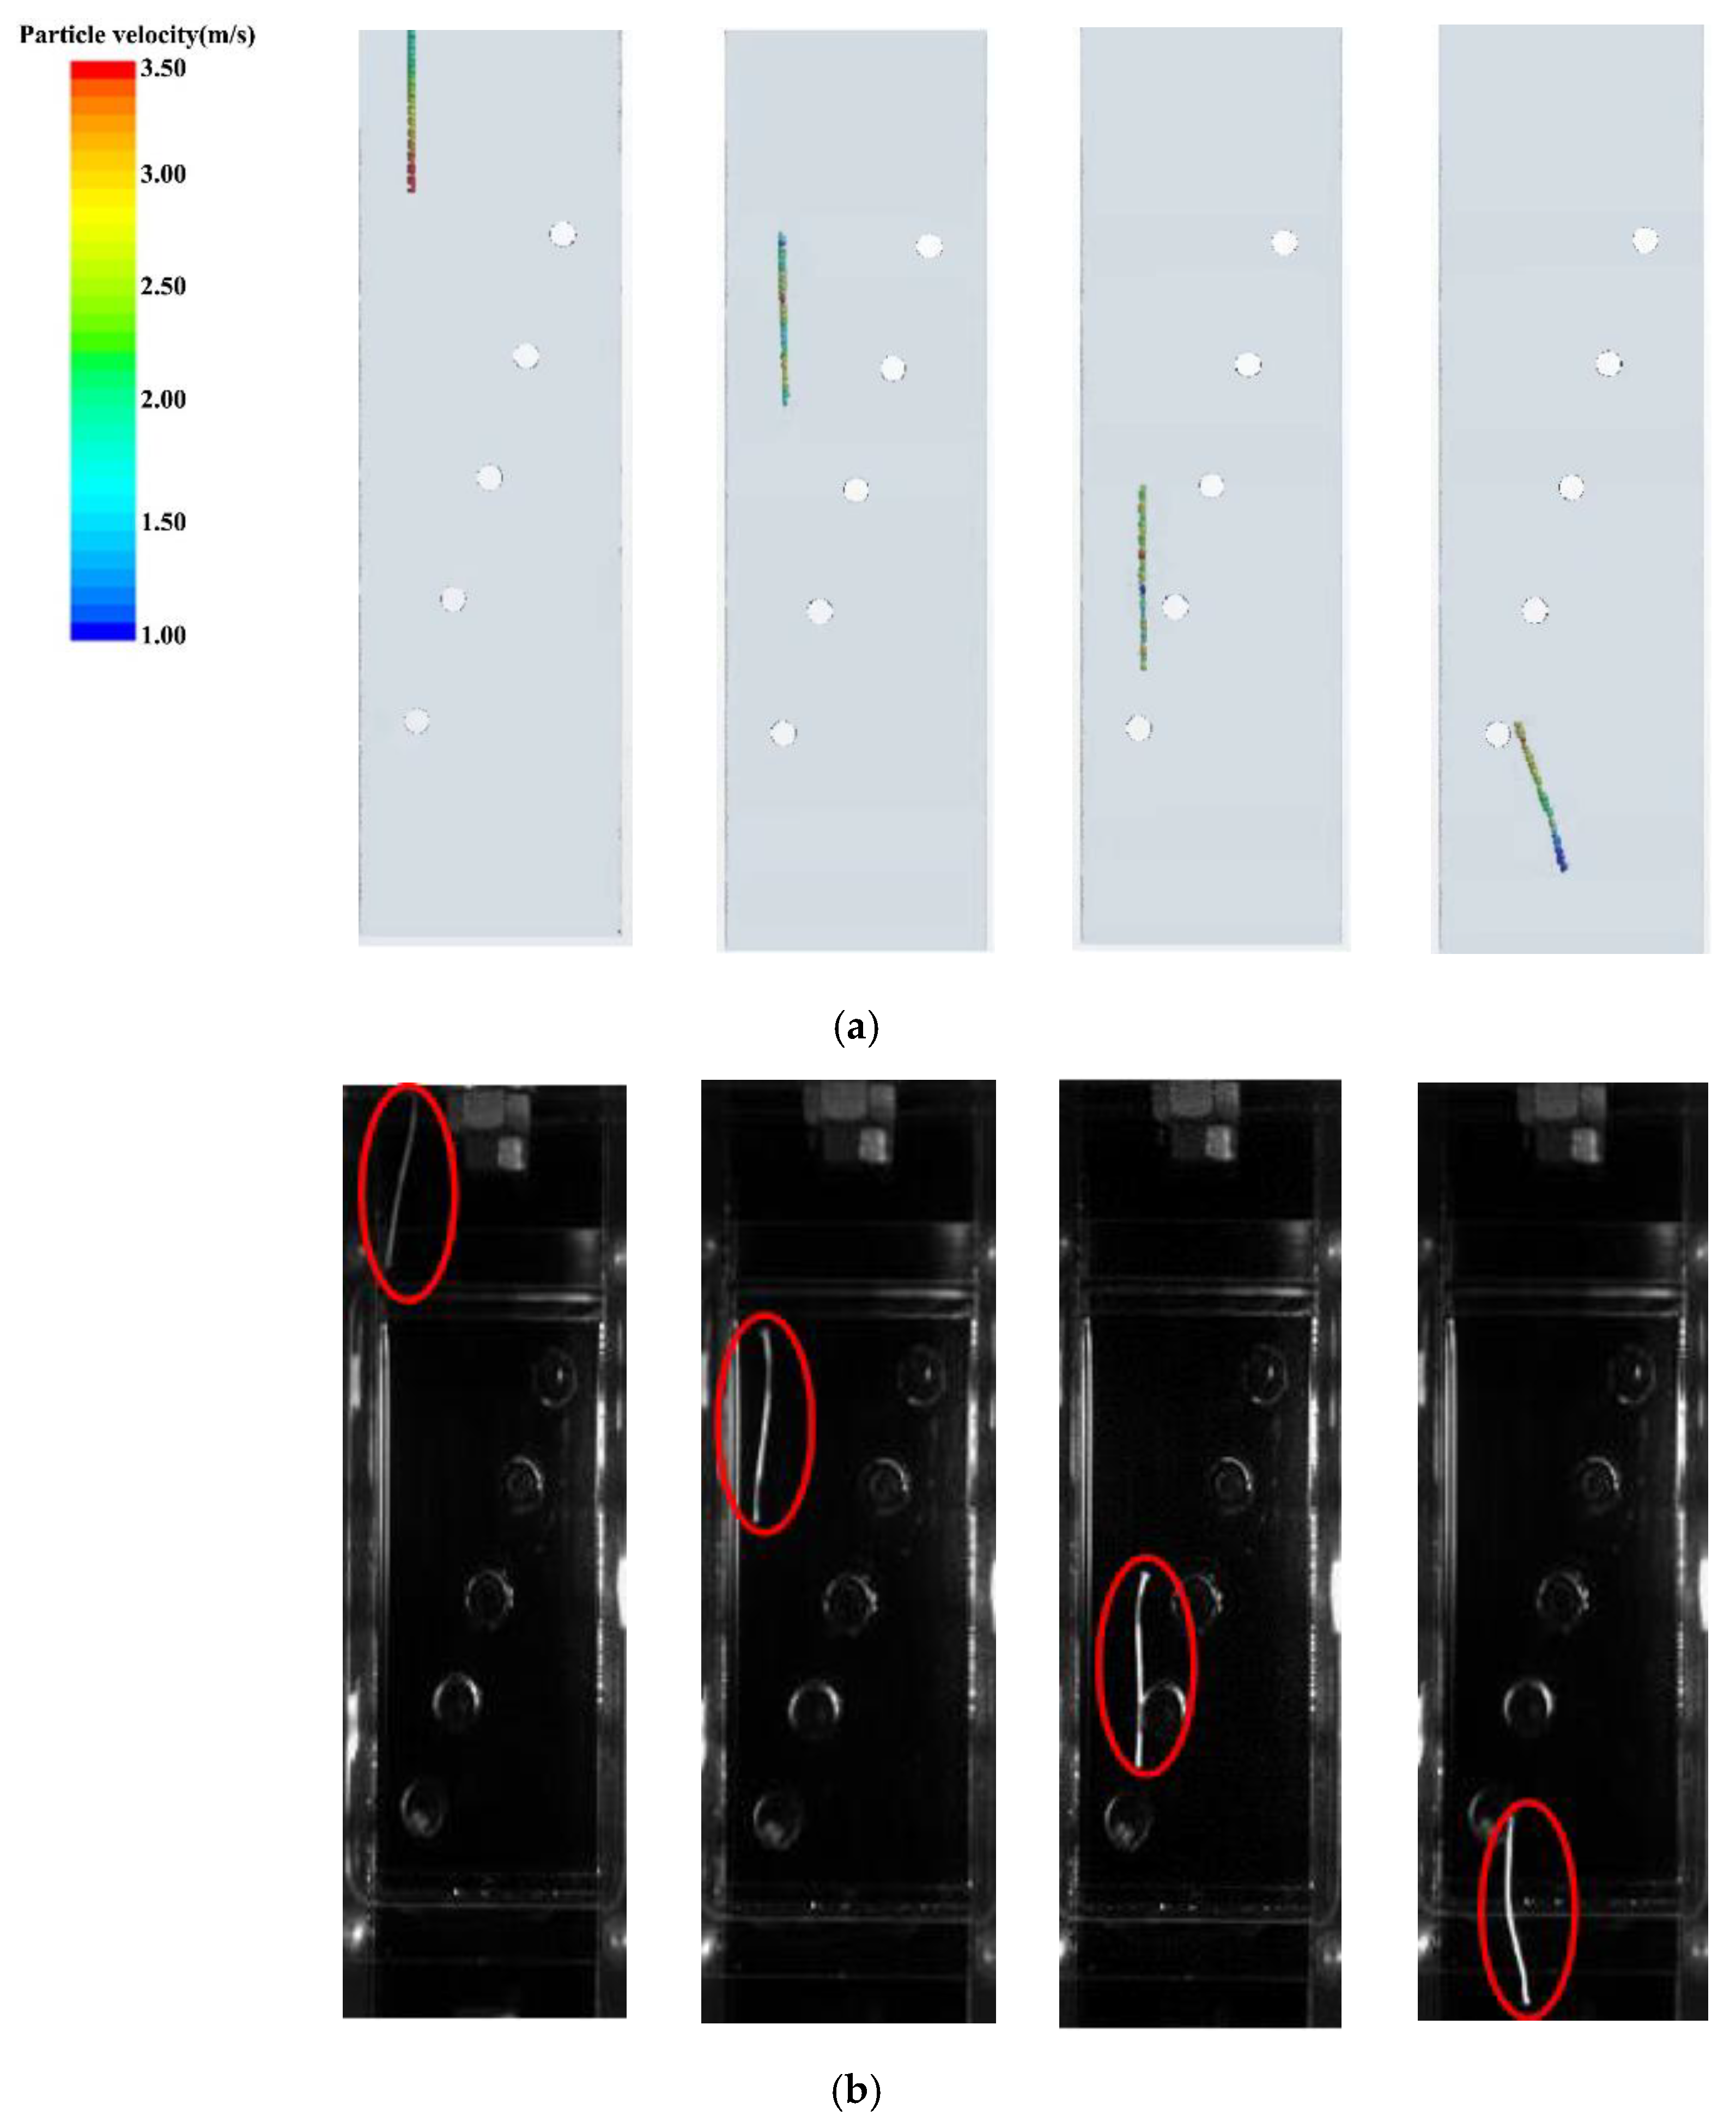
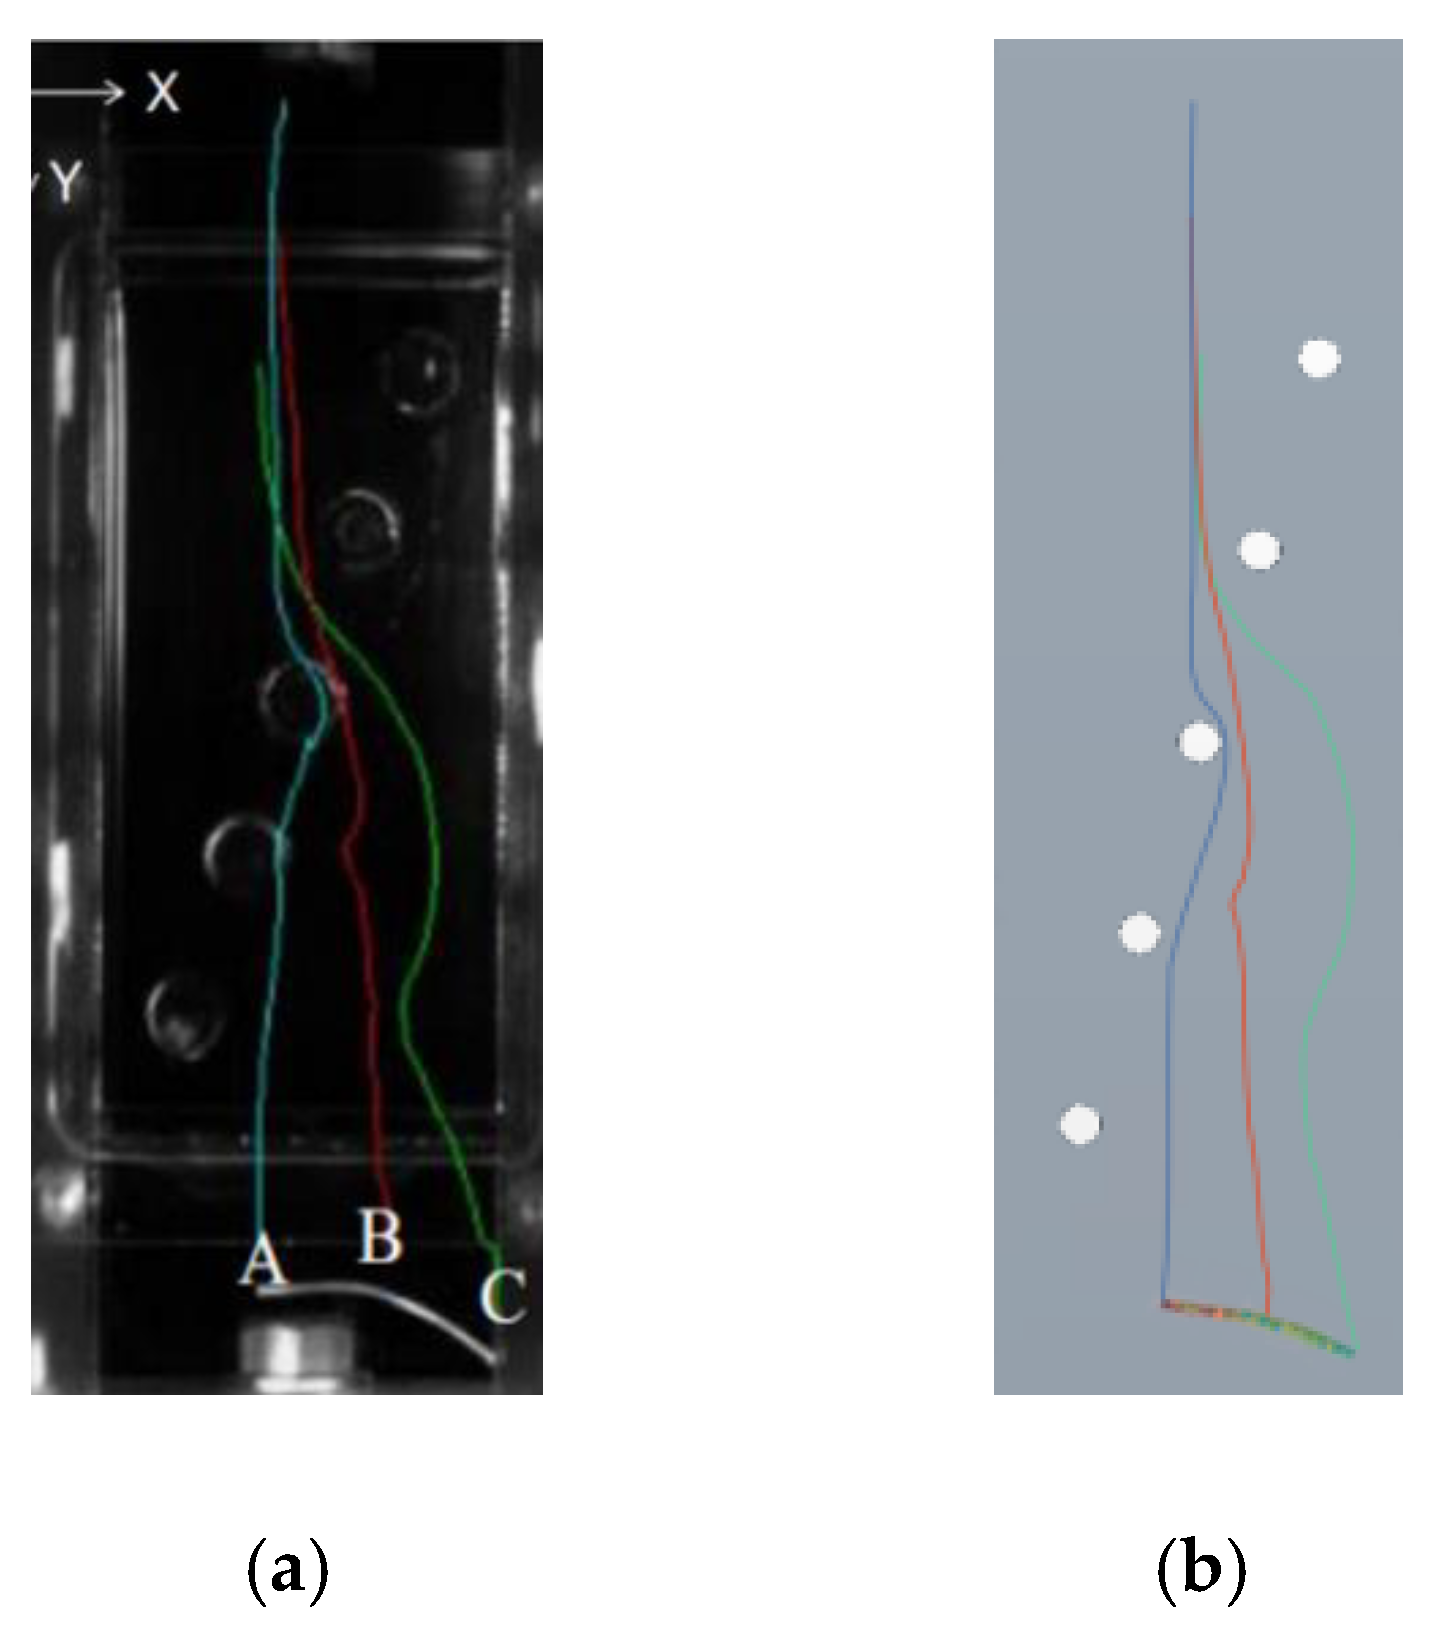
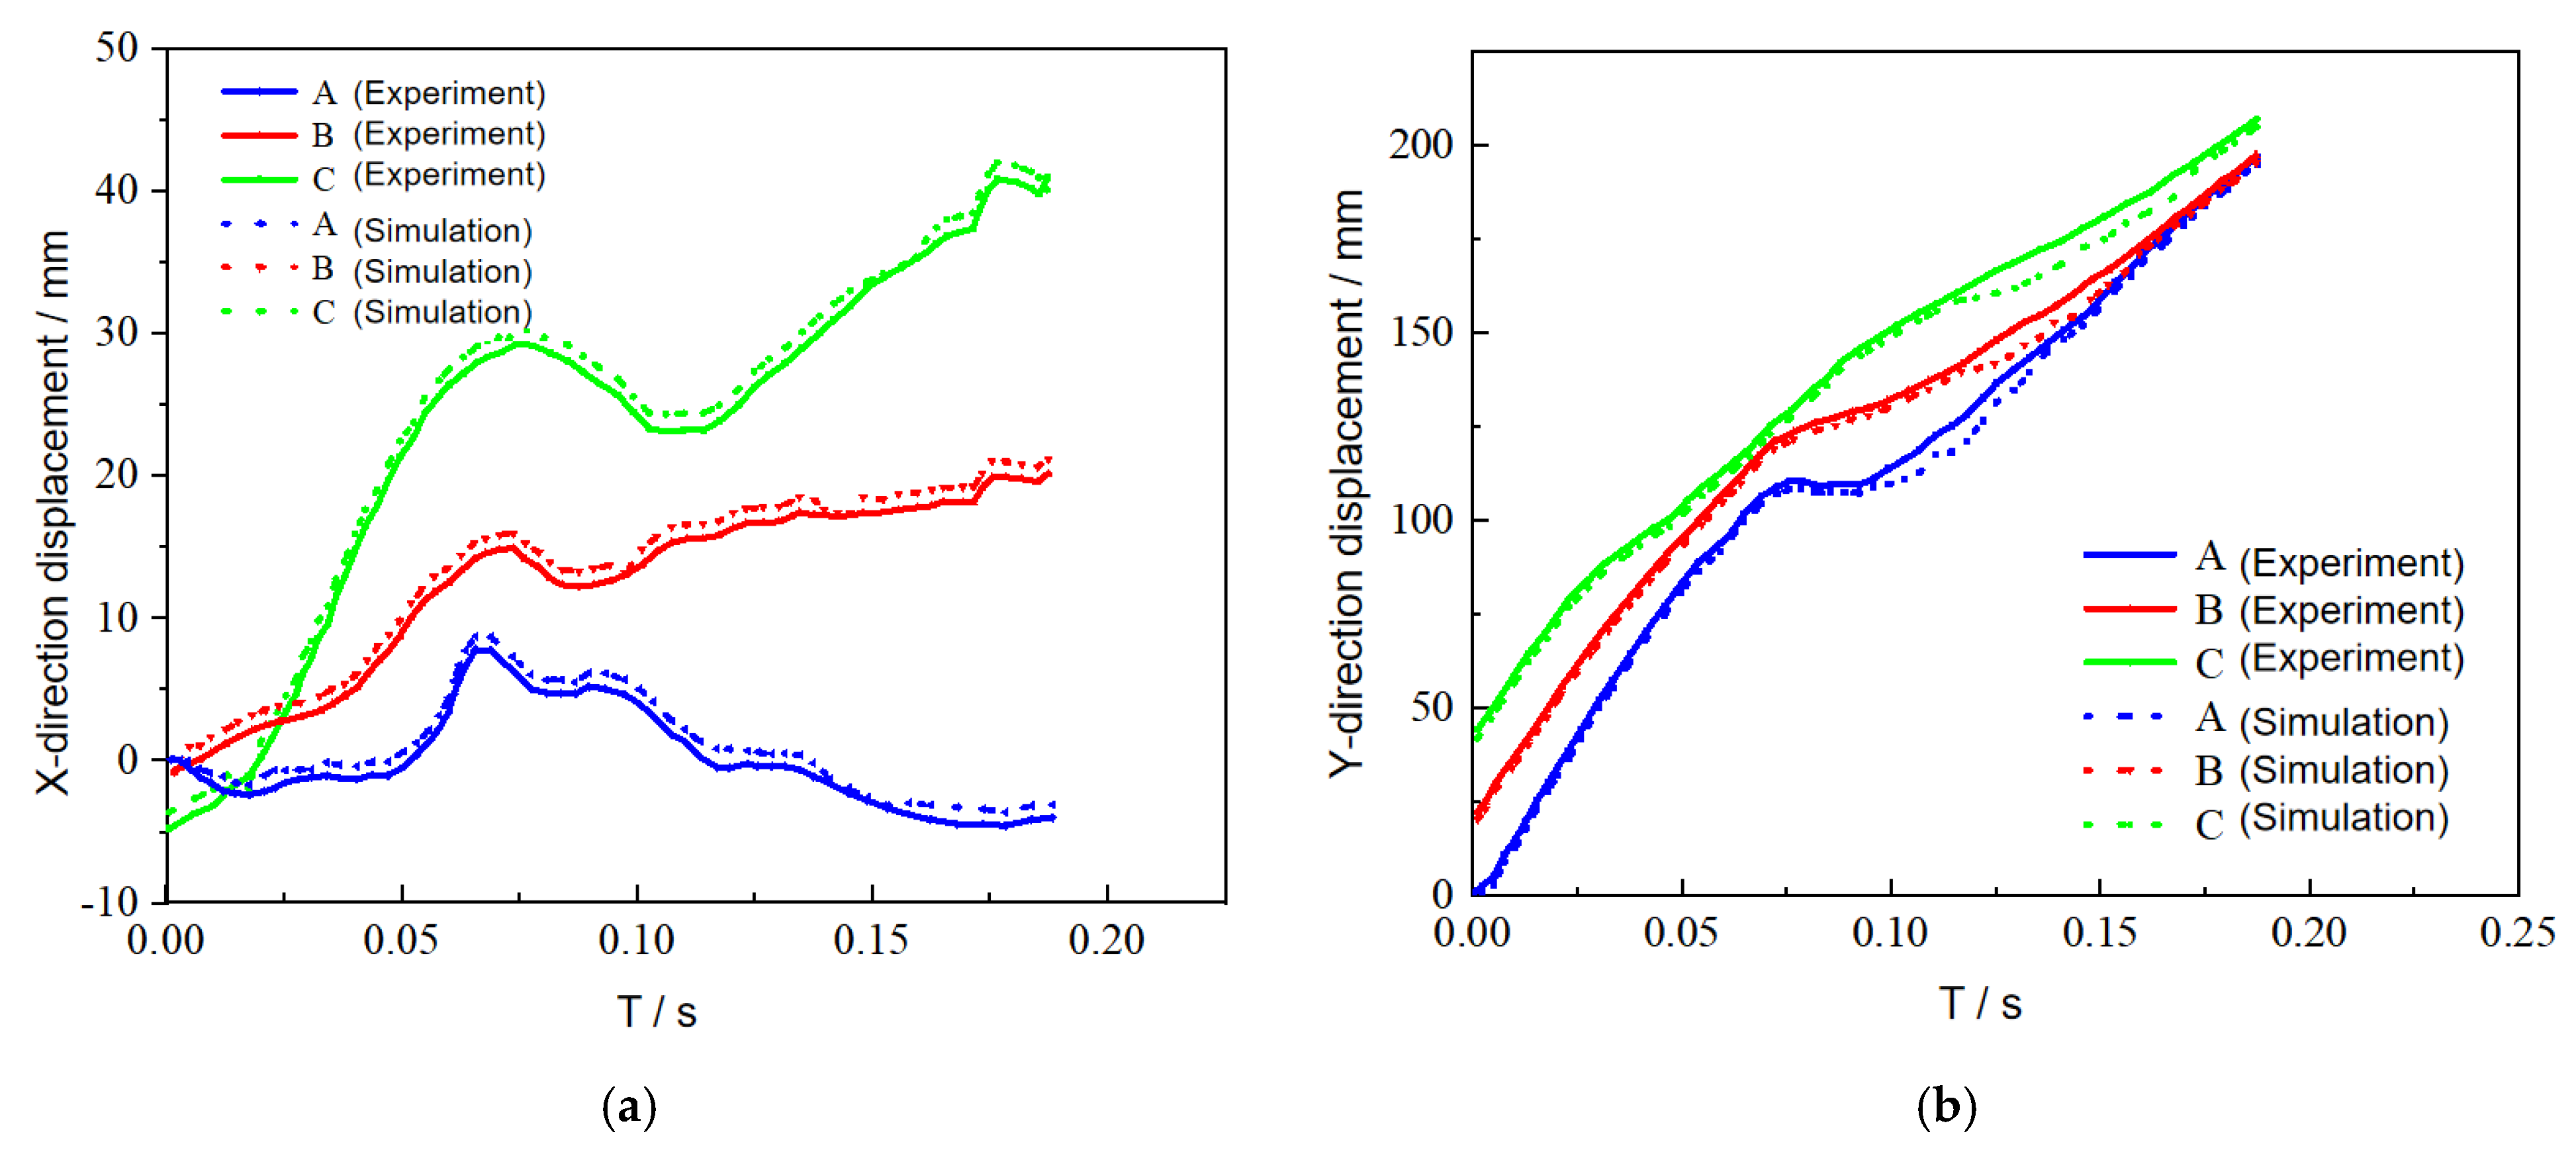
2.4. Method Verification
3. Numerical Method
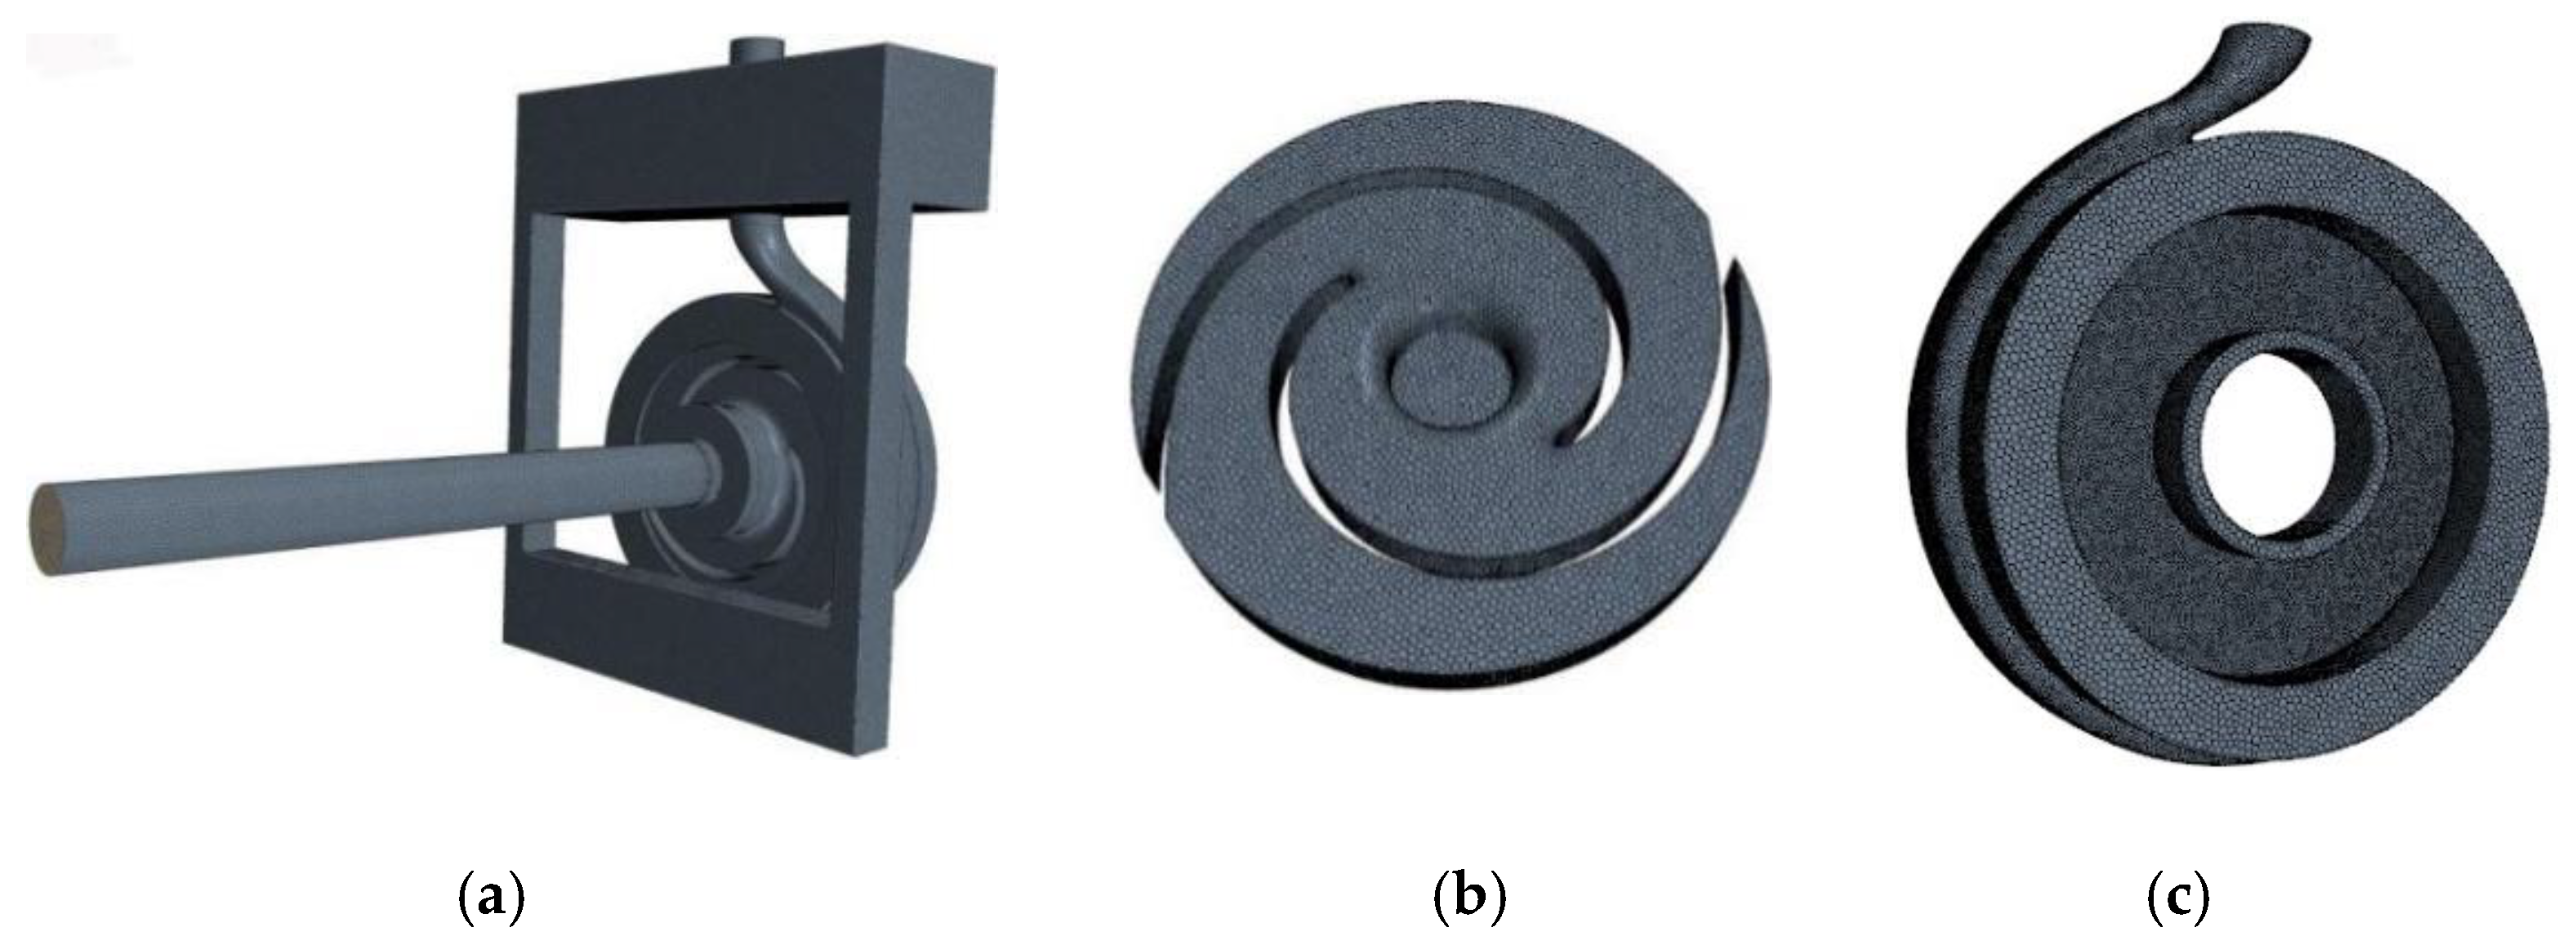
3.1. Object
3.2. Grid and Boundary Conditions
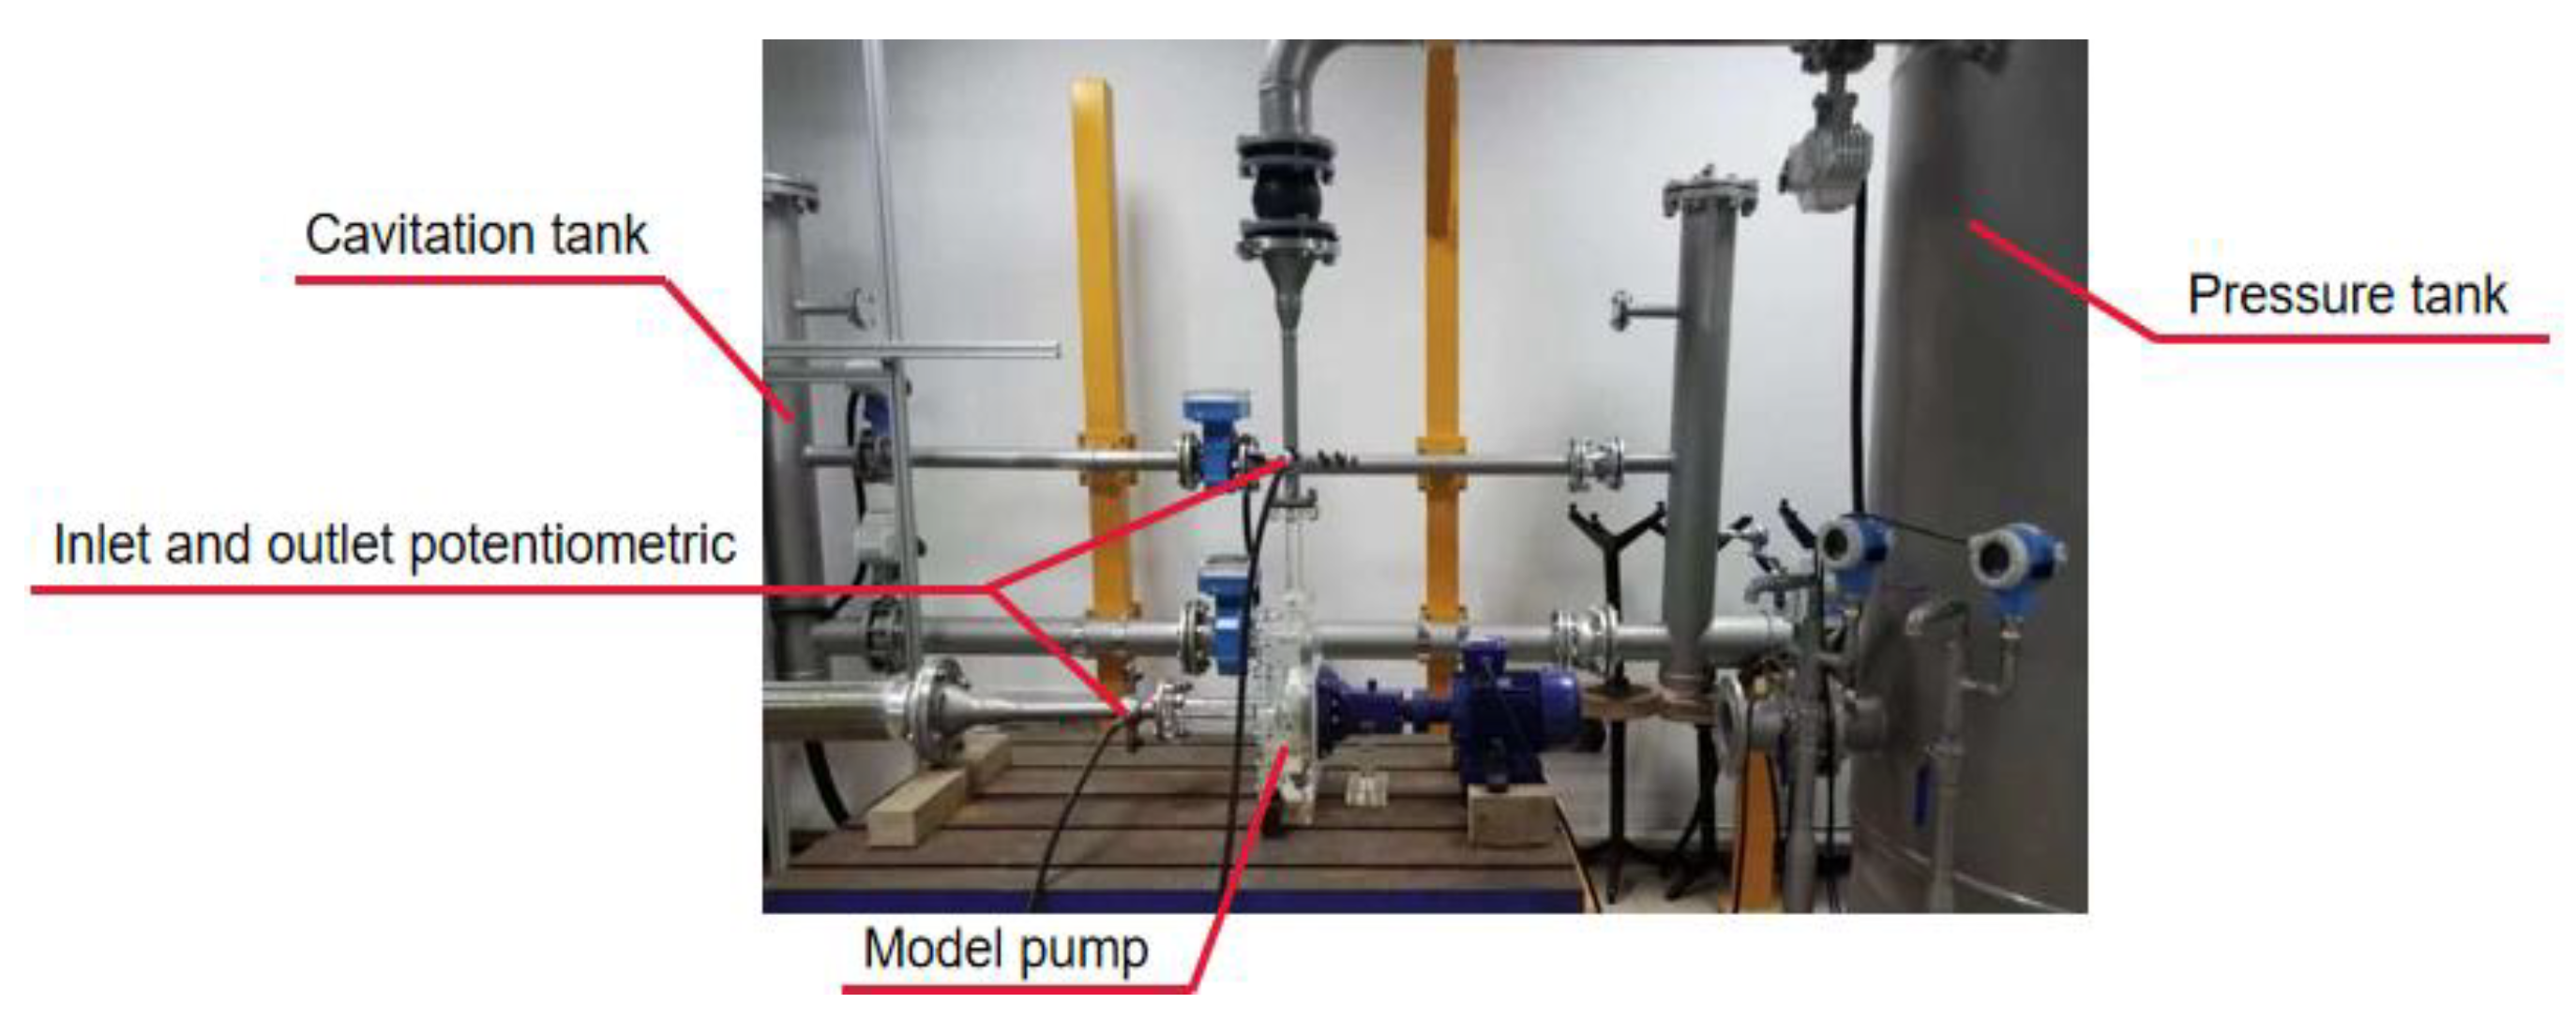
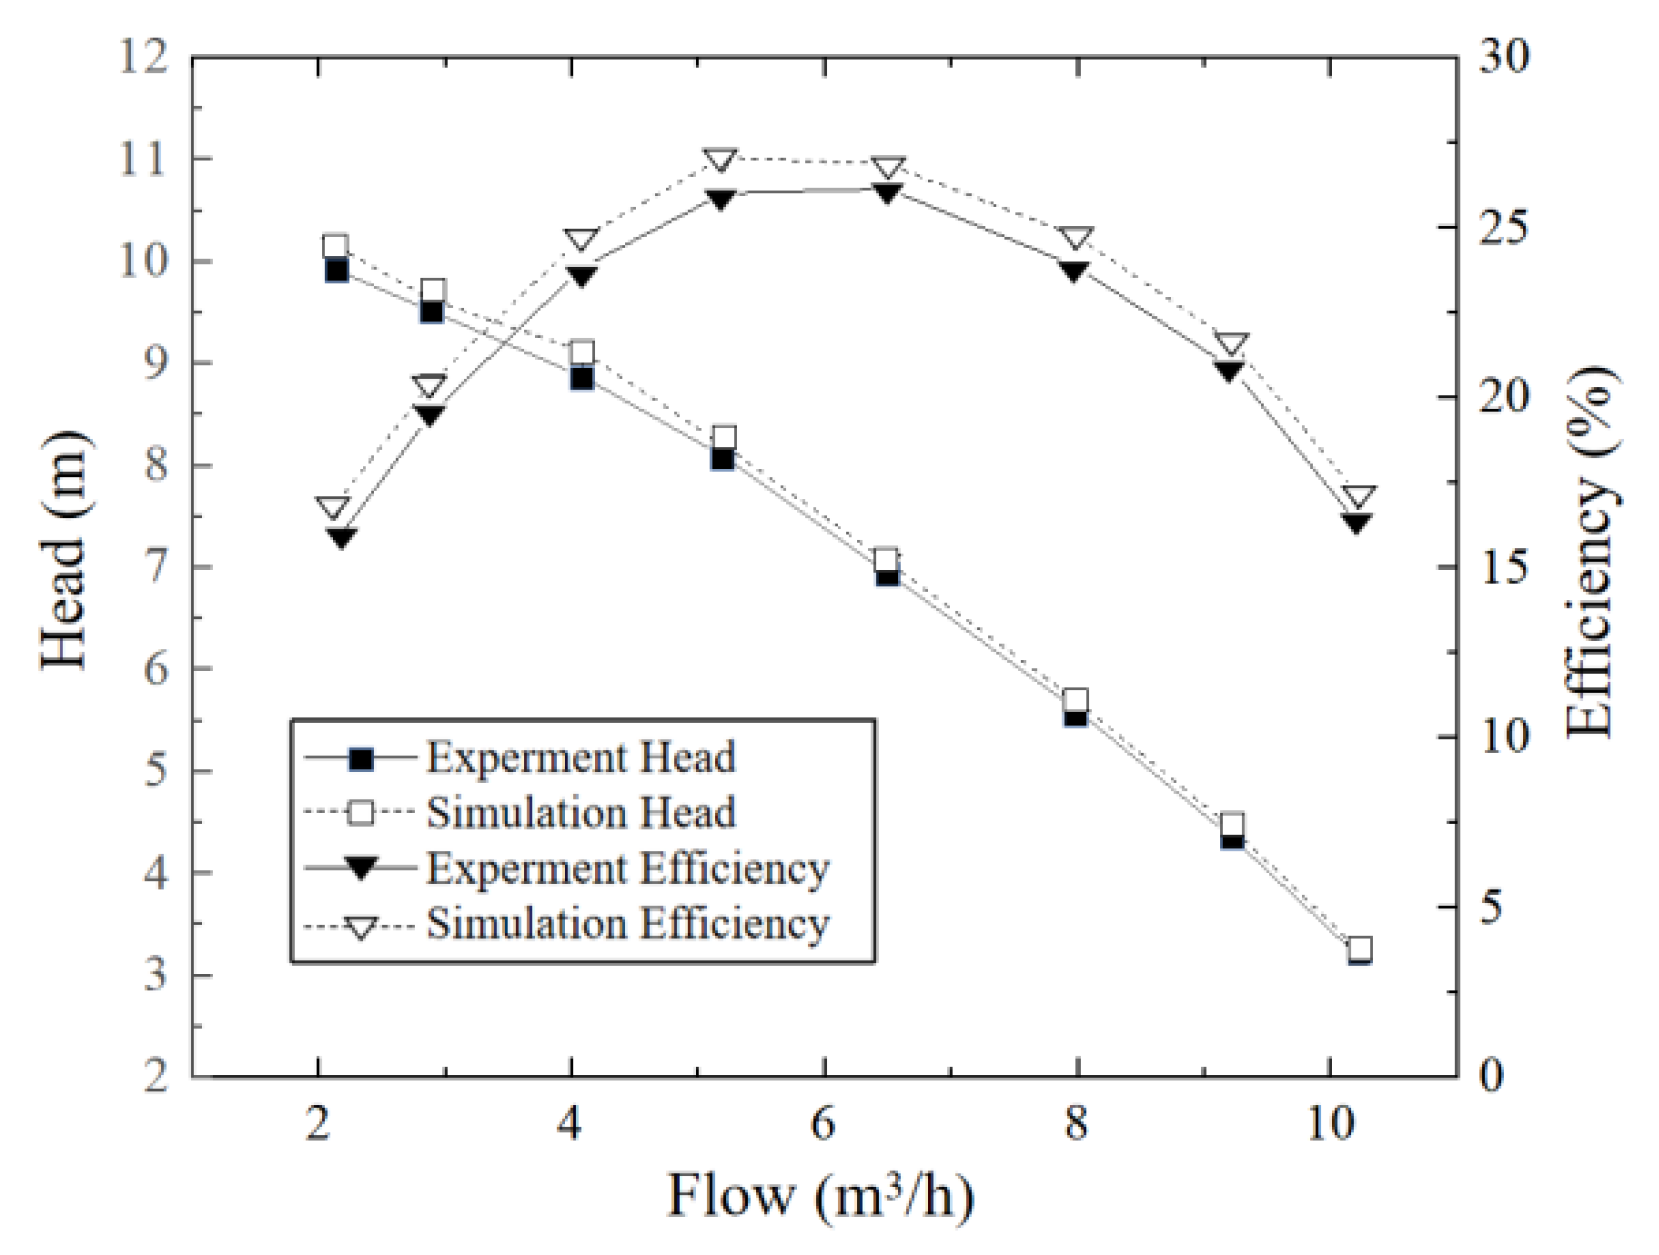
3.3. External Characteristic Experiment
4. Fiber Motion Analysis
4.1. Trajectory Analysis
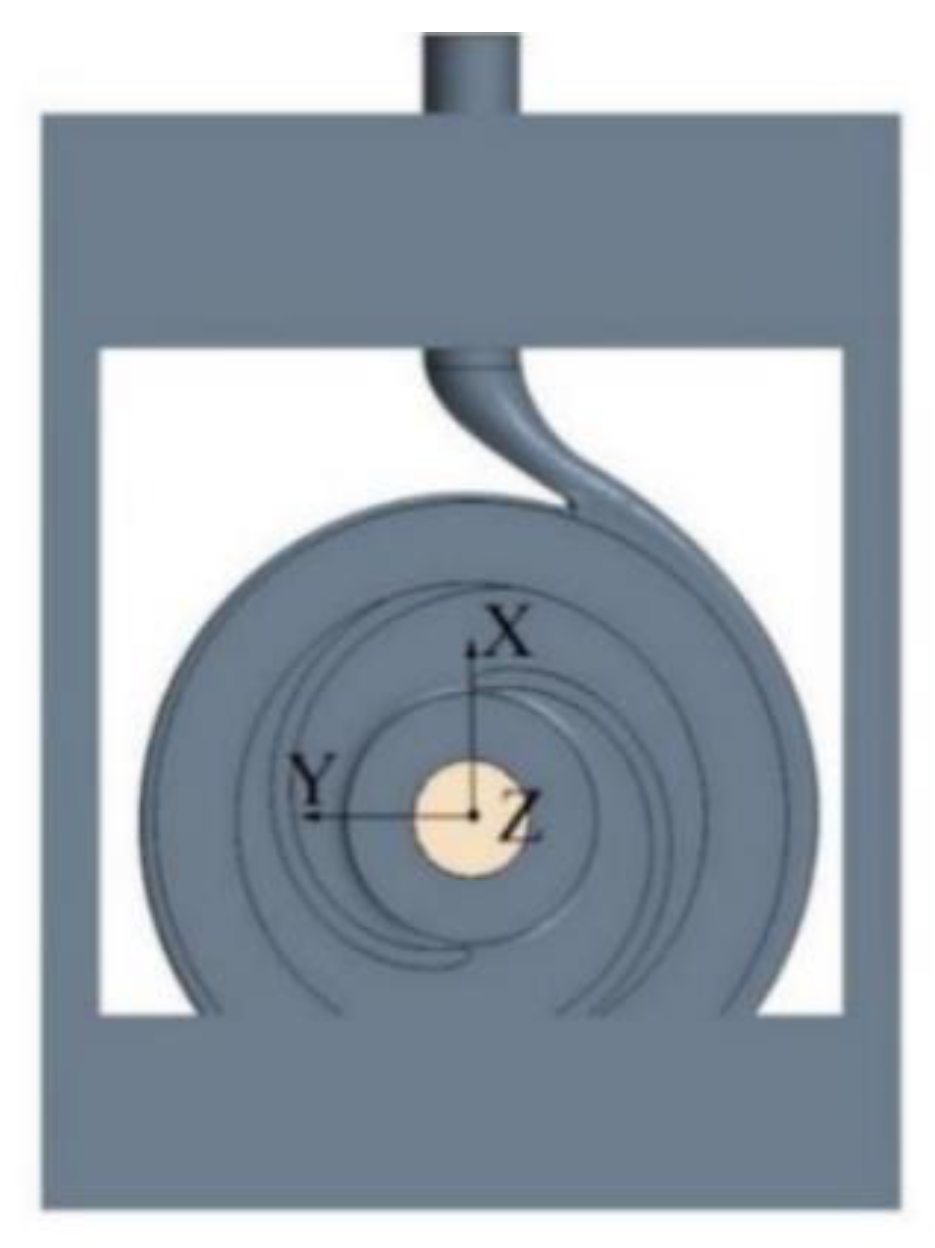
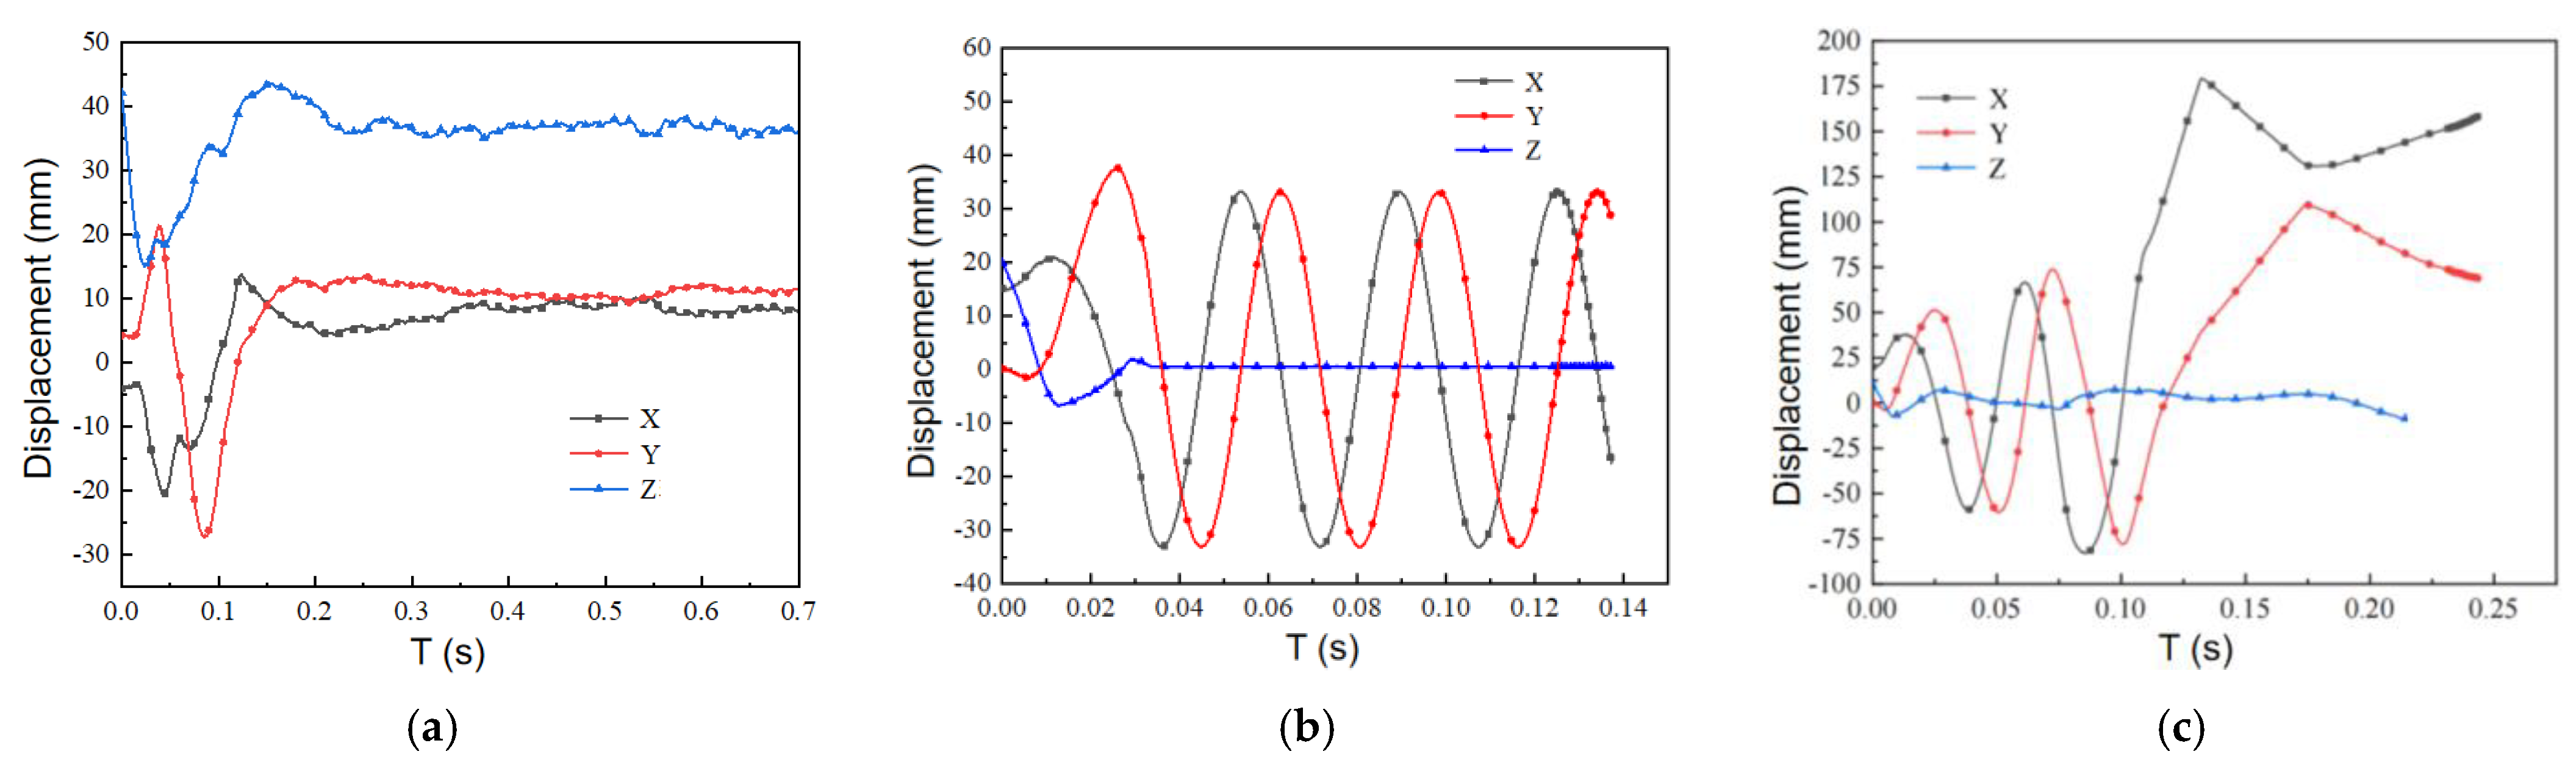
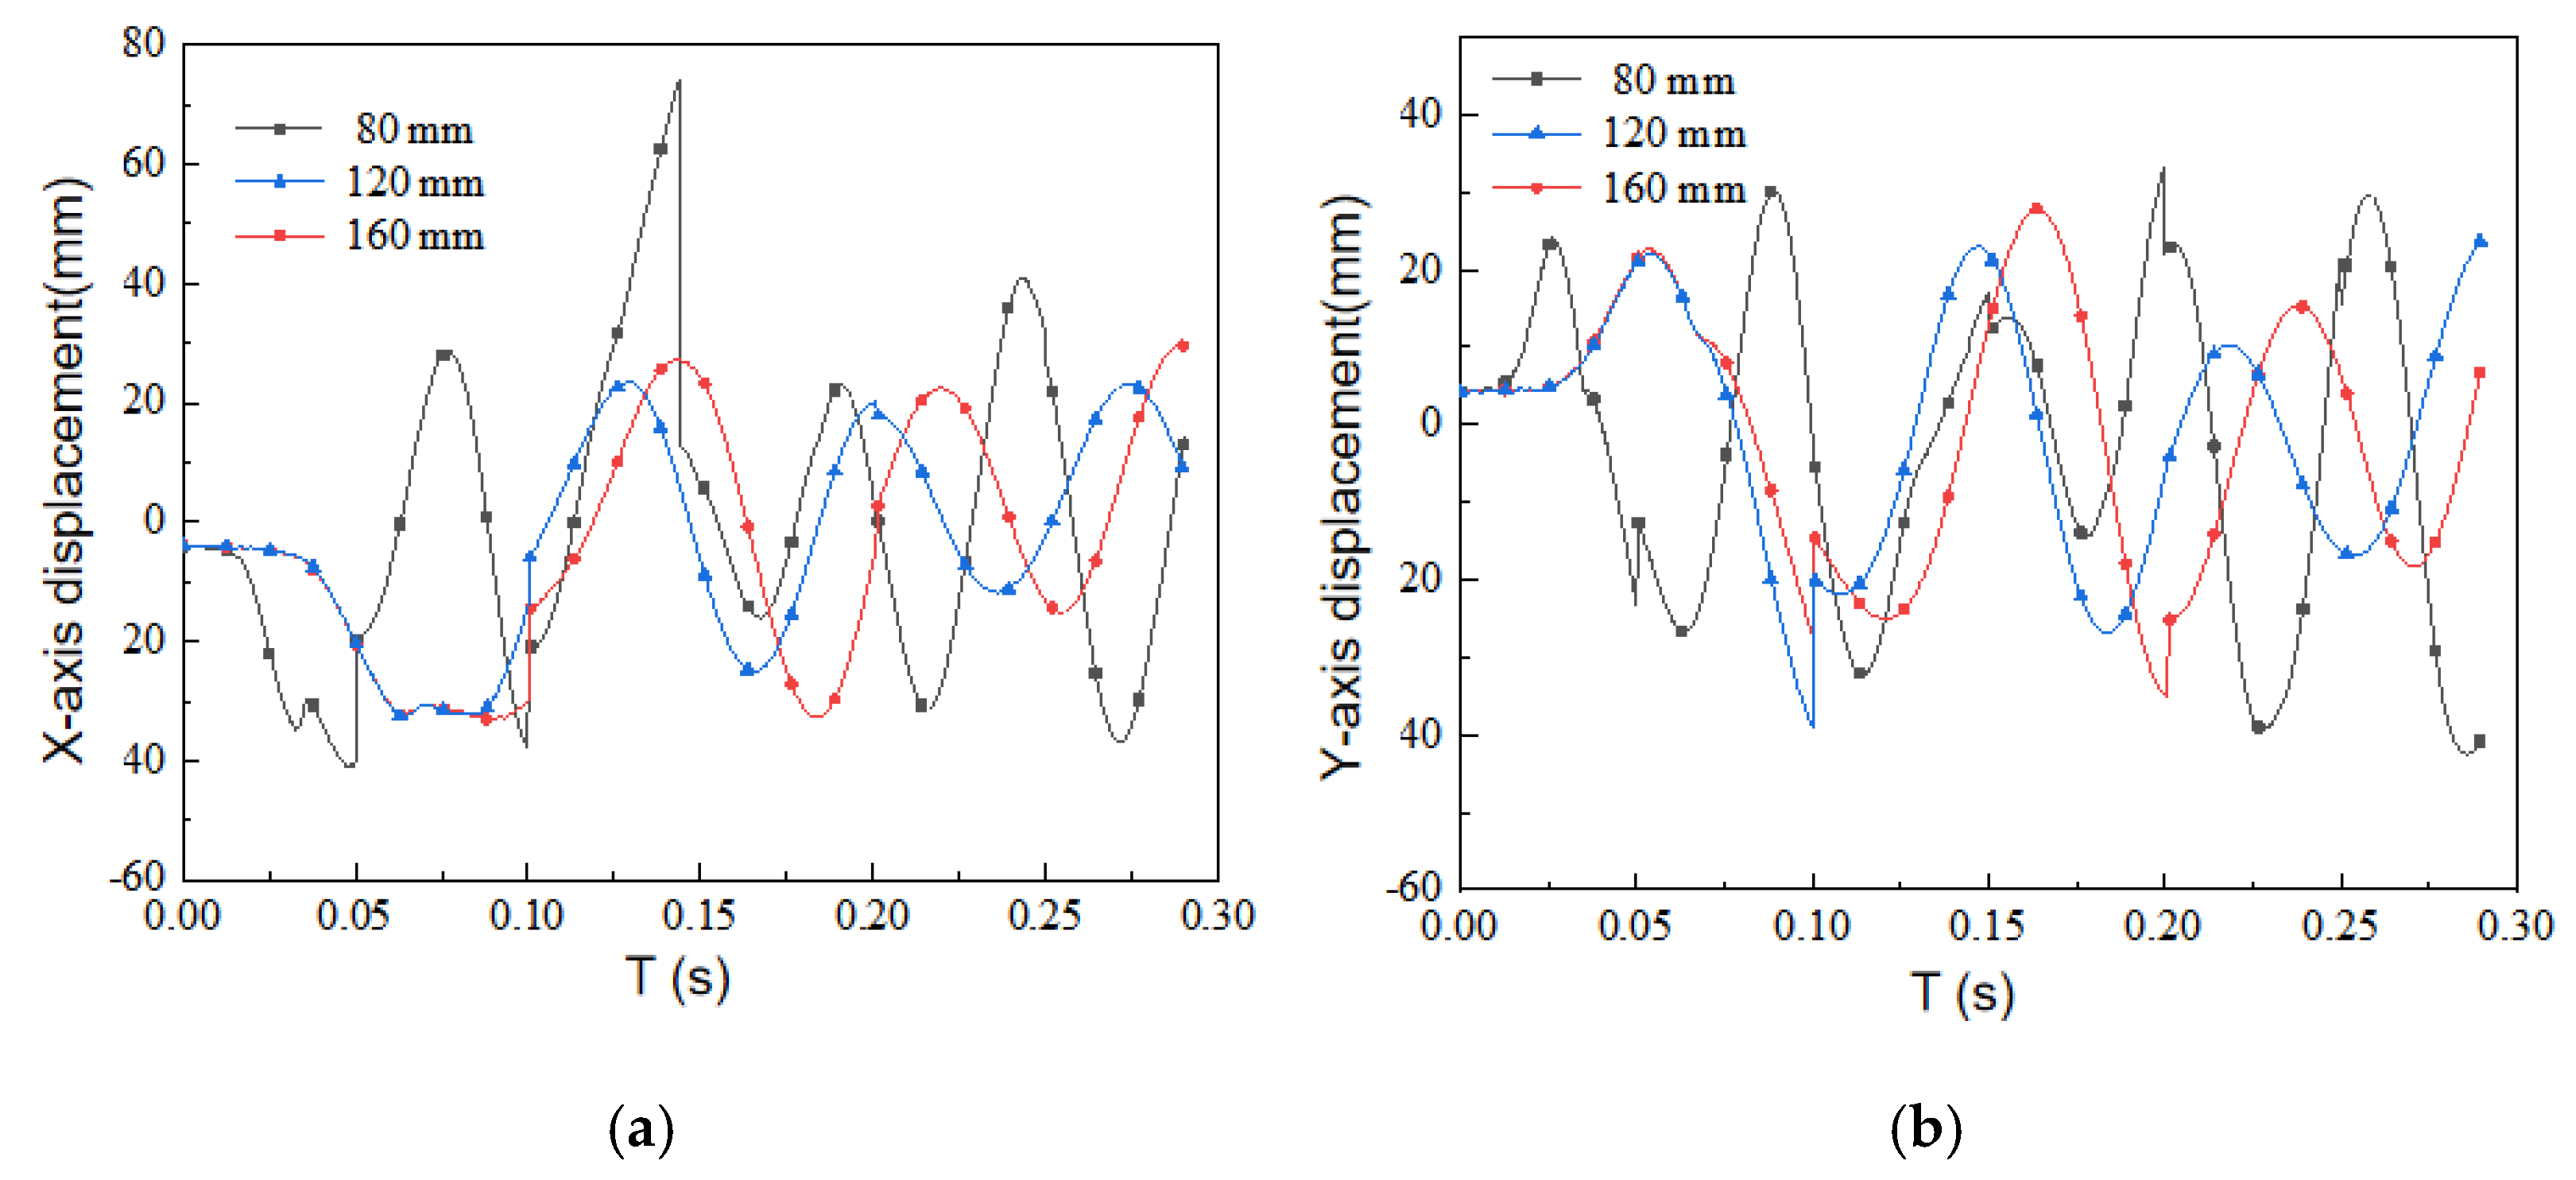
4.2. Position Analysis
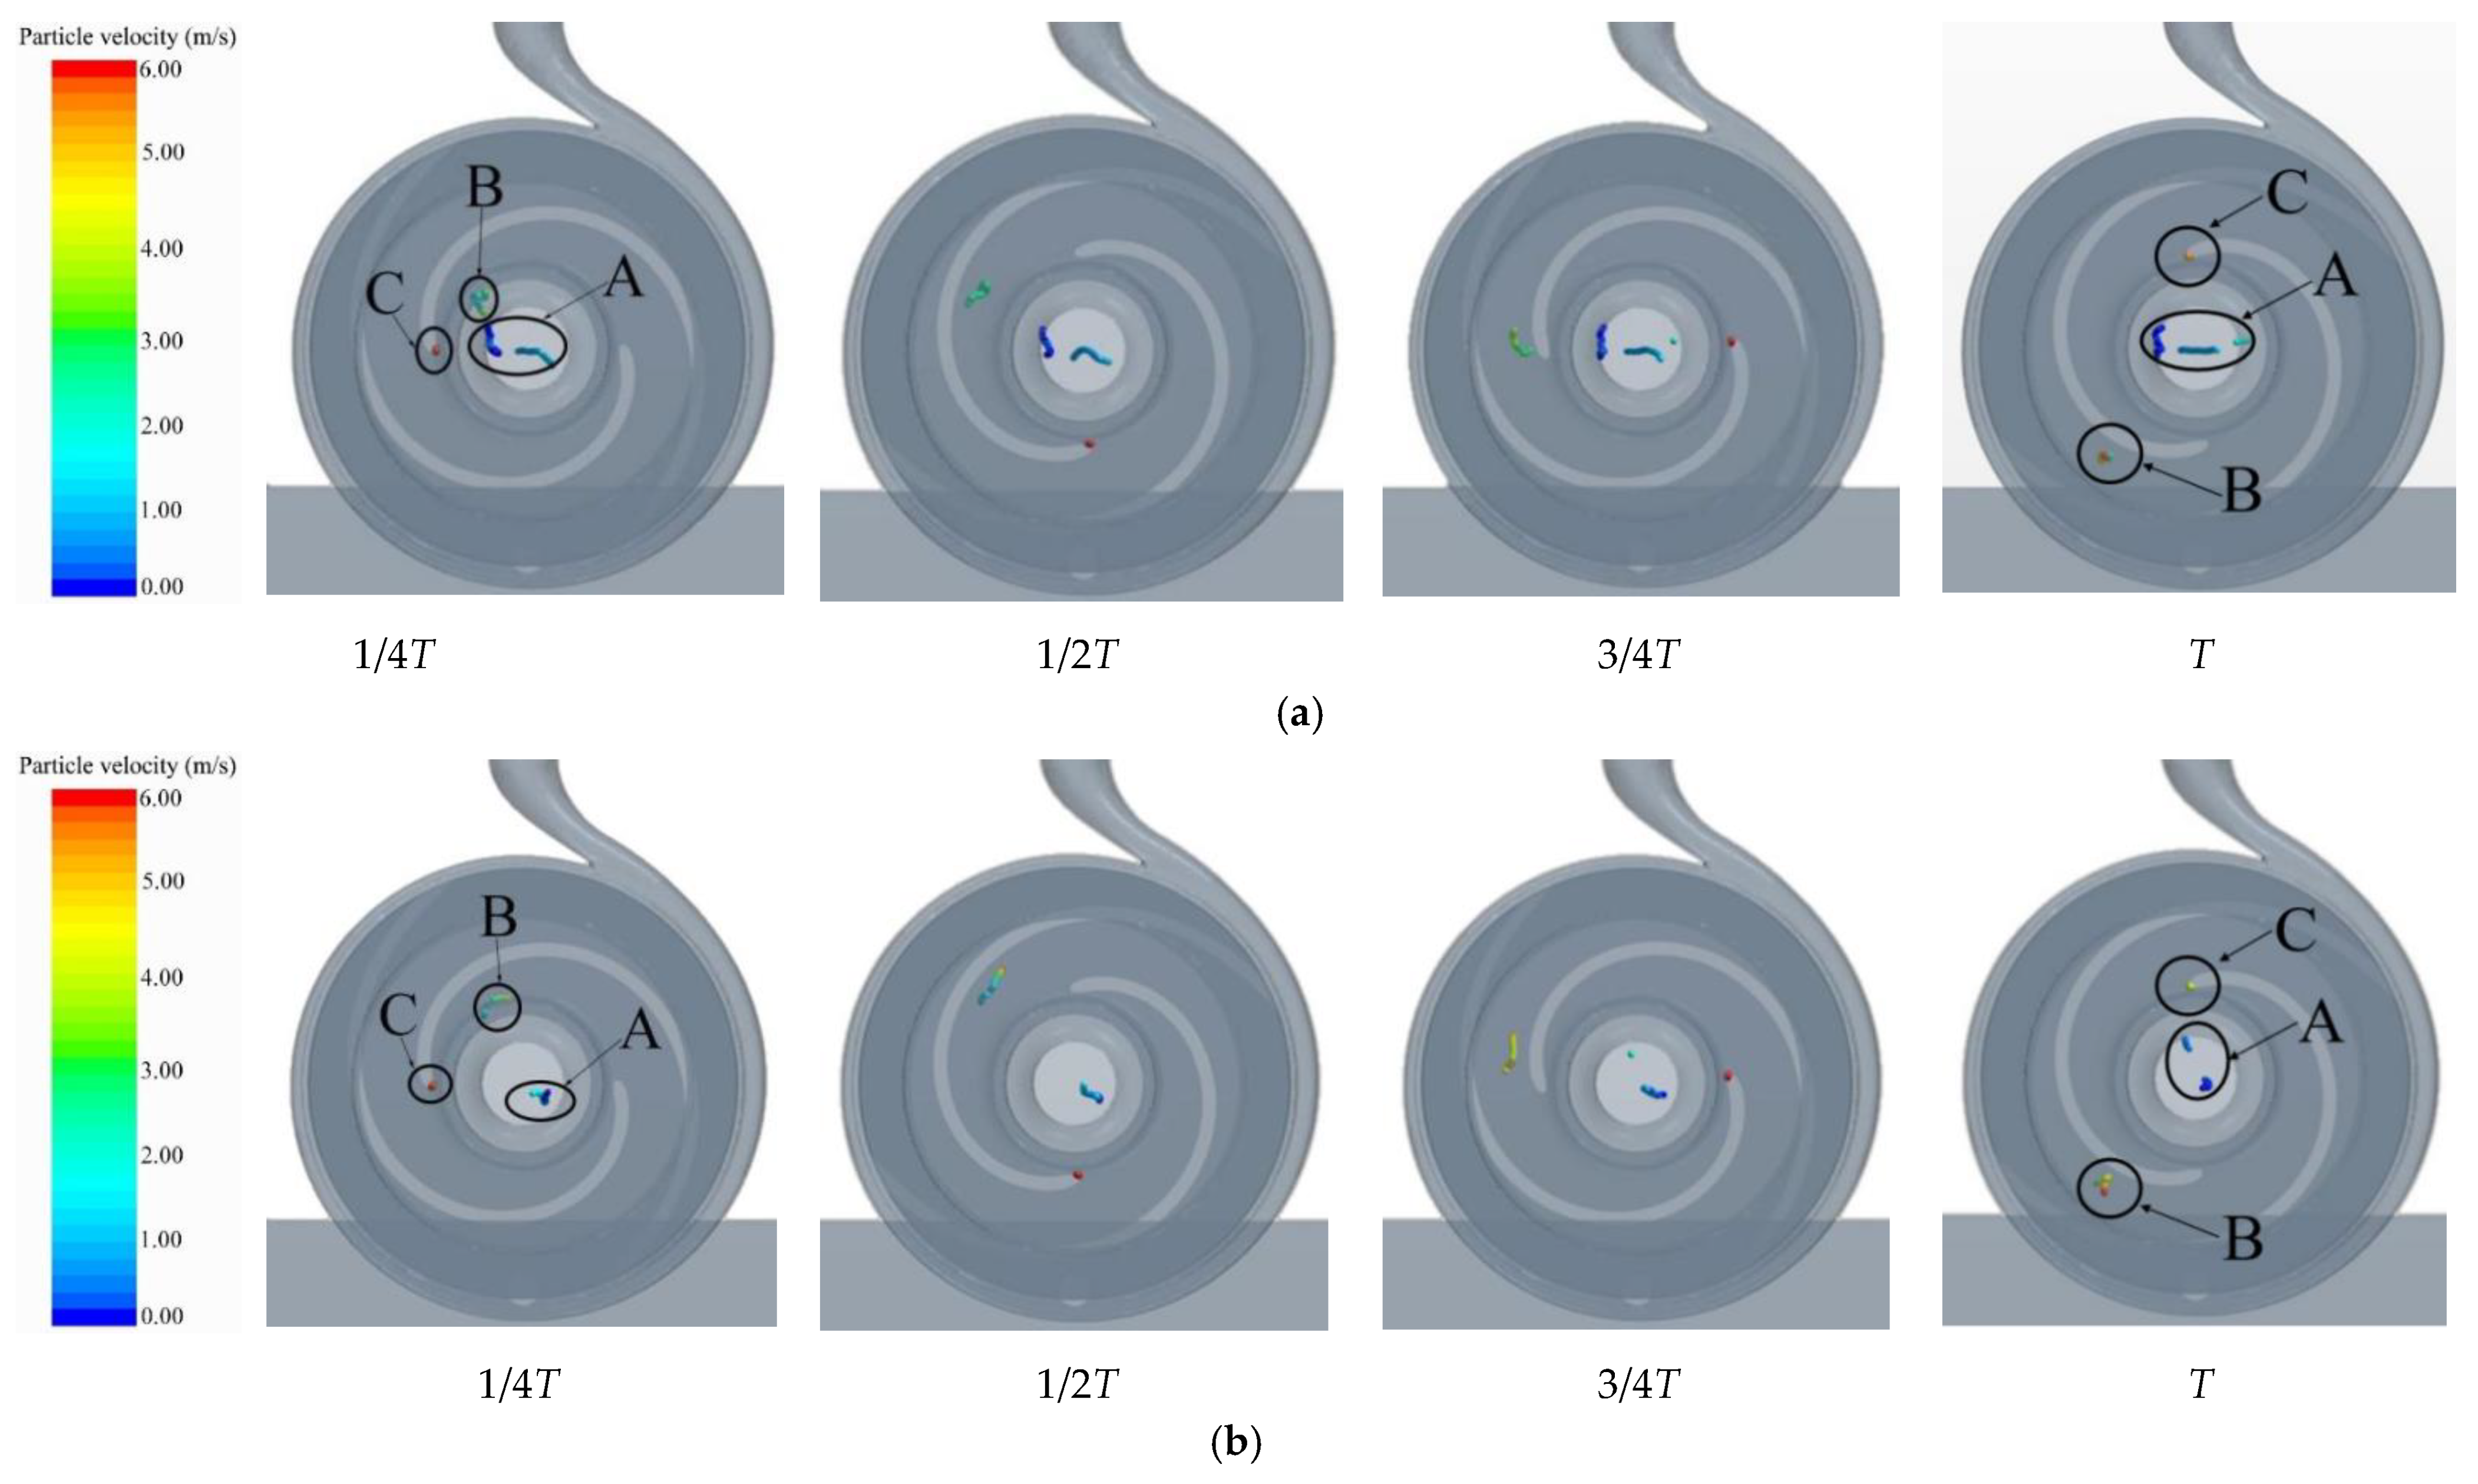
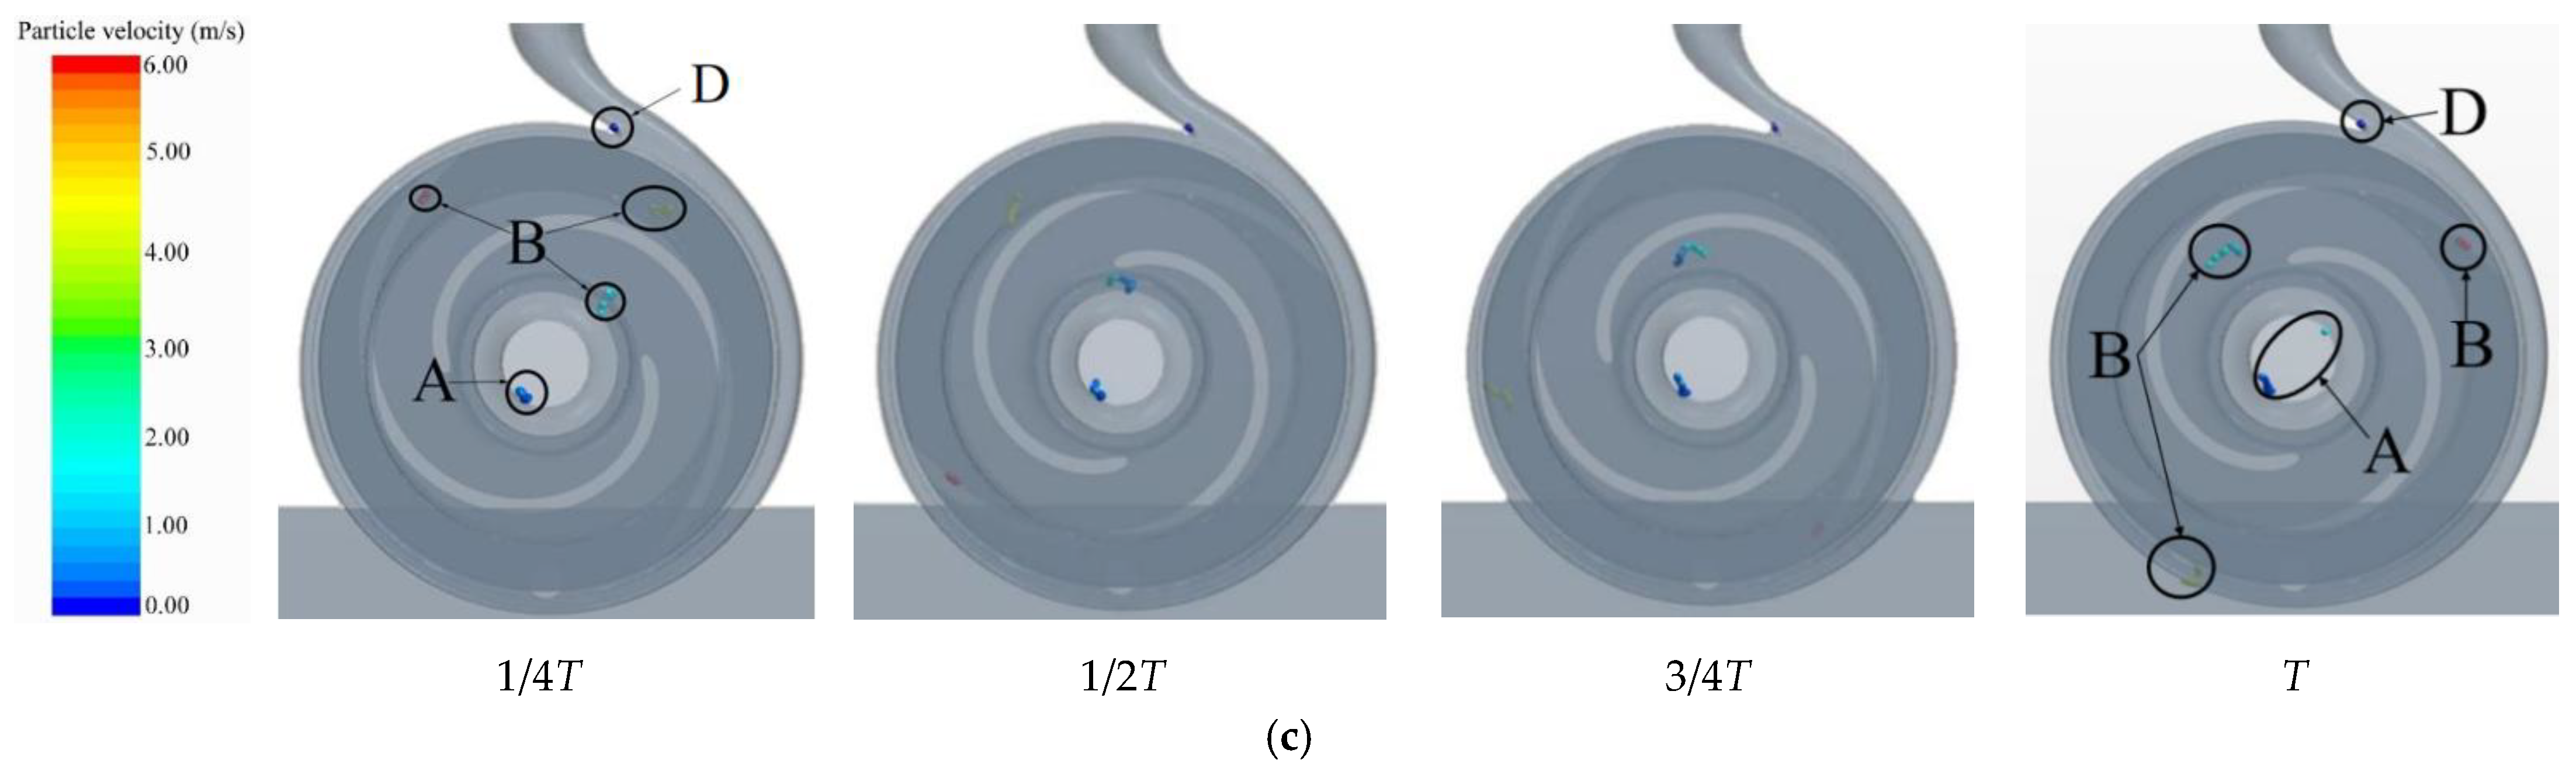
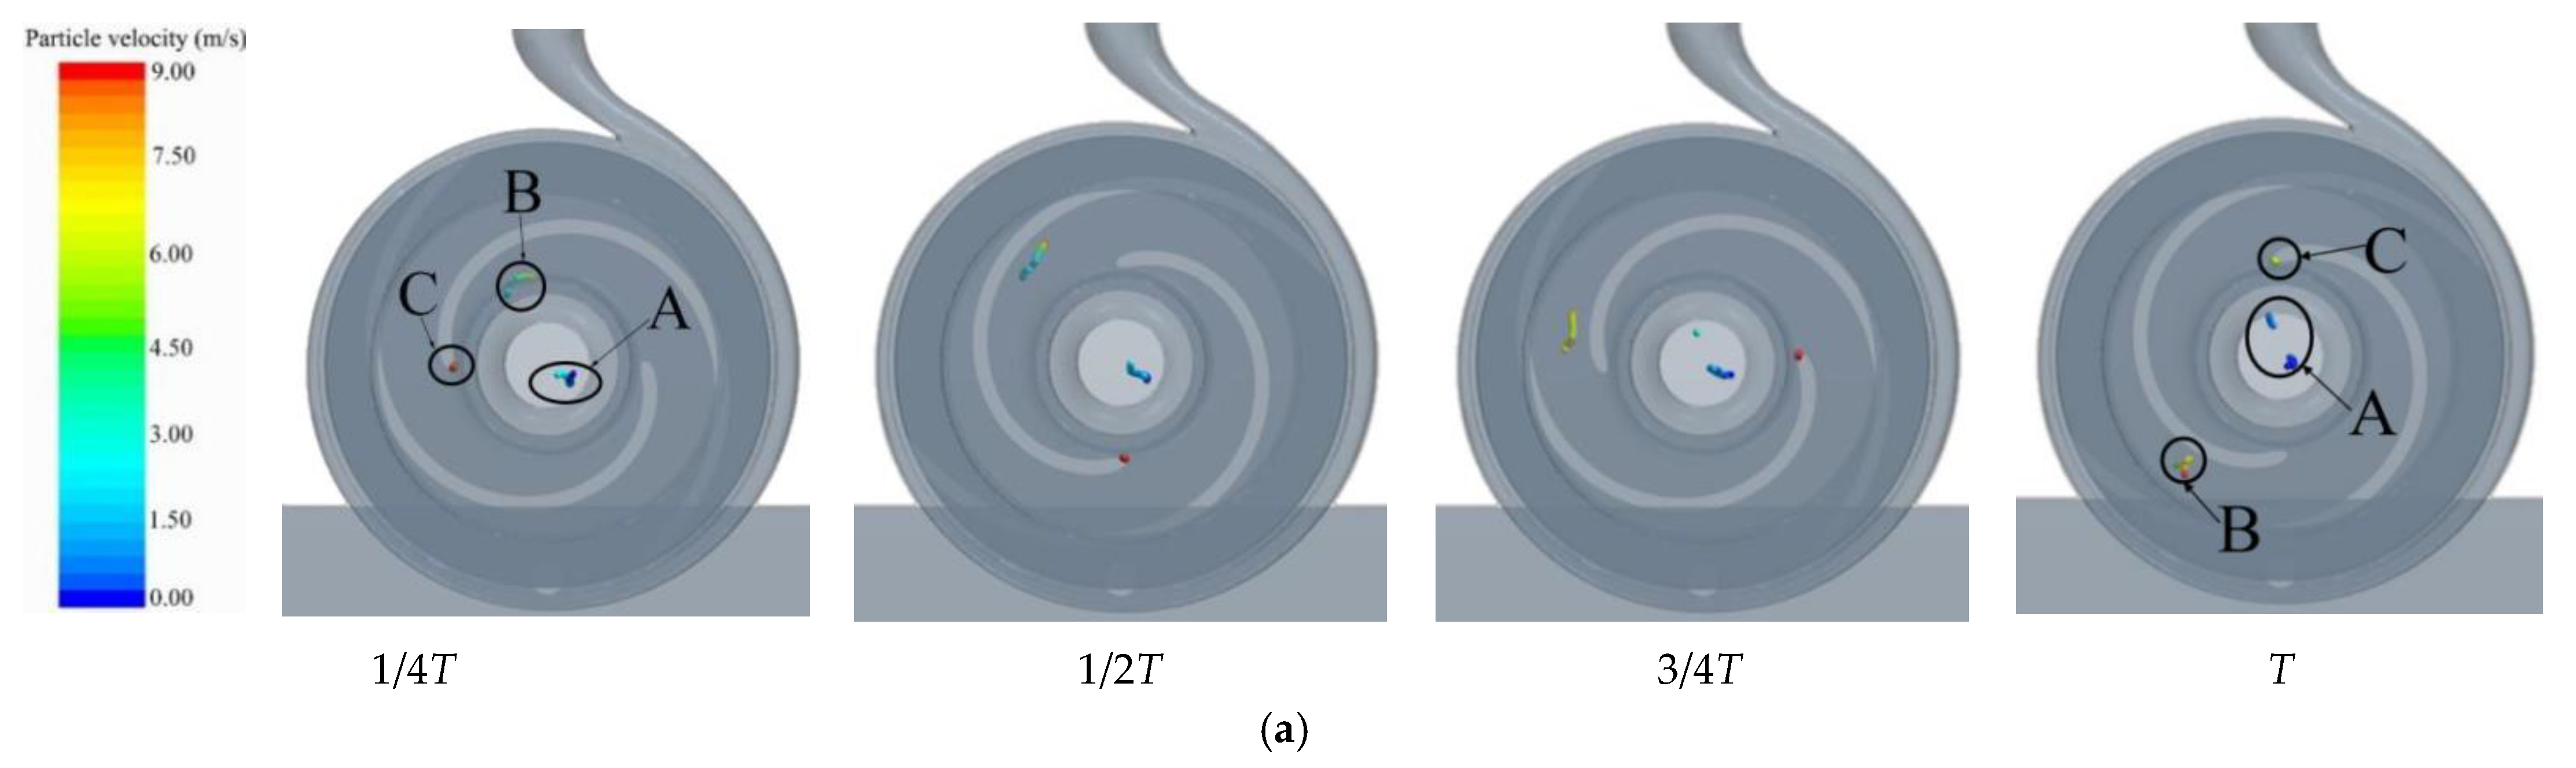
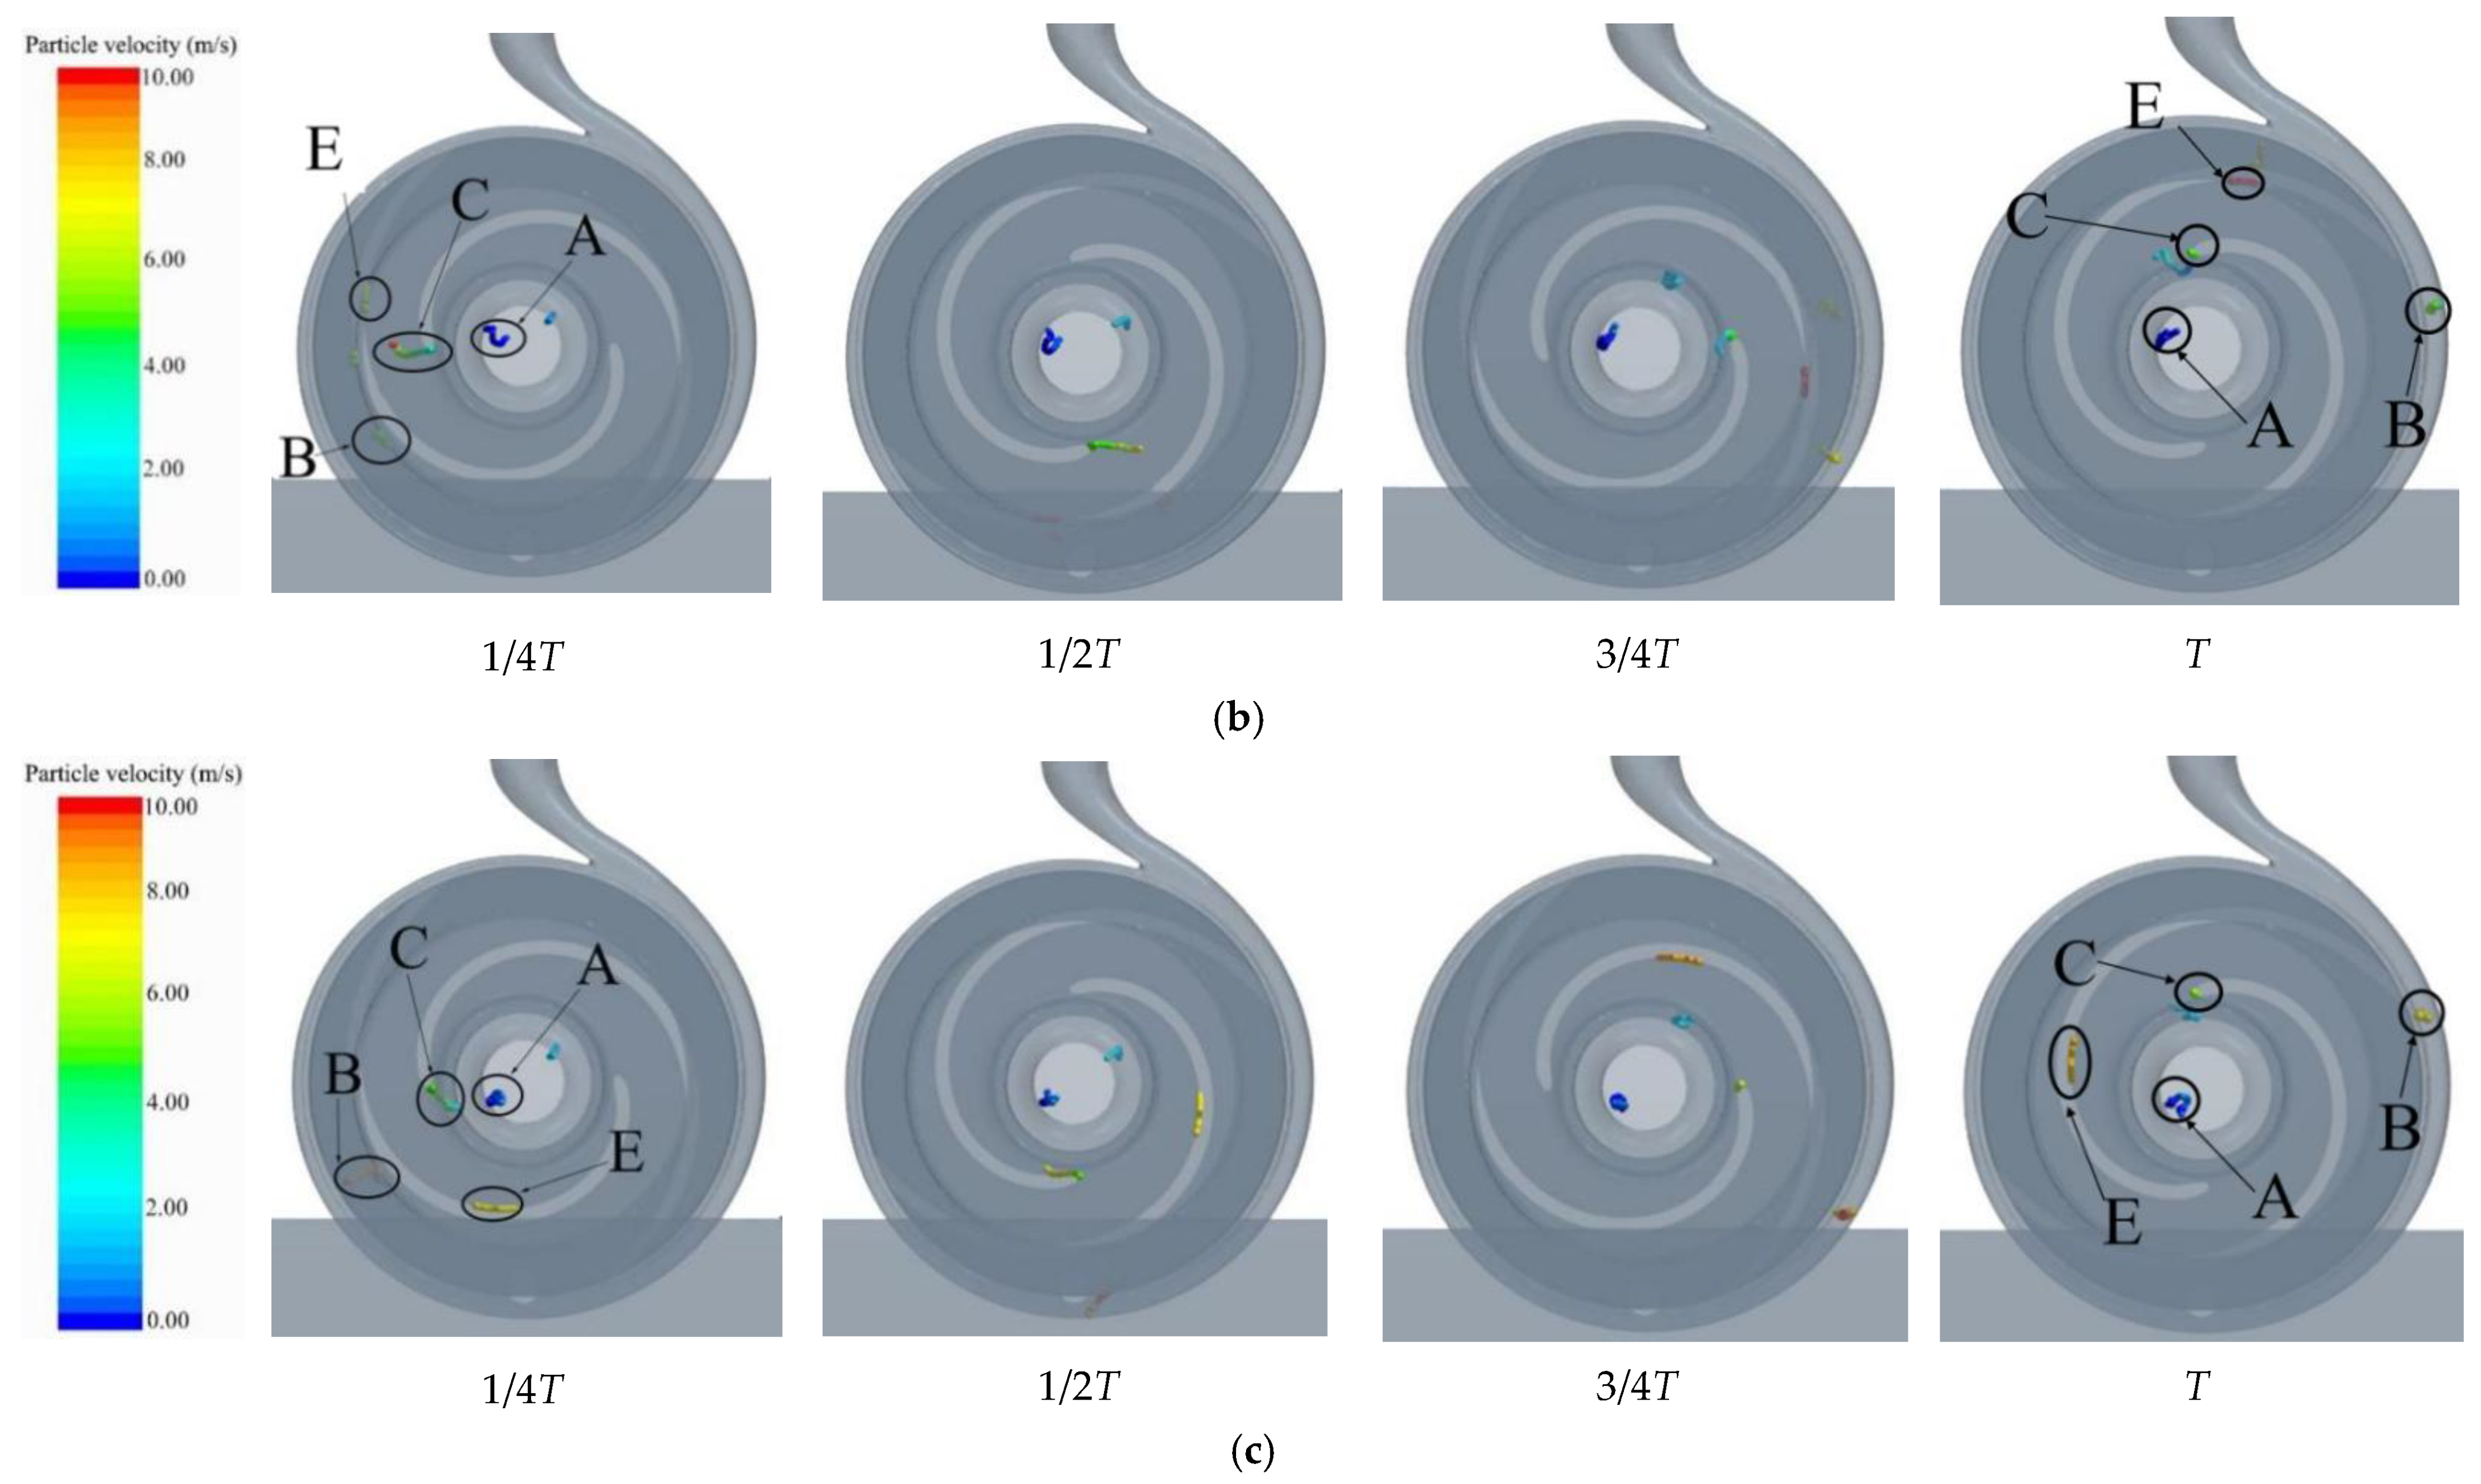
4.3. Velocity Vector Analysis
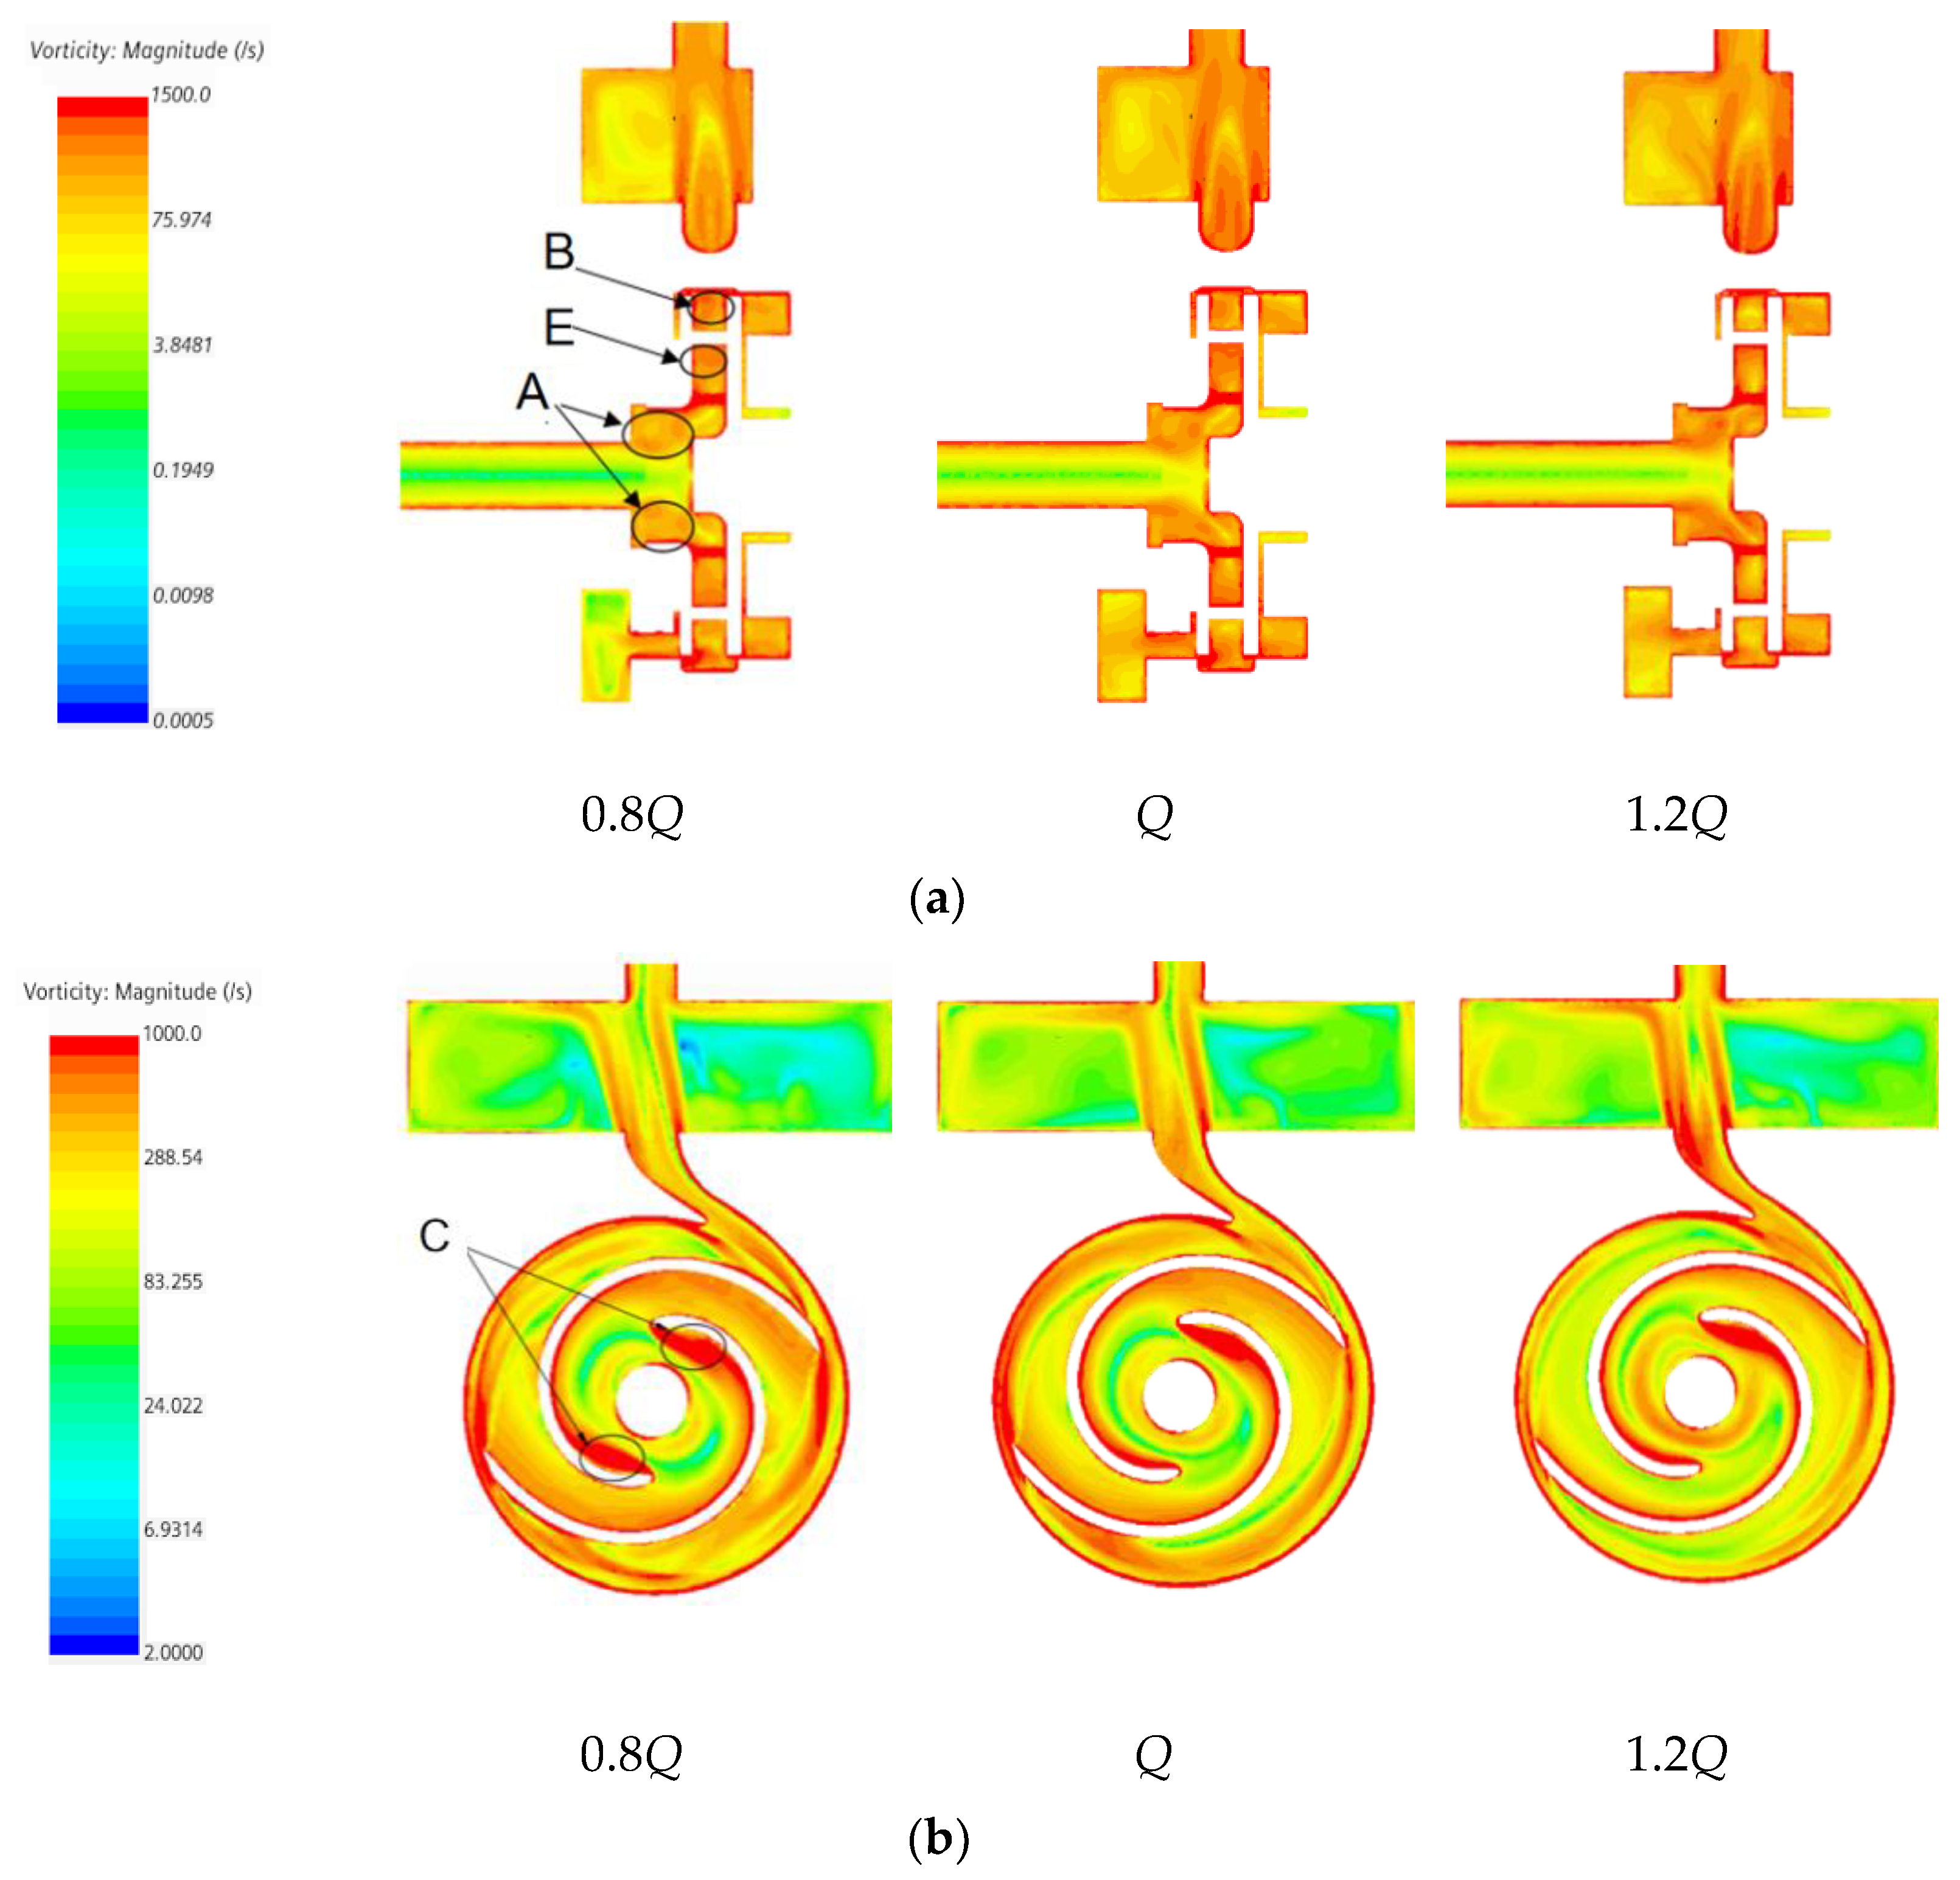
4.4. Vorticity Analysis
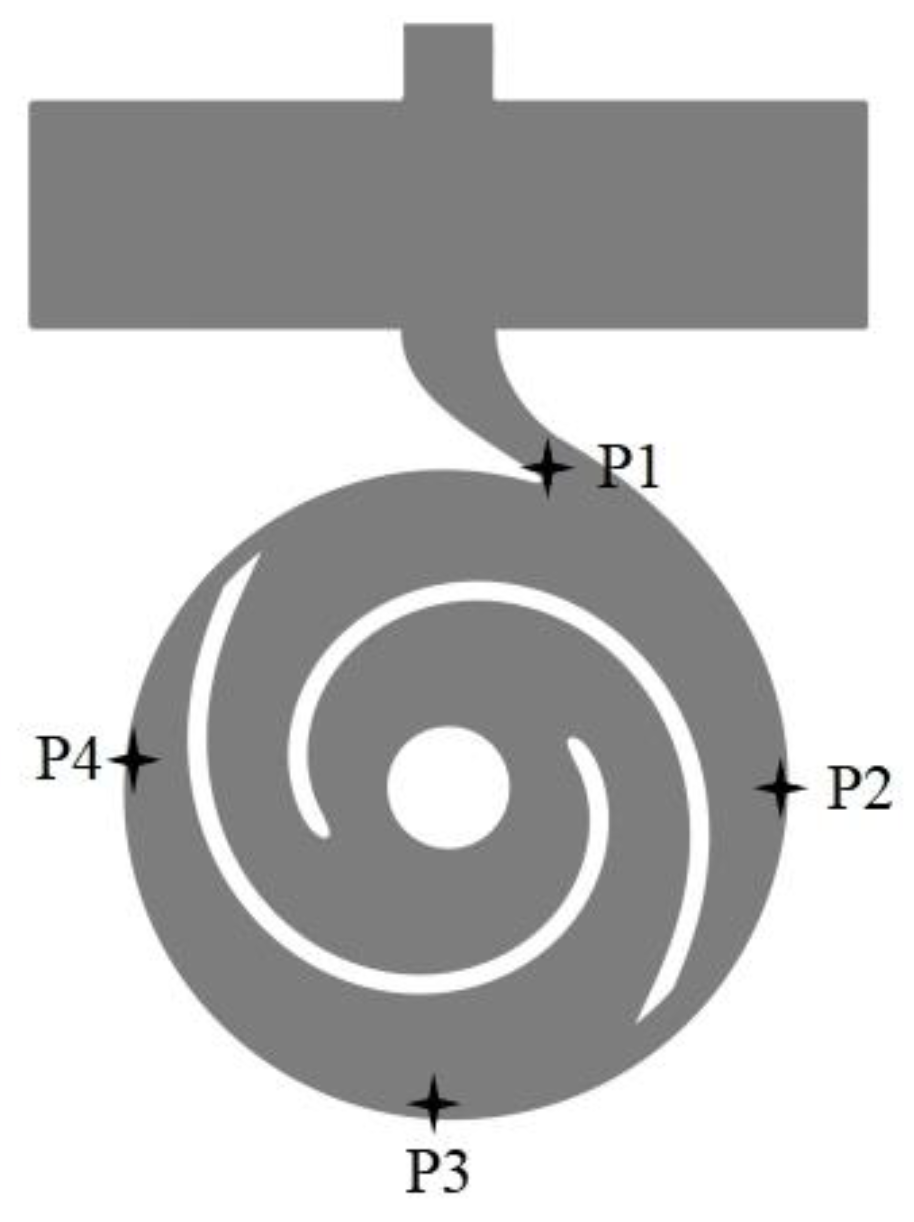
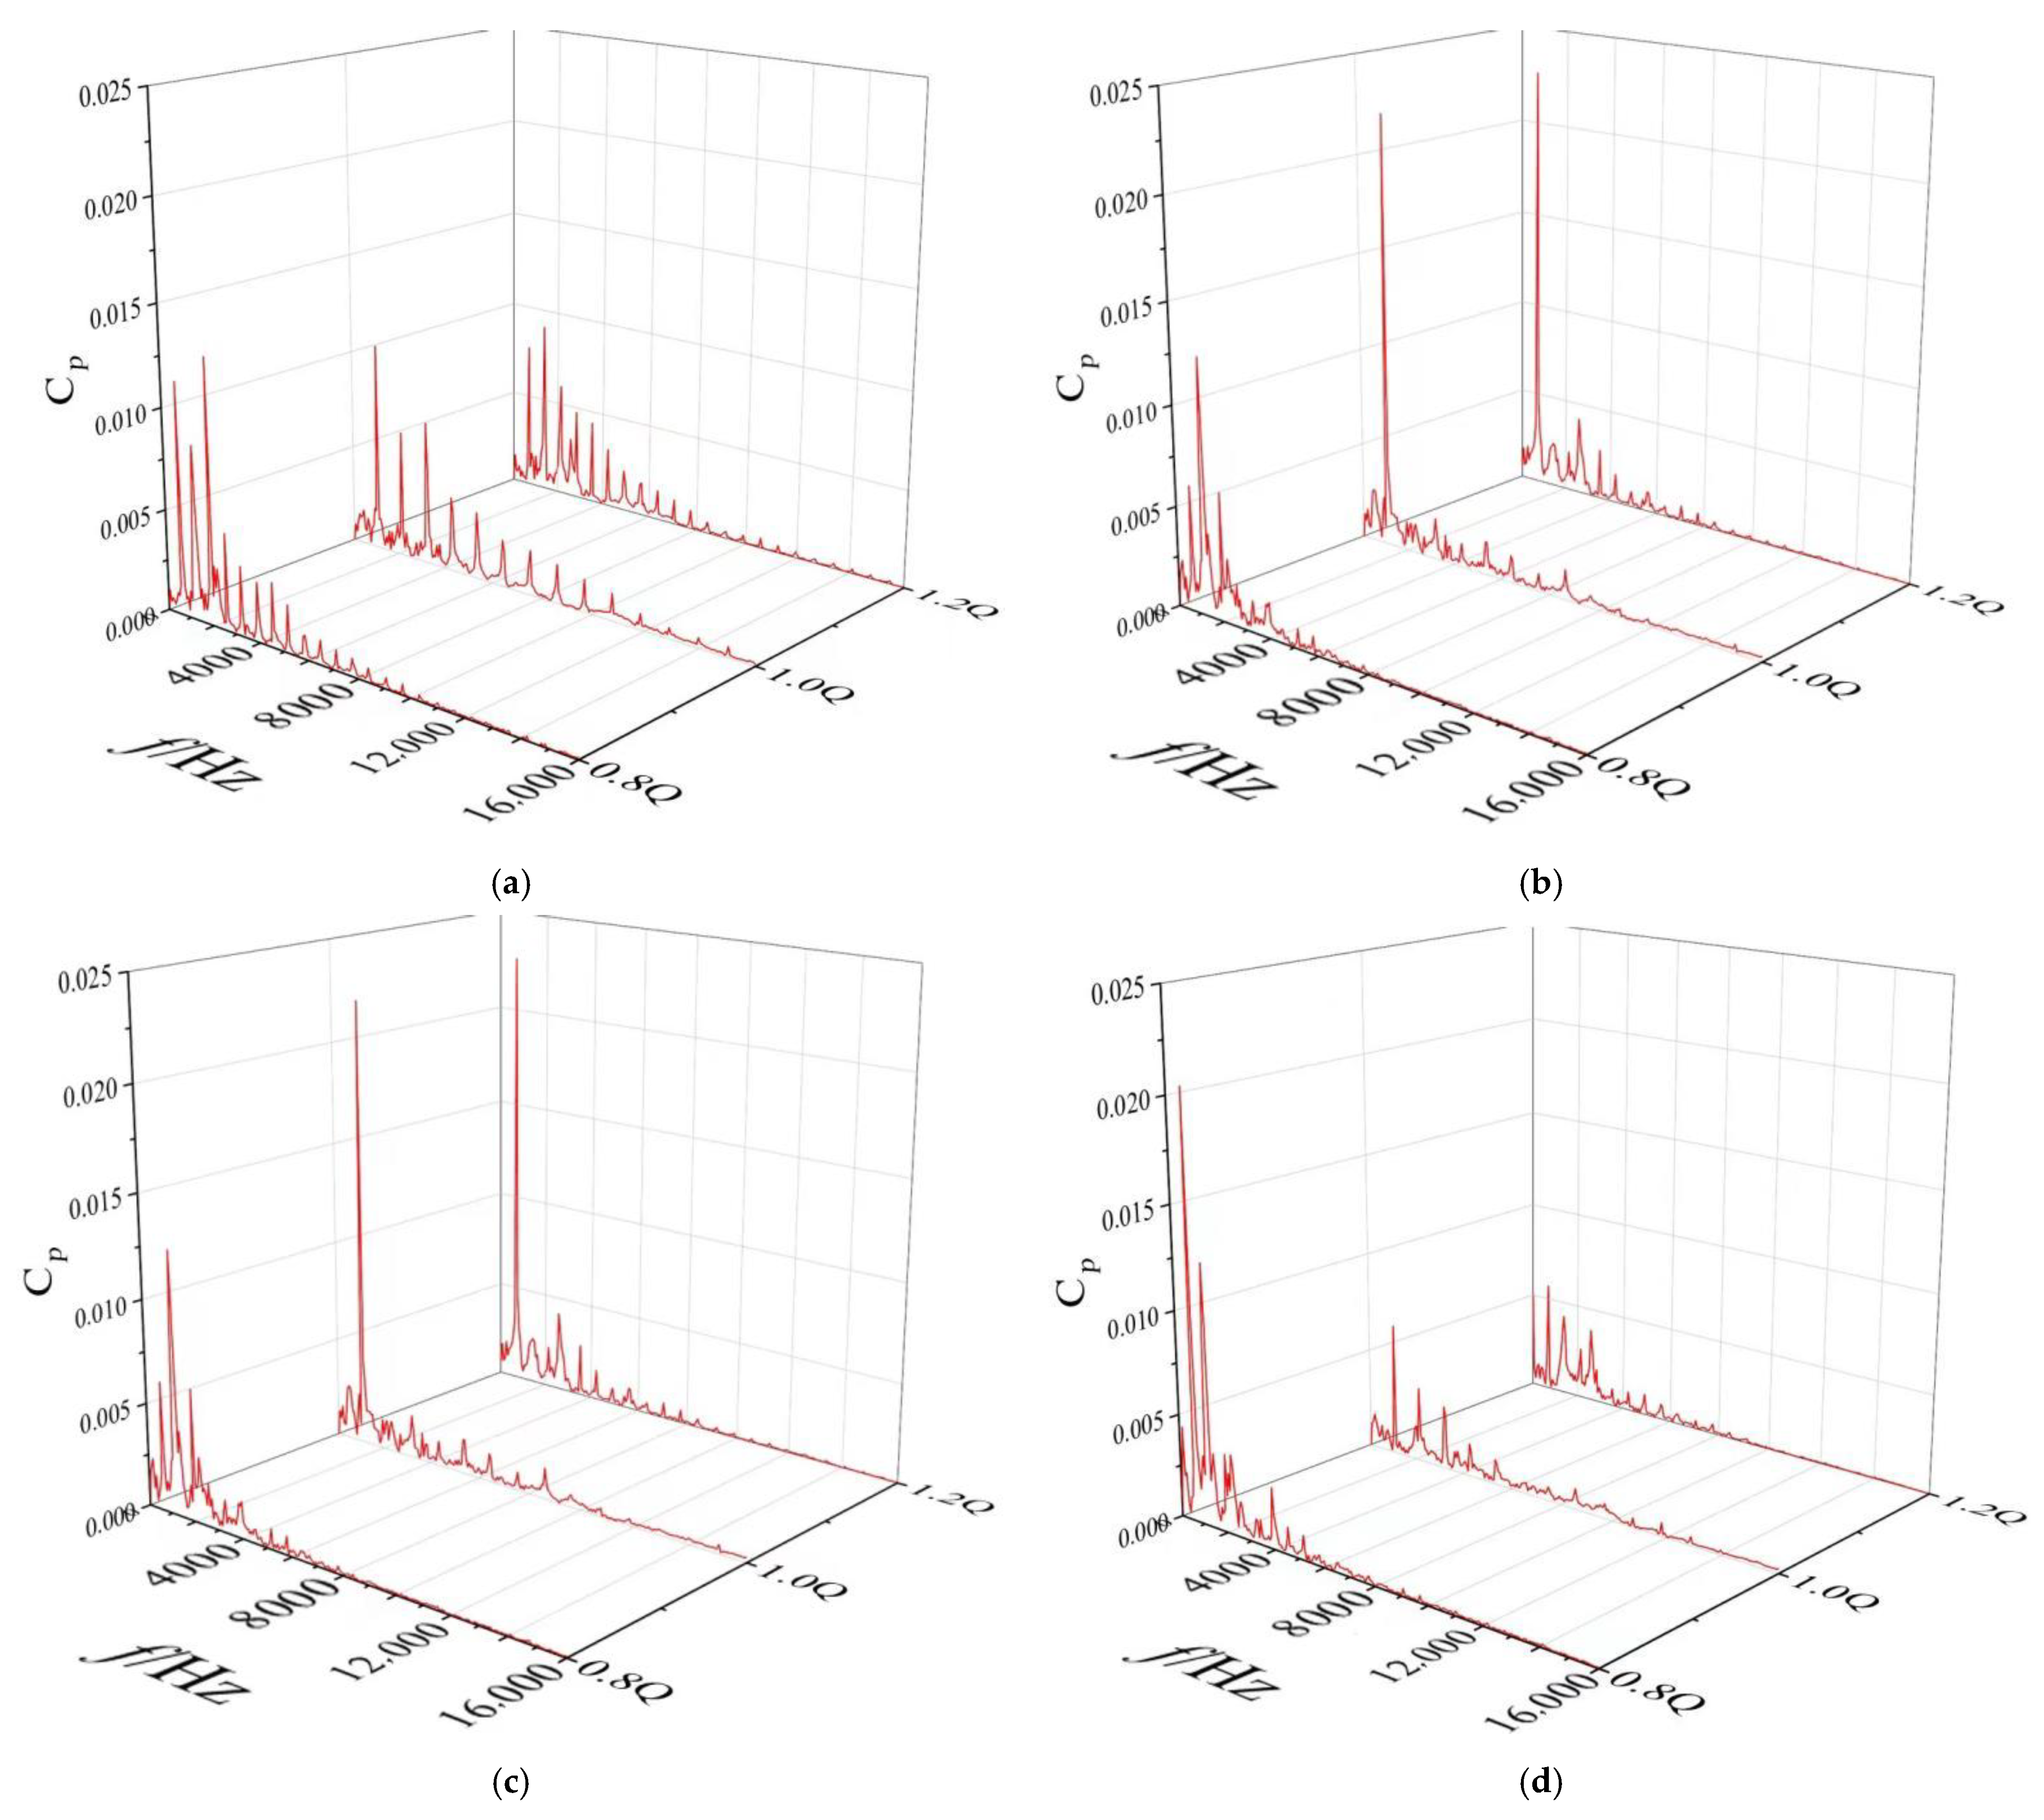
4.5. Pressure Fluctuation Analysis
5. Conclusions
- Influence of flow rate on the movement of fiber in the pump: under the condition of small flow rate, fiber was easily caught at the impeller inlet and blade head, which caused blockage; under large flow conditions, fibers were easily trapped at the impeller inlet and wound up at the volute tongue;
- The influence of fiber length on the movement characteristics of the pump: First, the long fiber more readily adhered to the suction surface of the blade. Second, it took longer to flow out from the pump, which made it more likely to cause fiber accumulation and blockage in the pump;
- Vortex in flow field could easily cause fiber clogging, and the main positions were at the impeller inlet, the blade head, and the middle of the blade suction surface. Concerning the position of the vortex, the vortex at the impeller inlet was the place where fiber was most easily blocked;
- From the analysis of vorticity intensity, it was seen that the vorticity intensity at the inlet of the impeller, the suction surface of the blade, and the volute tongue was large, which made the vorticity more likely to cause fiber blockage. However, with the increase of flow rate, the vorticity in some regions began to decrease.
Author Contributions
Funding
Institutional Review Board Statement
Informed Consent Statement
Data Availability Statement
Conflicts of Interest
References
- Zhang, L.; Wang, L.; Zhang, Y.; Wang, D.; Guo, J.; Zhang, M.; Li, Y. The performance of electrode ultrafiltration membrane bioreactor in treating cosmetics wastewater and its anti-fouling properties. Environ. Res. 2022, 206, 112629. [Google Scholar] [CrossRef] [PubMed]
- Tomassi, G.; Romano, P.; Di Giacomo, G. Modern Use of Water Produced by Purification of Municipal Wastewater: A Case Study. Energies 2021, 14, 7610. [Google Scholar] [CrossRef]
- Marouek, J.; Marouková, A. Economic Considerations on Nutrient Utilization in Wastewater Management. Energies 2021, 14, 3468. [Google Scholar] [CrossRef]
- Fang, X.; Wang, Q.; Wang, J.; Xiang, Y.; Wu, Y.; Zhang, Y. Employing extreme value theory to establish nutrient criteria in bay waters: A case study of Xiangshan Bay. J. Hydrol. 2021, 603, 127146. [Google Scholar] [CrossRef]
- Xu, J.; Lan, W.; Ren, C.; Zhou, X.; Wang, S.; Yuan, J. Modeling of coupled transfer of water, heat and solute in saline loess considering sodium sulfate crystallization. Cold Reg. Sci. Technol. 2021, 189, 103335. [Google Scholar] [CrossRef]
- Zhao, B.-T.; Ye, B.-B.; Tao, R.-H.; Cao, G.-W.; Wu, F. Design of new non-clogging self-priming sewage pump. Mech. Electr. Eng. Mag. 2012, 29, 806–809. [Google Scholar]
- Moloshnyi, O.; Szulc, P.; Molinski, G.; Sapozhnikov, S.; Antonenko, S. The analysis of the performance of a sewage pump in terms of the wear of hydraulic components. J. Phys. Conf. Ser. 2021, 1741, 012015. [Google Scholar] [CrossRef]
- Liu, J.H.; Zhu, M.Y. Simulation Study on Attrition to Centrifugal Sewerage Pump. Key Eng. Mater 2011, 1244, 474–476. [Google Scholar] [CrossRef]
- Cheng, C.; Shi, W.D.; Zhang, D.S.; Cao, W.D.; Xing, J. Numerical simulation of solid-liquid two-phase turbulent flow in swept-back sewage centrifugal pump. J. Drain. Irrig. Mach. Eng. 2015, 33, 116–122. [Google Scholar]
- Liu, J.; Shi, W.; Kong, F.; Pan, Z. Research on multifunctional non-clogging sewage pump. Trans. Chin. Soc. Agric. Eng. 2003, 19, 126–129. [Google Scholar]
- Zhu, R.; Cao, L.; Long, Y.; Zhu, D.; Fu, Q.; Wang, Z. Design and Experiment of High Specific Speed Centrifugal Submersible Sewage Pump. Trans. Chin. Soc. Agric. Mach. 2015, 46, 47–52. [Google Scholar]
- Xiao, J.-J.; Zhang, Y.-L.; Zhao, Y.-J. Design and Experiment of a Small Flowrate Solid-liquid Two-phase Flow Centrifugal Pump. Inf. Technol. J. 2013, 12, 7621–7625. [Google Scholar] [CrossRef]
- He, X.; Zhang, Y.; Wang, C.; Zhang, C.; Cheng, L.; Chen, K.; Hu, B. Influence of Critical Wall Roughness on the Performance of Double-Channel Sewage Pump. Energies 2020, 13, 464. [Google Scholar] [CrossRef]
- Sha, Y.; Liu, X. Performance test on solid-liquid two-phase flow hydrotransport of vortex pump. Trans. Chin. Soc. Agric. Eng. 2013, 29, 76–82. [Google Scholar]
- Tan, M.G.; Lian, Y.C.; Liu, H.L.; Wu, X.F.; Ding, R. Visualizing test on the pass-through and collision characteristics of coarse particles in a double blade pump. Int. J. Nav. Archit. Ocean Eng. 2018, 10, 1–8. [Google Scholar] [CrossRef]
- Wang, Y.; Chen, J.; Xie, L.; Liu, H.L.; Luo, K.K. Combined experimental and computational investigation of the effect of coating on operation characteristics of solid-liquid two-phase flow centrifugal pump. Mod. Phys. Lett. B 2021, 35, 2150062. [Google Scholar] [CrossRef]
- Kieckhefen, P.; Pietsch, S.; Dosta, M.; Heinrich, S. Possibilities and Limits of Computational Fluid Dynamics-Discrete Element Method Simulations in Process Engineering: A Review of Recent Advancements and Future Trends. In Annual Review of Chemical and Biomolecular Engineering; Doherty, M.F., Segalman, R.A., Eds.; Annual Reviews: Palo Alto, CA, USA, 2020; Volume 11, pp. 397–422. [Google Scholar]
- Jensen, A.L.; Rosendahl, L.; Sorensen, H.; Lykholt-Ustrup, F.; ASME. Towards simulation of clogging effects in wastewater pumps: A review of the state-of-the-art in cloth modelling and challenges in the simulation of clogging effects. In Proceedings of the ASME-JSME-KSME Joint Fluids Engineering Conference (AJK-FED), Seoul, Korea, 26–31 July 2015. [Google Scholar]
- Hu, Q.; Chen, J.; Deng, L.W.; Kang, Y.J.; Liu, S.J. CFD-DEM Simulation of Backflow Blockage of Deep-Sea Multistage Pump. J. Mar. Sci. Eng. 2021, 9, 987. [Google Scholar] [CrossRef]
- Li, Y.; Zeng, X.D.; Lv, W.S.; He, Z.H. Centrifugal pump wear for solid-liquid two-phase flows based on computational fluid dynamics-discrete element method coupling. Adv. Mech. Eng. 2020, 12, 17. [Google Scholar] [CrossRef]
- Deng, L.W.; Hu, Q.; Chen, J.; Kang, Y.J.; Liu, S.J. Particle Distribution and Motion in Six-Stage Centrifugal Pump by Means of Slurry Experiment and CFD-DEM Simulation. J. Mar. Sci. Eng. 2021, 9, 716. [Google Scholar] [CrossRef]
- Tang, C.; Yang, Y.C.; Liu, P.Z.; Kim, Y.J. Prediction of Abrasive and Impact Wear Due to Multi-Shaped Particles in a Centrifugal Pump via CFD-DEM Coupling Method. Energies 2021, 14, 2391. [Google Scholar] [CrossRef]
- Guo, Y.; Wassgren, C.; Hancock, B.; Ketterhagen, W.; Curtis, J. Validation and time step determination of discrete element modeling of flexible fibers. Powder Technol. 2013, 249, 386–395. [Google Scholar] [CrossRef]
- Sulaiman, M.; Climent, E.; Delmotte, B.; Fede, P.; Plouraboue, F.; Verhille, G. Numerical modelling of long flexible fibers in homogeneous isotropic turbulence. Eur. Phys. J. E 2019, 42, 132. [Google Scholar] [CrossRef] [PubMed]
- Imasaka, Y.; Kanno, H.; Saito, S.; Miyagawa, K.; Nohmi, M.; Isono, M.; Kawai, M. Asme in Clogging Mechanisms of Vortex Pumps: Fibrous Material Motion Capture and Simulation with a Cfd and Dem Coupling Method. In Proceedings of the ASME Fluids Engineering Division Summer Meeting (FEDSM2018), Montreal, QC, Canada, 15–20 July 2018. [Google Scholar]
- Cundall, P.A.; Strack, O. A discrete numerical model for granual assemblies. Geotechnique 1979, 29, 47–65. [Google Scholar] [CrossRef]
- Schöpf, H.-G. H. Leipholz, Theory of Elasticity. Noordhoff International Publishing 1974. IX, 400 S. Z. Angew. Math. Und Mech. 1975, 55, 618. [Google Scholar] [CrossRef]
- Di Renzo, A.; Di Maio, F.P. Comparison of contact-force models for the simulation of collisions in DEM-based granular flow codes. Chem. Eng. Sci. 2004, 59, 525–541. [Google Scholar] [CrossRef]
- Guo, Y.; Wassgren, C.; Curtis, J.S.; Xu, D.D. A bonded sphero-cylinder model for the discrete element simulation of elasto-plastic fibers. Chem. Eng. Sci. 2018, 175, 118–129. [Google Scholar] [CrossRef]
- Tang, C.; Kim, Y.-J. CFD-DEM Simulation for the Distribution and Motion Feature of Solid Particles in Single-Channel Pump. Energies 2020, 13, 4988. [Google Scholar] [CrossRef]
- Zhang, Q.; Yan, Z.; Zhang, W.; Kang, S. PIV measurement of internal flow field in open-impeller flow passages of centrifugal pulp pump. J. Drain. Irrig. Mach. Eng. 2020, 38, 1105–1112. [Google Scholar]


| Calculation Conditions | Selection |
|---|---|
| solution mode | unsteady |
| turbulence model | RANS k-ε |
| inlet boundary condition | mass flow 8.318 (kg/s) |
| outlet boundary condition | static pressure 0 (Pa) |
| time-step | 1.0 × 10⁻⁴ (s) |
| working fluid | water |
| Design Parameters | Symbol | Numerical Value | Unit |
|---|---|---|---|
| design flow | Q | 6.5 | m3/h |
| design head | H | 7 | m |
| rotational speed | n | 1680 | r/min |
| specific speed | nq | 43.5 | |
| impeller inlet diameter | D1 | 60 | mm |
| outside diameter of impeller | D2 | 158 | mm |
| blade outlet width | b2 | 16 | mm |
| Scheme | Number of Nodes | Head (m) | Changing Value (%) |
|---|---|---|---|
| 1 | 654,753 | 7.95 | 1.6 |
| 2 | 1,483,654 | 7.73 | 1.1 |
| 3 | 2,208,848 | 7.88 | 0.77 |
| 4 | 3,104,263 | 7.82 |
Publisher’s Note: MDPI stays neutral with regard to jurisdictional claims in published maps and institutional affiliations. |
© 2022 by the authors. Licensee MDPI, Basel, Switzerland. This article is an open access article distributed under the terms and conditions of the Creative Commons Attribution (CC BY) license (https://creativecommons.org/licenses/by/4.0/).
Share and Cite
Zheng, S.; Yang, C.; Yan, C.; Chai, M.; Sun, Z. Study on Fiber Clogging Mechanism in Sewage Pump Based on CFD–DEM Simulation. Energies 2022, 15, 1598. https://doi.org/10.3390/en15051598
Zheng S, Yang C, Yan C, Chai M, Sun Z. Study on Fiber Clogging Mechanism in Sewage Pump Based on CFD–DEM Simulation. Energies. 2022; 15(5):1598. https://doi.org/10.3390/en15051598
Chicago/Turabian StyleZheng, Shuihua, Chaojie Yang, Chaoshou Yan, Min Chai, and Zenan Sun. 2022. "Study on Fiber Clogging Mechanism in Sewage Pump Based on CFD–DEM Simulation" Energies 15, no. 5: 1598. https://doi.org/10.3390/en15051598
APA StyleZheng, S., Yang, C., Yan, C., Chai, M., & Sun, Z. (2022). Study on Fiber Clogging Mechanism in Sewage Pump Based on CFD–DEM Simulation. Energies, 15(5), 1598. https://doi.org/10.3390/en15051598