1. Introduction
Electrified transportation systems such as trams or trolleybuses are presently the preferred means of commuting within cities [
1]. Due to an increasing number of passengers and numerous ecologically-aimed investments, such transportation systems are being constantly developed. This development includes increasing the number of vehicles in operation. Commonly, new vehicles have greater rated power of the electric drive in order to improve their dynamics [
2]. Additionally, in the case of trolleybuses, the vehicles are recently often equipped with an on-board battery storage that enables them to run on routes, which in part do not have the catenary overhead. However, these batteries need to be charged while trolleybuses run under the catenary. Hence, the vehicle’s total demand for electrical power consists of both power required for generating propelling force and power needed for charging the battery. Another common change in the transportation systems related to their development is an increase in their route length. The routes are prolonged to expand the service area.
The increased number of vehicles in operation, their greater power demand, and the increased length of their routes translate into serious problems in terms of the electric power supply systems. Vehicles running along a part of the system that is remote from the supplying substation cause substantial current drops at catenary and feeders (supplying cables). Upon an excessive drop, the vehicle may need to shut off its drive as an emergency, which causes problems related to safety, comfort and reliability.
The scope of the voltage drop in catenary increases with the number of operating vehicles, with the power that they collect from catenary, and with the distance from the power substation. Hence, the above-mentioned occurrences become more likely in the transportation systems that have been developed. To avoid the supply problems, the development of the fleet and the expansion of the routes should be followed by constructing new traction substations in order to provide adequate quality of the electric power supply. However, constructing a new substation is related to high investment costs. Moreover, substations require a notable space to fit the electrical equipment inside, and this space is not always available in city centers. Substations shall also be located in close proximity both to the catenary to which they deliver power and to the medium voltage power line that supplies the substation. Hence, there are numerous constraints to finding suitable locations for new substations.
The problem of voltage drops is relevant to electrified transportation systems and various solutions alternative to constructing new substations have been proposed in the literature. Article [
3] focuses on the voltage drops problem in a railway 15 kV AC supply system. The authors propose to inject capacitive reactive power to the current controlled active line-side converter in order to stabilize the voltage on the locomotive pantograph. More papers, however, focus on DC-powered transportation systems, as they feature lower voltage levels which translates into greater voltage drops. The authors of [
4] introduced a mathematical model for evaluating voltage drops in 3 kV DC railway overhead lines. The model has been used to prove the effectiveness of applying supercapacitors for boosting the supply voltage in an exemplary traction system. According to the study, the supercapacitors would decrease the voltage drops by nearly 70%. The authors of [
5] also propose to use supercapacitor-based active stabilizer, but the aim is to decrease the range of voltage drops in 1.5 kV DC system. Article [
6] deals with a case of metro. The suppression of the voltage drops is obtained by using a wayside energy storage. The paper focuses on the impact of power flow control on the effectiveness of such a solution. Article [
7] includes a review of numerous solutions to traction power supply problems. Besides the solutions based on energy storages, the paper proposes the optimization of the overhead line sectioning and doubling the cross section of feeders by connecting two cables in parallel. In turn, reference [
8] includes analysis of the use of bilateral supply in a trolleybus system, which typically uses unilateral connections of traction substations. The bilateral supply improves voltage stability and the usage of regenerative braking energy. However, it poses problems related to overcurrent protection.
As reviewed above, a number of alternative solutions to the power supply problems rely on energy storages, which have become an integral part of numerous electrified transport systems [
9]. The storage devices can be divided into two groups: on-board energy storages that are placed in the vehicles, and off-board energy storages situated in traction substations [
10,
11] or in other places of supply systems [
12]. The most popular are on-board applications, especially in transportation systems using light electric vehicles (LEV) like trams, trolleybuses and electro buses [
13,
14,
15]. However, heavy electric vehicles (HEV) like suburban trains or metros use on-board storages as well [
16,
17,
18,
19].
Off-board storages are aimed at improving the supply conditions by collecting the regenerative braking energy and supporting the catenary voltage [
20]. Possible benefits associated with using a wayside storage, for example, for a light rail transit system, were discussed in [
21]. Off-board energy storages are constructed on the basis of electrochemical batteries, mainly of the lithium-ion type. Such storage systems are commonly used in railway solutions [
22,
23], but they can also be used in electrified urban transport systems [
24], which are featured by very rapid and large-scale changes of load. An off-board energy storage may play the role of a buffer station (BS) that prevents the catenary from excessive voltage drops. The BS requires less space than the traction substation and does not need to be supplied from the medium-voltage power line. The buffer station consists of an electrochemical energy storage and a converter by which the power flow between catenary and the storage can be controlled. The storage may be charged with low current, acting as a minor load for the substation. However, in the case of a large voltage drop caused by substantial power collected by vehicles, the accumulated energy can be instantly delivered from the storage to catenary. This way a part of the power demand is covered by the buffer station and the scope of the voltage drop is limited.
Traction storage systems can play the role of prosumers in Smart Grid supply systems [
25]. This is most often associated with electric cars connected to bidirectional charging stations [
26,
27]. However, off-board storages can also provide services for the supply system, for example, they can reduce the peak demand of traction substations [
28,
29] or increase the usage of renewable energy sources cooperating with the traction power system [
30].
This paper presents an analysis of a trial operation of battery-based buffer station supporting a selected section of trolleybus power supply system in Pilsen, Czech Republic. The buffer station aims at preventing the catenary from the excessive voltage drops in parts of the route that are most remote from the traction substation. Compensation of voltage drops is carried out by measuring the catenary voltage and injecting the current into the catenary if the voltage decreases below a preset value. The effectiveness of such a solution was evaluated by analysis of numerous experimental recordings, both from the buffer station itself and from trolleybuses in operation. Further on, based on the recordings, a utilized battery capacity was estimated and a control method for decreasing the required capacity was proposed. The optimal capacity analysis, supplemented with an evaluation of required output current rating, was used to define the best storage technology for the considered application.
2. Trial Operation of Buffer Station
The trial operation of the buffer station was carried out in the framework of EfficienCE [
31], which is a cooperation project funded by the Interreg CENTRAL EUROPE program that aims at reducing the carbon footprint in the region. Twelve partners, including seven public transport authorities/companies from seven countries are working together for three years to exploit the untapped potentials in this sector and to contribute to the EU ‘White Paper’ goals to cut transport emissions by 60 percent by 2050 and to halve the use of ‘conventionally fueled’ cars in urban transport by 2030. The following cities are invlolved in the EffcienCE project: Vienna, Maribor, Leipzig, Budapest, Bergamo, Gdynia, Pilsen.
The buffer station was tested in Pilsen, Czech Republic. Pilsen, with 170,000 inhabitants, has three public transportation systems including three tram lines, nine trolleybus lines and 24 daytime bus lines. The Pilsen transportation systems are operated by Pilsen City Public Transport Company PMDP (Plzeňské městské dopravní podniky a.s., PMDP). PMDP’s role in the EfficienCE project was to implement the buffer station in Pilsen in order to verify its efficiency in compensating voltage drops and to validate the possibility to expand the use of battery-assisted trolleybuses.
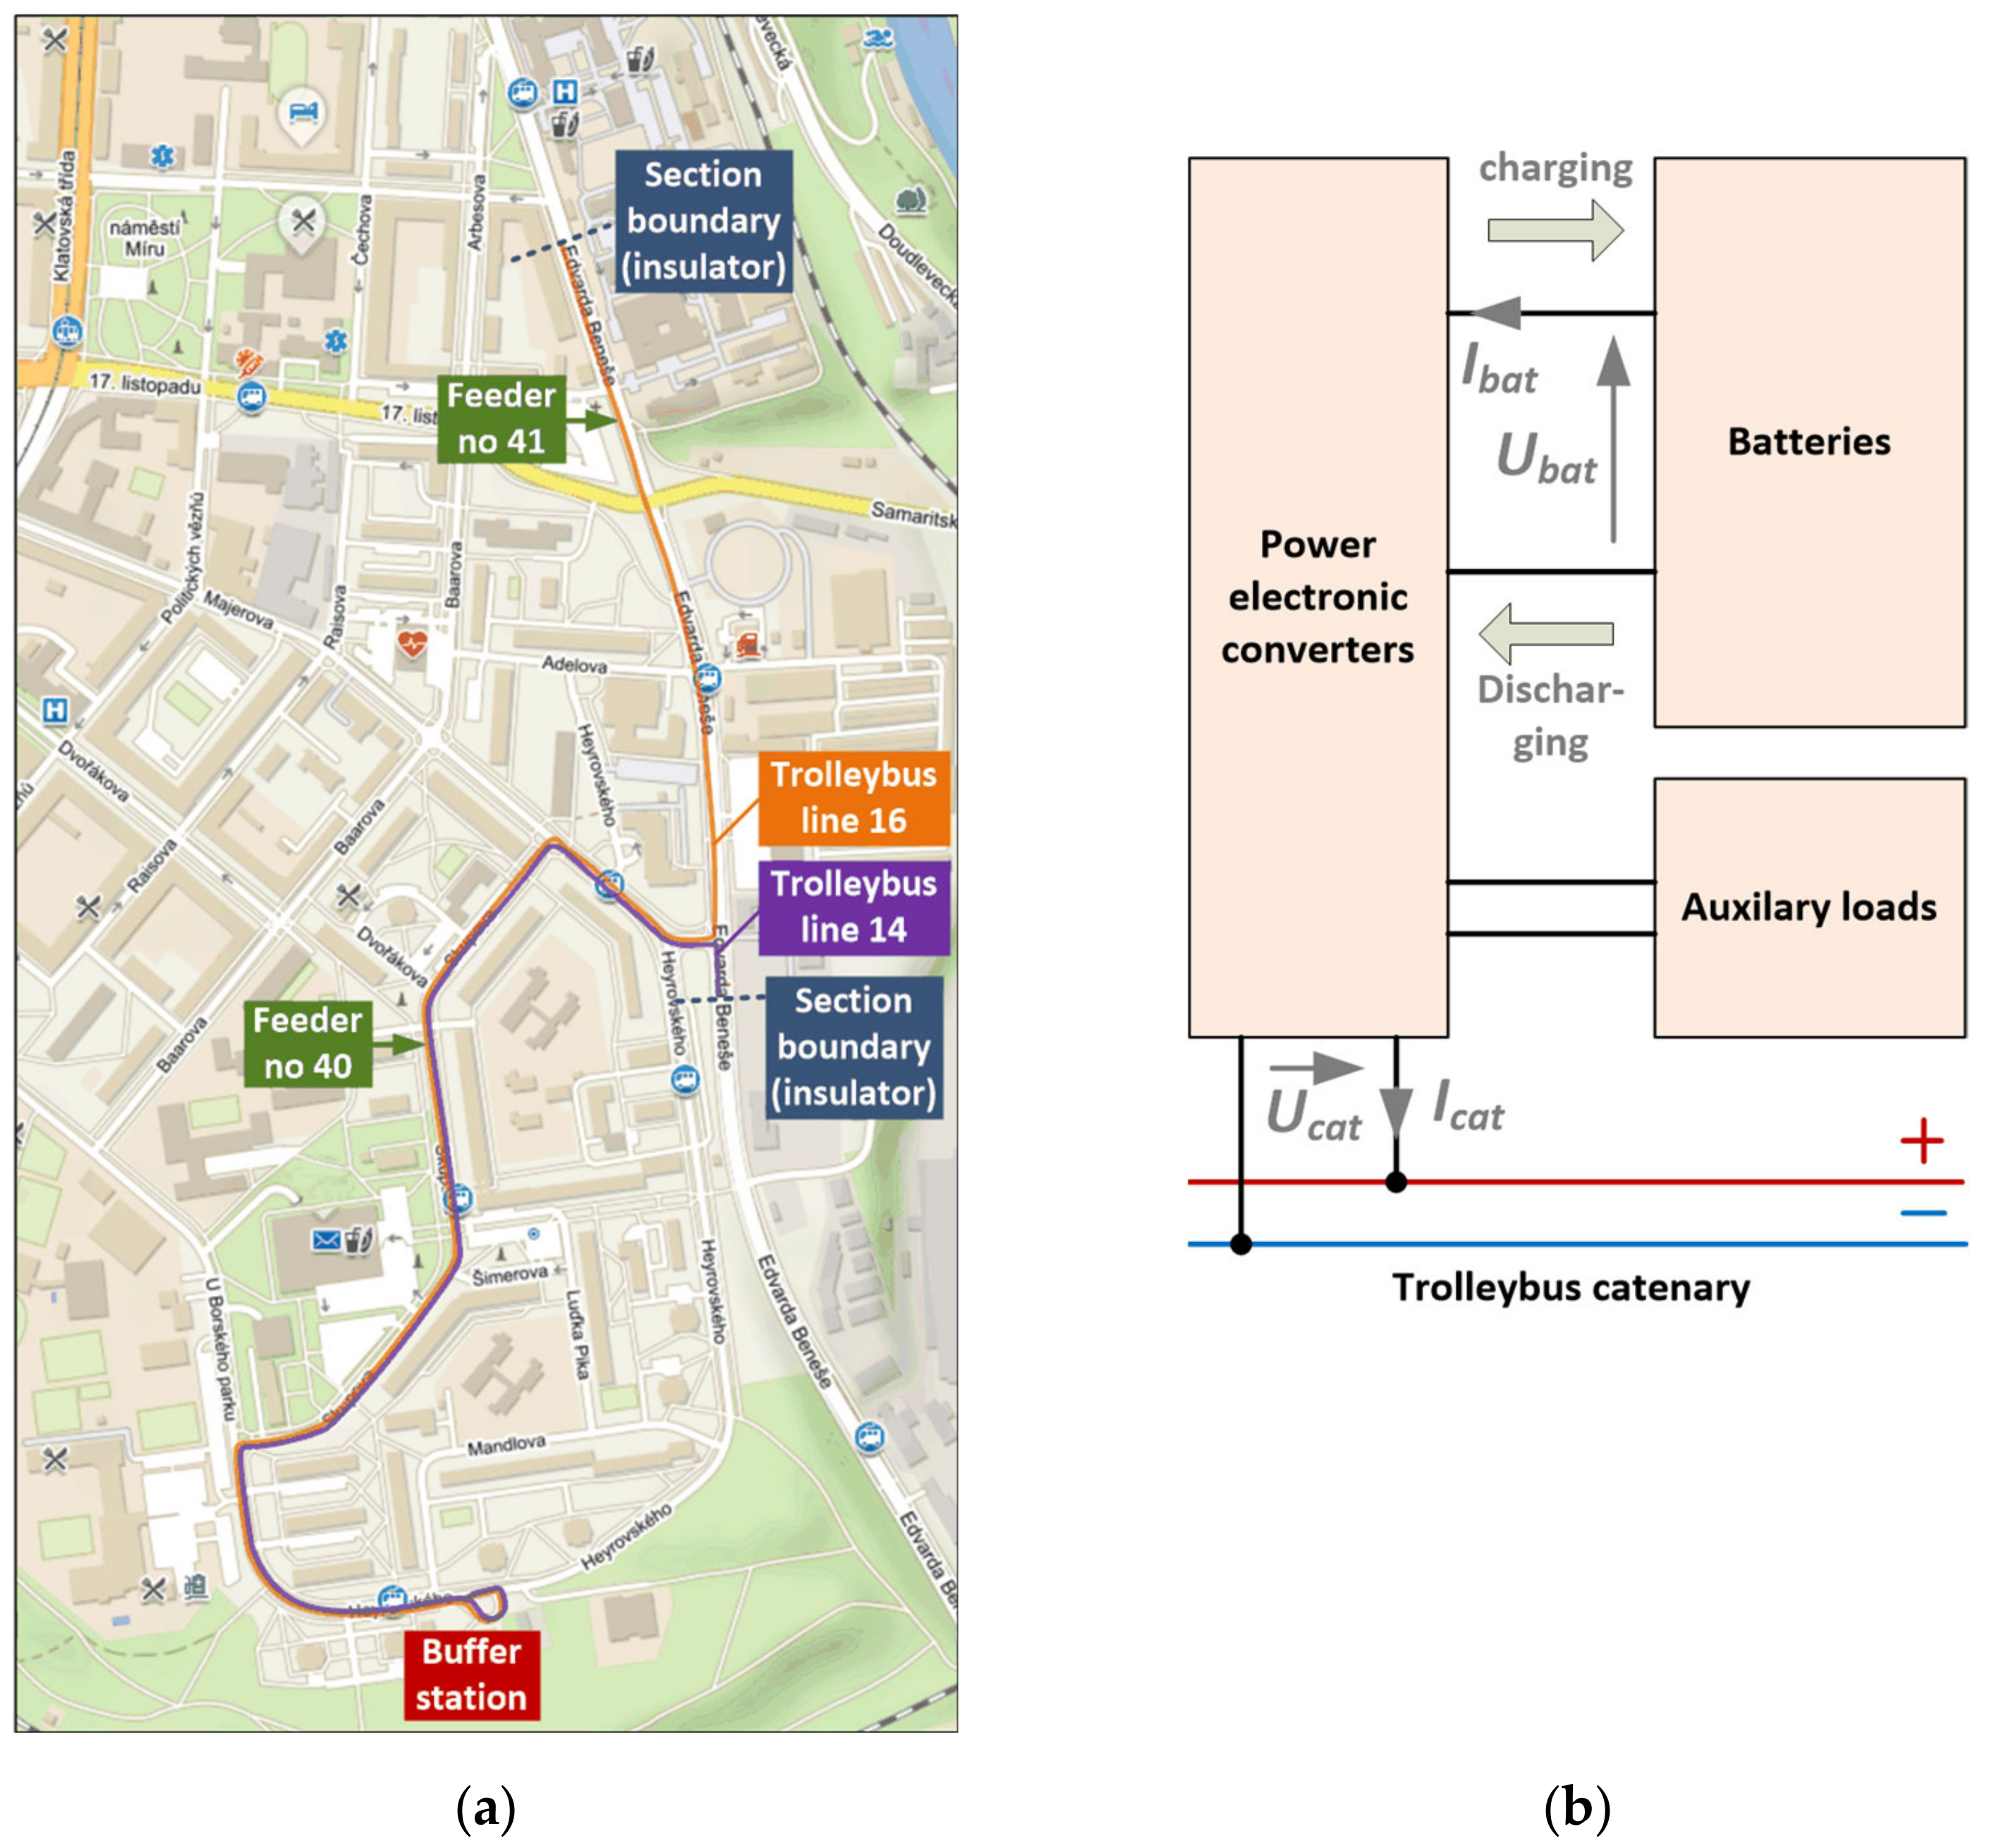
The buffer station was planted next to end stop “Sídliště Bory” of trolleybus lines numbers 14 and 16 (see
Figure 1a). The trolleybus power section, to which the buffer station was connected, covers 1.8 km of line 16 and 1.2 km of line 14. During normal operation, the power section is supplied from substation MR7-Bory with two sets of feeders connected to different points of catenary. The feeders’ numbers are 40 and 41. Optionally, feeder no. 41 may be supplied from more remote substation MR1-Hydro through an auxiliary bus.
The buffer station is fitted in a shipping container. It consists of a set of lead-acid batteries, whose nominal voltage is 480 V. Maximal output current has been rated at 1000 A (during 5 s). The nominal capacity of the batteries is 96 kWh. However, during regular operation the used capacity is limited to 32 kWh in order to extend their lifetime. For the same reason, the charging current is limited to 20 A.
Figure 1b shows the functional diagram of the buffer station. The buffer station is equipped with power electronic converter that allows for controlling the power flow between batteries and catenary. The converter also provides supply for auxiliary loads such as control equipment and air conditioning. The only power source for the buffer station is the trolleybus power section, so the energy for charging the batteries as well as the energy for supplying the auxiliary loads come solely from the trolleybus catenary. Protection equipment (circuit breakers etc.) and remote supervision equipment were not included in
Figure 1b.
The BS, if active, compensates voltage drops in the trolleybus catenary in the following manner. The instantaneous voltage at BS output (catenary voltage) is measured by BS control system. If this voltage drops below a preset buffering value Ubuff, the control system drives the power converter to inject current to the catenary. The greater the drop of the catenary voltage below the buffering value is, the higher the current injected into the catenary. If the catenary voltage is higher than the preset buffering voltage, the BS is idle. During this time, it collects current from the catenary in order to supply its auxiliary loads. The idling time may be also used for charging the batteries. The charging process is initiated by the control system when the batteries state of charge reaches predefined state.
The trial operation of the buffer station was carried out for 6 weeks:
week 1: normal supply, battery-assisted trolleybuses in operation, BS inactive;
week 2: normal supply, battery-assisted trolleybuses in operation, BS active;
week 3: disconnected feeder 40, standard trolleybuses in operation, BS inactive;
week 4: disconnected feeder 40, standard trolleybuses in operation, BS active;
week 5: disconnected feeder 40, feeder 41 supplied from more remote substation MR1- Hydro, standard trolleybuses in operation, BS inactive;
week 6: disconnected feeder 40, feeder 41 supplied from more remote substation MR1-Hydro, standard trolleybuses in operation, BS active.
The above-listed weeks can be set into pairs representing the same operating conditions of power supply and vehicles, but different states of the buffer station (active or inactive). These sets allow for analyzing the impact that BS provides to the functioning of power supply. In different weekdays, the buffered voltage level was set differently (when BS was active) to show the efficiency of BS in different conditions.
In order to depict the origin of changes in voltages at trolleybuses pantographs, equivalent circuits of the supply system are presented in
Figure 2.
The values of circuit parameters are listed in
Table 1. The substation is modelled as a voltage source and a series resistance. The latter reflects voltage drops due to power conversion in the substation itself as well as drops in AC power system that supplies the substation. The parameters of substation model were obtained by linear approximation of output voltage in function of output current, which was derived from long-term recordings. The feeders are represented by resistances computed based on their length, cross section and conductor material. The catenary is modelled in similar manner, but the resistances have sliding terminals (like potentiometers) whose setting is related to location of the supplied trolleybus. The trolleybuses are modelled as variable current sources, as well as the buffer station. The number of vehicles and their locations are illustrative, as they change during operation. Based on the equivalent circuits, the range of the voltage drops may be approximated. For example, assuming a single trolleybus located near the BS and drawing current
Iveh4 = 300 A from the catenary [
2], the voltage drop on the modelled resistances is: 166 V for the case shown in
Figure 2a, 264 V for
Figure 2b, and 316 V for
Figure 2c. As typically several vehicles run along the considered supply section, the voltage drops cumulate by the rule of superposition. Hence, the real voltage drops may be much higher than those given above.
During the trial operation, a number of recordings were carried out. In the buffer station, the recordings cover waveforms of: batteries current Ibat and voltage Ubat, and output current Icat and voltage Ucat. The onboard controllers of the vehicles record a large number of parameters. The most important for this study are: speed, location and covered distance, current and voltage at current collector.
The basics of BS operation are depicted in
Figure 3, based on recordings of BS output current
Icat and voltage
Ucat, throughout a selected workday. The recordings are affected by the measurement noise, but the following relations can be noticed. If the output voltage is greater than the preset buffering voltage
Ubuff, the current
Icat has a relatively small negative value related to charging batteries and supplying auxiliary loads. If the output voltage drops below
Ubuff, the BS injects current (positive
Icat) to the trolleybus catenary. According to the linear approximation shown in the chart, the ratio between the value of injected current and the voltage drop below
Ubuff is at a level of 50 A/1 V. Such a limited ratio causes that the voltage may further drop below the set
Ubuff. However, such a smooth increase in injected current is necessary to ensure stability of the supply system.
3. Effectiveness of Voltage Drops Compensation
Fundamental evaluation of the effectiveness of buffer station operation was carried out by processing recorded waveforms of BS output voltage
Ucat. These waveforms were post processed to obtain daily histograms of
Ucat. Exemplary results for week 3 are presented in
Figure 4.
The daily histograms for weeks 1, 3 and 5 (inactive BS) were averaged, individually for each week, in order to obtain reference histograms corresponding to particular operating conditions and inactive buffer station. The exemplary results of averaging histograms for week 3 are shown in
Figure 4b. Such a reference allows for analysis of the effectiveness of voltage drops compensation by comparing voltage histograms for days when BS was active with the reference histogram that corresponds the same supply conditions, but lack of BS’s influence. As active BS impacts the histograms only when its output voltages are lower than
Ubuff, and this parameter was set between 500 and 600 V during the tests, the comparison of histograms was limited to voltages lower than 630 V, as marked in
Figure 4b. The results of the comparisons are shown graphically in
Figure 5. The
Ubuff setting for each day is marked in the corresponding graphs. According to the principle of BS control, discussed in
Section 2, the
Ubuff setting corresponds to the voltage that triggers the current injection, not the lowest expected catenary voltage. Therefore, the long bars in
Figure 5 that represent voltages slightly below the
Ubuff setting do not indicate any improper operation. Generally, in the case of active BS and operating conditions that would cause excessive voltage drops, the voltage values cumulate in a range between
Ubuff—10 V and
Ubuff. The content of lower bars in the graphs is insignificant, with an exception related to Friday, week 6. However, during this day additional tests were performed aiming at verifying a protection against deep discharging of batteries, implemented into the control algorithm. For this reason, the process of batteries charging was disturbed in the control system. Hence, during a part of this day, the BS was not able to inject sufficient current to the catenary since its control priority was changed to maintaining a minimal level of batteries charge.
In order to summarize the results, a set of numeric indicators was proposed that enables quantification of the difference between active and inactive BS:
Additionally, an improvement factor
kt was computed by dividing
tdrop obtained for BS active by the
tdrop derived for reference. The summary based on these indicators is shown in
Table 2.
Except from Friday, week 6, which corresponds to deep-discharging protection tests, the summary shows good performance of the BS. This is most notable when considering the improvement factor kt, whose value is between 24 and 130 for particular days of the test. The level of the lowest instantaneous voltage is also lifted by a few tens of volts upon active BS.
According to the principle of BS operation, discussed in
Section 2, the BS controls the injected current based on the catenary voltage level measured at BS location. The voltages at trolleybus pantographs may be lower than at the BS location due to the voltage drops on catenary. Still, the operation of BS should notably lift the lowest pantograph voltage level for vehicles running in some proximity to the BS. In order to verify this thesis, a set of recordings from trolleybuses on-board devices was collected on Thursdays, weeks 5 and 6 (BS inactive and BS active, respectively). The recordings covered 10 trolleybus rides in the morning rush (between 6:00 and 9:00 a.m.) for both of these days. From the excessive set of recorded variables, pantograph voltage and covered distance were extracted and post processed in order to depict the changes in pantograph voltage as a function of distance from the BS. The results are shown in
Figure 6a,b, for runs towards north and south, respectively. The gray dots indicate the instances corresponding to 10 trolleybus rides recorded for Thursday, week 5 (BS inactive) and the orange dots correspond to 10 trolleybus rides recorded for Thursday, week 6 (BS active). Locations of the BS, the only feeder in service, and stops are marked in the figures. The results shown in
Figure 6 show evident difference in the lower instantaneous voltages between active and inactive BS for wide operational distance. As presumed, the voltages are most notably lifted by the BS in its close proximity (less than 1000 m). However, some impact of active BS may be observed even at the end of supply section, near the connection point of the only active feeder. For active BS the collector voltage drops to approx. 460 V, which is 60 V below the set
Ubuff voltage. This should be taken into consideration when selecting a the
Ubuff value for target operating conditions.
4. Evaluation of Required Buffer Station Parameters
In the existing buffer station system, the battery is charged several times a day with large doses of energy (
Figure 7, blue line). It is possible to consider another method of charging: more often charging, but with small amounts of energy. Charging can take place according to the voltage criterion, that is, the battery will be charged if the voltage in the overhead contact line will have a sufficiently high level. An exemplary effect of such a change in the battery control is presented in
Figure 7 (green line). Higher charging frequency reduces the degree of discharge of the battery. Thanks to this, it would be possible to reduce the required capacity of the BS battery.
For this analysis, the recorded waveforms of the BS output current
Icat were used.
Figure 8 shows the diagram of the proposed calculation algorithm for determining the required BS capacity in regard to the desired charging current
Ich. Operation of BS with the modified charging algorithm was simulated, based on the measured time waveforms of the current loading of the battery. It is based on the registration of the load of BS (
Ucat, Icat) and the determination of the energy stored in the battery station.
Figure 9 shows the relationship between the required BS capacity and
Ichar current. The calculations were made for three levels of catenary voltage above which charging is activated: 550 V, 600 V and 650 V. By reducing the voltage level for charging activation and increasing the charging current, the capacity of the BS battery can be reduced. However, increase of the charging current increases the load of the overhead contact line, which may not be recommended in the case of a weak overhead contact line (i.e., high resistance of supply network). This phenomenon is presented in
Figure 10, where the level of the minimum voltage in the overhead contact line during charging of BS stations is presented. Increasing the battery charging current causes an increase in the traction network load, and thus an additional voltage drop. If we want to use the full power of the battery converter, the charging current can be 200 A. Assuming that the overhead line voltage should not drop below 550 V during charging, the maximum charging current can only be used at a trigger voltage of 650 V. In the case of a trigger voltage of 600 V the charging current of the battery should be limited to 100 A. Nevertheless, it should be noted that in both cases the same capacity of the battery will be required, of 0.8 kWh.
Figure 11 shows the average values of the BS output current and
Figure 12 shows the histogram of instantaneous values. It should be noted that the BS load is short-term, that is, the instantaneous load values can reach 200 kW, but on an hourly scale it does not exceed 10 kW.
The capacity of the battery used is 96 kWh, but it can be significantly reduced. When optimizing the control process (
Figure 7 and
Figure 8), from the energy point of view, a capacity of 2 kWh will be sufficient. However, the determining factor is the maximum power drawn from the battery, which is 200 kW. If LTO is used, which can be loaded with 10C current, the required capacity will be 20 kWh. When using LFP high power cells, which can be loaded with 5C current, the required capacity would be 50 kWh. It should be noted that in each case the battery discharge level will be small, so it will not cause an additional reduction of the battery capacity.
5. Conclusions
The buffer station effectively reduces occurrences of excessive voltage drops, which leads to the improvement of the quality of power supply to the trolleybus network. The buffer station can be used as an alternative to constructing new traction substations. In particular, it is predestined to strengthen the supply of long power sections with relatively little traffic, where problems with providing power occur but the construction of a new substation is not economically justified.
The construction of the buffer station allows for the use of various types of electrochemical cells. Currently, lead-acid cells are used. However, the use of lithium-ion technology (e.g., LFP or LTO) would allow us to reduce the dimensions and weight of the BS, which may be important in the case of a lack of space upon which to build a station. Used batteries (“second-life”) from electric vehicles (e.g., trolleybuses with auxiliary drive, electric buses or electric cars), which after several years of operation have a reduced capacity and are not suitable for use in a vehicle, but can still be used in stationary applications, can also be used in the buffer station [
32].
The buffer station can also be used as an emergency power source in the event of a power failure of the traction substation supply from the MV/HV energy grid. From this point of view, it is inadvisable to reduce the battery capacity.


