Abstract
This paper aims to demonstrate the viability of energy harvesting for wide area wireless sensing systems based on dye-sensitized solar cells (DSSCs) under diffuse sunlight conditions, proving the feasibility of deploying autonomous sensor nodes even under unfavorable outdoor scenarios, such as during cloudy days, in the proximity of tall buildings, among the trees in a forest and during winter days in general. A flexible thin-film module and a glass thin-film module, both featuring an area smaller than an A4 sheet of paper, were initially characterized in diffuse solar light. Afterward, the protype sensor nodes were tested in a laboratory in two different working conditions, emulating outdoor sunlight in unfavorable lighting and weather to reconstruct a worst-case scenario. A Li-Po battery was employed as a power reserve for a long-range wide area network (LoRaWAN)-based sensor node that transmitted data every 8 h and every hour. To this end, an RFM95x LoRa module was used, while the node energy management was attained by exploiting a nano-power boost charger buck converter integrated circuit conceived for the nano-power harvesting from the light source and the managing of the battery charge and protection. A positive charge balance was demonstrated by monitoring the battery trend along two series of 6 and 9 days, thus allowing us to affirm that the system’s permanent energy self-sufficiency was guaranteed even in the worst-case lighting and weather scenario.
1. Introduction
Dye-sensitized solar cells (DSSCs) are among the most promising new generation thin-film photovoltaic devices [1]. Due to their nanocrystalline nature and the fact that transport processes in these cells are mainly due to diffusion, DSSCs’ potential may be exploited, especially at a low intensity, such as in the case of outdoor diffuse solar radiation [2] and indoor visible artificial light [3]. In particular, they may represent alternative, low-cost energy harvesting solutions specially designed to achieve the best performance under diffuse light with low intensities for the powering of wireless sensors nodes (WSNs) within the context of the Internet of Things (IoT). Indeed, in this domain, wireless sensing devices are expected to be positioned in large numbers and in places where continuous energy sources or a connection to the power grid may not be available. Nonetheless, practical studies on their possible application up to now have been scarce due to the unavailability of commercial DSSC devices. Recently, both glass and flexible DSSC modules have faced the market. In this work, two commercial DSSC glass and flexible modules are employed as energy harvesters for WSNs under a low irradiation intensity due to diffuse solar radiation. This study is functional to the development of sensing nodes deployed in many realistic applications outdoors, such as in the proximity of tall buildings or below trees in forests. This context is of particular interest when also considering flexible thin-film photovoltaic modules, which can easily adapt to different scenarios and 3D geometries.
To this aim, the two commercial DSSC modules are first characterized in a laboratory to analyze their efficiency in terms of current–voltage (I-V) characteristics when exposed to diffuse solar light in order to identify their actual power transfer in real operating conditions. Then, the two modules are used as power sources for a typical WSN employed in IoT infrastructures. In particular, the sensor node prototype used for the tests is based on long-range (LoRa) transmission technology and implements the LoRa wide area network (LoRaWAN) protocol, which has become a sort of de facto standard among the non-licensed wide area data transmission technologies in the IoT domain in the last few years. This technology operates in unlicensed sub-GHz (i.e., below a 1-GHz frequency) bands and is characterized by extremely long transmission ranges (up to some tens of kilometers) and low power consumption. Therefore, it is suitable for all those applications where there is a lack of power availability. In order to test the performance of the DSSC cells as power sources, a general-purpose node is implemented, integrating a microcontroller unit (MCU), a temperature sensor and the transmission module, assuming that the most energy-hungry component of the node is the transmission module itself. The achieved results can be exploited in a large number of applications, since the addition of application-specific sensors is not considered a critical factor affecting the actual power consumption. In particular, the final purpose of this paper is to demonstrate the viability of energy self-sufficient WSNs powered by means of DSSCs, identifying an ideal trade-off between the amount of energy provided by the cells in diffuse light conditions and the actual transmission frequency of the sensor node, which allows for maintaining a positive trend in the battery voltage level. Such a result can be interpreted as an indication of the self-sustainability of the node. While a large number of papers focusing on the characterization of DSSCs is already present in the literature, to our knowledge, no work can be found that analyzes in detail the actual link between the charge capabilities of the DSSCs and the operation of the sensor node experimentally. Such a result may allow for an efficient dimensioning of the harvesting sub-system with respect to the sensor node behavior, regardless of the specific application scenario.
This paper is structured as follows. Section 2 reviews the state of the art for DSSCs’ usage in diffuse light conditions and their integration with IoT nodes, while Section 3 presents the used materials and methods. In Section 4, the working conditions of interest and the suitability of the DSSC modules in the application scenario are analyzed and discussed. In Section 5, we illustrate in detail the proposed sensor node architecture. In Section 6, the experimental results of the laboratory tests performed on the node are reported, while Section 7 discusses the outcomes of the tests. Finally, the conclusions close the article.
2. State of the Art
Energy efficiency is a crucial task for most distributed wireless data acquisition systems. Indeed, only a limited number of applications are designed to be deployed in sites where a connection to the grid is available. Moreover, connecting to the grid often requires the deployment of cables and can thus be expensive and difficult. As a consequence, most IoT systems are expected to be energy self-sufficient. This objective can be accomplished using batteries, but their replacement may still be complex if the WSNs are positioned in remote sites or are deployed in large quantities. Such an aspect is even more critical for low-power wide area network (LPWAN) technologies, since their long transmission range is particularly suitable for the realization of large-scale distributed data acquisition systems. For this reason, energy harvesting has become a valid alternative to ensure the sensor nodes’ permanent energy self-sufficiency.
Several harvesting techniques have been used as power sources over the years for wireless sensor nodes [4]. These include, among others, thermoelectricity [5], vibrations [6], radiofrequency [7], hydroelectricity [8] or microbial fuel cells [9]. However, the energy source that has seen the largest exploitation is for sure the solar one. The use of small-scale photovoltaic (PV) cells is quite common in energy self-sufficient wireless sensor nodes deployed in sites with a direct sunlight exposure [10,11]. Several materials are employed for the manufacturing of the cells, and the most common ones include monocrystalline, polycrystalline and amorphous silicon. While most applications are based on nodes exposed to direct sunlight, the chance to use solar cells to provide energy to devices deployed indoors and thus exposed to artificial light or natural diffuse light has also been discussed in the literature [12,13,14,15,16]. Conversely, very few works can be found in the literature focusing on light energy harvesting for wireless nodes deployed outdoors but not directly exposed to sunlight and thus being subjected only to diffuse light. While this application scenario may appear less significant with respect to the indoor one, several monitoring platforms may be deployed outdoors in places where no direct sunlight is available. Some examples of applications include fire monitoring in forests or structural health monitoring of bridges.
In all the application contexts where no direct sunlight is available, good candidates for solar energy harvesting appear to be DSSCs. Indeed, some works have already proven their efficiency in these operating conditions [17,18,19]. For this reason, DSSCs may represent the best option as power sources for energy self-sufficient wireless data acquisition platforms. An interesting comparison of the performance of different typologies of cells for this purpose can be found in [20], while a perspective discussion on the adoption of this harvesting technique within the IoT domain is presented in [21]. Some examples of DSSC-powered wireless sensing devices can already be found in the literature. A simple wireless sensor node powered by means of DSSCs is presented in [22]. This device is based on the IEEE 802.15.4 protocol and is specifically designed for smart home applications. However, few details on the used DSSCs are presented, and no actual characterization is performed. A DSSC is also employed as a power source for a wireless sensing platform in [23]. Nevertheless, this contribution is mainly focused on the sensing rather than on the system in its entirety, and no actual results concerning the energy harvesting are presented. Yang et al. [24] presented a batteryless, DSSC-powered wireless Bluetooth device. The paper focuses on the description of the energy harvesting sub-system, but the overall node architecture is only simulated, and no actual measurement is performed with a fully operating system. The only contribution found in the literature presenting a fully operating node together with a measurement of its capacity of self-sustainment is presented in [25]. The architecture of this node is based on an ATMega328P microcontroller and features a 2.4-GHz transmission module. No optimization is carried out in terms of power consumption, since both of these components present current absorption values which are not acceptable for the design of low-power devices. To our knowledge, our contribution is the first one to address in detail the usage of DSSCs for the powering of LPWAN-based devices under diffuse light conditions for long-range remote data acquisition purposes, focusing on the relation between a DSSC’s charging capability and a WSN’s data transmission frequency. The results presented in this paper can be useful for all those applications where a large quantity of energy self-sufficient wireless data acquisition devices are expected to be deployed in large areas in conditions of indirect sunlight.
3. Materials and Methods
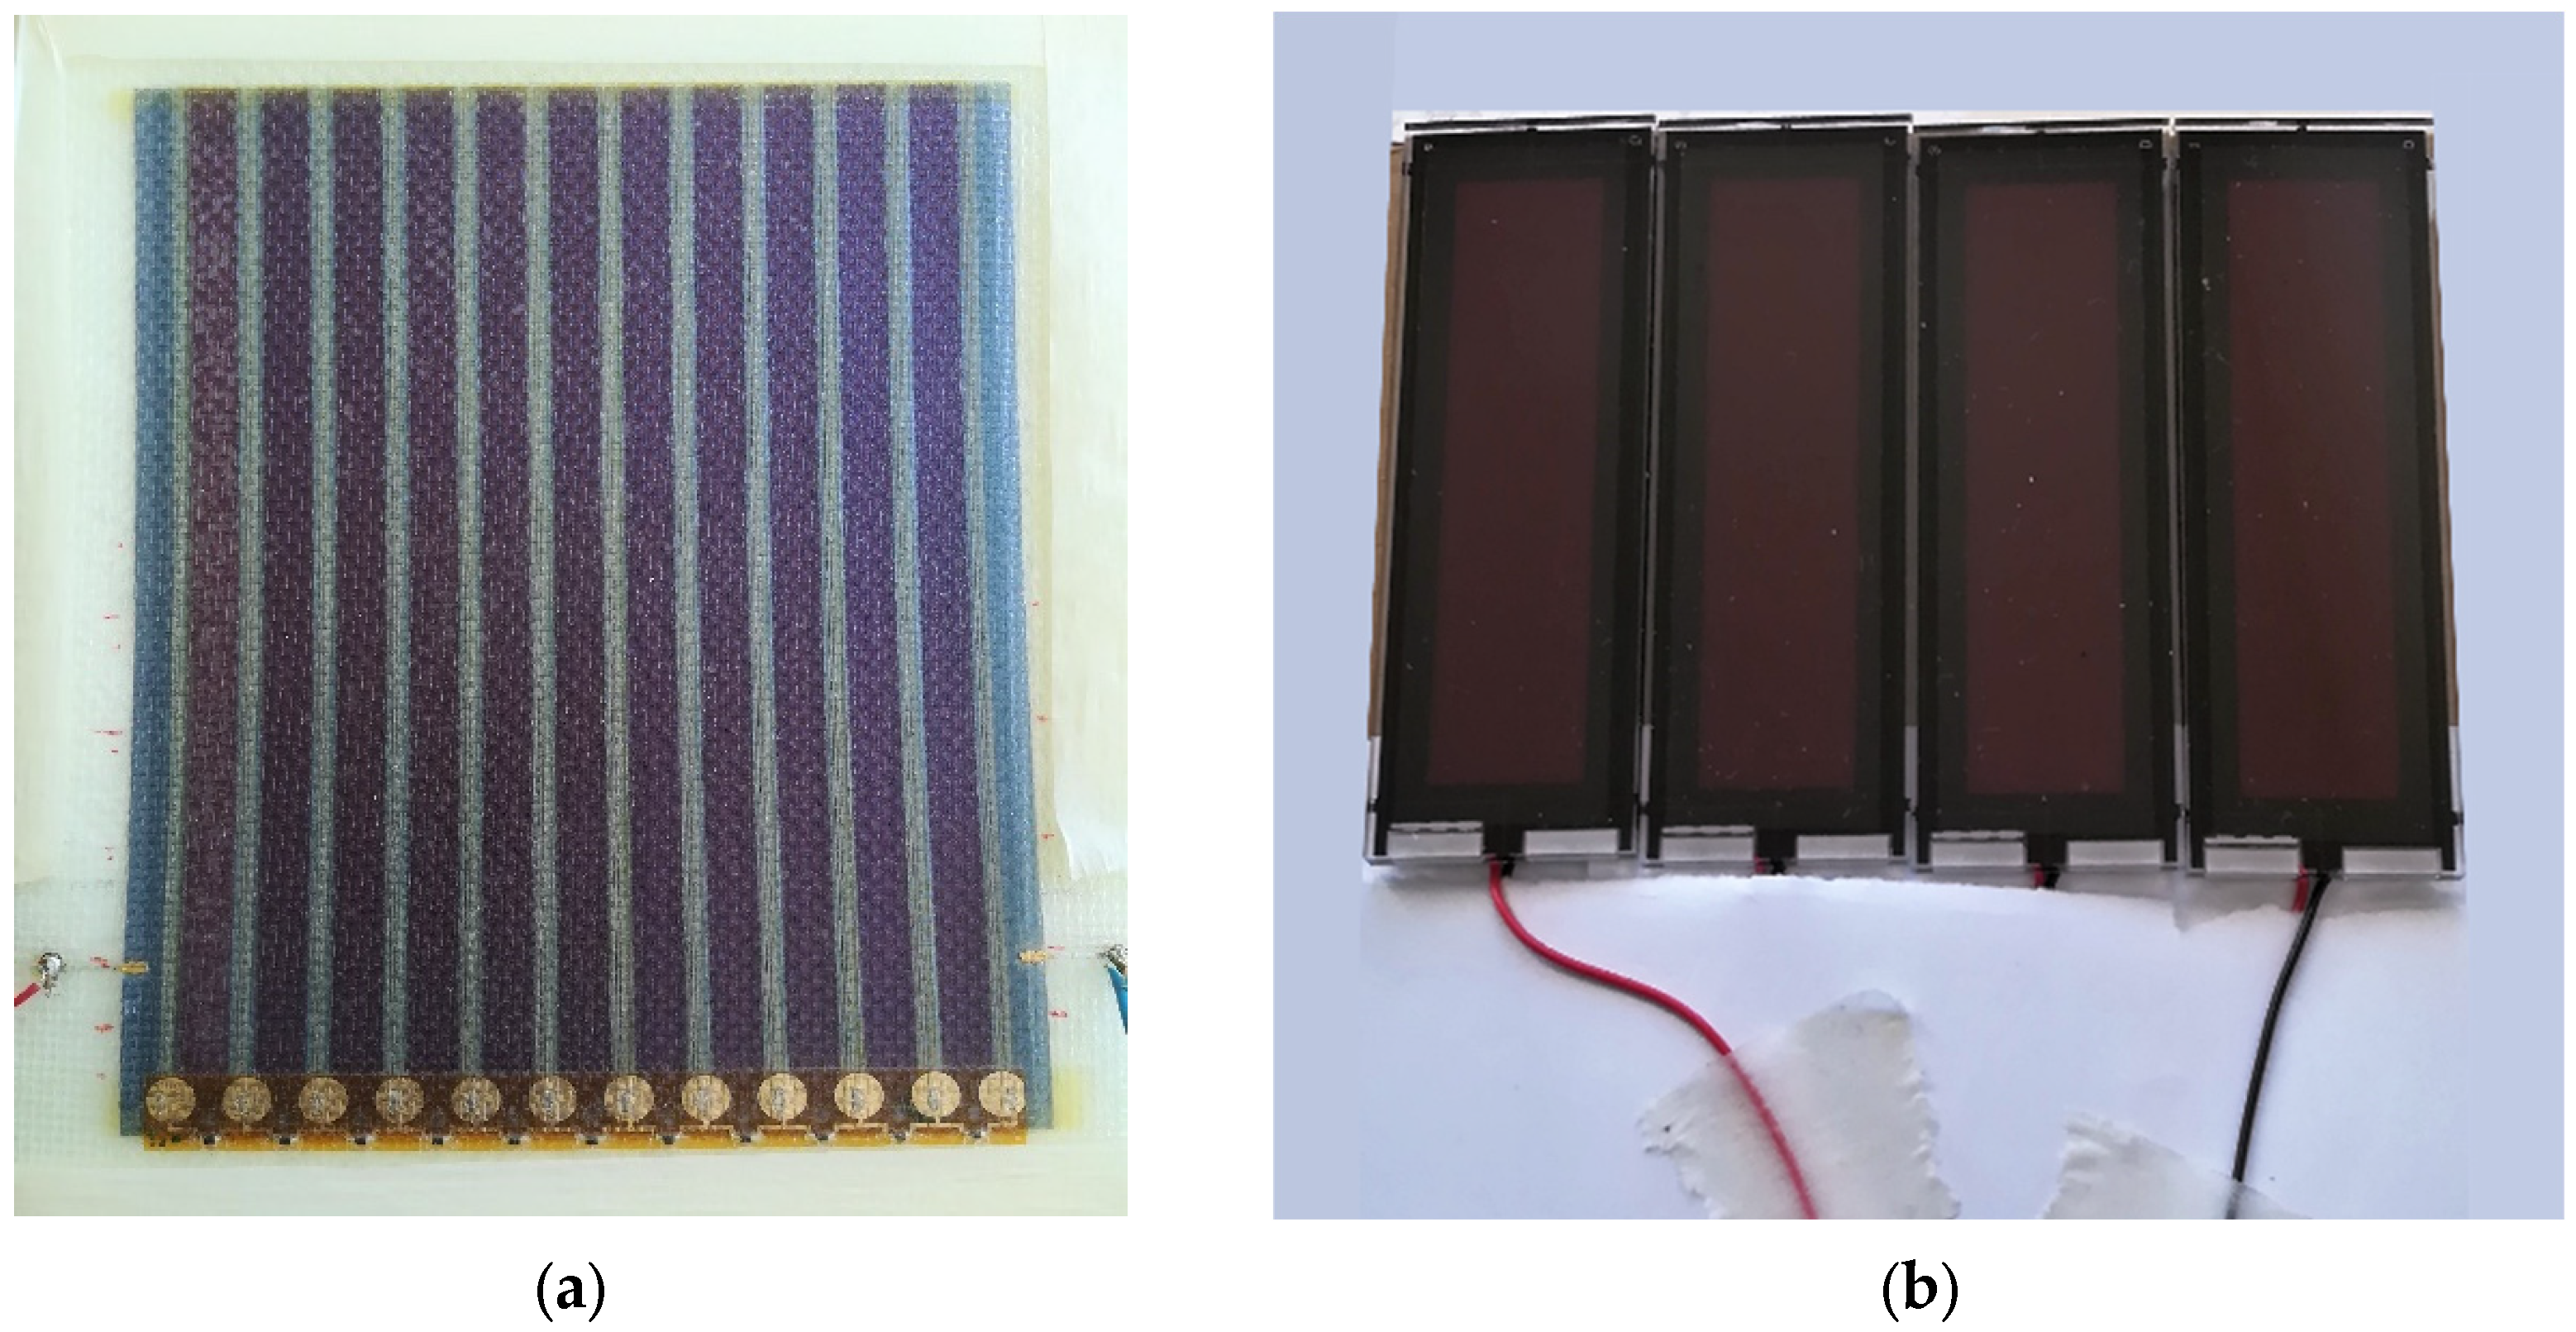
As anticipated in the previous sections, two typologies of DSSC modules were used in this study: both flexible and glass devices. The first type was a flexible monolithic DSSC G24i module produced by G24 Power (Newport, UK) [26]. It consists of a series of 11 cells 1 cm wide and 19 cm long each based on a layer of dye-sensitized nanostructured deposited on a titanium electrode and placed between PET laminate layers. The flexible module is shown in Figure 1a.
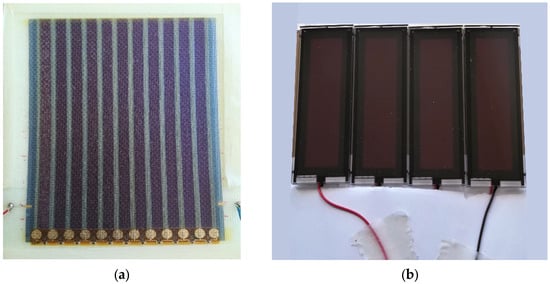
Figure 1.
DSSC modules studied in this work: (a) flexible G24i from Gcell and (b) glass Fujikura FDSC-FSC12FGC.
The second module was obtained by connecting in series 4 FDSC-FSC12FGC DSSCs cells by Fujikura (Tokyo, Japan) [27]. The cells were realized on glass with a 7.14 cm2 active area. They had a nominal 117 mA peak current and 0.38 V peak voltage at 200 lx. A picture of the module is shown in Figure 1b.
To characterize the optical input of the PV modules in the working conditions of interest, the solar spectra were analyzed both numerically and experimentally under different insolation conditions. The spectral irradiance emitted from the sun was measured in the 300–1030 nm range by means of an Oceon Insight USB4000 UV-VIS portable spectrometer equipped with a CC3 UV-S cosine corrector. The irradiance spectra were simulated using the SMARTS 295 simulation toolkit [28]. The measurement of the intensity of the solar radiation was carried out by exploiting a Kipp & Zonen CMP3 pyranometer featuring a nominal sensitivity of 15.66 µV/(W/m2). The measurement uncertainty of the pyranometer was about 1 W/m2. The CMP3 is based on a 64-junction thermopile detector and a 4-mm glass dome with a spectral range of 300–2800 nm. The measurement of the light illumination in the visible range was performed by means of a silicon photodiode-based RS IM-203 lx/fc light meter. The instrument has a spectral response close to the CIE luminous spectral efficiency and uses cosine angular correction.
The I-V characteristics of the PV modules were attained using a Keithley 2401 source electrometer driven by a computer using a MATLAB (MathWorks, Natick, MA, USA) toolkit, while during the node tests, the voltages across the rechargeable Li-Po batteries and at the output of the PV modules were acquired with a sampling period of 1 s using Agilent 34410A multimeters (6 ½ digit resolution) controlled by means of a LabVIEW virtual instrument.
4. Photovoltaic Cell Performance under Diffuse Lighting
4.1. Analysis of the Lighting Conditions
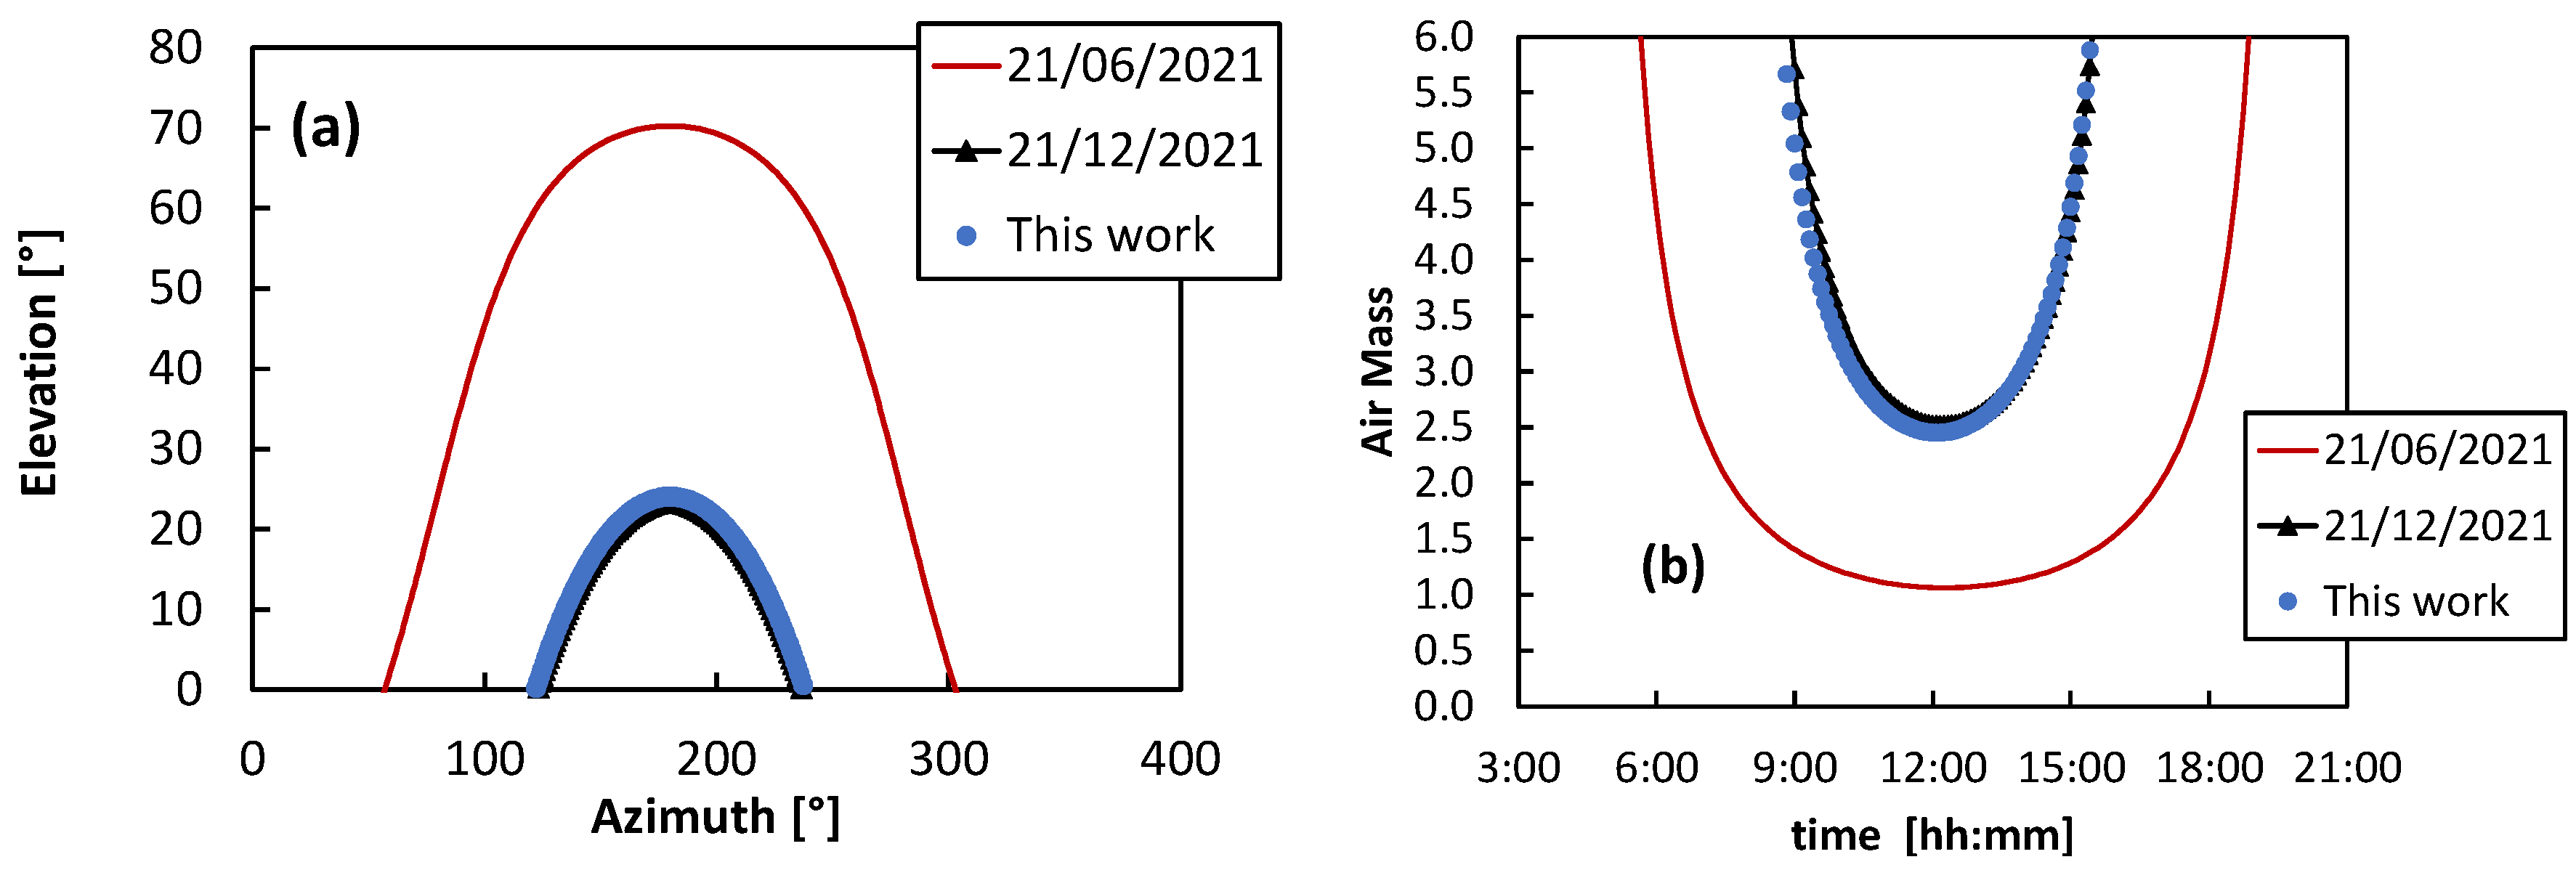
When considering photovoltaic outdoor applications, the variability of the radiation spectral distribution, which is strongly dependent on the sun’s elevation, sky clearness and shadow conditions, must be taken into account in detail. In this respect, a detailed analysis of the lighting conditions expected for the sensor node operations is reported hereafter. Figure 2a shows the sun elevation θ, plotted as a function of the azimuth angle in the test site (Siena, Italy). In the figure, the June and December solstice curves enclosed the band of possible values achievable during the year. Note that the tests in this work were carried out near the December solstice, corresponding to the worst insolation scenario. The following analysis of irradiation depends on the air mass value, which is calculated from sun elevation as follows [29]:
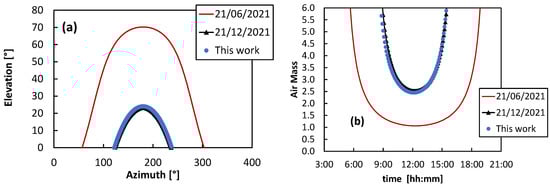
Figure 2.
(a) Sun elevation θ as a function of the azimuth angle calculated for the test site (Siena, Italy) in the case of June and December solstices and for the measurement campaign described in this work. (b) Corresponding air mass values calculated from elevation angle as a function of time.
The AM values in the solstice days are shown in Figure 2b. Near the December solstice, they are typically in the range of 2.5–6.
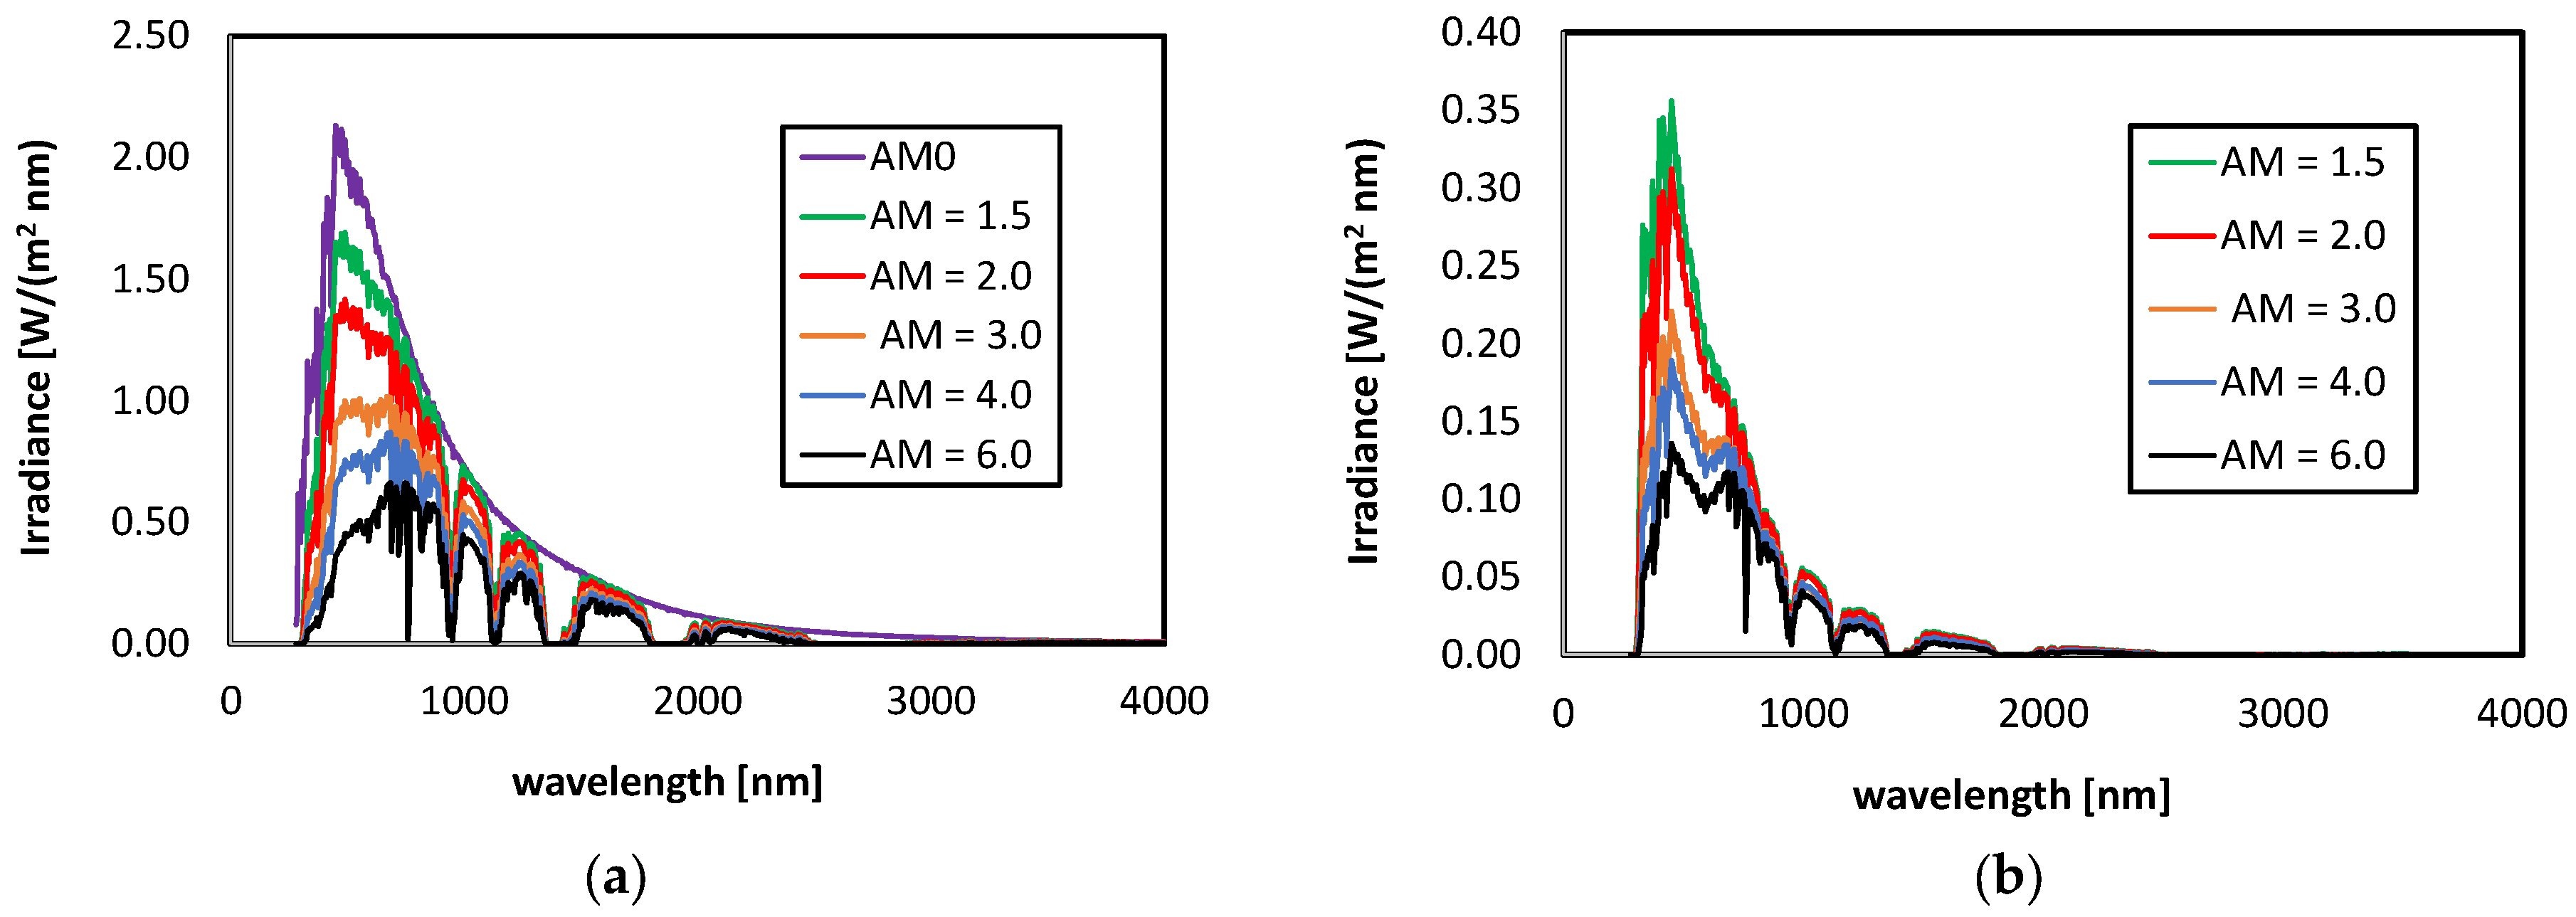
Figure 3a,b shows the global and diffuse sun spectral distributions, respectively, in the case of clear sky conditions and for different AM values, as calculated using the Gueymard SMARTS 295 toolkit [28].
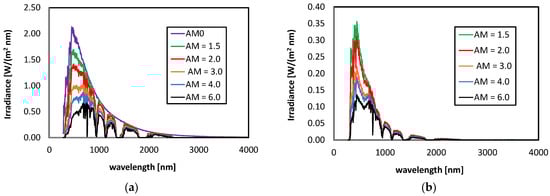
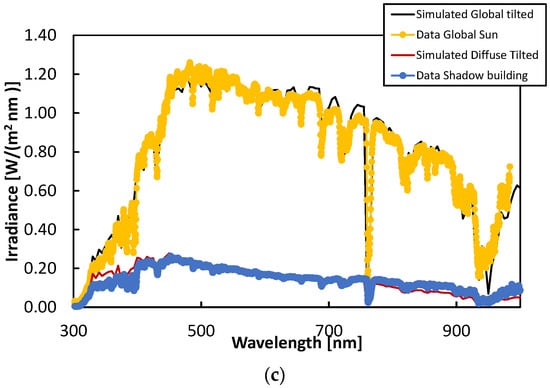
Figure 3.
(a) Global and (b) diffuse irradiance spectra as calculated by the SMARTS simulation toolkit [28] in the case of different AM values and clear sky. (c) Spectra measured in clear sky and in shadows due to a building are compared with the simulated global and diffuse tilted irradiance using the same toolkit for the corresponding AM = 2.5, considering a concrete building environment and clear sky.
The diffuse component was the sole radiation hitting the solar cell in the shadow, while the global one accounted for both direct sunlight and diffuse radiation. As an example, Figure 3c shows the global and diffuse spectra measured in clear sky conditions in the middle of the day compared with those simulated with the SMARTS toolkit for the corresponding AM = 2.5. The plot evidences a good match between the data and simulated curves.
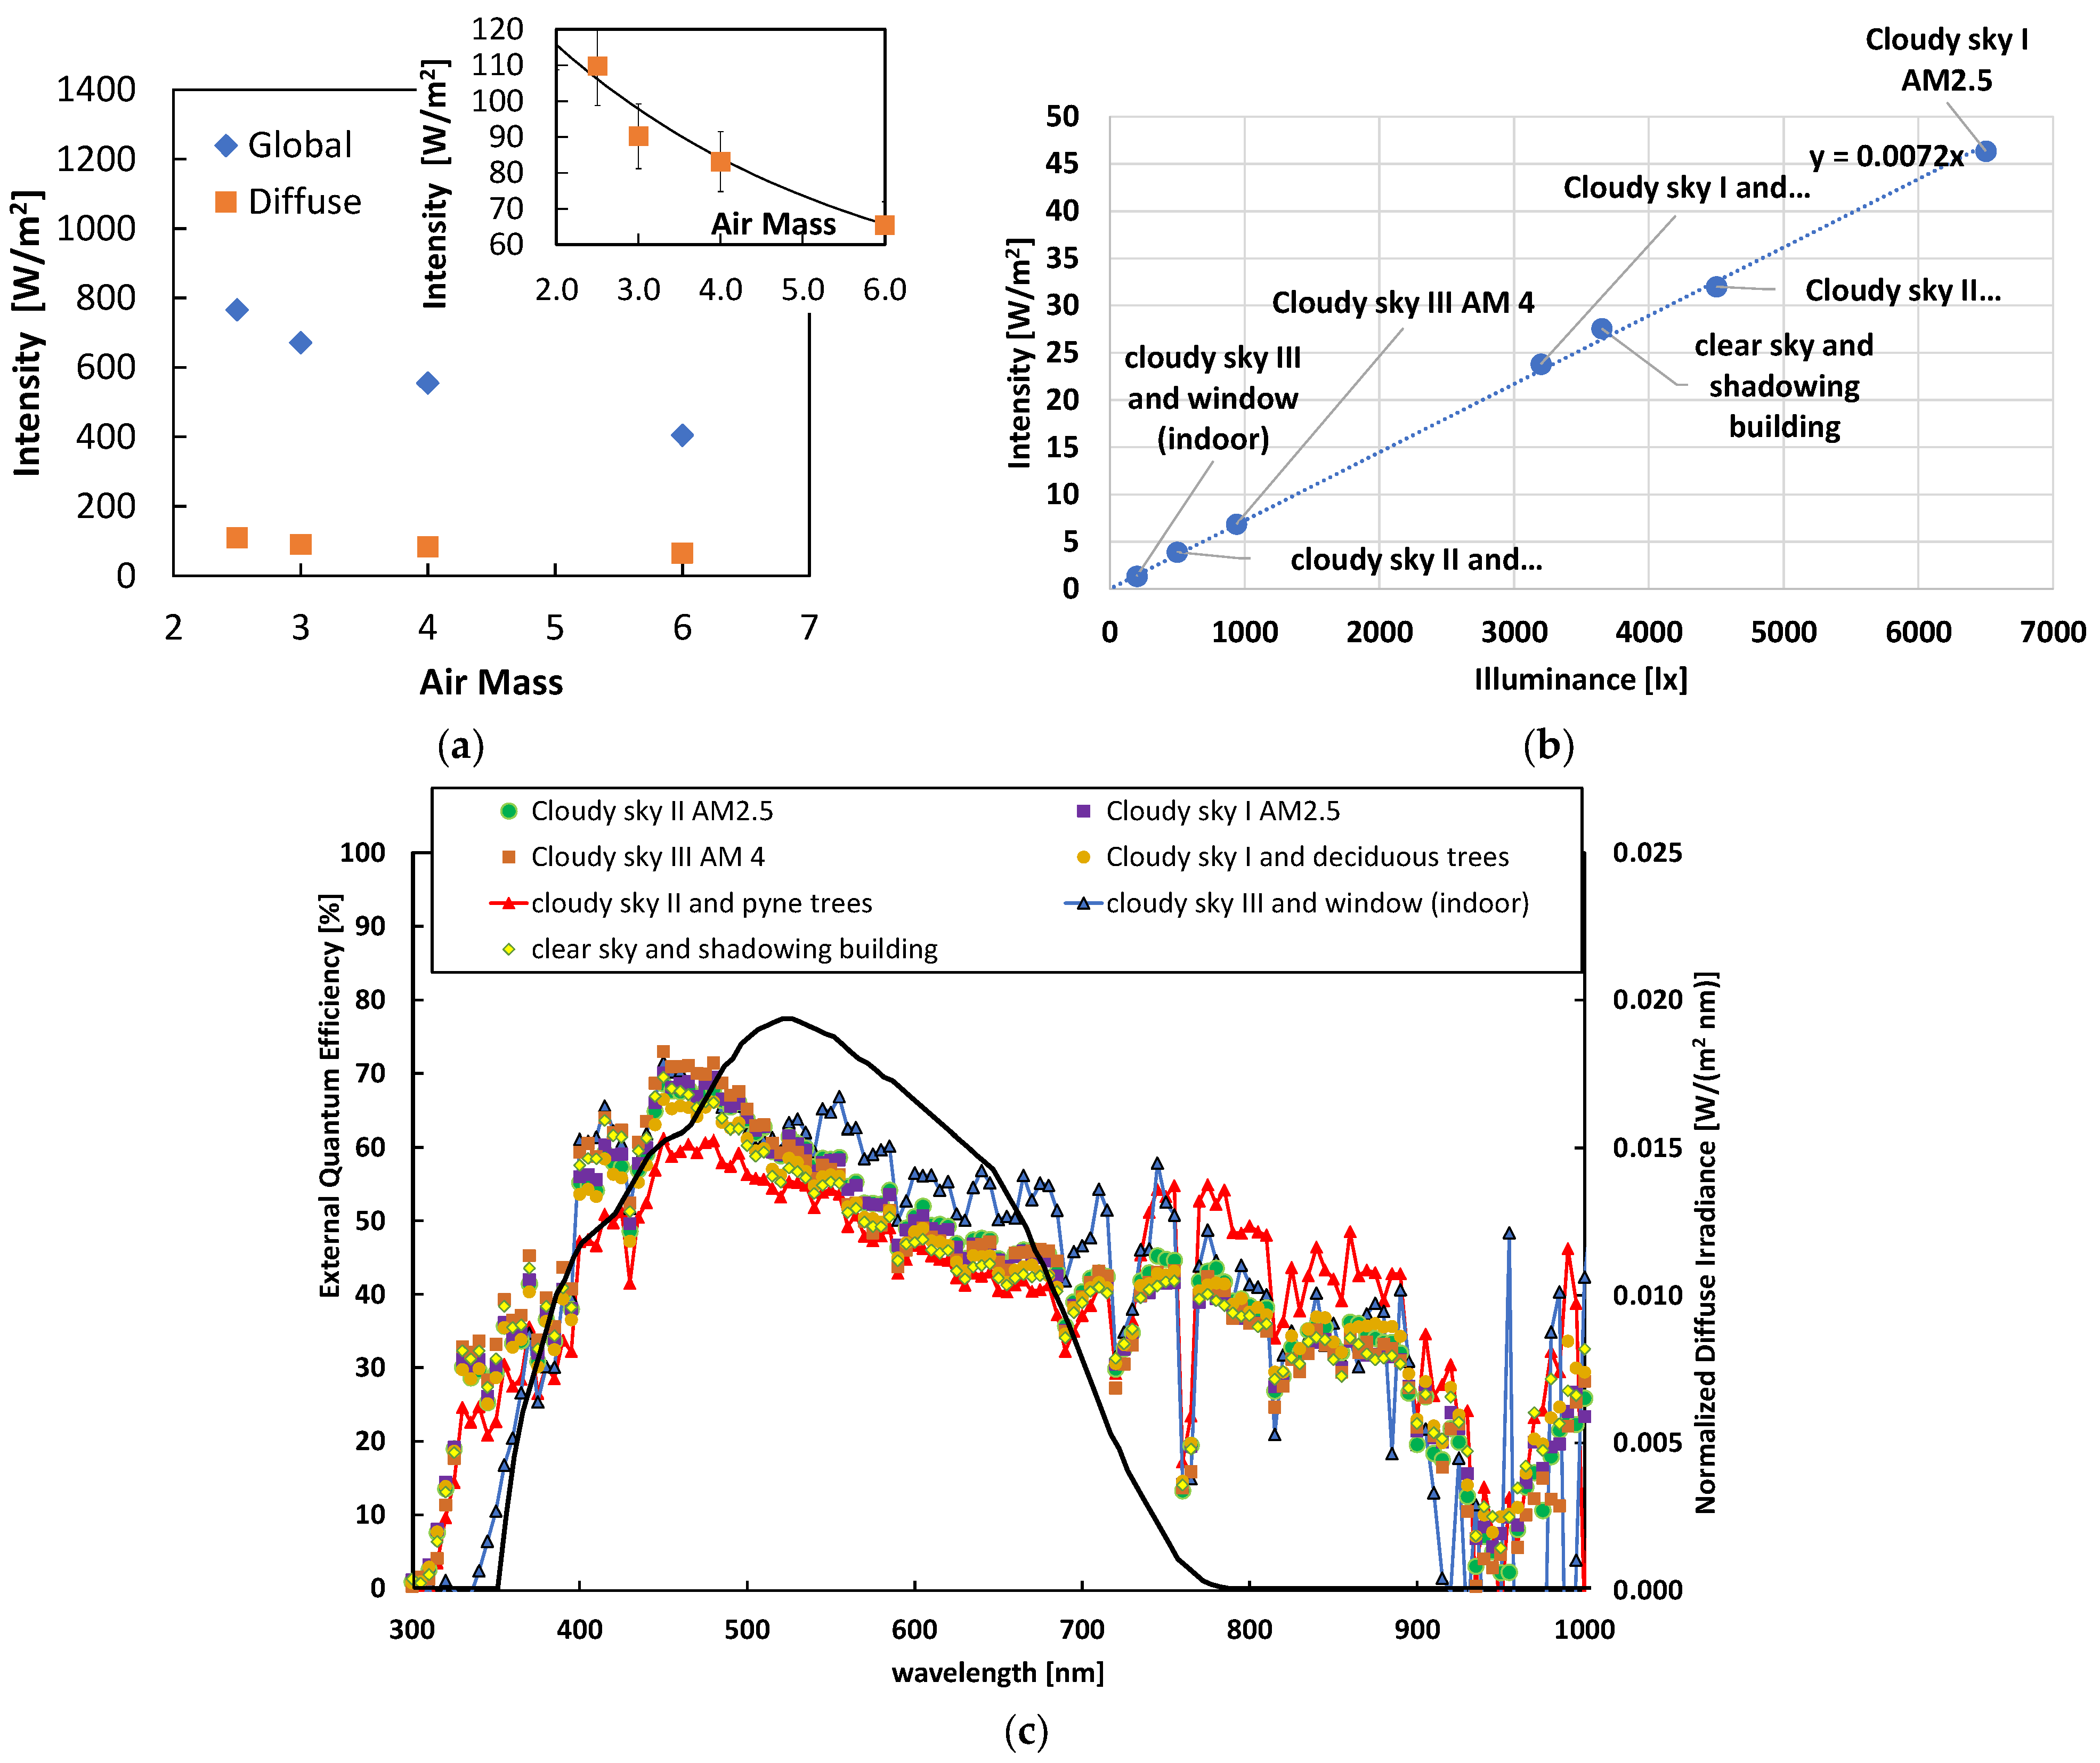
The calculated intensity in the case of clear sky, given as the integral of the irradiance, is shown in Figure 4a for the AM values of interest in this work (global and diffuse). Diffuse irradiance intensities are always about 10% of the global ones, with the highest values being around 110 W/m2. Nonetheless, in the case of cloud covering, shielding and shadowing due to obstacles, the measured intensity could be far lower. As an example, Figure 4b shows the intensity measured as a function of illuminance in various cases of diffuse irradiation such as cloud covering, shadowing from a building (same shown in Figure 3c) and trees, as well as shielding of a transparent glass window (in the absence of artificial light). In particular, cloudy sky I and II refer to measurements performed in the same air mass conditions (AM = 2.5, middle of the day) but in the case of slightly different surrounding environments, leading to different diffuse intensities. Cloudy sky III refers to measurements performed at a different time of day (morning), thus characterized by a higher air mass (AM = 4). The intensity data followed a linear trend with illuminance. The illuminance measured in the different configurations was in the 200–6500 lx range, with a corresponding intensity in the 2–50 W/m2 range. The spectra measured with our spectroradiometer in each configuration (normalized to 1000 lx) are shown in Figure 4c. The shapes of the normalized diffuse spectra were quite similar in the overall investigated range regardless of the origin of the shadowing, apart from a slightly increasing contribution of the near infrared components for the lowest illuminance value and a cut-off at short wavelengths in the case of glass window shielding.
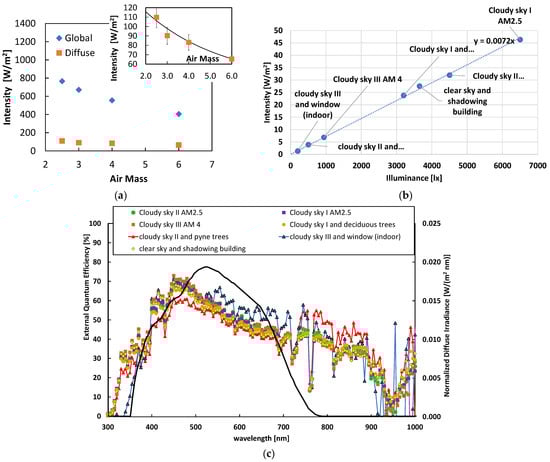
Figure 4.
(a) Intensity calculated from SMARTS toolkit as the integral of the irradiance in the 300–1000 nm range in the case of the global and diffuse spectra given in Figure 3c. (b) Intensity given as the integral of spectral irradiance in the 300–1000 nm range, measured in various outdoor and indoor diffuse radiation conditions: cloudy sky, shadowing of trees and buildings and shielding of transparent glass windows. The intensity is plotted as a function of the corresponding measured illuminance in lx. The linear best fit is also shown. (c) Measured diffuse spectra in the conditions from (b), normalized to the case of 1000 lx (right axis). The external quantum efficiency of the DSSC modules is added for comparison (left axis, solid line).
The performance of a PV module can be calculated by starting from the knowledge of the external quantum efficiency (EQE), or the number of electron–hole pairs generated per incident photon. Figure 4c also shows the DSSC EQE, as given by [26,30]. Compared with the normalized spectral irradiances, the EQE broad band appears to be distributed in the visible range, where the diffuse spectra have a prominent peak. In particular, the cut at short wavelengths is outside the EQE band and thus does not influence the performance of the photovoltaic module. The similarity of the diffuse irradiance spectra measured in different weather and shadowing conditions allowed us to select the best systematic average standard conditions in the case of diffuse irradiance penetrating from glass windows.
4.2. DSSC Performance
We studied the performance of the considered DSSCs in the irradiation conditions of interest as derived in the previous subsection, which coincided with those used during the WSN energy harvesting experiments (see Section 6).
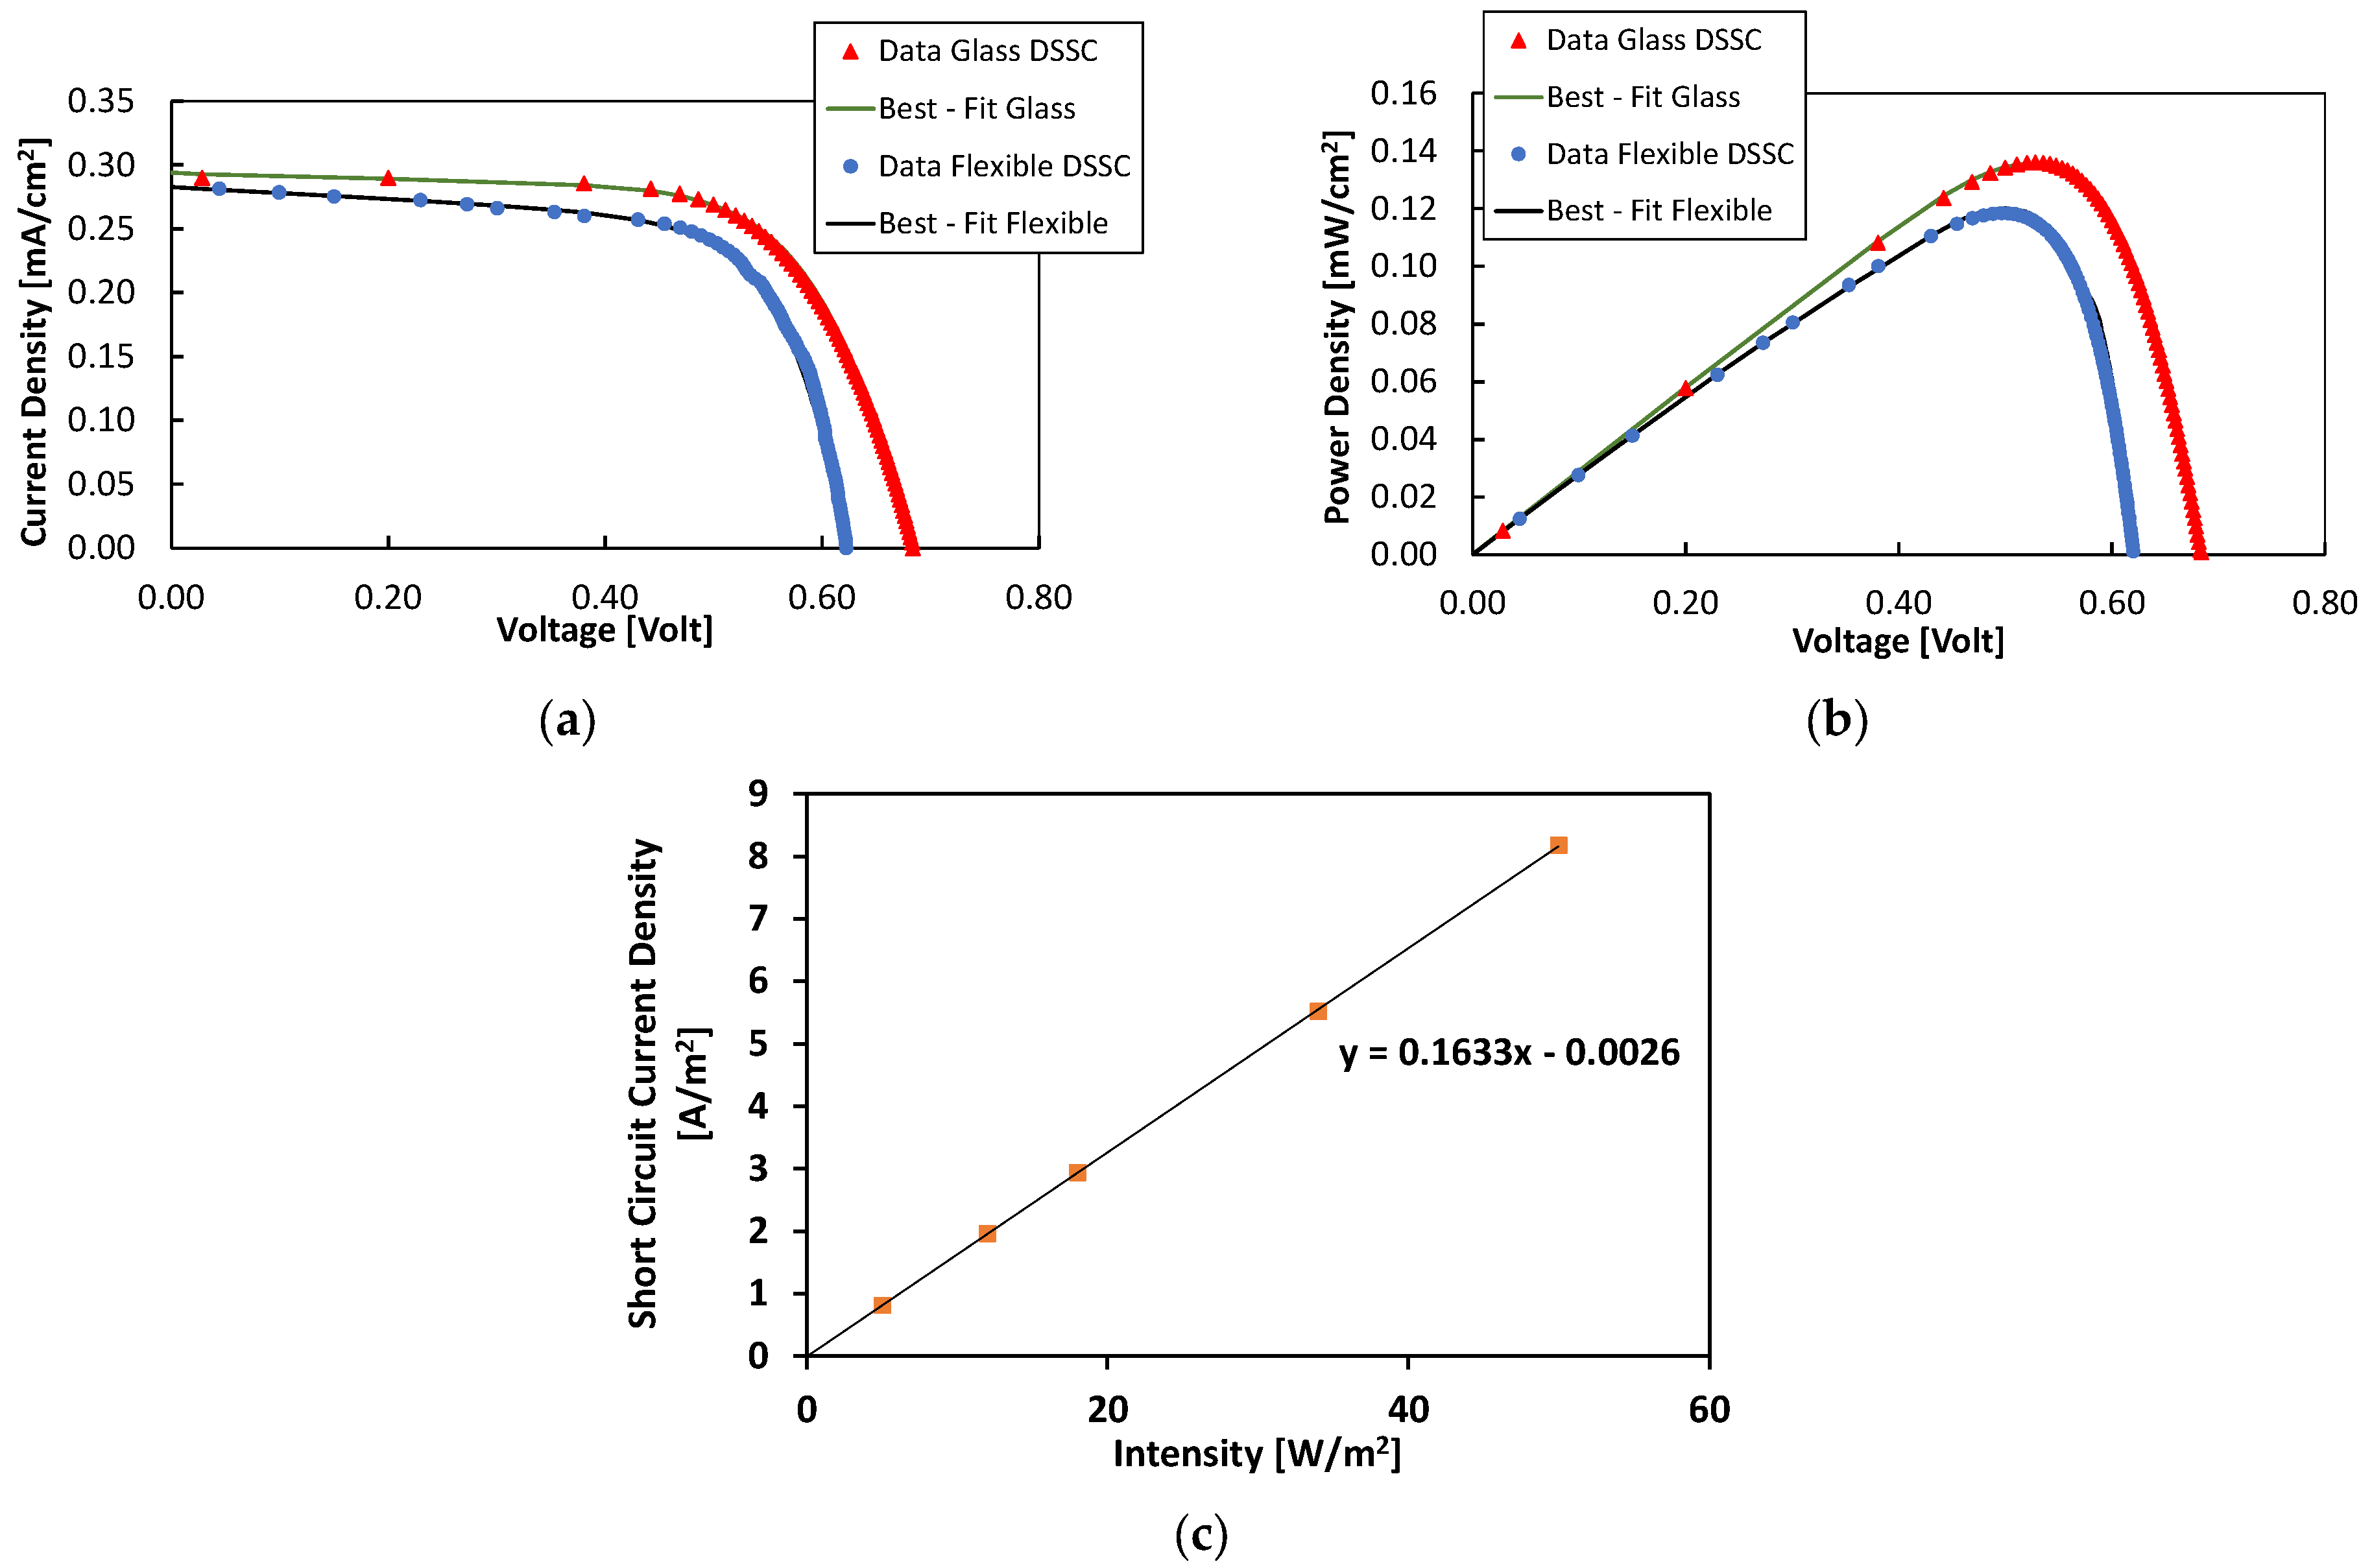
In this respect, Figure 5a,b shows the I-V and the power–voltage (P-V) characteristics measured with the DSSC glass and flexible modules in the case of diffuse outdoor irradiation with an intensity of 18 W/m2, which is typical of a cloudy sky in winter. Here, to derive the I-V characteristics of a single module of the flexible device, the measured voltage was divided by the number of cells in series.
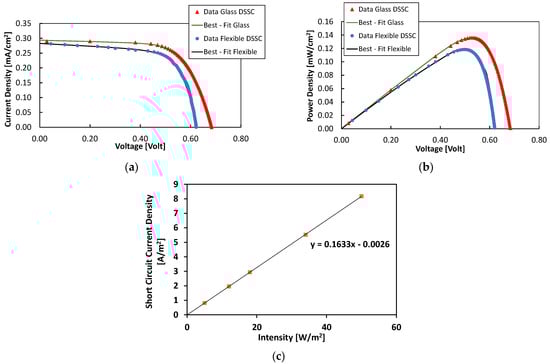
Figure 5.
(a) I-V and (b) P-V characteristics measured under diffuse solar radiation with the flexible and glass DSSCs at an intensity of 18 W/m2 and 2500 lx. The best fit is obtained using Equation (5) with the parameters given in Table 1. (c) Short circuit current density calculated using Equation (3) as a function of the diffuse solar radiation intensity using the spectra shown in Figure 4c.
The most important photovoltaic parameters were extracted from these measurements exploiting the following relationships.
The spectral responsivity of the solar cell R(λ) was calculated from its quantum efficiency as follows:
where q is the electric charge, ν is the radiation frequency, h is the Planck constant, c is the speed of light and λ is the wavelength. The short circuit current density Jsc was given by convoluting the spectral responsivity with the incident irradiance Φinc [31]:
Then, the open circuit voltage Voc was obtained from the following relationship:
where k is the Boltzmann constant, T is the temperature, n is the ideality factor and is the reverse voltage dark saturation current density of the junction.
Moreover, the peak power density for the solar cell is Pmax = VmaxJmax = JscVoc FF, where FF is the fill factor, Jmax is the peak current density and Vmax is the peak voltage.
In the non-ideal case, the equivalent circuit of a solar cell must also take into account the parasitic series and shunt resistances Rs and Rsh, respectively. Therefore, the relationship between the voltage across the cell V and the current exiting the cell anode I is written as follows:
where is the short circuit current, is the saturation reverse current and A is the effective junction area.
Note that in Figure 5a,b, the best fits of the curves are also plotted and superimposed to the measurements. The parameters derived from the fitting are reported in Table 1. The good agreement between the data and best fits evidence that both the flexible and glass solar cells were working properly under diffuse solar radiation.

Table 1.
Main photovoltaic parameters obtained from DSSC characteristics.
Figure 5c shows the short circuit current density calculated by using Equation (3) as a function of the diffuse solar radiation intensity and the spectra shown in Figure 4c. As expected, the short circuit current density was a linear function of the radiation intensity. The linear best fit, also shown in the plot, was characterized by a slope of 0.163 W/A for diffuse radiation in the overall investigated range.
To further comment on the results, we observed slightly better performance from the solar cell made on glass in terms of the peak power density. This was a consequence of the higher open circuit voltage and short current density in the case of glass manufacturing. In turn, the flexible module, being formed by a series of 11 cells, could profit from a higher peak voltage and power of 5.5 V and 1.96 mW at 18 W/m2, respectively.
5. Sensor Node Architecture
A test set-up was developed to demonstrate the usability of the DSSC modules as power sources for WSNs to be employed for remote data acquisition in conditions where there is no direct power availability. In this case, the DSSCs should supply the energy to ensure practically infinite self-sufficiency for the sensor node. With the aim of demonstrating this feature, a prototypical sensor node was set up together with a network infrastructure allowing actual data transmission to a remote server. As already anticipated, the whole network infrastructure was based on the PHY layer LoRa modulation and exploited the MAC layer LoRaWAN protocol. The LoRa technology ensures data transmission over long distances and is therefore suitable for data acquisition from remotely deployed sensor nodes. The LoRaWAN protocol allows the management of a large quantity of nodes forwarding data packets to a server-side structure composed of a network server in charge of managing the incoming packets from multiple sources and an application server for data storage.
From a hardware point of view, standard LoRaWAN networks are composed of LoRaWAN end nodes and LoRaWAN gateways; the former are the sensor nodes in charge of data acquisition and transmission, while the latter are in charge of collecting all the packets coming from the end nodes (and eventually transmitting ACKs or downlink messages) and forwarding them to the servers. The infrastructure used for the tests included a set of three gateways deployed in a building, which were in charge of collecting data from multiple sources and for different purposes.
Regarding the end node, two LoRaWAN nodes were employed for the tests, with one for each DSSCs prototype. With the aim of testing the operation of a general purpose device, a standard low-power system architecture was designed, integrating a low-power 8-bit AVR ATtiny84 microcontroller by Microchip, a MCP9700-E/TO temperature sensor by Microchip and an RFM95 LoRa module by HopeRF equipped with a 2-dBi gain λ/8 antenna. The MCU was programmed with a clock frequency of 1 MHz and exploited the sleep option, according to which the MCU was awakened at fixed time intervals and then returned to sleep mode after sampling the sensor and transmitting the processed data via LoRaWAN. The activation of the LoRa module was controlled by the MCU by means of a MOSFET acting as a switch. In this way, the radio module was totally turned off when it was not transmitting and was activated only for the time required to perform data transmission, thus avoiding extra power consumption during the MCU’s sleep. The radio settings were as follows: transmission frequency = 868 MHz, output power = 14 dBm, coding rate (CR) = 4/8, spreading factor (SF) = 12 and bandwidth (BW) = 125 kHz. Each transmitted packet had a payload of 4 bytes plus 13 bytes of overhead. These settings were chosen as a tradeoff between the need to attain the low consumption requirement and the critical issues related to the outdoor application scenario, such as the noise, signal attenuation, reduced radio coverage and long distances between the end nodes and gateways. The highest CR being 4/8 guarantees the best error correction, which is a fundamental requirement in critical application scenarios, at the expense of a longer time on air (ToA) and consequently slightly higher power consumption with respect to the lower CRs. Additionally, SF = 12 has the longest ToA (≃1.721 s for 17 input bytes) and the highest power consumption. Moreover, this is not suitable for those applications requiring the transmission of huge quantities of data, since the maximum number of transmittable payload bytes is 51. However, this provides the highest receiver sensitivity and the lowest packet loss, which are important aspects that must be accounted for in the deployment of monitoring systems in remote and critical scenarios.
The node also integrated a battery management system (BMS) in charge of managing the charging process of a 3.7 V, 720 mAh Li-Po battery used to power the node. The BMS integrated in the node was the CJMCU-2557 board hosting the nano-power boost charger and buck converter BQ25570 by Texas Instruments. This device features an extremely low quiescent current (in the nA range) and is able to extract power to the order of µW to mW from high-impedance DC sources providing low voltages and whose energy recovery is occasional and limited, as in the case of PV modules operating in diffuse sunlight conditions. The boost charger allows the charging of an energy reserve, which in our case was the Li-Po battery, and by exploiting a battery threshold control unit, it is able to protect the storage element from unsafe overcharging and undercharging through the proper setting of programmable voltage thresholds. The buck converter provides a regulated voltage supply, which is set in advance by the user through the selection of some externally available resistors, to eventually power up the sensor node without directly draining the battery. Moreover, the load is detached from the power rail when an indicator signals that the voltage at the energy storage element falls below a critical level in such a way to avoid its complete depletion. In the application presented in this work, the buck converter output was about 2.5 V, and it was exploited to power the node. Furthermore, the BQ25570 implements a programmable maximum power point tracking (MPPT) algorithm, which adapts every 16 s for optimizing the power transfer from the source. The working point for the glass module was set to 80% of its Voc value, which corresponded to the maximum power point (MPP) for ideal solar cells. Instead, to meet the maximum input voltage constraint of the chip, for the flexible module, the MPP was set to 50% of Voc. Looking at the I-V characteristics shown in Figure 5a, the current expected for the flexible module in case of 50% Voc operation was about 93.5% of the short circuit current, while the current in case of 80% Voc operation of the glass module was about 84% of the short circuit current.
Finally, as the node was expected to collect data from the sensors, a temperature sensor was embedded on it. Indeed, the power consumption of the sensor and its front-end varies significantly according to the parameter to be monitored and the working principle exploited by the onboard sensors. However, it is generally far lower if compared with the actual consumption of the radio module. Moreover, like the radio module itself, the sensor too could be activated only for the time strictly necessary to perform the measurement. In most cases, this can be completed in a few milliseconds. Thus, we deemed it not significant to add other sensors which would, however not significantly, affect the actual behavior of the charge and discharge processes of the batteries. For specific applications, the behavior of the node, integrated with one or more sensors whose consumptions are known, could be easily predicted when starting from the results presented in this work.
A rough analysis of the overall consumption of the node could be performed by looking at the datasheets of the single components. According to the suggested working principle, where the microcontroller woke up periodically to sample the sensor and transmit the packet, two working modes could be envisaged: the sleep mode and the active mode. In sleep mode, only the BMS and the microcontroller are actually powered. The latter is, however, operating in power down mode with a current absorption of 0.2 μA at 2.7 V [32]. Since the BMS accounts for a typical quiescent current at room temperature in full operation mode of 488 nA [33], the overall current absorption could be estimated in around 0.7 μA, leading to an average power consumption lower than 2 μW.
In active mode, all the components are turned on, with the microcontroller set in active mode and its current absorption growing to 800 μA. The MCP9700-E/TO sensor has a typical current absorption of 6 μA [34], which is thus comparable with the BMS. Conversely, the current absorption of the RFM95 module during transmission can reach 80 mA [35]. All the other current absorptions can then be considered negligible. Thus, during the active phase, the average power consumption was around 200 mW. While this value was five orders of magnitude larger than the one achievable during sleep mode, the duration of this operation was related only to the actual LoRaWAN airtime, which was lower than 2 s. When considering one active phase per hour, the average hourly energy consumption of the node could then be estimated as follows:
Of course, this is a raw estimation, but it still provides an interesting insight into the actual energy needs of the system and is useful for pointing out the preponderant role of the LoRa module, which can be identified as the real bottleneck for the design of energy-efficient WSNs.
6. System Tests
The two sensor nodes were tested during two test campaigns lasting 9 days (from 19 December 2021 to 27 December 2021) and 6 days (from 29 December 2021 to 3 January 2022). Their aim was to prove the energy self-sufficiency of the nodes, which harvested energy from diffuse sun radiation by using the DSSC PV modules, thus confirming the predictions obtained by the solar cell characterization. The tests were performed in a laboratory at the Department of Information Engineering and Mathematics in Siena, Italy, with the DSSC modules placed vertically and close to each other in front of a window oriented in the northeastern direction and in such a way as to have similar lighting conditions. The panels were at a 10-cm distance from the window glass and in the absence of artificial lighting in the room. As discussed in the previous sections, the glass window was not significantly altering the diffuse spectrum. The MCU operated in sleep mode, and it woke up every 8 h during the first test and every hour during the second test, remaining in run mode just for the time required to sample the temperature sensor and to transmit the collected data. The most consuming operations from an energy point of view were the radio transmissions, since each one lasted 1.721 s (.163 s during the whole day in the case of transmissions every 8 h and 1.304 s in the case of transmissions every hour), with the peaks of the absorbed current reaching up to 80 mA. In order to prove that the proposed system allowed a positive net charge of the battery to guarantee the energy self-sufficiency of the node, the trends of the voltages across the batteries of the two nodes (i.e., and ) and the voltages at the input of the BMSs (i.e., ) were acquired with a sampling period of 1 s using multimeters controlled via LabVIEW. Simultaneously, the diffuse light intensity was continuously monitored using the pyranometer serially acquired every 2 s via LabVIEW. These data were also compared with the outdoor global solar radiation intensity collected every 300 s by a weather station located in Siena at 1.2 km as the crow flies from the laboratory and available online [36].
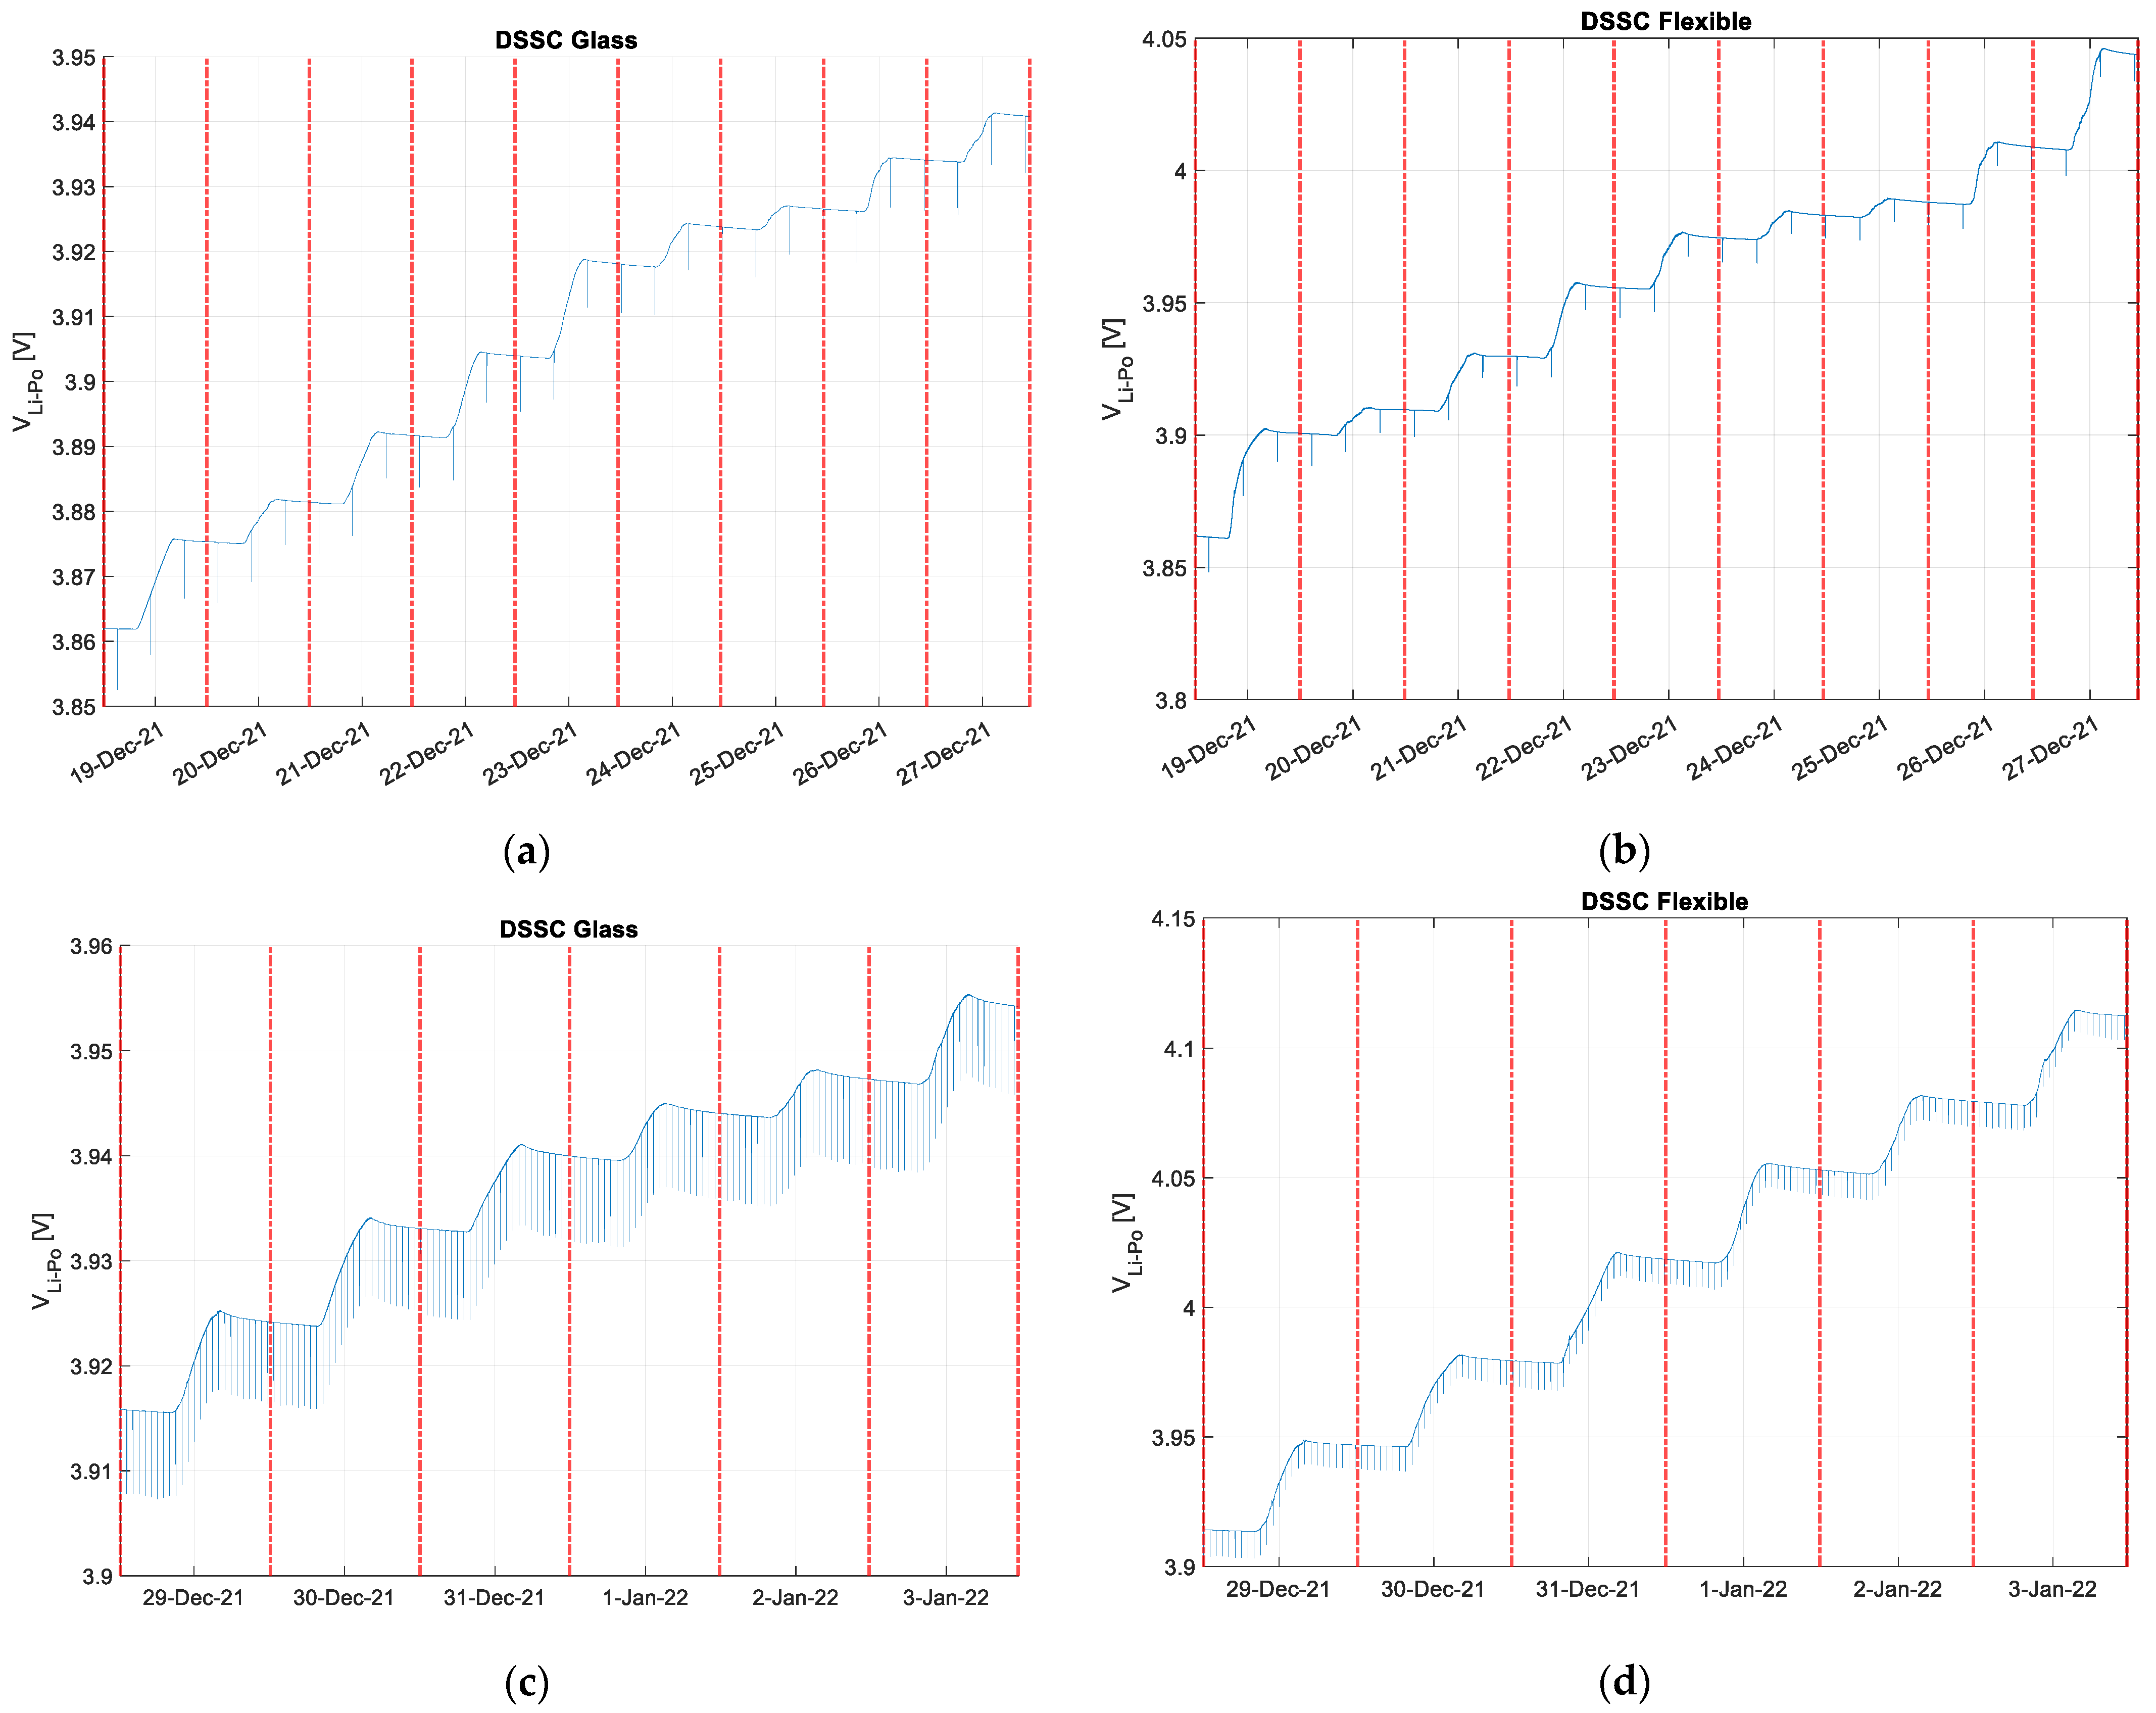
The Li-Po battery voltages acquired during the two test campaigns are shown in Figure 6 (the y-axis scales for the four graphs are different to take into account the different charging capabilities of the two DSSCs). Figure 7 shows the input voltage and the diffuse intensity measured by the pyranometer together with the outdoor solar irradiation. The daily net balances obtained as the difference between the final and the initial battery voltage levels (i.e., and ) are shown in Table 2.
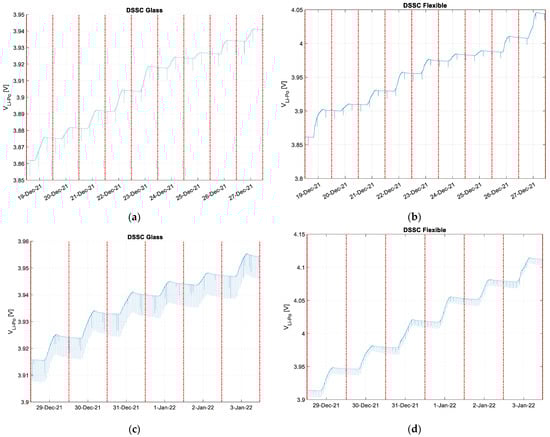
Figure 6.
The acquired Li-Po battery voltages in the case of glass and flexible DSSC energy harvesting during the first test campaign ((a,b), respectively) and the second test campaign ((c,d), respectively).
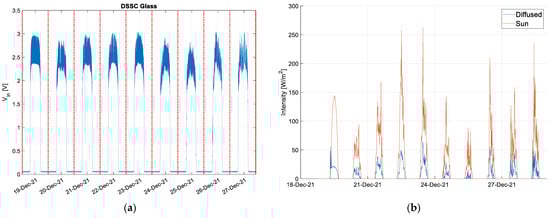
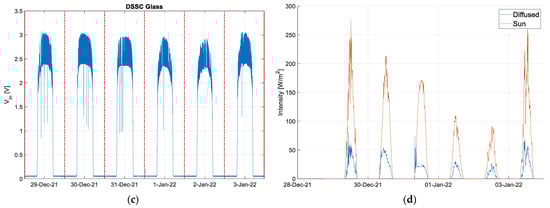
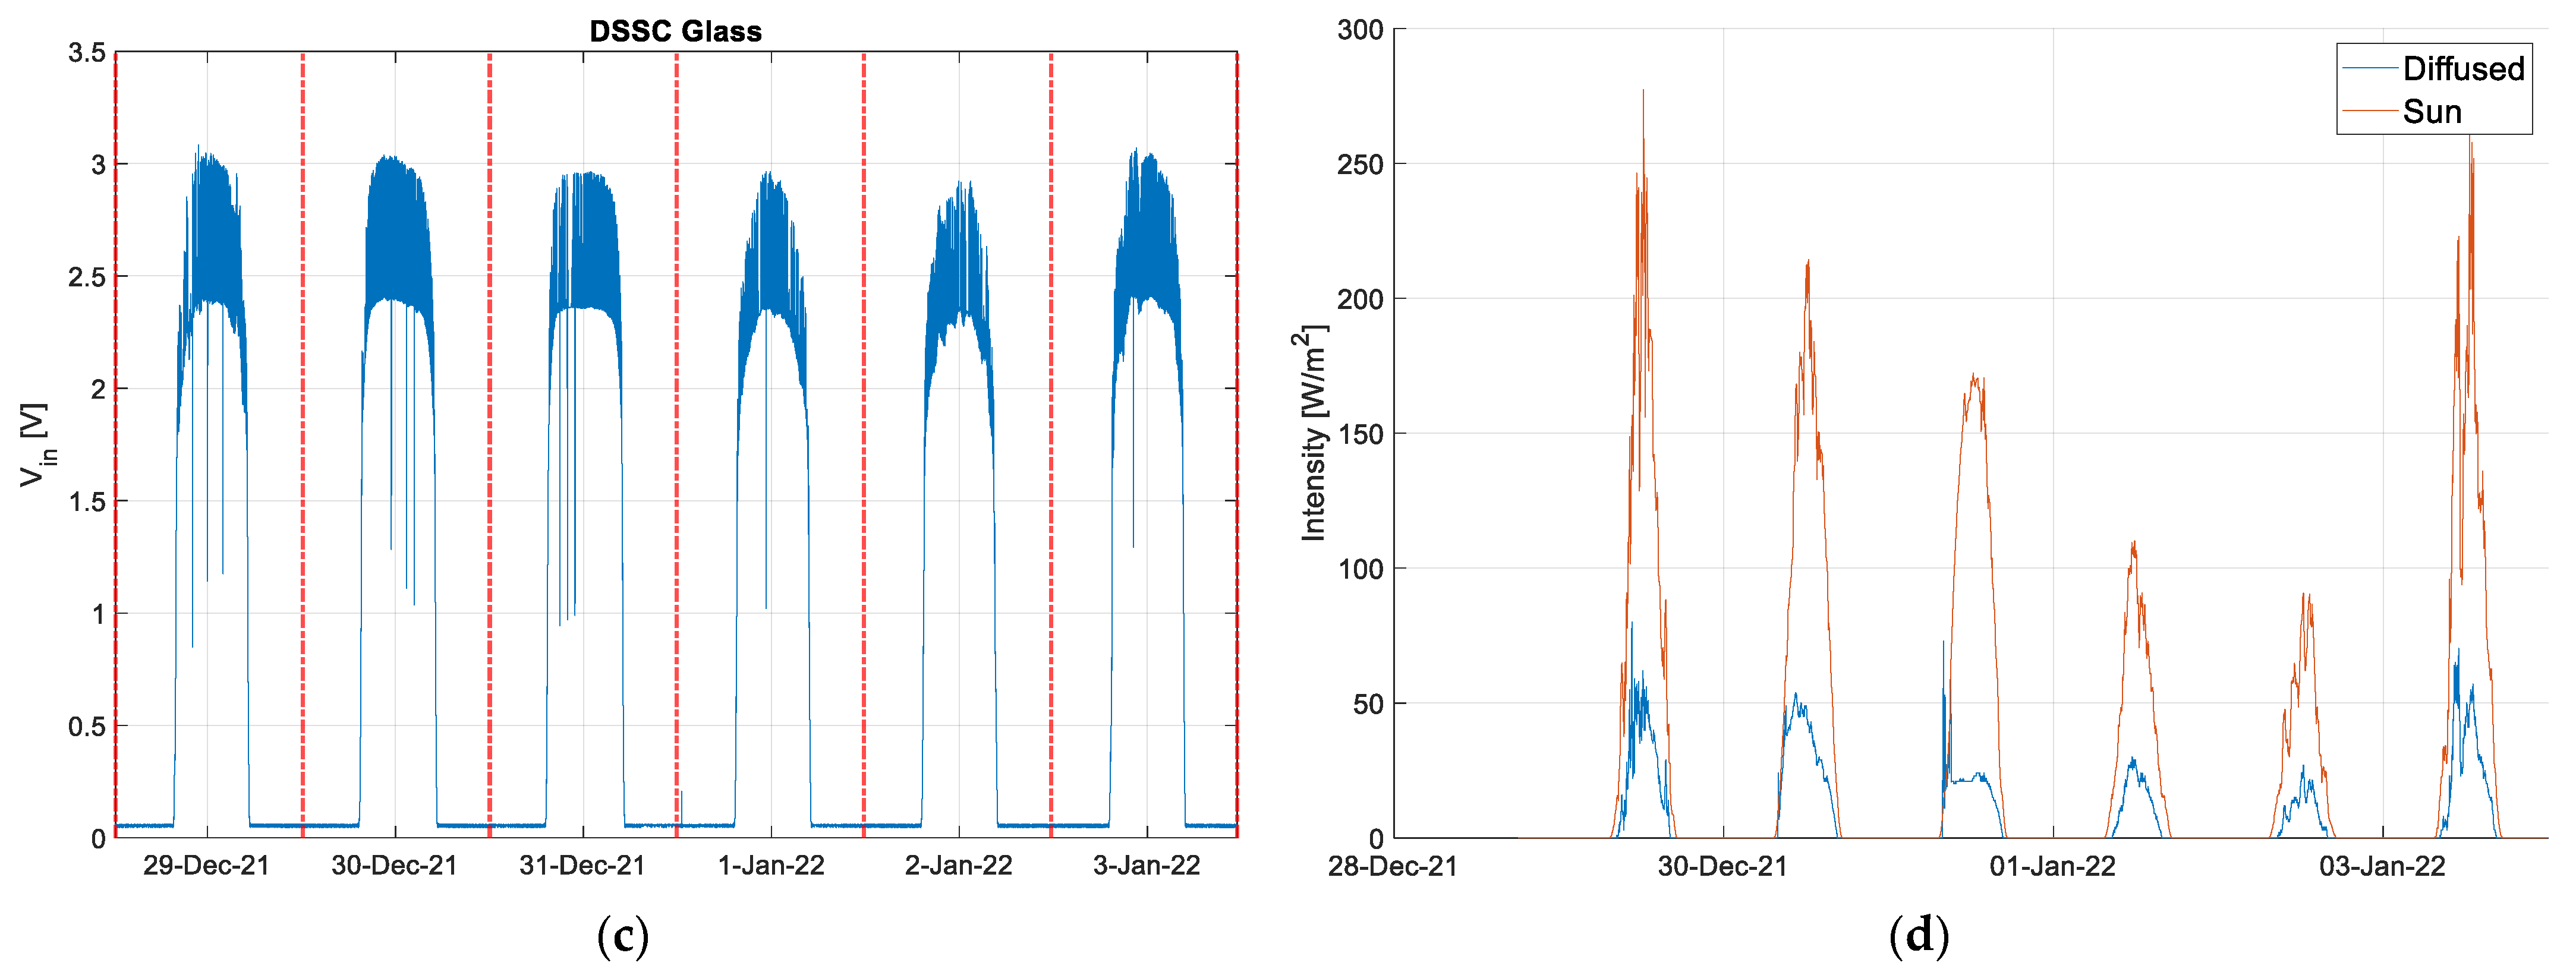
Figure 7.
Input voltage and diffuse intensity measured by the pyranometer (blue line) together with the outdoor solar irradiation as reported by local weather broadcasts (red line) for the first test campaign ((a,b), respectively) and the second test campaign ((c,d), respectively).
Table 2.
Daily net balances obtained as the difference between the final and initial battery voltage levels (i.e., and ) for the two test campaigns.
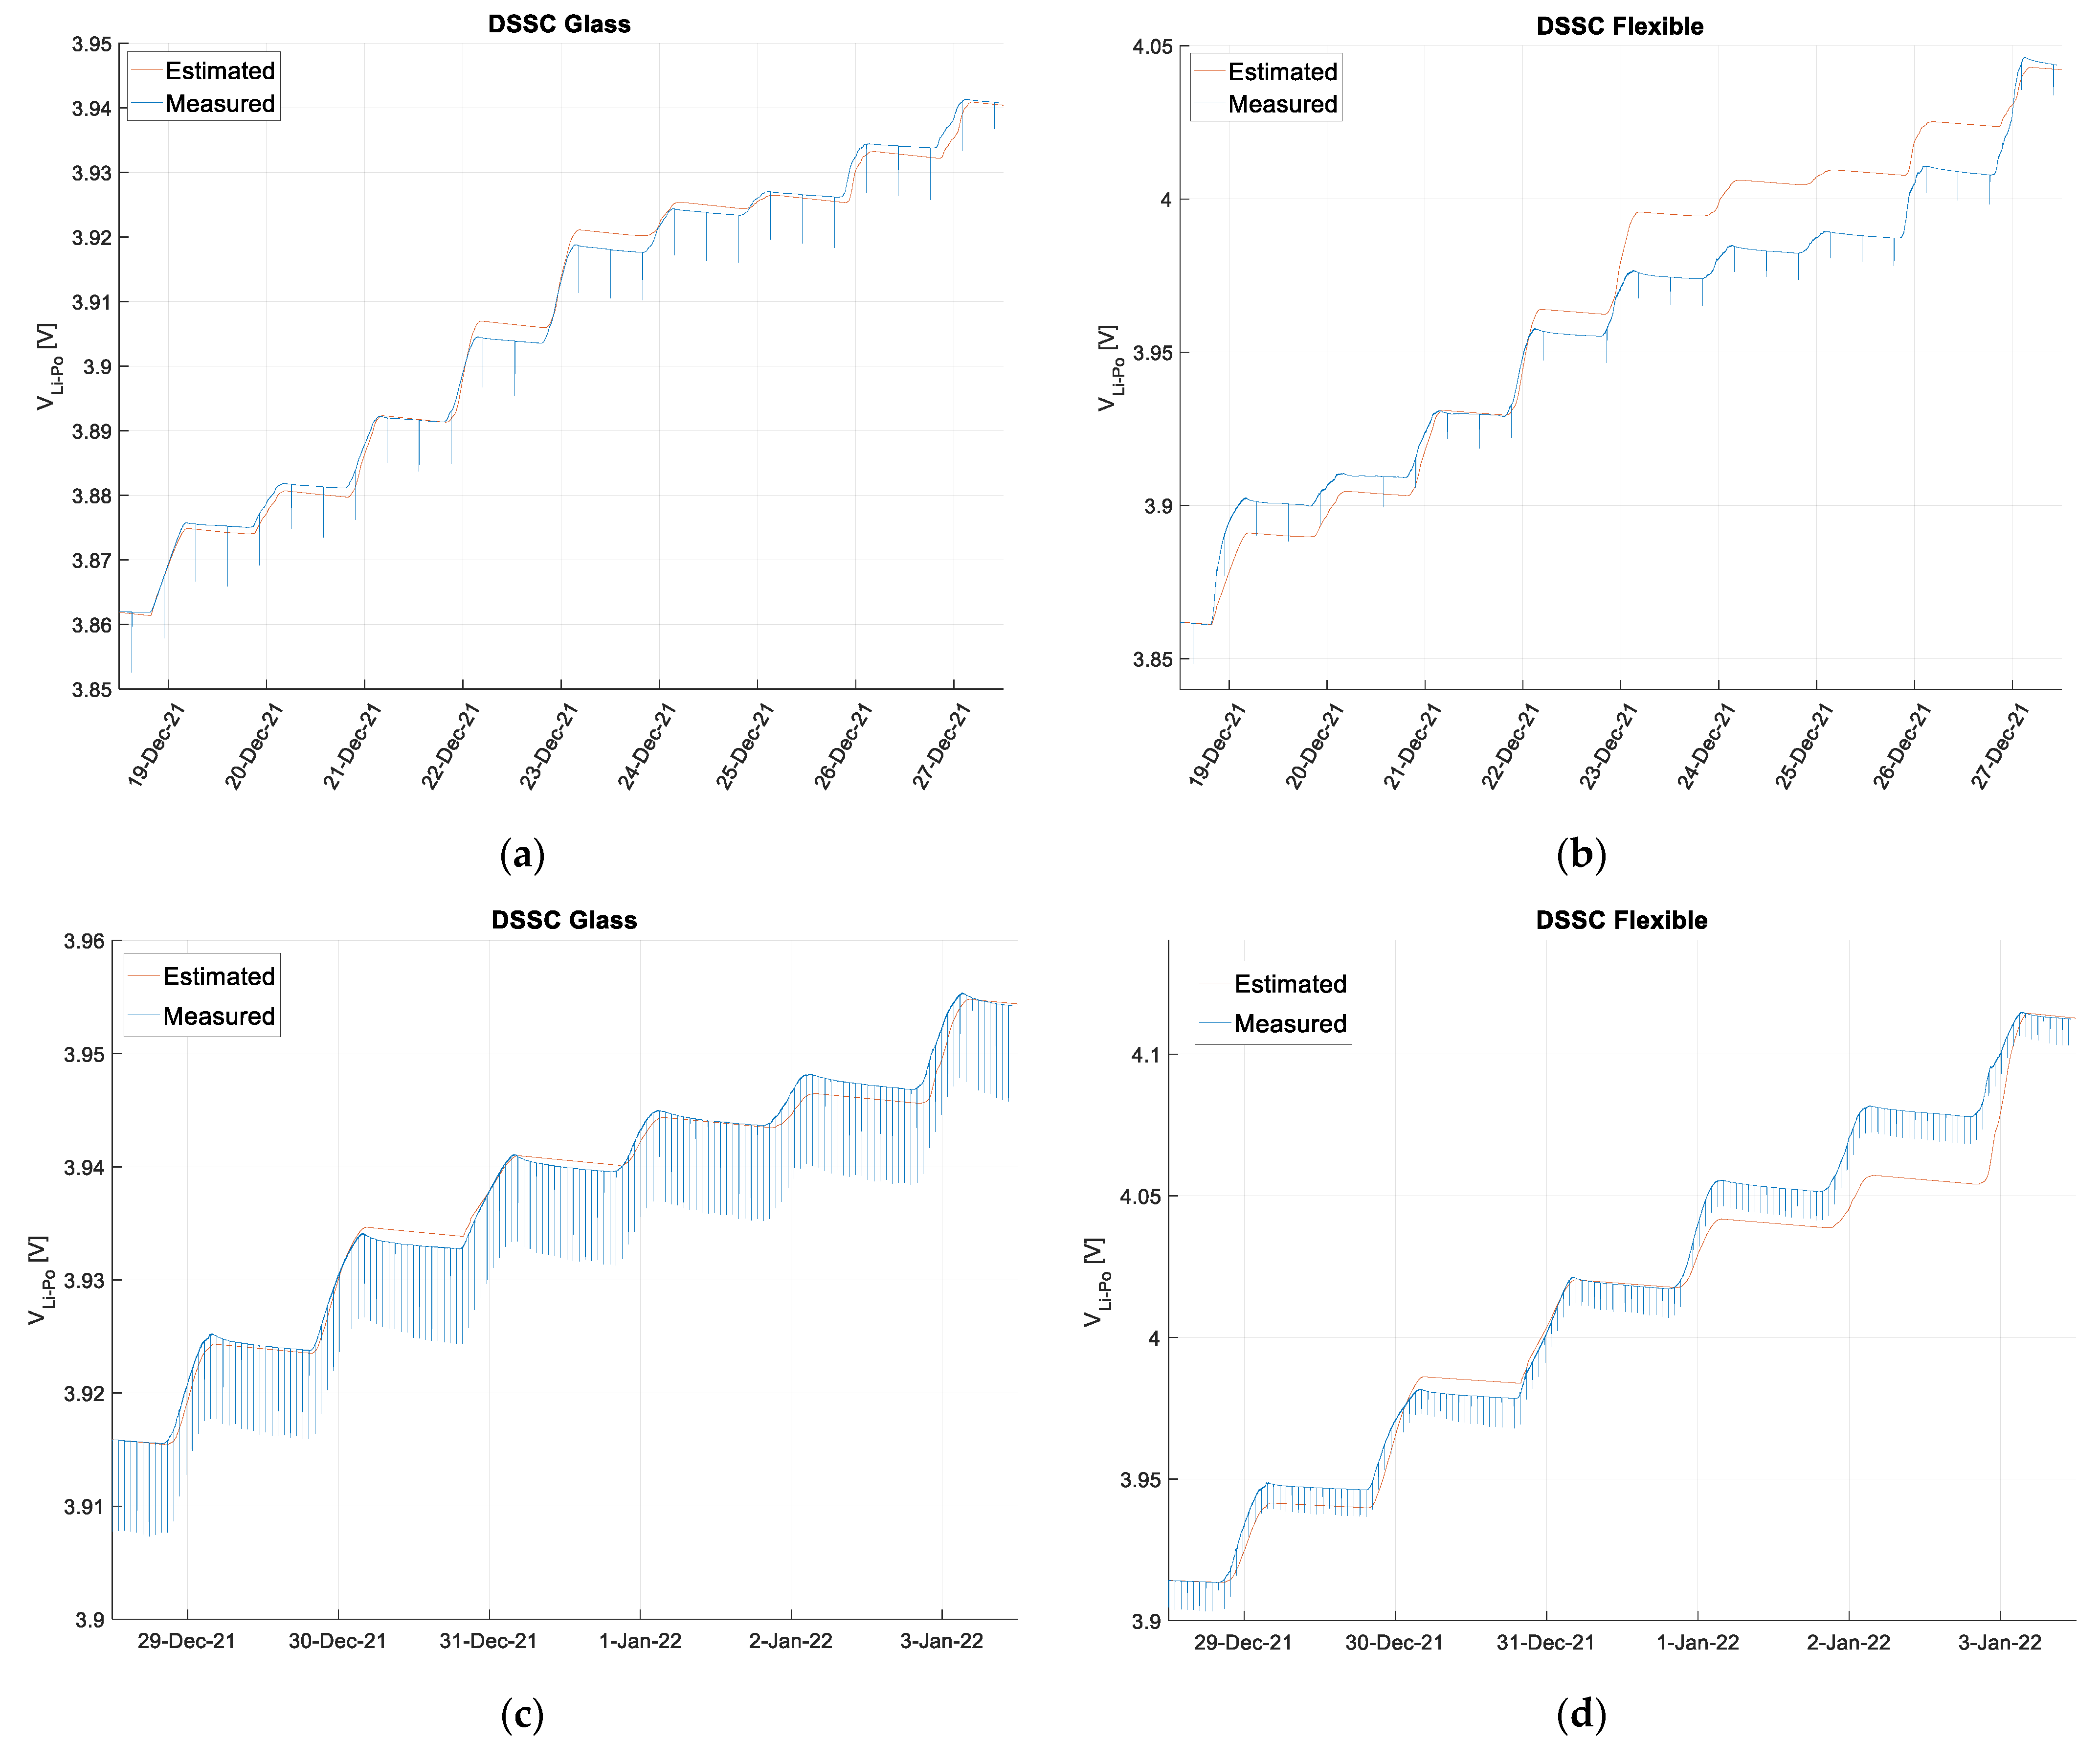
Finally, Figure 8 shows a comparison between the measured battery voltages and the same quantities predicted by exploiting the measured diffuse light intensity and the data obtained from the solar cell characterization (again, the y-axis scales for the four graphs are different to take into account the different charging capabilities of the two DSSCs). In more detail, the measured radiation intensity was converted into the current generated by the photovoltaic panels by exploiting the linear conversion factor corresponding to the slope of the curve shown in Figure 5c and by considering the area of each PV module. Then, the charge delivered to the battery was obtained by calculating the integral over time of the current net of the consumption of the node. Finally, starting from the computed charge, the corresponding voltage trend was derived by using the linear approximation of a typical charge vs. a voltage characteristic for a Li-Po battery in that particular range as a reference.
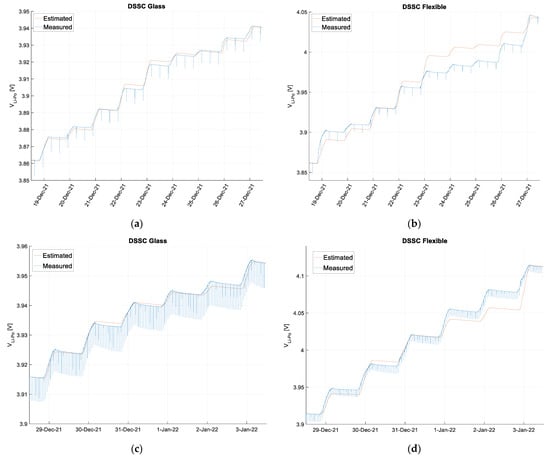
Figure 8.
Acquired Li-Po battery voltages of glass DSSC and flexible DSSC (blue plots) as well as battery voltages derived by calculating the charge delivered to the systems (red plots) during the first test campaign ((a,b), respectively) and the second test campaign ((c,d), respectively), starting from diffuse radiation intensity of Figure 7b,d.
7. Discussion
The plots of Figure 6 show that a positive balance between battery charging and discharging was achieved with both types of cells and during both tests, even in presence of more frequent radio transmissions. In more detail, the increasing segments correspond to the charging of the batteries occurring when solar light was detected by the pyranometer, while the decreasing parts correspond to the dark hours. The equally spaced vertical lines determining a lowering of the Li-Po voltage level are the absorption peaks caused by the radio transmissions. Their lengths are different due to the different scales of the y-axis. In both test campaigns, a much higher charge was reached in the case of the flexible DSSC, as highlighted in Table 2. This was expected due to the larger active area of the module.
The plots of Figure 7a,c are the voltages at the input of the BMS during the two tests, which were V during the dark hours and increased with the natural logarithm of the irradiance according to Equation (4). The spikes correspond to the moments (approximately every 16 s) when the BQ25570 chip performed the MPPT algorithm, based on 256-ms typical long disconnections of the charger, in order to perform Voc sampling, thus obtaining a new reference voltage as a fraction of the sampled Voc.
The results of Figure 7b,d show the correlation between the diffuse intensity measured by the pyranometer (in blue) and the global outdoor solar irradiation (in red) given by a local weather broadcast. The reduction factor between the external and diffuse radiation hitting the cells caused them to start harvesting energy with a delay with respect to the appearance of sunlight and to stop earlier when there was still sunlight outside. It is possible to notice the different behavior of the intensity and, consequently, of the during sunny days (i.e., 19 December 2021, 30 December 2021 and 31 December 2021) compared with those in which the sky was cloudy. In the first case, the operating voltages were smooth, following the sun radiation and not showing the continuous ups and downs due to clouds. The peaks measured in the diffuse intensity of 19 December 2021 and 31 December 2021 were probably due to the fact that at dawn, the cells were hit directly by the sun, as they were oriented toward the northeastern direction.
Concerning Figure 8, we can observe, in general, a good match between the measured and predicted Li-Po voltages, assuming that the estimated values must be considered to be an approximation of the real behavior of the battery, thus providing a qualitative rather than quantitative trend. In fact, the charge vs. voltage relationship of the battery was approximated with a typical Li-Po characteristic that may differ from the real one. Moreover, in real deployment, there are many factors that can influence the battery charging process, such as temperature variations and the non-perfect alignment between the pyranometer and the cells, which can lead to a difference between the measured intensity and the one actually hitting the cells. Furthermore, at low light intensities, the measurement uncertainty of the pyranometer, which provided the input for the derivation of predicted data, increases. Concerning the slightly worse correspondence for the flexible module, this could be due to the fact that the battery underwent a greater net voltage variation with respect to the glass module, thus working in a larger range where the linear approximation of the charge vs. voltage characteristic was eventually less accurate.
However, although some mismatches could be observed in the voltage trends shown in Figure 8, the predicted data satisfactorily approximate the measured ones. This proves that the nodes operated in a proper way, harvesting the sun’s energy with a trend close to the predicted one in every tested condition. Furthermore, this finding points out that the design of an efficient node embedding DSSCs is not a critical issue. In fact, even if the MPPT method implemented by the commercial BQ25570 chip was not optimized for the selected cell technology, the nodes also operated correctly in the considered conditions of very low-intensity diffuse solar lighting.
In conclusion, even if the lighting conditions used for the laboratory tests approached the actual operating conditions of a shady outdoor environment, as demonstrated in Figure 4c, they allowed the nodes to operate correctly, proving that the node could work properly under diffuse solar radiation in the absence of a direct sunlight component.
Furthermore, let us point out that our test conditions may be considered a worst-case scenario, being carried out at the turn of the December solstice, the period of the year when the lighting conditions are more unfavorable since the sun’s elevation is minimized, causing low light intensity and reduced hours of lighting. In addition, certain weather conditions occurred during the tests, characterized by cloudy skies, rain and fog, created a further disadvantage for the charge of the node battery. Nonetheless, the positive balance of the battery charge measured in these tests allowed us to affirm with a high degree of confidence that the system would work in all the conditions of external radiation.
Despite adverse weather and lighting conditions, the net positive charge was achieved for both of the tested transmission frequencies with a non-negligible safety margin. Even in the case of hourly transmissions, which represent a more than reasonable set-up in most sensor network monitoring applications, the node can operate autonomously. Since the light source was not constant, it was not possible to establish a priori the maximum achievable transmission frequency. However, the results presented here suggest using an hourly transmission rate as a starting point. This rate can then be adapted, depending on the requirements and the power consumption of the node. Indeed, the addition of more energy-consuming sensors such as sensors for gas monitoring based on optical techniques could force reduced transmission rates in the case of low light intensity.
8. Conclusions
This paper proves the feasibility of an energy harvesting system for autonomous wireless sensor nodes exploiting DSSC modules of small active areas (i.e., 7.14 × 4 and 19 × 11 ) under diffuse sunlight conditions.
The designed system exploits the LoRaWAN radio transmission protocol, which is well-suited for deploying energy self-sufficient distributed monitoring systems based on energy harvesting and satisfying low power consumption and long transmission range requirements. A nano-power boost charger buck converter integrated circuit is exploited for energy management. This device is in charge of extracting power from the diffuse light, making it available for the node operations.
Two DSSC modules, a flexible and a glass thin-film prototype, were first characterized under diffuse solar light. Then, they were used to supply two sensor nodes, transmitting data every 8 h during the first test and every hour during the second one. By monitoring the charge/discharge trend of the Li-Po battery employed as a power reserve, the self-sufficiency of the nodes was proven in all the circumstances, even in case of hourly transmissions, a good transmission rate for several monitoring applications. Moreover, our work shows that, depending on the specific requirements and the available light intensity, this rate could be further increased, thus satisfying the needs of quasi-real-time monitoring applications.
The adverse lighting and weather conditions experienced during the tests represent a worst-case scenario which ensures that the system can work during the whole year and in all the weather conditions in the considered latitude. This makes the proposed sensor node a valid solution for energy-autonomous monitoring in outdoor scenarios characterized by low irradiation and diffuse sunlight, such as in the proximity of tall buildings, among trees in a forest and during winter days.
The greatest strength of the proposed system lies in the cells, as their reduced size (smaller than an A4 sheet of paper) makes them extremely versatile, and the flexible module adapts easily to different types of surfaces.
The energy harvesting architecture that proved to be effective in this work can be foreseen as a baseline for further improvements by implementing customized Li-Po battery charging systems tailored to specific applications. Moreover, to further consolidate our results, field tests may be carried out in the future to demonstrate the self-sufficiency of the node in a real outdoor deployment.
Author Contributions
Conceptualization, M.B. and A.F.; methodology, M.B., A.F. and A.P.; software, I.C. and M.B.; validation, M.B. and I.C.; formal analysis, M.B.; investigation, I.C. and A.P.; resources, V.V.; writing—original draft preparation, M.B., I.C. and A.P.; writing—review and editing, M.B., A.F., I.C. and A.P.; supervision, M.B., A.F. and A.P.; project administration, M.B. and V.V.; funding acquisition, M.B. All authors have read and agreed to the published version of the manuscript.
Funding
This research was funded by Fondazione Cassa di Risparmio di Firenze FCRF, grant number 45597 2020.1606 (Sviluppo di moduli Fotovoltaici IN-Door per tracking di asset con reti wireless in IoT: FIND-IT).
Institutional Review Board Statement
Not applicable.
Informed Consent Statement
Not applicable.
Data Availability Statement
Not applicable.
Conflicts of Interest
The authors declare no conflict of interest.
References
- O’Regan, B.; Graetzel, M. A low-cost, high-efficiency Solar cell based on dyesensitized colloidal TiO2 films. Nature 1991, 353, 737–740. [Google Scholar] [CrossRef]
- Barber, G.D.; Hoertz, P.G.; Lee, S.-H.A.; Abrams, N.M.; Mikulca, J.; Mallouk, T.E.; Liska, P.; Zakeeruddin, S.M.; Grätzel, M.; Ho-Baillie, A.; et al. Utilization of direct and diffuse Sun light in a dye-sensitized Solar cell—Silicon photovoltaic hybrid concentrator system. J. Phys. Chem. Lett. 2011, 2, 581–585. [Google Scholar] [CrossRef]
- Hora, C.; Santos, F.; Sales, M.G.F.; Ivanou, D.; Mendes, A. Dye-Sensitized Solar Cells for Efficient Solar and Artificial Light Conversion. ACS Sustain. Chem. Eng. 2019, 7, 13464–13470. [Google Scholar] [CrossRef]
- Peruzzi, G.; Pozzebon, A. A Review of Energy Harvesting Techniques for Low Power Wide Area Networks (LPWANs). Energies 2020, 13, 3433. [Google Scholar] [CrossRef]
- Cappelli, I.; Parrino, S.; Pozzebon, A.; Salta, A. Providing Energy Self-Sufficiency to LoRaWAN Nodes by Means of Thermo-electric Generators (TEGs)-Based Energy Harvesting. Energies 2021, 14, 7322. [Google Scholar] [CrossRef]
- Farhangdoust, S.; Mederos, C.; Farkiani, B.; Mehrabi, A.; Taheri, H.; Younesian, D. A Creative Vibration Energy Harvesting System to Support a Self-Powered Internet of Thing (IoT) Network in Smart Bridge Monitoring. In Proceedings of the ASME International Mechanical Engineering Congress and Exposition, Virtual Conference, 16–19 November 2020; Volume 84492, p. V02BT02A041. [Google Scholar]
- Muncuk, U.; Alemdar, K.; Sarode, J.D.; Chowdhury, K.R. Multiband ambient RF energy harvesting circuit design for enabling batteryless sensors and IoT. IEEE Internet Things J. 2018, 5, 2700–2714. [Google Scholar] [CrossRef]
- Mecocci, A.; Peruzzi, G.; Pozzebon, A.; Vaccarella, P. Architecture of a hydroelectrically powered wireless sensor node for underground environmental monitoring. IET Wirel. Sens. Syst. 2017, 7, 123–129. [Google Scholar] [CrossRef]
- De la Rosa, E.O.; Castillo, J.V.; Campos, M.C.; Pool, G.R.B.; Nuñez, G.B.; Atoche, A.C.; Aguilar, J.O. Plant microbial fuel cells–based energy harvester system for self-powered IoT applications. Sensors 2019, 19, 1378. [Google Scholar] [CrossRef] [Green Version]
- Gakkestad, J.; Hanssen, L. Powering Wireless Sensor Networks Nodes in Northern Europe Using Solar Cell Panel for Energy Harvesting. In Proceedings of the 2011 4th IFIP International Conference on New Technologies, Mobility and Security, Paris, France, 7–10 February 2011; pp. 1–5. [Google Scholar]
- Addabbo, T.; Fort, A.; Intravaia, M.; Mugnaini, M.; Parri, L.; Pozzebon, A.; Vignoli, V. Solar energy harvesting for Lo-RaWAN-based pervasive environmental monitoring. ACTA IMEKO 2021, 10, 111–118. [Google Scholar] [CrossRef]
- Hande, A.; Polk, T.; Walker, W.; Bhatia, D. Indoor solar energy harvesting for sensor network router nodes. Microprocess. Microsyst. 2007, 31, 420–432. [Google Scholar] [CrossRef]
- Yang, C.; Xue, R.; Li, X.; Zhang, X.; Wu, Z. Power performance of solar energy harvesting system under typical indoor light sources. Renew. Energy 2020, 161, 836–845. [Google Scholar] [CrossRef]
- Bruzzi, M.; Cappelli, I.; Fort, A.; Pozzebon, A.; Tani, M.; Vignoli, V. Polycrystalline silicon photovoltaic harvesting for indoor IoT systems under red- far red artificial light. In Proceedings of the 2021 IEEE Sensors Applications Symposium (SAS), Sundsvall, Sweden, 23–25 August 2021; pp. 1–6. [Google Scholar]
- Saeed, M.A.; Kang, H.C.; Yoo, K.; Asiam, F.K.; Lee, J.-J.; Shim, J.W. Cosensitization of metal-based dyes for high-performance dye-sensitized photovoltaics under ambient lighting conditions. Dye. Pigment. 2021, 194, 109624. [Google Scholar] [CrossRef]
- Pecunia, V.; Occhipinti, L.G.; Hoye, R.L. Emerging Indoor Photovoltaic Technologies for Sustainable Internet of Things. Adv. Energy Mater. 2021, 11, 2100698. [Google Scholar] [CrossRef]
- Poulose, P.; Sreejaya, P. Indoor Light Harvesting Using Dye Sensitized Solar Cell. In Proceedings of the 2018 International CET Conference on Control, Communication, and Computing (IC4), Thiruvananthapuram, India, 5–7 July 2018; pp. 152–156. [Google Scholar]
- Saeed, M.A.; Yoo, K.; Kang, H.C.; Shim, J.W.; Lee, J.J. Recent developments in dye-sensitized photovoltaic cells under ambient illumination. Dye. Pigment. 2021, 194, 109626. [Google Scholar] [CrossRef]
- Devadiga, D.; Selvakumar, M.; Shetty, P.; Santosh, M.S. Dye-Sensitized Solar Cell for Indoor Applications: A Mini-Review. J. Electron. Mater. 2021, 50, 3187–3206. [Google Scholar] [CrossRef]
- Rasheduzzaman, M.; Pillai, P.B.; Mendoza, A.N.C.; De Souza, M.M. A study of the performance of solar cells for indoor autonomous wireless sensors. In Proceedings of the 2016 10th International Symposium on Communication Systems, Networks and Digital Signal Processing (CSNDSP), Prague, Czech Republic, 20–22 July 2016; pp. 1–6. [Google Scholar]
- Aslam, A.; Mehmood, U.; Arshad, M.H.; Ishfaq, A.; Zaheer, J.; Khan, A.U.H.; Sufyan, M. Dye-sensitized solar cells (DSSCs) as a potential photovoltaic technology for the self-powered internet of things (IoTs) applications. Sol. Energy 2020, 207, 874–892. [Google Scholar] [CrossRef]
- Yamamoto, K.; Okada, K.; Nakayama, M.; Taguchi, T.; Kaneeda, K.; Hayashi, H.; Kito, H. Wireless environmental sensor node using energy harvesting technology. Fujikura Tech. Rev. 2015, 45, 6–10. Available online: https://www.fujikura.co.jp/eng/rd/gihou/backnumber/pages/__icsFiles/afieldfile/2016/02/18/45e_02.pdf (accessed on 17 January 2022).
- Wu, C.-C.; Chuang, W.-Y.; Wu, C.-D.; Su, Y.-C.; Huang, Y.-Y.; Huang, Y.-J.; Peng, S.-Y.; Yu, S.-A.; Lin, C.-T.; Lu, S.-S. A Self-Sustained Wireless Multi-Sensor Platform Integrated with Printable Organic Sensors for Indoor Environmental Monitoring. Sensors 2017, 17, 715. [Google Scholar] [CrossRef] [Green Version]
- Yang, C.C.; Pandey, R.; Tu, T.Y.; Cheng, Y.P.; Chao, P.C.P. An efficient energy harvesting circuit for batteryless IoT devices. Microsyst. Technol. 2020, 26, 195–207. [Google Scholar] [CrossRef]
- Michaels, H.; Rinderle, M.; Freitag, R.; Benesperi, I.; Edvinsson, T.; Socher, R.; Gagliardi, A.; Freitag, M. Dye-sensitized solar cells under ambient light powering machine learning: Towards autonomous smart sensors for the internet of things. Chem. Sci. 2020, 11, 2895–2906. [Google Scholar] [CrossRef] [Green Version]
- Gcell. Available online: https://gcell.com/gcell-products/indoor-solar-cells (accessed on 17 January 2022).
- Fujikura. Available online: https://www.fujikura.co.uk/products/energy-and-environment/dye-sensitized-solar-cell/ (accessed on 2 January 2022).
- Gueymard, A.C. The SMARTS spectral irradiance model after 25 years: New developments and validation of reference spectra. Sol. Energy 2019, 187, 233–253. [Google Scholar] [CrossRef]
- Muneer, T.; Gueymard, C.; Kambezidis, H. Solar Radiation and Daylight Models; Elsevier Butterworth-Heinemann: Oxford, UK, 2004. [Google Scholar]
- Bardizza, G.; Pavanello, D.; Müllejans, H.; Sample, T. Spectral responsivity measurements of DSSC devices at low chopping frequency (1 Hz). Prog. Photovoltaics Res. Appl. 2016, 24, 428–435. [Google Scholar] [CrossRef] [Green Version]
- McEvoy, A.; Markvart, T.; Castañer, L. Practical Handbook of Photovoltaics Fundamentals and Applications; Elsevier: Amsterdam, The Netherlands, 2012. [Google Scholar]
- Atmel Corporation, ATtiny 24/44/84 Datasheet. Available online: http://ww1.microchip.com/downloads/en/devicedoc/Atmel-7701_Automotive-Microcontrollers-ATtiny24-44-84_Datasheet.pdf (accessed on 17 January 2022).
- Texas Instruments, bq25570 Nano Power Boost Charger and Buck Converter for Energy Harvester Powered Applications Datasheet. Available online: https://www.ti.com/lit/ds/symlink/bq25570.pdf (accessed on 17 January 2022).
- Microchip, MCP9700/9700A,MCP9701/9701A Low-Power Linear Active Thermistor ICs Datasheet. Available online: http://ww1.microchip.com/downloads/en/devicedoc/20001942g.pdf (accessed on 17 January 2022).
- Lombardo, A.; Parrino, S.; Peruzzi, G.; Pozzebon, A. LoRaWAN vs. NB-IoT: Transmission Performance Analysis within Critical Environments. IEEE Internet Things J. 2021, 9, 1068–1081. [Google Scholar] [CrossRef]
- Wunderground. Available online: https://www.wunderground.com/weather/it/siena/ISIENA36 (accessed on 17 January 2022).


Publisher’s Note: MDPI stays neutral with regard to jurisdictional claims in published maps and institutional affiliations. |
© 2022 by the authors. Licensee MDPI, Basel, Switzerland. This article is an open access article distributed under the terms and conditions of the Creative Commons Attribution (CC BY) license (https://creativecommons.org/licenses/by/4.0/).