Article

City-Level Transition to Low-Carbon Economy

by
Alfredo Višković
1,2,
Vladimir Franki
1,2,* and
Angela Bašić-Šiško
1
1
Faculty of Engineering Rijeka, University of Rijeka, Vukovarska 58, 51 000 Rijeka, Croatia
2
Energy Platform Living Lab, Unska 3, 10 000 Zagreb, Croatia
*
Author to whom correspondence should be addressed.
Energies 2022, 15(5), 1737; https://doi.org/10.3390/en15051737
Submission received: 10 January 2022 / Revised: 9 February 2022 / Accepted: 17 February 2022 / Published: 25 February 2022
(This article belongs to the Special Issue Successful Deployment of Renewable Energies)

Abstract

:
In recent years climate change has emerged as a global issue directly related to quality of life. In this context, one of the key goals in the next few decades will be to transition the global economy to a sustainable system. The nature of the energy planning process dictates the application of complex models. There is no universal solution to the energy planning problem. Each territory requires a bespoke strategy aimed at utilising its specific potential. The research presented in this paper explores reaching a zero-carbon energy system at the city level. It establishes a step-by-step decarbonisation method and proposes an energy transition index (ETI). The index presented is used to evaluate different renewable energy sources (RES) deployment scenarios in the context of affordability, self-reliance, and sustainability. The main aspects and barriers of deploying sustainable energy solutions are also explored. Some of the key challenges of RES deployment are identified as capital intensity, output variability, and the regulatory framework. The approach applied in the paper focuses on a city-level strategy in line with the goal of satisfying demand through local energy sources. The presented analysis offers two basic conclusions: (1) each territory requires a bespoke strategy that can optimally utilise its energy potential and (2) building a local zero-carbon system can be feasible only by implementing energy storage technologies.

1. Introduction

During the past few decades, a number of long-held tenets regarding the energy sector have been rewritten. Climate change emerged as a global issue directly related to the quality of life [1]. The realisation of the negative environmental impact of power generation has been causing a stir among energy companies and policymakers worldwide [2]. Apart from the well-known issue of global warming, the utilisation of energy sources is raising concerns related to issues such as water depletion, deforestation, biodiversity loss, etc. [3]. During the next few decades, one of the key goals will be to transition the global economy to a sustainable system [4]. In this context, sustainability is directly linked to reducing the use of fossil fuels and decreasing CO2 emissions. The deployment of renewable energy sources (RES) is seen by many as a crucial solution to the energy and environmental problems that the world is facing [5]. As a result, there has been a proliferation of new technological solutions, business innovations, and policies aimed at decarbonising the power sector [6]. Governments worldwide set ambitious emission reduction goals and instated policies aimed at incentivising the implementation of RES [7]. Several countries are already planning to reach 100% renewable energy systems in the near future (such as Sweden [8] and Denmark [9]), while some practically already have zero-carbon energy systems (Iceland [10] and Norway [11]).
Another important point of research interest is learning how to combine different technological options and policy instruments to overcome barriers towards reaching a zero-carbon energy system of the future [12]. The emergence of new technologies, distributed energy sources (DER), prosumers, and digitally-enabled solutions complicates the delicate balance of the energy ecosystem [13]. Complexities of modern power systems call for the application of multidisciplinary approaches in solving the energy equation [14]. Modern energy strategies have to consider a whole string of disparate factors when assessing optimal development pathways [15]. A multi-disciplinary approach is now a prerequisite in forming energy-related action plans. The nature of the energy planning process dictates the application of complex models. There is no universal solution to the energy planning problem. Each territory requires a bespoke strategy aimed at utilising its specific potential. Observing literature available on 100% renewable energy systems, there are a few gaps that this paper tries to cover. First, while there are a number of papers that explore reaching zero-carbon systems, only a portion of them focus on the city/municipal levels [16]. Second, there is no established step-by-step method that can be applied to different local settings during the process of building a zero-carbon system. Third, there is no established method that evaluates different decarbonisation pathways. In addition to contributing to these three issues, the paper explores key aspects and barriers of deploying sustainable energy solutions in reaching the ultimate goal of having a zero-carbon energy system of the future. The approach applied in the paper focuses on a city-level strategy in line with the goal of satisfying demand through local energy sources.
In line with the EU’s energy policy, the UN’s Sustainable Energy Goals [17], and numerous research papers, this paper explores the feasibility of building a zero-carbon energy system by implementing distributed energy sources. It is worth noting that, while decentralisation of energy sources is key to decarbonisation, not every urban area needs to be 100% energy sustainable. The research presented in this paper aims to establish a bottom-up approach to the urban energy planning process. In addition, we build upon previously published research and present a bespoke, multi-criteria decision support system (DSS) that evaluates decarbonisation pathways. However, a number of cities will not be able to reach a completely sustainable and self-reliant energy system. The aim of the presented DSS is, therefore, to determine what would be the optimal mix with regard to local constraints and in line with selected parameters. The indicators used in the model are based on (1) the EU’s energy policy goals that require energy to be affordable, reliable, and sustainable and (2) previously established methods (outlined in the following paragraph).
The paper is organised as follows. Section 2 offers a literature review. It focuses on two key areas: (1) studies on achieving a 100% renewable energy system and (2) research in the field of multi-criteria decision support systems (DSSs). Section 3 outlines the main aspects of the probabilistic model used to build and evaluate energy development scenarios. The applied evaluation method is based on the contemporary understanding of the energy supply chain as defined by available literature and the EU energy policy. Section 4 introduces the paper’s case study—a town in Croatia for which a 100% renewable, zero-emission system is built. Section 5 presents and evaluates development scenarios. Section 6 offers a discussion on results and the main barriers to the successful implementation of the envisioned renewable system. Section 6 offers a final conclusion of the research.

2. Literature Review

Deployment of renewables has been accompanied by a strong researcher presence. Most studies focus on various CO2 abatement technologies or policies [18]. In this context, emissions have been studied regarding the transport sector (with a focus on vehicles [19], ships [20], and planes [21]), the building [22] and construction [23] sector (exploring urban energy systems [24] and central heating systems [25]) and a number of industries (i.e., cement [26], steel [27], and aluminium [28]). Carbon emissions are also an important topic in the power industry where papers focus on different aspects of energy policy such as carbon taxation [29], RES incentives [30], and innovation support [31]. Apart from the well-established topics of wind [32] and solar [33] power plants, a lot of research has also been directed towards exploring the implementation of other low-carbon energy sources such as biomass [34], biogas [35], municipal solid waste [36], and geothermal energy [37]. Implementing solar-based solutions is an important segment of any low-carbon transition. As such, the topic of solar technologies is heavily researched. In this context, recent papers explore solar thermal technology [38], solar desiccant cooling systems [39], solar hybrid systems [40], and photovoltaic technologies [41]. A different path is exploring the implementation of carbon capture and storage (CCS) systems into new [42] or existing thermal power plants [43]. In addition to the aforementioned topics, research papers investigated the potential of energy efficiency [44], smart grids [45], demand response [46], digitalisation [47], artificial intelligence [48], and electrification [49] in aiding decarbonisation efforts.
Contemporary discussion regarding the energy sector is unimaginable without considering numerous external aspects of energy markets. In this context, energy security is oftentimes used in academic and political arenas as an umbrella term defining the overall quality of the energy supply [50]. Although the concept of energy security existed from the beginnings of the energy sector, it became a policy issue in the early part of the 20th century when the United Kingdom decided to replace coal with oil as the main fuel of the Royal Navy [51]. Historically, the concept periodically received more attention during oil crises, until it grew in importance during the 2000s [52]. Today, energy security is an integral part of any development strategy and/or energy policy across the globe [53]. It also became ubiquitous to contemporary discussion regarding energy-related issues and climate change [54]. Despite its importance, there is no universal method that would be used to quantify energy security aspects [55]. There are numerous definitions, methods, and indicators used when assessing energy security [56,57,58]. The concept is explored using different approaches such as modern portfolio theory [59] and various bespoke models [60]. The three pillars of the EU’s energy policy are affordability, sustainability, and reliability [61,62]. They define the conditions that any energy system needs to accomplish to successfully operate. In other words, energy supply needs to provide a low-cost, reliable source of energy without causing a degradational effect on the surrounding environment. This is why reaching a 100% renewable energy system is a difficult task [63]. It is not efficient to simply invest in a certain renewable technology, as it might raise costs and reduce the system’s reliability. It is necessary to carefully select a set of technologies that best suit a given territory. These technologies must also aim to facilitate the transformation of existing linear models into circular [64].
There is a considerable amount of research regarding the transition to completely renewable energy systems. Different approaches such as modern portfolio theory [65] or Markowitz’s mean-variance approach [66] have been used to devise an optimal sustainable development path. Some papers focus on policy issues of renewable energy deployment [67], while others look into key challenges [68] or barriers [69] standing in the way of the energy transition. In the meantime, the power sector is undergoing a radical transition towards a sustainable, zero-carbon future. New approaches in solving the energy equation are resulting in dramatic structural changes of the energy supply chain that also have a profound effect on the business landscapes of the sector [70]. The surge of distributed energy sources increases pressure on the distribution grid, while variable RES emphasise the importance of having reserve power for providing grid stability. The power system is a behemoth consisting of countless components that all have to work in perfect harmony to provide energy in real time, all the time. Thus, the problem of intermittency of variable RES has become a heavily researched topic [71]. Battery systems are seen as a prerequisite in achieving high levels of RES penetration [72]. Achieving a zero-carbon energy system will be an arduous task that will require combining bespoke approaches and policies, and implementing numerous technological solutions. This transition will not be possible without a profound understanding of the dynamics underpinning energy markets.
In line with the process of decentralisation, there has been a number of research papers investigating pathways of low-carbon transitions at urban and/or municipal levels [73]. Cities are to play a key role in reducing greenhouse gas (GHG) emissions [74]. This is why it is imperative that they implement strategies that can facilitate their low-carbon transition [75]. City-level transition is oftentimes observed through the scope of circular economy [76]. Different analyses offer different approaches to the energy planning problem [77]. Some papers focus on improving transitional management [78] and urban governance [79]. Others explore the importance of policy innovation on low carbon development [80]. There are papers that propose novel approaches, such as the “multi-objective land use allocation optimisation model” [81] or that evaluate the performance of cities’ low-carbon development [82]. However, while there are papers that investigate low-carbon transitions at the urban level, there is a lack of research on creating bottom-up approaches that consider the entire energy system of a city. Most papers focus on a certain aspect such as central heating [83], transport [84], or buildings [85], without creating a unified approach in dealing with the entire emission inventory of a city.
Policymakers and businesses across the world are faced with making decisions in conditions of uncertainty almost on a daily basis [86]. As the complexities of modern power grids increase, so does the need for the utilization of robust optimisation methods [87]. Energy models must consider a string of parameters, which makes it difficult to develop generalised and tractable robust formulations [88]. This is why multi-criteria decision support systems (DSSs) will play a crucial role during the planning process. DSSs are an acknowledged research area with a long history [89]. As the power sector is evolving, DSSs need to be further improved to match today’s needs. The methods behind them generally consist of four phases: determining key indicators, gathering input, calculation (optimization), and interpretation of results. Due to their complexity, most DSSs are designed for a very specific area of interest. In recent years, DSSs have been used in exploring the design aspects of green hydrogen [90] and selecting sites for solar [91] and biomass power plants [92]. DSS-aided multi-objective methods are utilized in designing central heating plants [93] and in improving buildings’ environmental performance [94]. Taking it a step further, DSSs are used to investigate the net zero-energy district (NZED) concept [95] and the implementation of clean energy initiatives at the neighbourhood level [96] and the city/municipal levels [97]. The integration of RES is explored [98], as well as the evaluation of hybrid renewable energy systems (HRESs) [99]. DSSs are also a popular topic in the field of energy policy [100,101] and development strategies [102].

3. Method

As already outlined, the research in this paper aims to establish a step-by-step method to determine the optimal transition to a zero-carbon urban energy system. For this reason, a probabilistic model for decision-making based on a multi-criteria approach is developed [102]. Decarbonisation pathways are evaluated by monitoring several key indicators. Building upon previous work in the field, the research method is based on five distinct phases: (1) determining key indicators of the energy transition index (ETI), (2) building a detailed database of the case study area, (3) determining viable development scenarios, (4) conducting a market analysis (consisting of a software optimisation and a sensitivity analysis), and (5) interpreting results and devising appropriate recommendations.

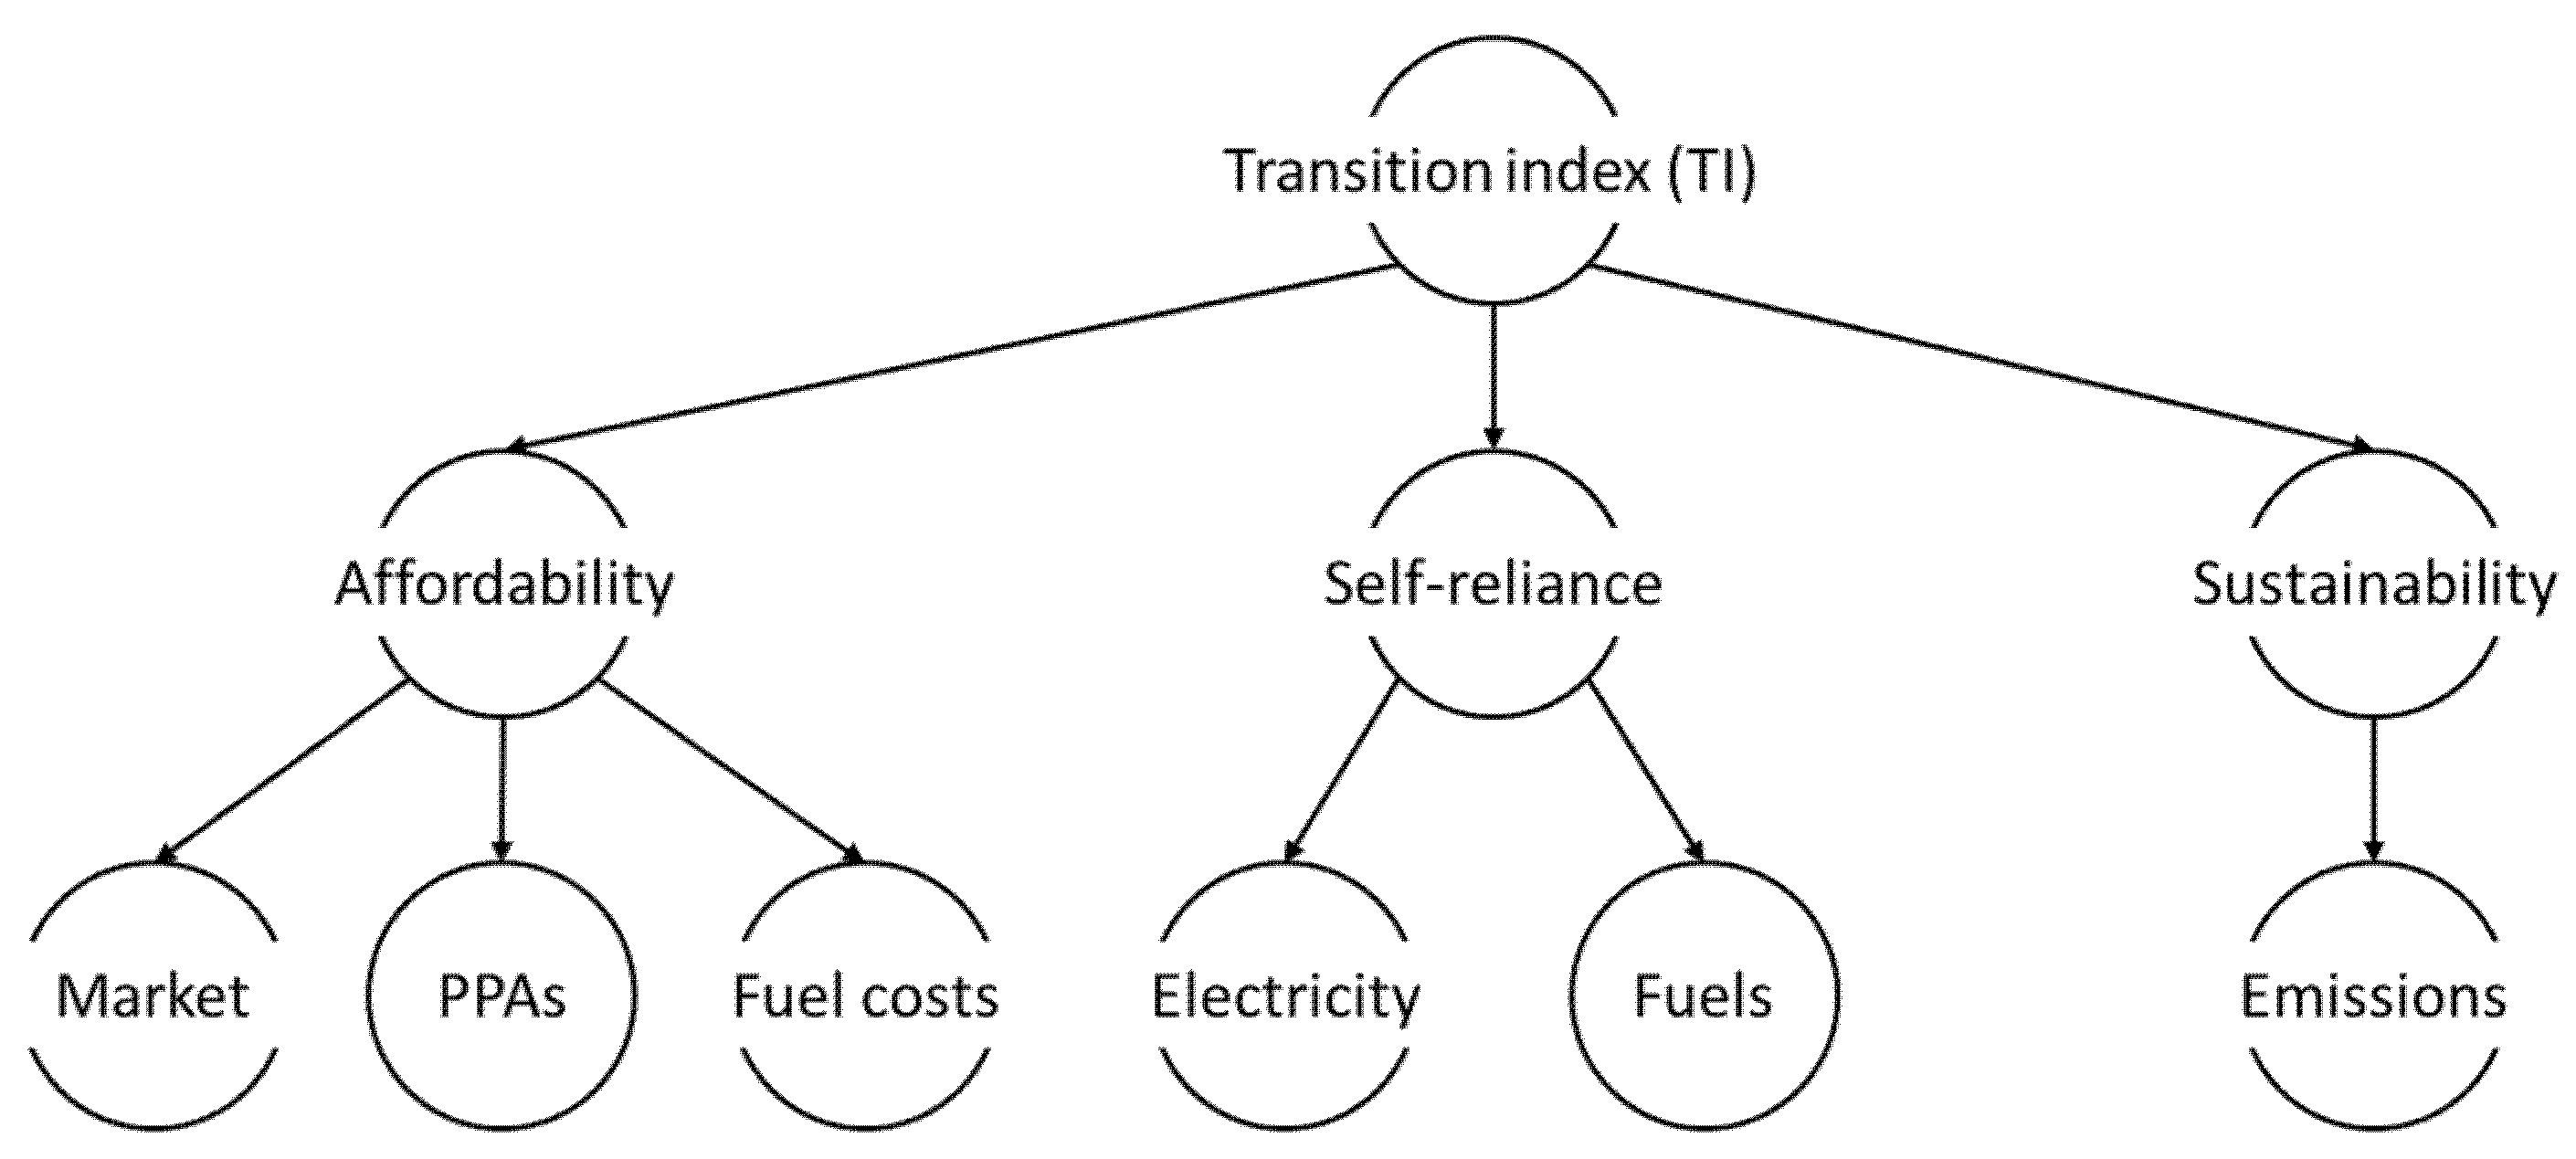
3.1. Evaluation Index

According to the European Commission and the European energy policy, energy supply should be affordable, reliable, and sustainable [103]. In this line, and following other established methods [104], the energy transition index (ETI) used to evaluate urban decarbonisation pathways is comprised of the following indicators: affordability (calculated as the specific cost of a megawatt hour), self-reliance (observed through the scope of electricity and fuel imports), and sustainability (evaluated by observing specific emissions and primary fuel use). In general, an ideal power system is one that provides energy at zero costs, produces no emissions, does not use fossil fuels and does not depend on any imports. Evaluating the performance of an urban energy system requires a multidisciplinary approach and a careful selection of parameters to be monitored. There are numerous papers investigating the selection of the right indicators [105]. The energy transition index presented in this paper is constructed of three dimensions and six basic indicators. Figure 1 reveals the composition of the energy transition index.
The affordability dimension consists of three indicators: end-user market costs, power purchase agreements (PPAs), and fuel costs. This dimension is aimed at determining end costs for three subsectors: power, heating, and transport.
A = k A · ( A m + A p + A f )
Self-reliance is the ability of the system to satisfy its own demand. This dimension aims to determine the amount of imported energy (power and fuels).
R = k R e · R e + k R f · R f
Sustainability is what the entire energy sector is striving to achieve. For research purposes, this dimension is considered to reflect on the system’s carbon emissions and fossil fuel use. It aims to calculate the overall emission of the observed case study. Estimation of the emissions by the transport subsector is based on the IPCC guidelines [106].
S = k S e · S e
Combining three dimensions results in a vector set in a Cartesian system. Lower index values represent a better performance by the observed energy system.
E T I 2 = [ k A · ( A m + A p + A f ) ] 2 + [ k R e · R e + k R f · R f ] 2 + [ k S e · S e ] 2

3.2. Optimisation Model

Complexities of modern power systems require the utilisation of specialised optimisation tools to consider all necessary parameters within time-dependent techno-economic constraints. There are numerous optimisation software for energy analyses available [107]. The market analysis presented in the paper uses a detailed database of the case study city and a detailed database of its domestic power system. As such, it is optimally suited to observe the development scenarios of the case study. The optimisation tool is a bespoke model made by the authors of the paper. It is an extension of the mid-term market simulation software Promed built by the Italian-based institute CESI [108] and used for numerous market analyses worldwide [109,110]. The database contains hourly consumption patterns, water inflow, power grid constraints, fuel prices, carbon costs, and generation portfolios (each unit is separately considered and is characterised by its operating range, efficiency, fuel used, average availability, and cost structure). Due to space limitations, only essential data used in the market analysis are revealed. A more extensive view on some of the aspects of the database can be found in our previously published work [102,111].
The optimisation aims to minimise costs with respect to the given constraints of the system. It is based on Karush–Kuhn–Tucker (KKT) conditions and considers the system through a period of a year with an hourly discretisation. The task of cost optimisation comes down to the convex minimization problem of the following general form:
min x t ,   i f subject   to   constraints   ( C 1 ) ( C 3 ) ,
where the cost function f is given by
f = t , i ( B t , i   g t , i ( x t , i ) + K t , i x t , i + D t , i max ( B t , i   h t , i ( x t , i ) P t ,   0 ) ) ,
and g t , i and h t , i are convex functions. A detailed list of functions, variables, constants, and indices is given in Table 1. The constraints of the optimisation problem are:
( C 1 ) x t , i [ B t , i m t , i ,   B t , i M t , i ] ,   t ,   i ,
( C 2 ) h t , i ( x t , i ) [ n t , i ,   N t , i ] ,   t ,   i ,
( C 3 ) i q t , i   p t , i + r t = L t + R t ,   t ,
and represent constraints on the power generated by operating units, fuel consumption, and total resulting output. It is convenient to choose the functions g t , i and h t , i as they are fairly simple in that they allow efficient application of optimisation algorithms, but still allow enough variability to make the model adequate for obtaining reliable information. In this paper, the following production cost function is considered:
g t , i ( x ) = a 0 , t , i + a 1 , t , i   x a 2 , t , i ln x + m t , i M t , i ,
where a 0 , t , i (EUR) is the zero-degree cost coefficient, a 1 , t , i (EUR/MW) is the linear cost coefficient, and a 2 , t , i > 0 (EUR) is the log cost coefficient. For the fuel consumption function h t , i , we take:
h t , i ( x ) = b 0 , t , i + b 1 , t , i   x + b 2 , t , i x 2 ,
where b 0 , t , i (GJ), b 1 , t , i (GJ/MW), and b 2 , t , i > 0 (GJ/MW2) are the zero-degree, linear, and quadratic fuel consumption coefficients for generating unit i in time interval t, respectively.
The optimisation process carries out an optimal coordinated scheduling of the thermal and hydro generation portfolios of the power system during the course of a year with an hourly discretisation. It does so by solving a quadratic programming optimisation problem where the objective function to be minimised is the overall production cost of energy [102]. The process needs to consider all technical constraints of the system and create a dispatching schedule based on hourly load profiles. The aim of the software is to simulate a liberalised power market where producers compete to enter the merit order curve (MOC). The day-ahead market is characterised by a congestion management system based on zonal market splitting and a marginal price. Running a power market optimisation requires consideration of a significant amount of data. This data can be divided into the following nine groups: generation portfolio (each unit of the system is individually modelled based on its availability, operating range, efficiency, maintenance schedules, fuels utilised, and costs), power grid model (defined by bidirectional net transfer capacities), hourly load profiles by zones, power purchase agreements (PPAs), exchanges with neighbouring systems, privileged producers (units that have dispatch priority), and fuel and carbon prices. Market optimisation uses the input database to determine three key outputs with an hourly discretisation: (1) marginal zonal prices, (2) generation by each unit, and (3) exchanges between zones.

4. Case Study

Practical implications of the method presented in Chapter 3 are explored by applying the method to an existing city. For the purposes of research, the city of Zaprešić was chosen (the city). First, a four-step assessment is conducted to determine the city’s: (1) energy consumption patterns, (2) cost of energy, (3) CO2 emissions, and (4) potential energy solutions. After the current state of the city’s energy sector is assessed, several development scenarios are built. The key is to evaluate the possibilities and challenges of a zero-carbon transition of the city.

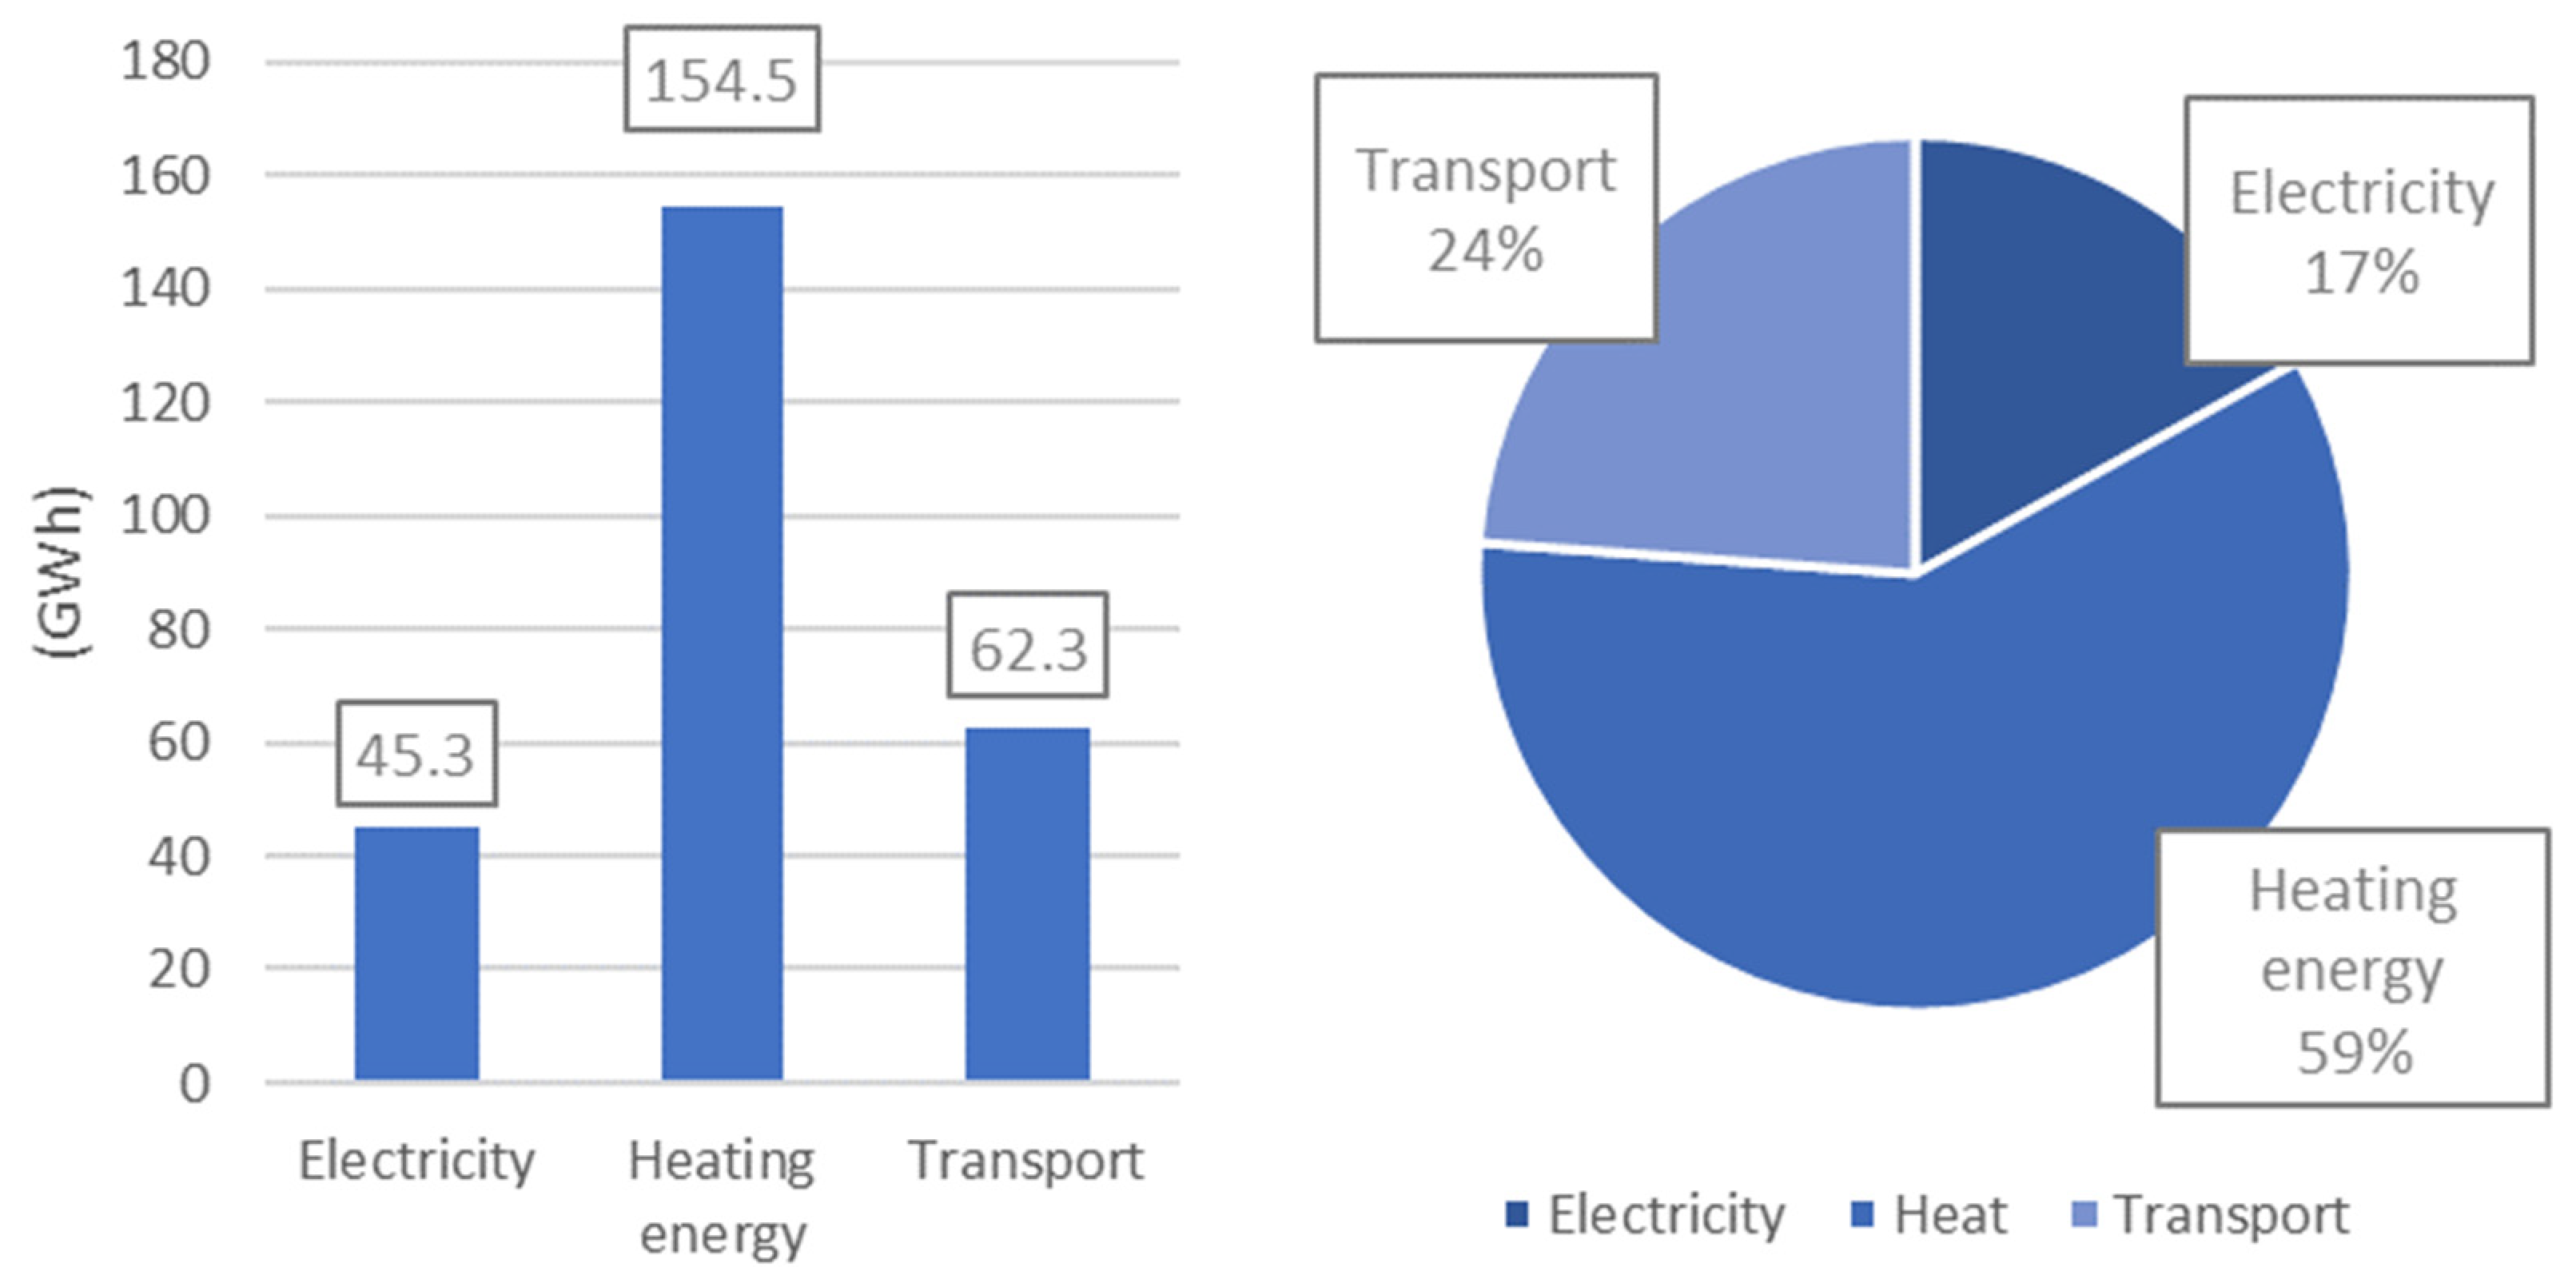
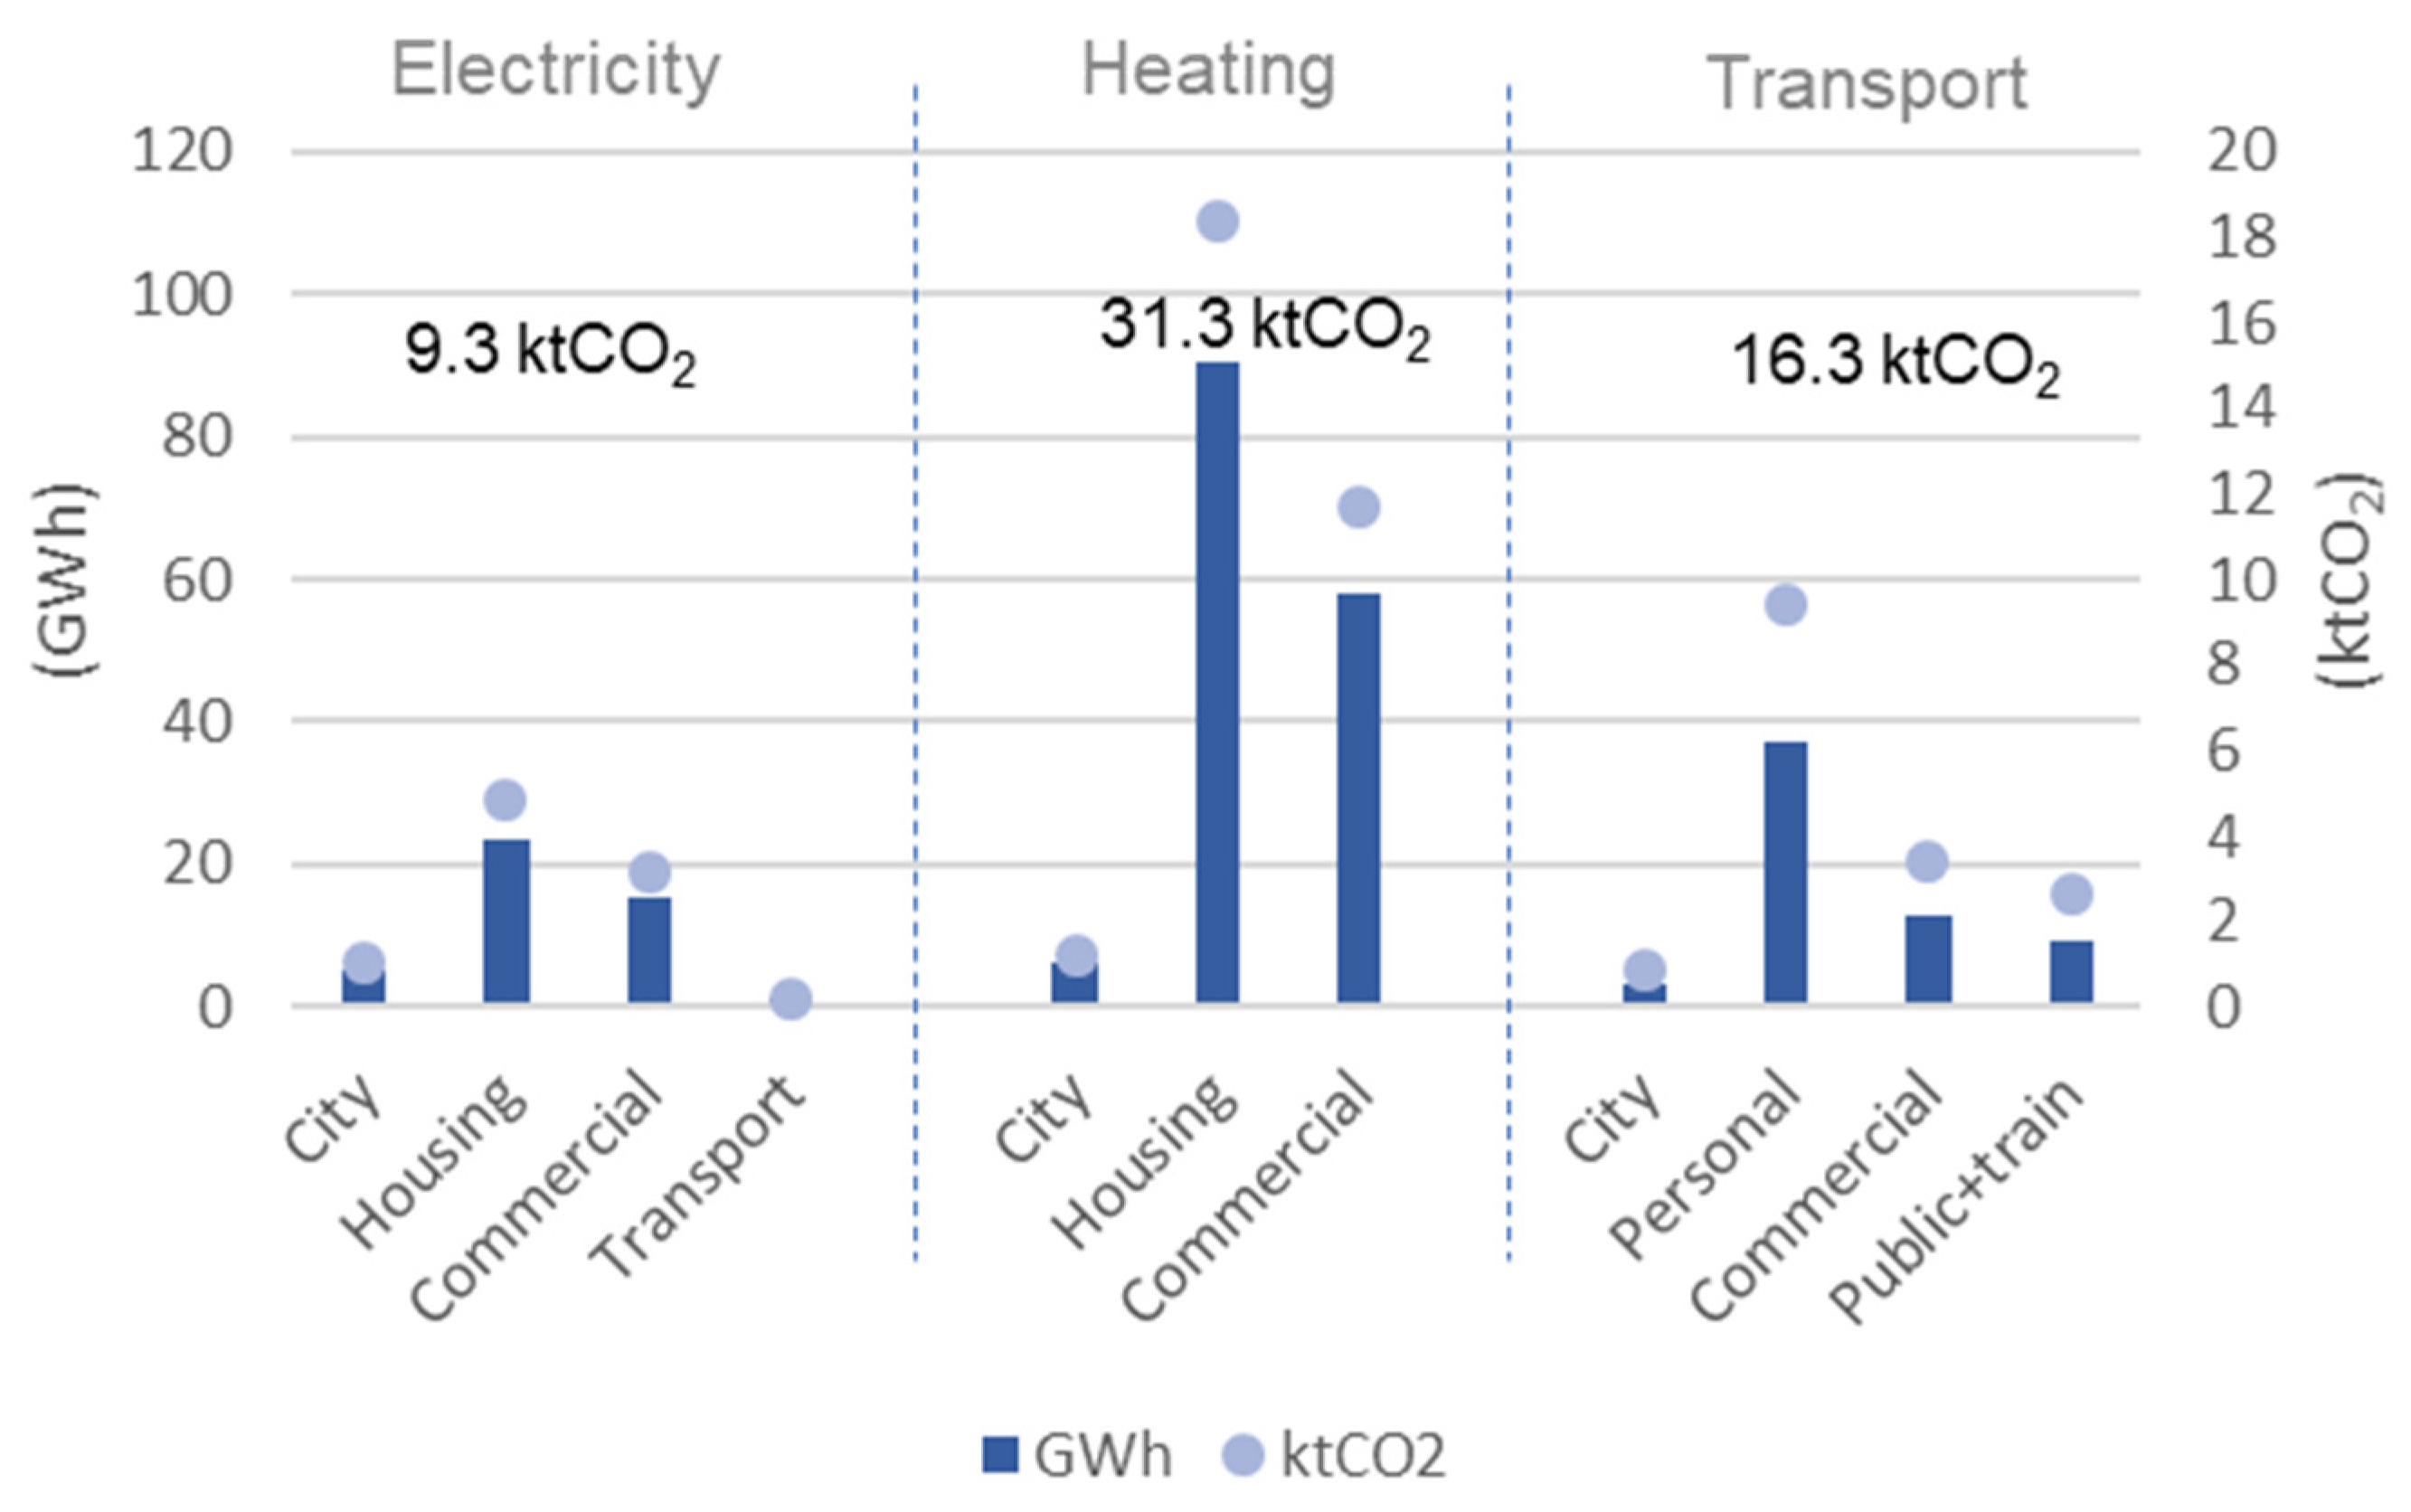
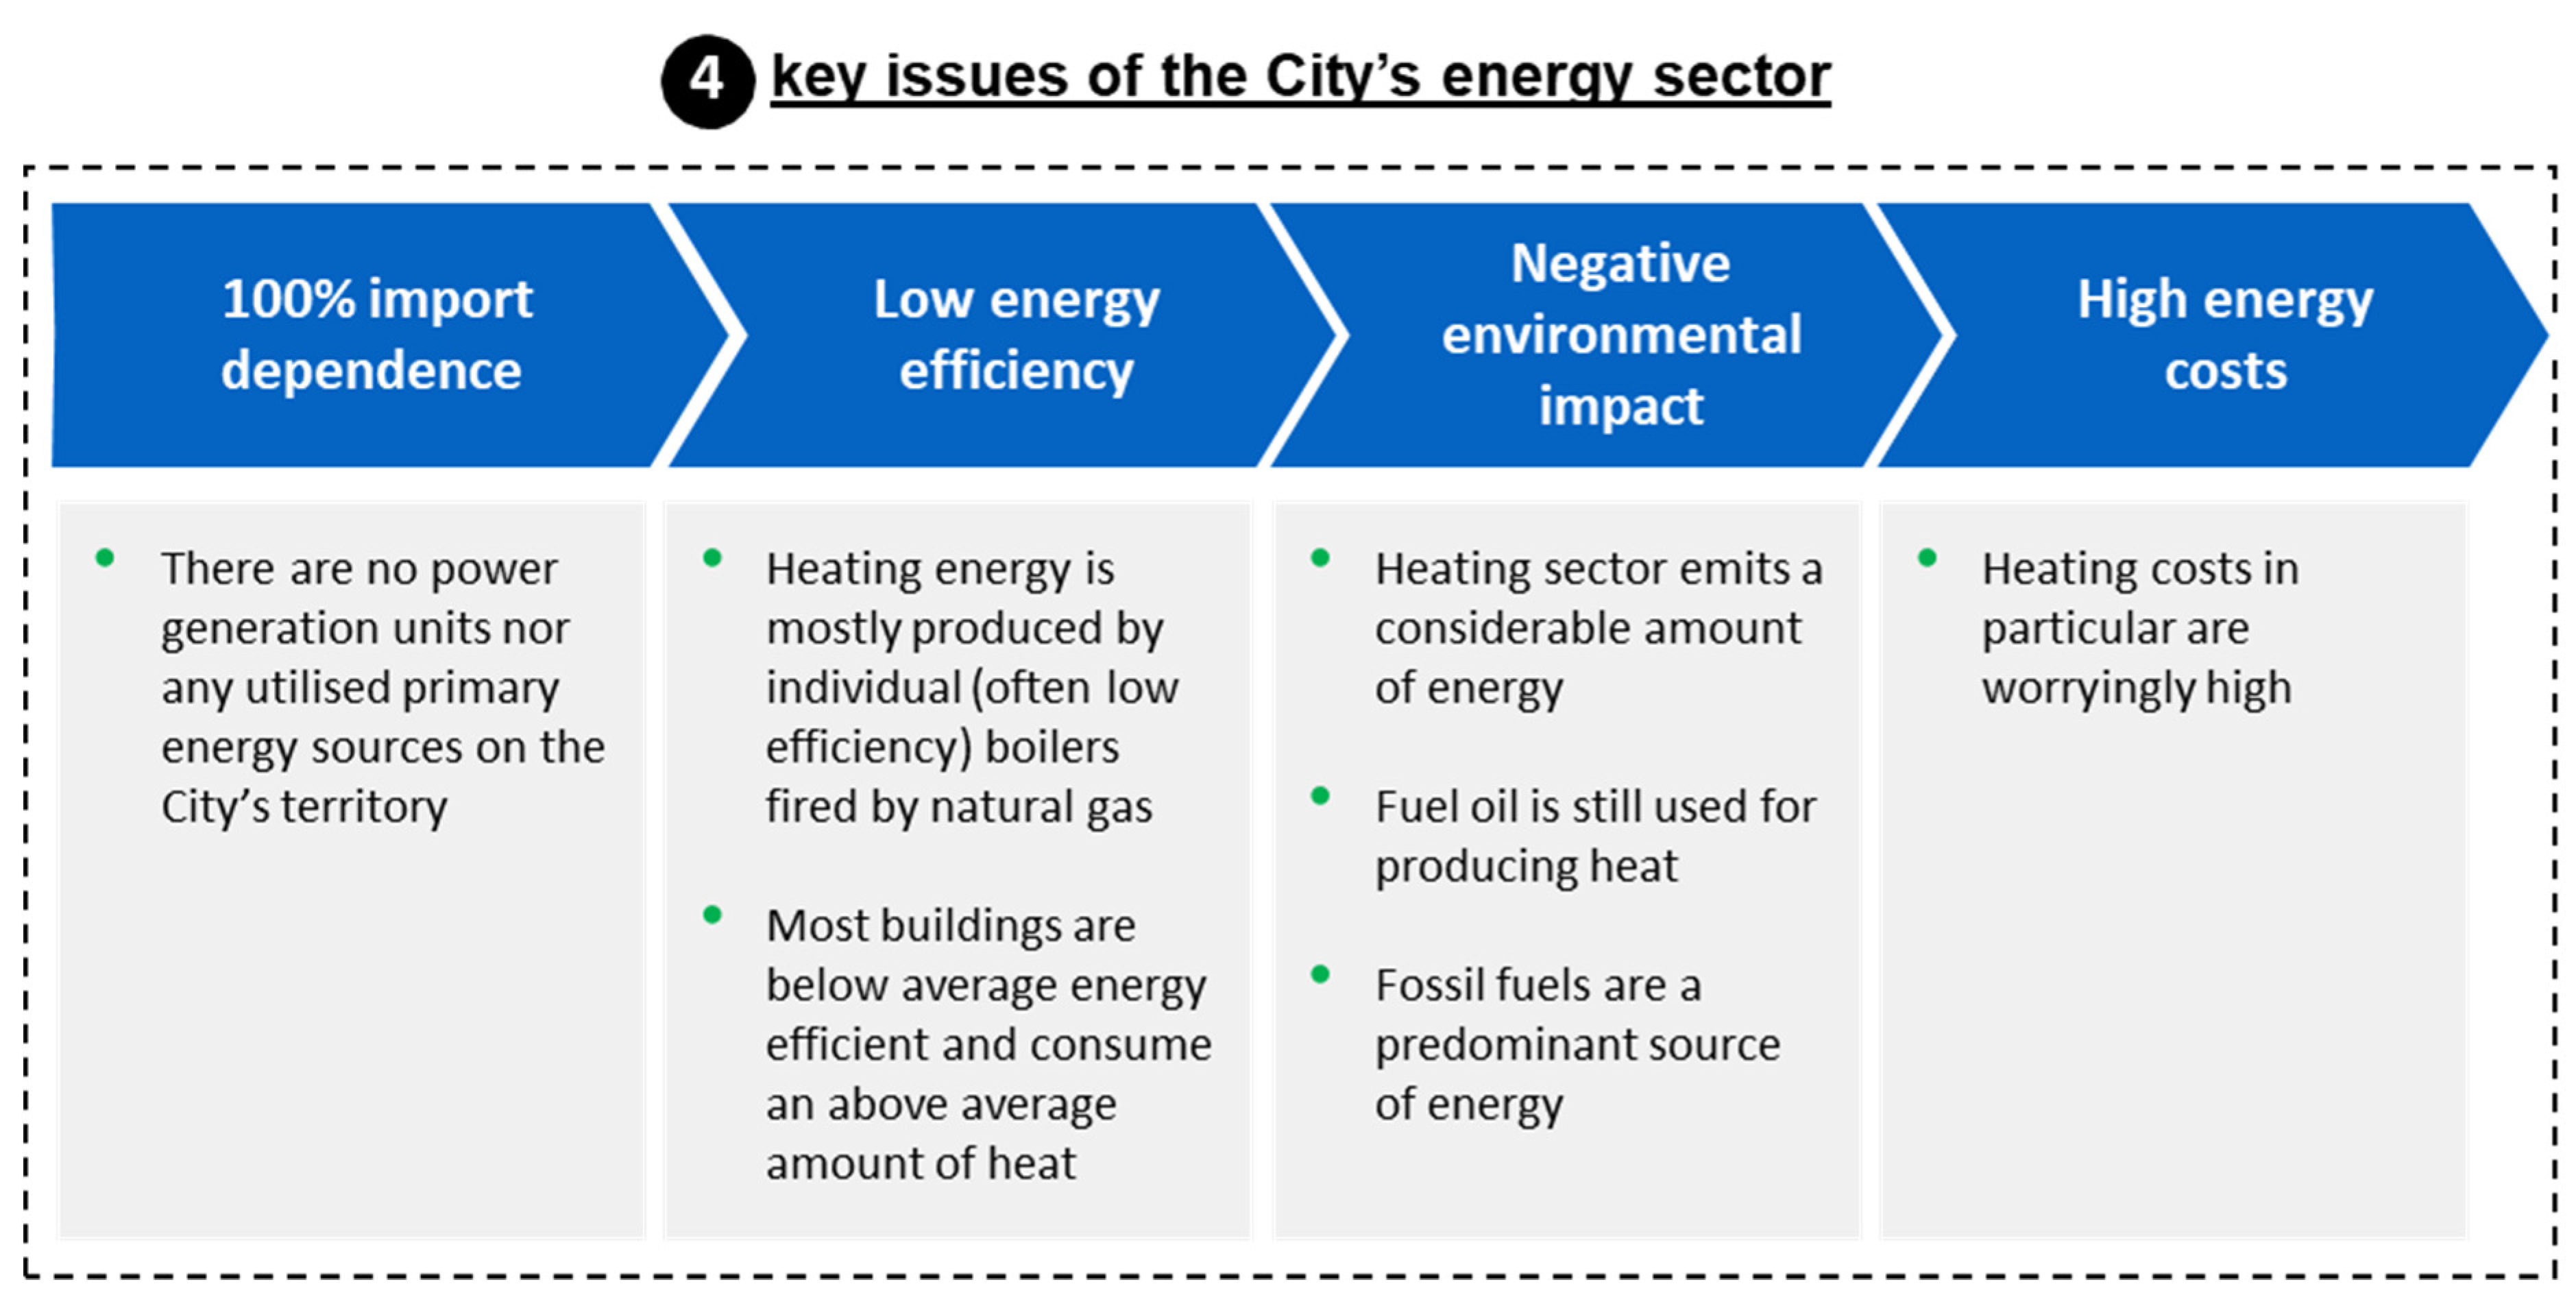
4.1. Current State Assessment

Zaprešić is a city located in the north-western part of Croatia, 18 km away from the nation’s capital, Zagreb (Figure 2). It has a population of 25 thousand and its urban area is spread across 251 km2. Zaprešić is an excellent example of a small, continental city. According to Köppen climate classification, its climate is classified as an oceanic climate (Cfb), but it borders on a humid continental climate (Dfb). According to the Croatian Chamber of Trades and Crafts, there are 707 registered companies in Zaprešić [112].
Despite decent energy potential, the city has a virtually non-existent power sector. The city consumes an average of 262 GWh of energy per year. Almost 60% of its energy is used for heating purposes. The annual energy demand of the city is shown in Figure 3.
The city consumes an average of 45.3 GWh of energy per year for electricity [113]. City-owned properties are responsible for the following types of consumption: public lighting (71% share, 3.6 GWh), administration, education, culture, sports, and other. Households consume the most electricity with a share of 52% in the overall consumption. Figure 4 shows the city’s electricity demand with an hourly discretisation.
The demand for heating energy in the city of Zaprešić is around three times higher than electricity consumption: it averages at about 155 GWh per year. Natural gas is the dominant primary fuel used for satisfying heat demand. Almost 90% of heating energy is produced with natural gas. There are eight central heating stations that annually supply about 14 GWh of heating energy [114]. Households consume most heating energy—90 GWh per year (just below 60%). Figure 5 shows the city’s heating energy demand with an hourly discretisation.
The transport sector consumes 62 GWh of energy during the course of an average year. Most vehicles are powered by diesel, which meets 57% of primary fuel needs, while the rest are mostly powered by gasoline [115]. Fuel is mostly consumed by personal vehicles.
After assessing the city’s energy consumption patterns, the next step is to analyse its cost of energy (CoE). Since the city has no domestic power sources and no trading desk, the electricity price is determined based on the average tariff prices of electricity supply in Croatia. Based on the elaboration of data presented by the Croatian energy market operator (HROTE) [116] and the Croatian energy regulatory agency (HERA) [117], in 2020, the end user price of electricity averaged EUR 96/MWh. Comparing this number with the overall electricity demand, the annual cost of electricity in the city equals EUR 4.4 M. The annual heating cost of the city equals EUR 12.3 M [118]. Transport costs are estimated by comparing the overall primary fuel consumption and the average prices of diesel/gas/LPG [119]. Figure 6 reveals the summed results of the city’s annual energy consumption and energy cost. The annual energy consumption of the city is estimated at 262 GWh, which cost a total of EUR 24.2 M.
The third step of the current state assessment is estimating the carbon footprint of the city. Each subsector (electricity, heating, and transport) requires a different approach. Despite having no domestic power sources, the city is responsible for the so-called indirect emissions from purchased electricity. As per the Joint Research Centre of the EU, the specific emission factor for electricity in Croatia is 0.205 tCO2/MWh [120]. This means that the city is responsible for a total of 57 kilotons of CO2 emissions each year. Emissions of the heating sector are calculated by comparing specific emission factors of natural gas (0.202 tCO2/MWh) and heating oil (0.267 tCO2/MWh) with the city’s annual energy consumption of these two fuels [118,120]. Similarly, the emissions of the transport sector are calculated by observing specific emission factors of diesel (0.267 tCO2/MWh), gasoline (0.267 tCO2/MWh), and LPG (0.267 tCO2/MWh) with the city’s annual fuel consumption [115,118,120]. Finally, Figure 7 is drafted, showing the city’s annual emissions by each subsector.
Looking at the current state of the city’s energy sector, several observations can be drawn. At present, the city does not produce electricity and is forced to import basically 100% of its energy consumption. Only 9% of thermal energy demand is supplied by central heating systems, while the rest (90%) is satisfied by individual boilers. Heating costs are high and CO2 emissions are significant. The negative environmental impact is amplified by the use of remaining heating oil boilers. Figure 8 depicts four key problem areas of the city’s energy sector.

4.2. RES Deployment Scenarios

Increasing efficiency requires the implementation of new technological solutions and innovative processes. New business models must be carefully studied, and solutions created in a personalized way so that they can be properly applied to reduce costs and negative impact on the environment in accordance with the objectives of the EU energy policy for 2030. In this context, main activities should revolve around gradually increasing the efficiency of existing infrastructure and facilitating the implementation of local, distributed energy sources. There are two key steps when it comes to identifying ideal development scenarios. First, acceptable technologies should be filtered. Second, a combination of these technologies should be optimised based on the specifics of local surroundings. Reaching a zero-carbon energy system, while at the same time maintaining reliability and (enhancing) affordability, during a limited timeframe, requires the application of innovative but mature technological solutions. These solutions should, ideally, be supported by incentives to attract investors. The left side of Figure 9 shows the main urban areas of the city, its industrial and commercial zones and existing small heating systems. The right side of Figure 9 reveals potential locations for RES deployment and main corridors of the new central heating system based on the city’s energy potential and general urban plan.
Looking at currently available technologies, this refers to wind, solar, sustainable cogeneration (such as biomass), and small hydro. All are mature technologies with proven track records, all are considered privileged power producers by the Croatian regulatory framework [117], and all have a realistic possibility to be incentivised by the Croatian energy market operator [116]. The city has modest wind potential [121], making wind power plants an unfeasible option. The city’s solar potential is much better rated with irradiation values enabling around 1250 kWh/KWp per year [122]. This is equivalent to a plant load factor (PLF) of 14.27% and is considered sufficient for a solar power plant to be feasible. A cogeneration unit has the potential to swiftly reduce the negative environmental impact of the city’s heating sector. The area has sufficient biomass potential [123] and, according to the general urban plan of the city [124], local authorities have already envisioned building a cogeneration unit in the industrial zone. Finally, there is a river (Sava) running at the border of the city. This locality has the potential for a 14.3 MW hydro power plan, while newer studies suggest an even larger unit can be constructed (i.e., the one by the Croatian Ministry of Physical Planning) [125]. Table 1 sums the results of the analysis of the potential RES deployment.
Based on the energy potential of the city, three development scenarios are built. Following them, the city would become carbon neutral. They envision three key pathways: (1) implementation of renewable energy sources, (2) electrification of existing processes (most significantly the electrification of transport), and (3) improving the efficiency of existing infrastructure. Table 2 lists potential development scenarios regarding RES deployment.
Potential domestic annual production of power and heat for each of the three RES deployment scenarios is shown in Figure 10.
Potential RES deployment is not the only factor that needs to be considered. A sensitivity also needs to be added to the city’s consumption patterns. Three additional scenarios are considered: (1) business as usual—low demand growth and 0% e-mobility, (2) referent—demand growth and 50% electric vehicles (EVs), and (3) zero-carbon—high electrification, 100% EVs, and the implementation of electric heat pumps. Combining scenarios regarding possible consumption patterns and RES deployment scenarios from Table 3 results in having 12 scenarios that are analysed by computational optimisation. Acronyms of the scenarios are listed in Table 3.

4.3. Market Analysis of the City’s 2030 Transition

This section presents the main findings of the simulated transition. The market analysis is carried out by the use of a bespoke software optimisation tool. For the purposes of the analysis, a detailed reference model of the city of Zaprešić is constructed. Three RES deployment scenarios and three consumption/EV take-up scenarios are drafted which cover all presumed development scenarios of the city. The analyses confirm that, based on the general guidelines and the method described in previous sections, it is possible to design a completely sustainable, zero-carbon city for the given case study. According to the energy transition index (ETI), deploying renewable sources would improve the overall performance of the city’s energy sector (by reducing its negative environmental impact, import dependence, and fossil fuel use), while maintaining affordability and reliability of the energy supply.
Biomass cogeneration is used to reduce heating bills and replace carbon-emitting heating oil and natural gas boilers. Cogeneration units are able to provide a stable source of energy, crucial for covering baseload demand. The problem is that these units are only highly-efficient when they simultaneously produce electric and heating energy. The Croatian energy market operator has so far only incentivised biomass cogeneration units of up to 5 MWel output and offered a higher tariff for units of up to 2 MWel. The analysis of the city’s heating market revealed peak heating load to amount to just over 33 MWth. As there are parts of the city with low population density, building a central heating system (CHS) that would reach each household would prove to be unfeasible. Instead, the development scenarios envision a CHS that covers only the urban area of the city. Individual suburban households would have to replace their natural gas boilers with electric heat pumps. This would cause an increase in electricity demand. Heat pumps would have to cover an estimated 14.9 GWh of heating energy each year.
It would be rather optimistic to believe that electric vehicles (EVs) will be the dominant form of transportation by 2030. Nevertheless, the zero-carbon scenario assumes the electrification of all transport. According to research, an average EV consumes about a third (33%) of energy compared with an average internal combustion engine [126,127]. Therefore, electrifying the transport sector would increase electricity demand, but would reduce the overall energy consumption of the city. It would also significantly reduce CO2 emissions, reduce the negative environmental impact of transportation, and decrease costs. Our analysis revealed that retail electricity price in Croatia averaged at about EUR 96/MWh, while referent fuel cost (diesel and gasoline combined) averaged EUR 110.8/MWh.
As aforementioned, variable RES have intermittent outputs which considerably complicate the energy balance equation. Figure 11 reveals typical hourly values of solar power plant utilisation (based on the values recorded during the last 3-year period).
Hydrological conditions used in the case study are based on the average recorded weekly water inflow profiles on a national level (Croatia) during the period of the last ten years and are shown in Figure 12.
Effective market analysis requires hourly load profiles to be compared with the intermittent output of the assumed generation portfolio. An optimisation procedure is run for each of the twelve scenarios defined in the previous chapter. Only the main findings are outlined. To provide a better understanding of the output results, Figure 13 reveals the balance during a week-long period of the referent scenario 2 (R2).
Analysing data presented in Figure 13, an interesting observation can be drawn. During the observed period, the overall energy balance is positive (net exports are larger than net imports). However, without power exchanges with the external system, the city would not be able to satisfy its demand. Ensuring full self-reliance would require one or more of the following: installing more power generation capacities, implementing power storage (in this case a battery system), and/or facilitating the application of demand response (DR) solutions. Based on the results of the optimisation and the subsequent market analysis, key indicators of the energy transition index are shown in Figure 14.
Figure 15 presents the transition indices for each of the 12 deployment scenarios. Despite certain limitations, scenarios with higher RES penetration record better results.
Figure 16 shows a comparison of the three dimensions of the energy transition index for the current state (B0) and the three basic deployment scenarios. It reveals the beneficial effect of RES deployment on the sustainability and self-reliance of the city. In addition, observing the case study example, if current market incentives for selected renewable technologies are considered and considering current power prices, affordability of the city’s energy supply chain would be improved. Worth noting is that RES deployment requires an initial capital investment. Its associated effects are temporal (market incentives have a duration period). In other words, after covering capital costs, RESs produce energy at lower operational costs and thus improve the affordability of the energy supply.
There are a few crucial takes from the results obtained. Naturally, RES deployment is highly beneficial to self-reliance and sustainability. However, data suggest that the increased implementation of residential solar units and electric heat pumps, and a high uptake of EVs gradually reduces energy end costs. In fact, the zero-carbon scenario offers noticeably lower energy costs than the current situation of the city. Implementing a cogeneration unit would slightly increase the cost of power but would result in a significant reduction in heating energy costs (despite a significant initial capital investment).

5. Discussion

Deployment of RES has to consider factors beyond techno-economic ones to ensure their successful implementation. Sustainable development has three key aspects: social, ecological, and economic [102], while three key energy sector requirements are sustainability (environmental impact), reliability (self-reliance), and affordability [102]. Any successful transition will look to be compatible with these conditions. Sustainability is closely linked to CO2 emissions. In other words, to reach sustainability in the energy sector, it is imperative to reduce CO2 emissions to zero. The described decarbonization pathway is subject to a number of challenges and restrictions. These challenges arise due to problem areas related to technological, environmental, social, regulatory, economic, and/or infrastructural issues.

5.1. Regulatory Framework and Policy Support

The energy sector is a colossal system that is crucial to the wellbeing of society. It requires countless elements to interoperate and provide an affordable, reliable, and sustainable source of energy in real time. Due to its gravity and importance, the energy sector is considerably less agile than others [2]. Thus, structural changes take more time and are complex to implement. The regulatory framework of the energy sector is faced with the difficult task of reconciling the need to provide a stable source of energy and the requirement to decarbonise the energy supply chain [128]. Variable RES are putting an increasing amount of strain on the power grid. Regulation is important to ensure that power grid upgrades and new investments in reserve generation capacities or battery systems follow the requirements set by accommodating a large quantity of variable RES. In other words, when solar and wind capacities fail to meet demand, the power system needs reserve power generators or batteries to provide an interrupted source of energy. If these backup systems have low capacity factors, they will not be feasible without incentives. A successful energy policy will have to ensure the feasibility of backup systems, while the regulatory framework will determine who and by what rate pays for them.
Having a stable and concise regulatory framework has been identified as a prerequisite for ensuring the financing of an energy project [129]. As far as the case study presented in the paper goes, there is a lack of a coherent regulatory framework regarding the heating and transport sector and a lack of supporting policies regarding power-to-heat and e-mobility solutions. Generally, there are three types of energy policies [130]: (1) investment based (such as grants and tax exemptions), (2) operating support (such as emission caps and feed-in tariffs), and (3) consumer facing (such as net metering). Favourable energy policies are a powerful tool that governments use to facilitate the development of the energy sector in the desired direction [131]. They are aimed at lowering financial risks and creating a supportive environment regarding the implementation of sustainable technologies. Despite all the positive aspects of renewable energy, investors need clarity, stability, and returns on their investments. Developing decarbonisation pathways is only the first step. Creating a supportive investment framework is crucial.

5.2. Economic Factors

Perhaps the key issues regarding investments in the energy sector are that they are mostly capital intensive and have long lifetimes. Additionally, these projects are faced with a series of risks ranging from lengthy bureaucratic procedures, technological issues, social acceptance, macroeconomic factors, inconsistent policies, and/or changing prices. These uncertainties result in large risk margins that increase costs or cause projects to be abandoned. Power-to-heat technologies (heat pumps and electric boilers) can provide additional flexibility to the heating system, but require relatively high upfront capital investments. Individual households are often hesitant to invest in such solutions and continue to use fossil-based solutions. A similar situation is found in the transport sector where people generally prefer a lower-cost choice, disregarding the environmental concerns regarding ICEs. Lowering costs of heating pumps and EVs would facilitate a large up-take of such technologies.

5.3. Reliability of Supply

As aforementioned, variable RES have intermittent outputs that depend on environmental conditions. On the other hand, energy demand fluctuations are driven by different parameters. A renewable generation portfolio can produce the exact amount of energy that is consumed during the course of a year. However, this does not necessarily mean that the same generation portfolio can cover local consumption during each hour of the year. As shown by Figure 17, our market analysis confirmed that despite producing more energy than locally consumed, there are several instances when our (case study) city had to import electricity.
Our analysis confirmed that a power system needs a stable source of energy (in our case study that was the biomass cogeneration unit) and/or a storage system. As research indicates, conventional power plants are an essential part of the power system as synchronous generators have a direct, electro-mechanical link to the system and provide spinning mass [132,133]. Without storage or energy exchanges, any energy system would require a significant amount of reserve capacity. In other words, as the surge of RES continues, the power system is in dire need of battery storage systems, since not every location is suitable for hydro storage. Storage solutions (hydro, mechanical, or electrochemical) are able to provide multiple ancillary services, such as power time shift, supply, black start, frequency regulation, and spinning reserve [68]. In addition, ensuring a smooth transition would require the application of innovative power-to-x approaches [134] and demand response solutions [46,135].

6. Conclusions

Fundamental changes facilitated by numerous disparate trends and led by the surge of renewables produced new understandings regarding optimal development strategies. The ongoing energy transition brings a significant number of challenges, increases operational complexity, and (in some cases) initially raises supply costs. However, despite the techno-economic barriers, RES deployment is the only path towards creating an environmentally neutral and sustainable energy supply chain for the future. Looking at the long-term perspective, distributed energy reduces grid losses, emissions, and offers long-term cost savings. The research presented in this paper builds upon established definitions and outlines a step-by-step method to build a city-level decarbonisation pathway with a focus on RES deployment. It also introduces a method to quantify the key features of a successful energy system. The index presented offers an evaluation method that is able to consider both the economic aspects and how certain decarbonisation pathways affect energy sustainability and reliability. The global environmental crisis that is slowly unravelling requires development strategies to consider factors other than simple financial benefits. What the presented index does not do is consider the social impacts of a low-carbon transition which have a considerable effect on RES deployment and the utilisation of new, sustainable energy solutions. In addition, the case study does not explore how different energy efficiency programmes might aid the transition process. This is where further research in the field might be directed and how the presented index could be fine-tuned. After running several development scenarios, the paper quantified how RES deployment improves sustainability and self-reliability and how much it offsets the affordability of the energy supply chain. During the process, a number of opportunities and barriers associated with low-carbon transition were identified. Improving the transition process would require several key actions:
(1)
Establishing a coherent, unified regulatory framework that would facilitate the deployment of new sustainable solutions and the emergence of new market players.
(2)
Introducing favourable energy policies and energy efficiency programmes to incentivise renewable production and tax exemptions.
(3)
Changing the way energy is consumed by introducing models based on circular economy.
(4)
Improving social awareness and raising institutional capacities regarding the utilisation of low-carbon technologies.
(5)
Electrification of processes that would shift a number of end uses from fossil-based sources (such as the electrification of transport explored in the case study).
Facilitating these actions would also require actions not directly explored by this paper such as further digitalisation and automation of the energy supply chain, considerable investment in research, development, and innovation (RDI), and resolving security issues of data flows. In the future, new technological solutions such as artificial intelligence, hydrogen, demand-side management, and battery storage will be crucial in the path towards a zero-carbon energy system.
Renewable energy sources are key in providing an affordable, reliable, and sustainable source of energy. RES deployment has several highly positive aspects, such as a reduction in carbon emissions, reduction in import dependency, facilitation of domestic industrial development, decrease in grid losses, and increased cost savings. In the past, renewables could not financially compete with conventional energy sources. During the past several years, capital costs of renewable energy recorded significant cuts and resulted in a much more competitive environment. Looking at the current (January 2022) prices of emission unit allowances (EUA) and electricity itself, renewables are even more financially viable than conventional technologies. However, as this research showed, despite a considerable amount of positive aspects, variable RES also have a number of drawbacks. Only by applying bespoke solutions, diversifying the generation portfolio, and implementing storage technologies can a zero-carbon system be designed. A combination of policies and innovative solutions will help us reach the goal of having a completely sustainable energy system in the future.

Author Contributions

Conceptualization, V.F. and A.V.; methodology, V.F. and A.B.-Š.; software, V.F. and A.B.-Š.; validation, V.F., A.V. and A.B.-Š.; formal analysis, V.F.; investigation, V.F.; resources, A.V. and V.F.; data curation, V.F.; writing—original draft preparation, V.F.; writing—review and editing, V.F.; visualization, V.F.; supervision, A.V.; project administration, V.F. and A.V.; funding acquisition, A.V. All authors have read and agreed to the published version of the manuscript.

Funding

This research received no external funding.

Data Availability Statement

Data directly obtained from HEP-ODS or internal analysis.

Conflicts of Interest

The authors declare no conflict of interest.

Nomenclature

SymbolVariableUnit
k A Weight coefficients(EUR/MWh)
k R e -
k R f -
k S e (MWh/tCO2)
DEnergy demandMWh, GJ
A m Power generating unit indexEUR/MWh
A p Power generated by unit i in time interval tEUR/MWh
A f Production cost function for unit i in time interval tEUR/MWh
R e Electricity importsMWh
R f Fuel importsGJ
S e EmissionstCO2/MWh
t Time-step index-
i Power generating unit index-
x t ,   i Power generated by unit i in time interval tMW
g t , i Production cost function for unit i in time interval tEUR
h t , i Fuel consumption function for unit i in time interval tGJ
B t , i Binary indicator (0 if x t , i = 0 , and 1 if x t , i > 0 )-
K t , i Bid-up value for unit i in time interval tEUR/MW
P t Marginal fuel consumption that activates the penalty in time interval tGJ
D t , i Penalty for fuel consumptions exceeding M t for unit i in time interval tEUR/GJ
m t , i Minimum power of the operating generating unit i in time interval t ( m t , i > 0 )MW
M t , i Maximum power of the operating generating unit i in time interval t ( M t , i > 0 )MW
n t , i . Minimum consumption of unit i in time interval tGJ
N t , i Maximum consumption of unit i in time interval t
q t , i . Output efficiency coefficient for unit i in time interval t   ( q t , i [ 0 ,   1 ] ) -
L t Total load in time interval tMW
r t Total available spinning reserve in time interval tMW
R t Total requested spinning reserve in time interval tMW

References

  1. Romanello, M.; van Daalen, K.; Anto, J.M.; Dasandi, N.; Drummond, P.; Hamilton, I.G.; Jankin, S.; Kendrovski, V.; Lowe, R.; Rocklöv, J.; et al. Tracking progress on health and climate change in Europe. Lancet Public Health 2021, 6, 858–865. [Google Scholar] [CrossRef]
  2. Višković, A.; Franki, V. Value co-creation through a digital platform business model in the power sector. In Proceedings of the 44th International Convention on Information, Communication and Electronic Technology, MIPRO, Opatija, Croatia, 27 September–1 October 2021; pp. 499–505. [Google Scholar]
  3. Sebestyén, V.; Abonyi, J. Data-driven comparative analysis of national adaptation pathways for Sustainable Development Goals. J. Clean. Prod. 2021, 319, 128657. [Google Scholar] [CrossRef]
  4. Zhong, J.; Bollen, M.; Rönnberg, S. Towards a 100% renewable energy electricity generation system in Sweden. Renew. Energy 2021, 171, 812–824. [Google Scholar] [CrossRef]
  5. Olabi, A.G.; Abdelkareem, M.A. Renewable energy and climate change. Renew. Sustain. Energy Rev. 2022, 158, 112111. [Google Scholar] [CrossRef]
  6. Matsumoto, K.; Andriosopoulos, K. Energy security in East Asia under climate mitigation scenarios in the 21st century. Omega 2016, 58, 60–71. [Google Scholar] [CrossRef]
  7. Ali, A.; Li, W.; Hussain, R.; He, X.; Williams, B.W.; Memon, A.H. Overview of Current Microgrid Policies, Incentives and Barriers in the European Union, United States and China. Sustainability 2017, 9, 1146. [Google Scholar] [CrossRef] [Green Version]
  8. Framework agreement between the Swedish Social Democratic Party, the Moderate Party, the Swedish Green Party, the Centre Party and the Christian Democrats. 2016. Available online: https://www.government.se/49d8c1/contentassets/8239ed8e9517442580aac9bcb00197cc/ek-ok-eng.pdf (accessed on 7 January 2022).
  9. The Danish Government; Social Democracy; The Danish People’s Party; The Red-green Alliance; The Alternative; The Social Liberal Party; The Socialist People’s Party. Energy Agreement of 29 June 2018. Available online: https://en.kefm.dk/Media/C/5/Energy%20Agreement%202018%20a-webtilg%C3%A6ngelig.pdf (accessed on 7 January 2022).
  10. Kroposki, B.; Johnson, B.; Zhang, Y.; Gevorgian, V.; Denholm, P.; Hodge, B.-M.; Hannegan, B. Achieving a 100% Renewable Grid: Operating Electric Power Systems with Extremely High Levels of Variable Renewable Energy. IEEE Power Energy Mag. 2017, 15, 61–73. [Google Scholar] [CrossRef]
  11. Graabak, I.; Jaehnert, S.; Korpås, M.; Mo, B. Norway as a Battery for the Future European Power System—Impacts on the Hydropower System. Energies 2017, 10, 2054. [Google Scholar] [CrossRef] [Green Version]
  12. Hong, S.; Bradshaw, C.J.A.; Brook, B.W. Global zero-carbon energy pathways using viable mixes of nuclear and renewables. Appl. Energy 2015, 143, 451–459. [Google Scholar] [CrossRef]
  13. Holland, R.A.; Beaumont, N.; Hooper, T.; Austen, M.; Gross, R.J.K.; Heptonstall, P.J.; Ketsopoulou, I.; Winskel, M.; Watson, J.; Taylor, G. Incorporating ecosystem services into the design of future energy systems. Appl. Energy 2018, 222, 812–822. [Google Scholar] [CrossRef]
  14. Hribar, N.; Šimić, G.; Vukadinović, S.; Šprajc, P. Decision-making in sustainable energy transition in Southeastern Europe: Probabilistic network-based model. Energy Sustain. Soc. 2021, 11, 39. [Google Scholar] [CrossRef]
  15. Franki, V.; Višković, A. Energy security, policy and technology in South East Europe: Presenting and applying an energy security index to Croatia. Energy 2015, 90, 494–507. [Google Scholar] [CrossRef]
  16. Calvillo, C.F.; Sánchez-Miralles, A.; Villar, J. Energy management and planning in smart cities. Renew. Sustain. Energy Rev. 2016, 55, 273–287. [Google Scholar] [CrossRef] [Green Version]
  17. United Nations. The Sustainable Development Goals Report. 2020. Available online: https://unstats.un.org/sdgs/report/2020/The-Sustainable-Development-Goals-Report-2020.pdf (accessed on 7 January 2022).
  18. de Llano-Paz, F.; Martínez Fernandez, P.; Soares, I. Addressing 2030 EU policy framework for energy and climate: Cost, risk and energy related issues. Energy 2016, 115, 1347–1360. [Google Scholar] [CrossRef]
  19. Fontaras, G.; Zacharof, N.-G.; Ciuffo, B. Fuel consumption and CO2 emissions from passenger cars in Europe—Laboratory versus real-world emissions. Prog. Energy Combust. Sci. 2017, 60, 97–131. [Google Scholar] [CrossRef]
  20. Chen, L.; Yip, T.L.; Mou, J. Provision of Emission Control Area and the impact on shipping route choice and ship emissions. Transp. Res. Part D Transp. Environ. 2018, 58, 280–291. [Google Scholar] [CrossRef]
  21. Zaporozhets, O.; Synylo, K. Improvements on aircraft engine emission and emission inventory assessment inside the airport area. Energy 2017, 140, 1350–1357. [Google Scholar] [CrossRef]
  22. Cao, S.; Alanne, K. The techno-economic analysis of a hybrid zero-emission building system integrated with a commercial-scale zero-emission hydrogen vehicle. Appl. Energy 2018, 211, 639–661. [Google Scholar] [CrossRef]
  23. Ji, Y.; Li, K.; Liu, G.; Shrestha, A.; Jing, J. Comparing greenhouse gas emissions of precast in-situ and conventional construction methods. J. Clean. Prod. 2018, 173, 124–134. [Google Scholar] [CrossRef]
  24. Zach, F.; Kretschmer, F.; Stoeglehner, G. Integrating Energy Demand and Local Renewable Energy Sources in Smart Urban Development Zones: New Options for Climate-Friendly Resilient Urban Planning. Energies 2019, 12, 3672. [Google Scholar] [CrossRef] [Green Version]
  25. Steingrube, A.; Bao, K.; Wieland, S.; Lalama, A.; Kabiro, P.M.; Coors, V.; Schröter, B.A. Method for Optimizing and Spatially Distributing Heating Systems by Coupling an Urban Energy Simulation Platform and an Energy System Model. Resources 2021, 10, 52. [Google Scholar] [CrossRef]
  26. Matar, W.; Elshurafa, A.M. Striking a balance between profit and carbon dioxide emissions in the Saudi cement industry. Int. J. Greenh. Gas Control 2017, 61, 111–123. [Google Scholar] [CrossRef]
  27. Holappa, L.A. General Vision for Reduction of Energy Consumption and CO2 Emissions from the Steel Industry. Metals 2020, 10, 1117. [Google Scholar] [CrossRef]
  28. Gautam, M.; Pandey, B.; Agrawal, M. Chapter 8—Carbon Footprint of Aluminum Production: Emissions and Mitigation. In Environmental Carbon Footprints; Muthu, S.S., Ed.; Butterworth-Heinemann: Oxford, UK, 2018; pp. 197–228. [Google Scholar]
  29. Lyu, X.; Shi, A.; Wang, X. Research on the impact of carbon emission trading system on low-carbon technology innovation. Carbon Manag. 2020, 11, 183–193. [Google Scholar] [CrossRef]
  30. Qadir, S.A.; Al-Motairi, H.; Tahir, F.; Al-Fagih, L. Incentives and strategies for financing the renewable energy transition: A review. Energy Rep. 2021, 7, 3590–3606. [Google Scholar] [CrossRef]
  31. Samant, S.; Thakur-Wernz, P.; Hatfield, D.E. Does the focus of renewable energy policy impact the nature of innovation? Evidence from emerging economies. Energy Policy 2020, 137, 111119. [Google Scholar] [CrossRef]
  32. Blaabjerg, F.; Ma, K. Wind Energy Systems. Proc. IEEE 2017, 105, 2116–2131. [Google Scholar]
  33. Mellit, A.; Tina, G.M.; Kalogirou, S.A. Fault detection and diagnosis methods for photovoltaic systems: A review. Renew. Sustain. Energy Rev. 2018, 91, 1–17. [Google Scholar] [CrossRef]
  34. Eisavi, B.; Ranjbar, F.; Nami, H.; Chitsaz, A. Low-carbon biomass-fueled integrated system for power, methane and methanol production. Energy Convers. Manag. 2022, 253, 115163. [Google Scholar] [CrossRef]
  35. Bourdin, S.; Colas, M.; Raulin, F. Understanding the problems of biogas production deployment in different regions: Territorial governance matters too. J. Environ. Plan. Manag. 2020, 63, 1655–1673. [Google Scholar] [CrossRef]
  36. Couth, R.; Trois, C.; Vaughan-Jones, S. Modelling of greenhouse gas emissions from municipal solid waste disposal in Africa. Int. J. Greenh. Gas Control 2011, 5, 1443–1453. [Google Scholar] [CrossRef]
  37. Li, K.; Bian, H.; Liu, C.; Zhang, D.; Yang, Y. Comparison of geothermal with solar and wind power generation systems. Renew. Sustain. Energy Rev. 2015, 42, 1464–1474. [Google Scholar] [CrossRef]
  38. Lamnatou, C.; Chemisana, D. Solar thermal systems for sustainable buildings and climate change mitigation: Recycling, storage and avoided environmental impacts based on different electricity mixes. Sol. Energy 2022, 231, 209–227. [Google Scholar] [CrossRef]
  39. Dezfouli, M.M.S.; Sopian, K.; Kadir, K. Energy and performance analysis of solar solid desiccant cooling systems for energy efficient buildings in tropical regions. Energy Convers. Manag. X 2022, 14, 100186. [Google Scholar] [CrossRef]
  40. Knutel, B.; Pierzyńska, A.; Dębowski, M.; Bukowski, P.; Dyjakon, A. Assessment of Energy Storage from Photovoltaic Installations in Poland Using Batteries or Hydrogen. Energies 2020, 13, 4023. [Google Scholar] [CrossRef]
  41. Lucchi, E.; Dall’Orto, I.; Peluchetti, A.; Toledo, L.; Pelle, M.; López, C.P.; Guazzi, G. Photovoltaic technologies in historic buildings and protected areas: Comprehensive legislative framework in Italy and Switzerland. Energy Policy 2022, 161, 112772. [Google Scholar] [CrossRef]
  42. Višković, A.; Franki, V.; Valentić, V. CCS (carbon capture and storage) investment possibility in South East Europe: A case study for Croatia. Energy 2014, 70, 325–337. [Google Scholar] [CrossRef]
  43. Franki, V.; Višković, A.; Šapić, A. Carbon capture and storage retrofit: Case study for Croatia. Energy Sources Part A Util. Environ. Effects 2021, 43, 3238–3250. [Google Scholar] [CrossRef]
  44. Chen, M.; Sinha, A.; Hu, K.; Shah, M.I. Impact of technological innovation on energy efficiency in industry 4.0 era: Moderation of shadow economy in sustainable development. Technol. Forecast. Soc. Chang. 2021, 164, 120521. [Google Scholar] [CrossRef]
  45. Rathor, S.K.; Saxena, D. Energy management system for smart grid: An overview and key issues. Int. J. Energy Res. 2020, 44, 4067–4109. [Google Scholar] [CrossRef]
  46. Paterakis, N.G.; Erdinç, O.; Catalão, J.P.S. An overview of Demand Response: Key-elements and international experience. Renew. Sustain. Energy Rev. 2017, 69, 871–891. [Google Scholar] [CrossRef]
  47. Di Silvestre, M.L.; Favuzza, S.; Riva Sanseverino, E.; Zizzo, G. How Decarbonization, Digitalization and Decentralization are changing key power infrastructures. Renew. Sustain. Energy Rev. 2018, 93, 483–498. [Google Scholar] [CrossRef]
  48. Zhao, S.; Blaabjerg, F.; Wang, H. An Overview of Artificial Intelligence Applications for Power Electronics. IEEE Trans. Power Electron. 2021, 36, 4633–4658. [Google Scholar] [CrossRef]
  49. Višković, A.; Franki, V.; Damiano, A. Integrated Strategic Action for Facilitating the Electrification Process. In Proceedings of the 44th International Convention on Information, Communication and Electronic Technology, MIPRO, Opatija, Croatia, 27 September–1 October 2021; pp. 551–557. [Google Scholar]
  50. Sovacool, B.K.; Mukherjee, I. Conceptualizing and measuring energy security: A synthesized approach. Energy 2011, 36, 5343–5355. [Google Scholar] [CrossRef]
  51. Yergin, D. The Prize: The Epic Quest for Oil, Money and Power; Simon & Schuster: New York, NY, USA, 1991. [Google Scholar]
  52. Yergin, D. Ensuring energy security. Foreign Aff. 2006, 85, 69–82. [Google Scholar] [CrossRef]
  53. Hughes, L.; Lipscy, P.Y. The Politics of Energy. Annu. Rev. Political Sci. 2013, 16, 449–469. [Google Scholar] [CrossRef] [Green Version]
  54. Johansson, B. Security aspects of future renewable energy systems—A short overview. Energy 2013, 61, 598–605. [Google Scholar] [CrossRef] [Green Version]
  55. Cherp, A.; Jewell, J. The concept of energy security: Beyond the four As. Energy Policy 2014, 75, 415–421. [Google Scholar] [CrossRef] [Green Version]
  56. Chester, L. Conceptualising energy security and making explicit its polysemic nature. Energy Policy 2010, 38, 887–895. [Google Scholar] [CrossRef]
  57. Winzer, C. Conceptualizing energy security. Energy Policy 2012, 46, 36–48. [Google Scholar] [CrossRef] [Green Version]
  58. Gökgöz, F.; Güvercin, M.T. Energy security and renewable energy efficiency in EU. Renew. Sustain. Energy Rev. 2018, 96, 226–239. [Google Scholar] [CrossRef]
  59. deLlano-Paz, F.; Calvo-Silvosa, A.; Susana Iglesias, A.; Soares, I. Energy planning and modern portfolio theory: A review. Renew. Sustain. Energy Rev. 2017, 77, 636–651. [Google Scholar] [CrossRef]
  60. Glynn, J.; Chiodi, A.; Gallachoir, B.O. Energy security assessment methods: Quantifying the security co-benefits of decarbonising the Irish Energy System. Energy Strategy Rev. 2016, 15, 72–88. [Google Scholar] [CrossRef]
  61. European Commission (EC). Communication from the Commission. 20 20 20 by 2020: Europe’s Climate Change Opportunity; 30 Final; COM: Brussels, Belgium, 2008. [Google Scholar]
  62. European Commission (EC). The 2030 Energy Strategy; COM: Brussels, Belgium, 2014. [Google Scholar]
  63. Hansen, K.; Breyer, C.; Lund, H. Status and perspectives on 100% renewable energy systems. Energy 2019, 175, 471–480. [Google Scholar] [CrossRef]
  64. Bourdin, S.; Galliano, D.; Gonçalves, A. Circularities in Territories: Opportunities & Challenges. In European Planning Studies; Routledge: Oxford, UK; New York, NY, USA, 2021. [Google Scholar]
  65. Delarue, E.; De Jonghe, C.; Belmans, R.; D’haeseleer, W. Applying portfolio theory to the electricity sector: Energy versus power. Energy Econ. 2011, 33, 12–23. [Google Scholar] [CrossRef]
  66. Rokhmawati, A. Comparison of power plant portfolios under the no energy mix target and national energy mix target using the mean–variance model. Energy Rep. 2021, 7, 4850–4861. [Google Scholar] [CrossRef]
  67. Shum, K.L. Renewable energy deployment policy: A transition management perspective. Renew. Sustain. Energy Rev. 2017, 73, 1380–1388. [Google Scholar] [CrossRef]
  68. Papadis, E.; Tsatsaronis, G. Challenges in the decarbonization of the energy sector. Energy 2020, 205, 118025. [Google Scholar] [CrossRef]
  69. Seetharaman, M.K.; Patwa, N.; Saravanan, G.Y. Breaking barriers in deployment of renewable energy. Heliyon 2019, 5, e01166. [Google Scholar] [CrossRef] [Green Version]
  70. Višković, A.; Šimunić, D.; Franki, V. Innovation platfirm—A novel energy service utility. In Proceedings of the 2020 43rd International Convention on Information, Communication and Electronic Technology, MIPRO, Opatija, Croatia, 28 September–2 October 2020; pp. 425–430. [Google Scholar]
  71. Child, M.; Kemfert, C.; Bogdanov, D.; Breyer, C. Flexible electricity generation, grid exchange and storage for the transition to a 100% renewable energy system in Europe. Renew. Energy 2019, 139, 80–101. [Google Scholar] [CrossRef]
  72. Narayanan, A.; Mets, K.; Strobbe, M.; Develder, C. Feasibility of 100% renewable energy-based electricity production for cities with storage and flexibility. Renew. Energy 2019, 134, 698–709. [Google Scholar] [CrossRef]
  73. Berka, A.; Dreyfus, M. Decentralisation and inclusivity in the energy sector: Preconditions, impacts and avenues for further research. Renew. Sustain. Energy Rev. 2021, 138, 110663. [Google Scholar] [CrossRef]
  74. Satt Arioli, M.; de Almeida D’Agosto, M.; Gonçalves Amaral, F.; Beatriz Bettella Cybis, H. The evolution of city-scale GHG emissions inventory methods: A systematic review. Environ. Impact Assess. Rev. 2020, 80, 106316. [Google Scholar] [CrossRef]
  75. Croci, E.; Lucchitta, B.; Molteni, T. Low carbon urban strategies: An investigation of 124 European cities. Urban Clim. 2021, 40, 101022. [Google Scholar] [CrossRef]
  76. Campbell-Johnston, K.; ten Cate, Y.; Elfering-Petrovic, M.; Gupta, J. City level circular transitions: Barriers and limits in Amsterdam, Utrecht and The Hague. J. Clean. Prod. 2019, 235, 1232–1239. [Google Scholar] [CrossRef]
  77. Mendizabal, M.; Heidrich, O.; Feliu, E.; García-Blanco, G.; Mendizabal, A. Stimulating urban transition and transformation to achieve sustainable and resilient cities. Renew. Sustain. Energy Rev. 2018, 94, 410–418. [Google Scholar] [CrossRef]
  78. Frantzeskaki, N. Bringing Transition Management to Cities: Building Skills for Transformative Urban Governance. Sustainability 2022, 14, 650. [Google Scholar] [CrossRef]
  79. Nochta, T.; Skelcher, C. Network governance in low-carbon energy transitions in European cities: A comparative analysis. Energy Policy 2020, 138, 111298. [Google Scholar] [CrossRef]
  80. Song, Q.; Liu, T.; Qi, Y. Policy innovation in low carbon pilot cities: Lessons learned from China. Urban Clim. 2021, 39, 100936. [Google Scholar] [CrossRef]
  81. Liu, H.; Yan, F.; Tian, H. Towards low-carbon cities: Patch-based multi-objective optimization of land use allocation using an improved non-dominated sorting genetic algorithm-II. Ecol. Indic. 2022, 134, 108455. [Google Scholar] [CrossRef]
  82. Wang, Y.; Fang, X.; Yin, S.; Chen, W. Low-carbon development quality of cities in China: Evaluation and obstacle analysis. Sustain. Cities Soc. 2021, 64, 102553. [Google Scholar] [CrossRef]
  83. Hast, A.; Syri, S.; Lekavičius, V.; Galinis, A. District heating in cities as a part of low-carbon energy system. Energy 2018, 152, 627–639. [Google Scholar] [CrossRef]
  84. Li, W.; Bao, L.; Li, Y.; Si, H.; Li, Y. Assessing the transition to low-carbon urban transport: A global comparison. Resour. Conserv. Recycl. 2022, 180, 106179. [Google Scholar] [CrossRef]
  85. Zhang, N.; Luo, Z.; Liu, Y.; Feng, W.; Zhou, N.; Yang, L. Towards low-carbon cities through building-stock-level carbon emission analysis: A calculating and mapping method. Sustain. Cities Soc. 2022, 78, 103633. [Google Scholar] [CrossRef]
  86. Decker, C. Utility and regulatory decision-making under conditions of uncertainty: Balancing resilience and affordability. Util. Policy 2018, 51, 52–60. [Google Scholar] [CrossRef]
  87. Keysar, E. Procedural Integration in Support of Environmental Policy Objectives: Implementing Sustainability. J. Environ. Plan. Manag. 2014, 48, 549–569. [Google Scholar] [CrossRef]
  88. Moret, S.; Babonne, F.; Bierlaire, M.; Maréchala, F. Decision support for strategic energy planning: A robust optimization framework. Eur. J. Oper. Res. 2020, 280, 539–554. [Google Scholar] [CrossRef]
  89. Kazak, J.K.; van Hoof, J. Decision support systems for a sustainable management of the indoor and built environment. Indoor Built Environ. 2018, 27, 1303–1306. [Google Scholar] [CrossRef] [Green Version]
  90. Dagdougui, H.; Ouammi, A.; Sacile, R. A regional decision support system for onsite renewable hydrogen production from solar and wind energy sources. Int. J. Hydrogen Energy 2011, 36, 14324–14334. [Google Scholar] [CrossRef]
  91. Zhao, B.; Wang, H.; Huang, Z.; Sun, Q. Location mapping for constructing biomass power plant using multi-criteria decision-making method. Sustain. Energy Technol. Assess. 2022, 49, 101707. [Google Scholar] [CrossRef]
  92. Frombo, F.; Minciardi, R.; Robba, M.; Sacile, R. A decision support system for planning biomass-based energy production. Energy 2009, 34, 362–369. [Google Scholar] [CrossRef]
  93. Mattiussi, A.; Rosano, M.; Simeoni, P. A decision support system for sustainable energy supply combining multi-objective and multi-attribute analysis: An Australian case study. Decis. Support Syst. 2014, 57, 150–159. [Google Scholar] [CrossRef]
  94. Gercek, M.; Durmuş Arsan, Z. Energy and environmental performance based decision support process for early design stages of residential buildings under climate change. Sustain. Cities Soc. 2019, 48, 101580. [Google Scholar] [CrossRef]
  95. Becchio, C.; Bottero, M.C.; Corgnati, S.P.; Dell’Anna, F. Decision making for sustainable urban energy planning: An integrated evaluation framework of alternative solutions for a NZED (Net Zero-Energy District) in Turin. Land Use Policy 2018, 78, 803–817. [Google Scholar] [CrossRef]
  96. Hettinga, S.; Nijkamp, P.; Scholten, H. A multi-stakeholder decision support system for local neighbourhood energy planning. Energy Policy 2018, 116, 277–288. [Google Scholar] [CrossRef]
  97. Marinakis, V.; Doukas, H.; Xidonas, P.; Zopounidis, C. Multicriteria decision support in local energy planning: An evaluation of alternative scenarios for the Sustainable Energy Action Plan. Omega 2017, 69, 1–16. [Google Scholar] [CrossRef]
  98. Agyekum, E.B.; Amjad, F.; Mohsin, M.; Ansah, M.N.S. A bird’s eye view of Ghana’s renewable energy sector environment: A Multi-Criteria Decision-Making approach. Util. Policy 2021, 70, 101219. [Google Scholar] [CrossRef]
  99. Chang, K.-H. A decision support system for planning and coordination of hybrid renewable energy systems. Decis. Support Syst. 2014, 64, 4–13. [Google Scholar] [CrossRef]
  100. de Souza Barbosa, A.; Amaral Shayani, R.; Gonçalves de Oliveira, M.A. A multi-criteria decision analysis method for regulatory evaluation of electricity distribution service quality. Util. Policy 2018, 53, 38–48. [Google Scholar] [CrossRef]
  101. Mrówczyńska, M.; Skiba, M.; Sztubecka, M.; Bazan-Krzywoszańska, A.; Kazak, J.K.; Gajownik, P. Scenarios as a tool supporting decisions in urban energy policy: The analysis using fuzzy logic, multi-criteria analysis and GIS tools. Renew. Sustain. Energy Rev. 2021, 137, 110598. [Google Scholar] [CrossRef]
  102. Franki, V.; Višković, A. Multi-criteria decision support: A case study of Southeast Europe power systems. Util. Policy 2021, 73, 101286. [Google Scholar] [CrossRef]
  103. Rinaldi, G.; Thies, P.R.; Walker, R.; Johanning, L. A decision support model to optimise the operation and maintenance strategies of an offshore renewable energy farm. Ocean Eng. 2017, 145, 250–262. [Google Scholar] [CrossRef]
  104. Sovacool, B.K. (Ed.) The Routledge Handbook of Energy Security; Routledge: Oxford, UK; New York, NY, USA, 2011. [Google Scholar]
  105. Gunnarsdottir, I.; Davidsdottir, B.; Worrell, E.; Sigurgeirsdottir, S. Review of indicators for sustainable energy development. Renew. Sustain. Energy Rev. 2020, 133, 110294. [Google Scholar] [CrossRef]
  106. IPCC. Good Practice Guidance and Uncertainty Management in National Greenhouse Gas Inventories; Methodology Report; IPCC National Greenhouse Gas Inventories Programme: Geneva, Switzerland, 2000. [Google Scholar]
  107. Connloy, D.; Lund, H.; Mathiesen, B.V.; Leahy, M. A review of computer tools for analysing the integration of renewable energy into various energy systems. Appl. Energy 2010, 87, 1059–1082. [Google Scholar] [CrossRef]
  108. CESI. Available online: https://www.cesi.it/ (accessed on 8 January 2022).
  109. CESI. Integration of Variable Renewable Energy in the National Electric System of Ethiopia. 2019. Available online: https://www.enelx.com/content/dam/enel-found/news-pdf/Abstract-Integration-Study-Ethiopia.pdf (accessed on 8 January 2022).
  110. CESI. Smart Renewable Hubs for Flexible Generation—Solar Grid Stability. EU funded GRIDSOL. 2020. Available online: https://www.gridsolproject.eu/wp-content/uploads/2020/04/D9.7_Dissemination-Final-Report.pdf (accessed on 8 January 2022).
  111. Višković, A.; Franki, V. Evaluating and forecasting direct carbon emissions of electricity production: A case study for South East Europe. Energy Sources Part B 2021. [Google Scholar] [CrossRef]
  112. Croatian Chamber of Trades and Crafts. 2022. Available online: https://www.hok.hr/ (accessed on 4 January 2022).
  113. HEP Elektra. Unpublished work. 2022.
  114. HEP Toplinarstvo. Unpublished work. 2022.
  115. Croatian Central Bureau of Statistics. 2022. Available online: https://www.dzs.hr/default_e.htm (accessed on 4 January 2022).
  116. Croatian Energy Market Operator. Annual Report 2020. 2021. Available online: https://www.hrote.hr/ (accessed on 4 January 2022).
  117. Croatian Energy Regulatory Agency. 2022. Available online: https://www.hera.hr/hr/html/index.html (accessed on 4 January 2022).
  118. Energy Platform Living Lab (EPLL). Energy Action Plan for Sustainable Development and Climate of the City of Zaprešić. 2019. Available online: www.epll.eu (accessed on 4 January 2022).
  119. My LPG. 2022. Available online: https://www.mylpg.eu/stations/croatia/prices#chart (accessed on 4 January 2022).
  120. EU Joint Research Centre. CoM Default Emission Factors for the Member States of the European Union; EU Joint Research Centre: Ispra, Italy, 2017. [Google Scholar]
  121. Global Wind Atlas. 2022. Available online: https://globalwindatlas.info/ (accessed on 4 January 2022).
  122. Global Solar Atlas. 2022. Available online: https://globalsolaratlas.info/map (accessed on 4 January 2022).
  123. Ćosić, B.; Stanić, Z.; Duić, N. Geographic distribution of economic potential of agricultural and forest biomass residual for energy use: Case study Croatia. Energy 2011, 36, 2017–2028. [Google Scholar] [CrossRef] [Green Version]
  124. City of Zaprešić. 2022. Available online: http://www.zapresic.hr/naslovnica/gradska-uprava/uo-graditeljstvo-okolis-stambene-komunalne-poslove/uo-graditeljstvo-okolis-komunalije-prostorna-dokumentacija/generalni-urbanisticki-plan/164/ (accessed on 4 January 2022).
  125. Ministry of Physical Planning, Construction and State Assets. 2020. Available online: https://mpgi.gov.hr/UserDocsImages/Zavod/Publikacije/Analiza_ZUK_Sava_v10_GG.pdf (accessed on 4 January 2022).
  126. Kawamoto, R.; Mochizuki, H.; Moriguchi, Y.; Nakano, T.; Motohashi, M.; Sakai, Y.; Inaba, A. Estimation of CO2 Emissions of Internal Combustion Engine Vehicle and Battery Electric Vehicle Using LCA. Sustainability 2019, 11, 2690. [Google Scholar] [CrossRef] [Green Version]
  127. Braun, A.; Rid, W. Energy consumption of an electric and an internal combustion passenger car: A comparative case study from real world data on the Erfurt circuit in Germany. Transp. Res. Procedia 2017, 27, 468–475. [Google Scholar] [CrossRef]
  128. Višković, A.; Franki, V. Status of Croatia’s energy sector framework: Progress, potential, challenges and recommendations. Therm. Sci. 2015, 19, 751–770. [Google Scholar] [CrossRef]
  129. Višković, A.; Franki, V.; Valentić, V. Effect of regulation on power-plant operation and investment in the South East Europe market: An analysis of two cases. Util. Policy 2014, 30, 8–17. [Google Scholar] [CrossRef]
  130. Sarti, B. Policies for the Deployment of Renewable Energies: An Overview. In Social Impact Research Experience; University of Pennsylvania: Philadelphia, PA, USA, 2018. [Google Scholar]
  131. Guan, D.; Comite, U.; Sial, M.S.; Salman, A.; Zhang, B.; Gunnlaugsson, S.B.; Mentel, U.; Mentel, G. The Impact of Renewable Energy Sources on Financial Development, and Economic Growth: The Empirical Evidence from an Emerging Economy. Energies 2021, 14, 8033. [Google Scholar] [CrossRef]
  132. Machowski, J.; Bialek, J.W.; Bumby, J.R. Power System Dynamics: Stability and Control, 2nd ed.; John Wiley & Sons: Hoboken, NJ, USA, 2008. [Google Scholar]
  133. IRENA; IEA; REN21. Renewable Energy Policies in a Time of Transition. 2018. Available online: https://www.irena.org/-/media/Files/IRENA/Agency/Publication/2018/Apr/IRENA_IEA_REN21_Policies_2018.pdf (accessed on 7 January 2022).
  134. Koj, J.C.; Wulf, C.; Zapp, P. Environmental impacts of power-to-X systems—A review of technological and methodological choices in Life Cycle Assessments. Renew. Sustain. Energy Rev. 2019, 112, 865–879. [Google Scholar] [CrossRef]
  135. Crawley, J.; Johnson, C.; Calver, P.; Fell, M. Demand response beyond the numbers: A critical reappraisal of flexibility in two United Kingdom field trials. Energy Res. Soc. Sci. 2021, 75, 102032. [Google Scholar] [CrossRef]
Figure 1. Energy transition index (ETI) composition.
Energies 15 01737 g001
Figure 2. The city of Zaprešić general urban plan.
Energies 15 01737 g002
Figure 3. Annual average energy consumption of the case study city.
Energies 15 01737 g003
Figure 4. Annual electricity demand.
Energies 15 01737 g004
Figure 5. Heating energy demand.
Energies 15 01737 g005
Figure 6. The city’s annual energy consumption and overall energy costs.
Energies 15 01737 g006
Figure 7. The city’s annual CO2 emissions.
Energies 15 01737 g007
Figure 8. The city’s four key problem areas.
Energies 15 01737 g008
Figure 9. The city’s potential RES deployment locations.
Energies 15 01737 g009
Figure 10. Potential production of the three RES deployment scenarios.
Energies 15 01737 g010
Figure 11. Solar power plant utilisation.
Energies 15 01737 g011
Figure 12. Average weekly production of the Croatian hydro sector.
Energies 15 01737 g012
Figure 13. Energy balance sample.
Energies 15 01737 g013
Figure 14. Dimensions of the energy transition index for all scenarios.
Energies 15 01737 g014
Figure 15. Energy transition index results for all scenarios.
Energies 15 01737 g015
Figure 16. Comparing main RES deployment scenarios.
Energies 15 01737 g016
Figure 17. Hourly balance of production and demand (R2 scenario).
Energies 15 01737 g017
Table 1. RES potential.
TechnologyPotential CapacityPotential Production
Biomass cogeneration10 MWel + 24 MWth80 GWhel + 192 GWhth
Solar (rooftop)2 MWel2.51 GWhel
Solar (standalone)5 MWel6.28 GWhel
Hydro14.3 MWel27.56 GWhel
Table 2. RES deployment scenarios.
TechnologyReferentScenario 1Scenario 2Scenario 3
Biomass cogeneration-5 MWel + 12 MWth7 MWel + 19 MWth10 MWel + 24 MWth
Solar (rooftop)- 1 MWel2 MWel
Solar (standalone)- 5 MWel5 MWel
Hydro- 14.3 MWel
Table 3. Sensitivity analysis scenarios.
ScenarioReferentScenario 1Scenario 2Scenario 3
BLow demand growth, 0% e-mobilityB0B1B2B3
RReferent demand growth, 50% electric vehiclesR0R1R2R3
ZZero-carbon scenarioZ0Z1Z2Z3
Publisher’s Note: MDPI stays neutral with regard to jurisdictional claims in published maps and institutional affiliations.

