Article

Low-Order Reactor-Network-Based Prediction of Pollutant Emissions Applied to FLOX® Combustion

German Aerospace Center (DLR), Pfaffenwaldring 38-40, 70569 Stuttgart, Germany
Energies 2022, 15(5), 1740; https://doi.org/10.3390/en15051740
Submission received: 1 February 2022 / Revised: 22 February 2022 / Accepted: 24 February 2022 / Published: 25 February 2022

Abstract

:
Prediction of pollutant emissions is a key aspect of modern combustor design in energy conversion systems. In the presented work, a simple and robust model based on low-order reaction networks is applied to a FLOX® laboratory combustor at atmospheric conditions. The applied approach is computationally cheap and therefore highly suited for design studies. Steady-state CFD RANS simulations are carried out, serving as a basis for the network generation algorithm. CFD results are validated with experimental data for flow field and combustion. Different degrees of fidelity of reactor network models are taken into consideration and findings are opposed to measurements, evaluating the quality of the low-fidelity models. Validation of CO and NOx emission results of reactor network modeling provides accurate qualitative and quantitative reproduction of experimental findings, depending on the degree of heat loss applied on the combustion system. The introduced approach is therefore readily applicable to large-scale, industrial, and gas turbine combustion.

1. Introduction

Combustor development for energy-related and aero-engine applications is subject to strict regulations regarding pollutant emissions [1]. This is addressed in manifold ways, one being the shift from conventional to renewable and alternative fuels, which requires a re-design of most existing systems or the creation of novel concepts for energy conversion.
In this situation, system pollutant emission analyses have to be included in the design process from an early stage. Usually, a set of different emission quantities is considered, namely soot, UHCs (unburned hydrocarbons), NOx, and CO. Where combustion systems with a lean burn operation regime are developed, pollutant emissions are dominated by NOx and CO, which are treated in the presented framework.
NOx pollutants are known as being highly toxic and having a large impact on atmospheric ozone and contributions to acid rain [2]. Energy conversion with fuels containing no nitrogen usually inhibits three pathways of NOx formation. The Zeldovich mechanism [3] is also known as a thermal mechanism that prevails in high-temperature regimes. The Fenimore mechanism [4] is of particular importance in rich combustion. N2O intermediate formation [5] is predominant in very lean and low-temperature combustion.
CO levels are usually high when there is incomplete carbon monoxide burnout, usually dominant at part-load conditions [6,7]. Formation of CO has been experimentally investigated [8,9,10] and also numerically investigated [6,11,12,13,14,15], to name only a few.
The design of energy conversion systems, mainly referring to the combustor, is usually carried out with numerical methods. Those are early-stage 0-D tools up to flow field and combustion resolving CFD (computational fluid dynamics) methods for later design stages.
Prediction of emissions in CFD is a prevailing research field. It can either be covered with computationally expensive scale-resolving simulation techniques, like LES (large eddy simulation) or DES (detached eddy simulation) or with rather simple but efficient RANS (Reynolds-averaged Navier–Stokes)-based methods. As a general rule of thumb, the more sophisticated the method, the less applicable it is to combustor system development, where a lot of iterative loops and parametric studies have to be carried out. Therefore, RANS-based methods are still state-of-the-art in the design process of energy conversion systems.
When robust models are used for CFD, it stands to reason to also choose robust, simple, and efficient approaches for pollutant emission prediction. Such are ERN (emission reactor network) models. Especially in the later 2000s, a lot of research effort was put into ERN modeling. A comprehensive overview is given in Table 1.
Surprisingly, the degree of model fidelity does not necessarily increase with time. Many early studies use automated algorithms for network extraction from CFD data [17,18,19,21], whereas few rely on using CFD results as guidance for manual network creation only [22,23,27]. Some works even disregard the possibility of information gathering from CFD [16,20,32,33], which is a potentially large inaccuracy.
Direct precursors for this study are later works of Nguyen et al. [29,30] and Perpignan et al. [34]. Nguyen et al. carried out ERN studies based on Chemkin, with different degrees of model fidelity, and Perpignan et al. studied NOx and CO emissions in flameless oxidation, which is also studied in the presented work.
In this paper, several novelties and distinctions can be stated compared to the literature works. As a major point, we study and discuss ERN models with different degrees of fidelity. Several algorithmically-generated network models are treated as well as a baseline case that uses CFD data as guidance only. Thereby, the robustness of the approach towards the degree of fidelity is tested. Furthermore, a novel commercial code for the extraction of ERNs from CFD is tested, the so-called Energico module as part of the Ansys workpackage. It is combined with Chemkin for ERN solving. The modeling procedure is sketched in Figure 1.
CFD flow field and combustion data are used to filter the ERNs, based on the local temperature and flow composition. The filtered field is then translated into network models with different degrees of detail (number of reactor modules). The system is iteratively solved in the Ansys Chemkin program, which can also be used for data postprocessing.
Another distinct novelty of the presented work is the application to FLOX® combustion. FLOX® burners operate in a MILD (moderate or intense low oxygen dilution) regime. They were first applied in atmospheric, low calorific furnace applications [36,37]. The FLOX® principle, as adapted for gas turbine combustion, is illustrated in Figure 2.
Fuel is injected through several nozzles arranged coaxially in circumference with the aim to premix with air before issuing into the combustion chamber. A characteristic inner recirculation zone is formed, so that combustion products are conveyed back into the reaction zone, igniting the fresh gases. As a result, a homogeneous temperature distribution, a wide and stable operating range, and low emissions [38,39] are the main features of these systems. Furthermore, the risk of flashback is reduced due to the presence of high-velocity jets with high momentum, which promotes this design to multi-fuel applications including hydrogen combustion [40,41].
The paper is structured as follows. The FLOX® burner test case is introduced first. This is followed by CFD setup and results discussion. Results are validated with experimental data by means of PIV velocity fields and flame surface density from OH* chemiluminescence. Subsequently, the setup and modeling procedure of ERN computations are introduced and explained, and results are discussed on the basis of a parametric study including model fidelity and different numbers of reactors. The resulting modeled pollutant emissions are compared to experimental data of the lab scale burner.

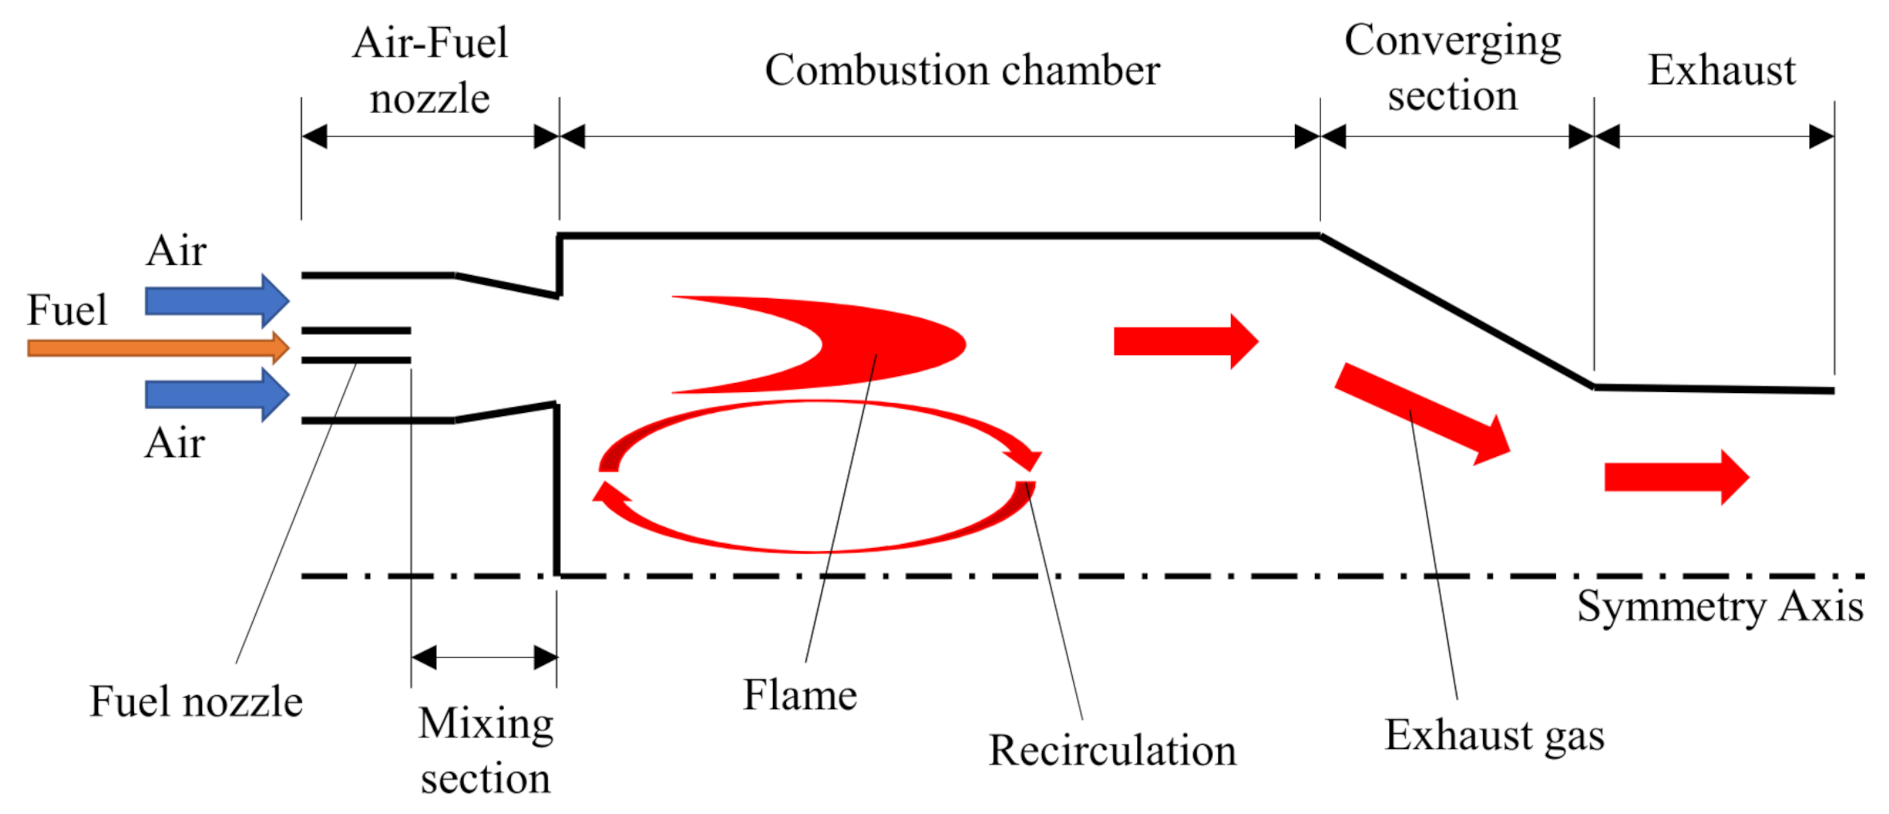
2. Laboratory Scale Test-Case Combustor

The herein investigated laboratory scale burner setup is shown in Figure 3. The 3 kW burner was designed for operation in an MTT (Micro Turbine Technology b.v.) gas turbine and has been scaled to atmospheric operation conditions. This allows for a detailed examination of the combustion system by means of exhaust gas measurements and optical measurement techniques. Therefore, studies with OH* chemiluminescence and PIV have been simultaneously carried out [42]. They provide insight into flow field and reaction zone location and are used for CFD model validation. CFD serves as the basis for ERN modeling.
Details of the experimental setup can be found in the literature [42,43,44]. The burner system is operated with methane at an optimum air fuel number of λ 2.2 . Air is fed through the system by an upstream plenum, where the air is preheated, in order to mimic recuperation as in the MTT gas turbine. Air is led into the combustion chamber via six circumferentially aligned nozzles, whereas the fuel is induced in a co-flow alignment into each nozzle, as can be seen in Figure 3. The combustion chamber consists of quartz glass windows for optical access. Optical measurements were conducted in a way that two air-fuel nozzles are aligned in the measurement sheet, as indicated in Figure 3 by the camera view direction. A more detailed sketch showing the alignment of measurement equipment is given in Figure 4. PIV (particle image velocimetry) measurements of velocity components in the combustion chamber are carried out with titanium dioxide particles.
Due to the air-fuel co-flow alignment and an offset of fuel nozzles, there is a short mixing section, before the mixture issues as a partially premixed fluid (technically premixed) into the combustion chamber. There, discrete flames are located over each nozzle. Due to the strong axial momentum, a large inner recirculation zone of hot gases develops, which increases combustion stability and favors low pollutant emissions. This is due to long fluid residence times and homogeneous temperature distribution.
NOx emissions are sampled at the combustor exhaust gas duct with a UV photometer, whereas CO emissions are taken at the same position with an IR photometer. Measurement accuracy for NOx and CO is in the order of magnitude of 0.1 ppm (parts per million) [42].

3. Computational Combustion Dynamics

In the presented work, chemical reactor network models were built from underlying CFD solutions. Therefore, numerical setup and validation with experimental data is presented briefly, in order to demonstrate the feasibility of usage of the CFD numerical data as the ERN construction basis.

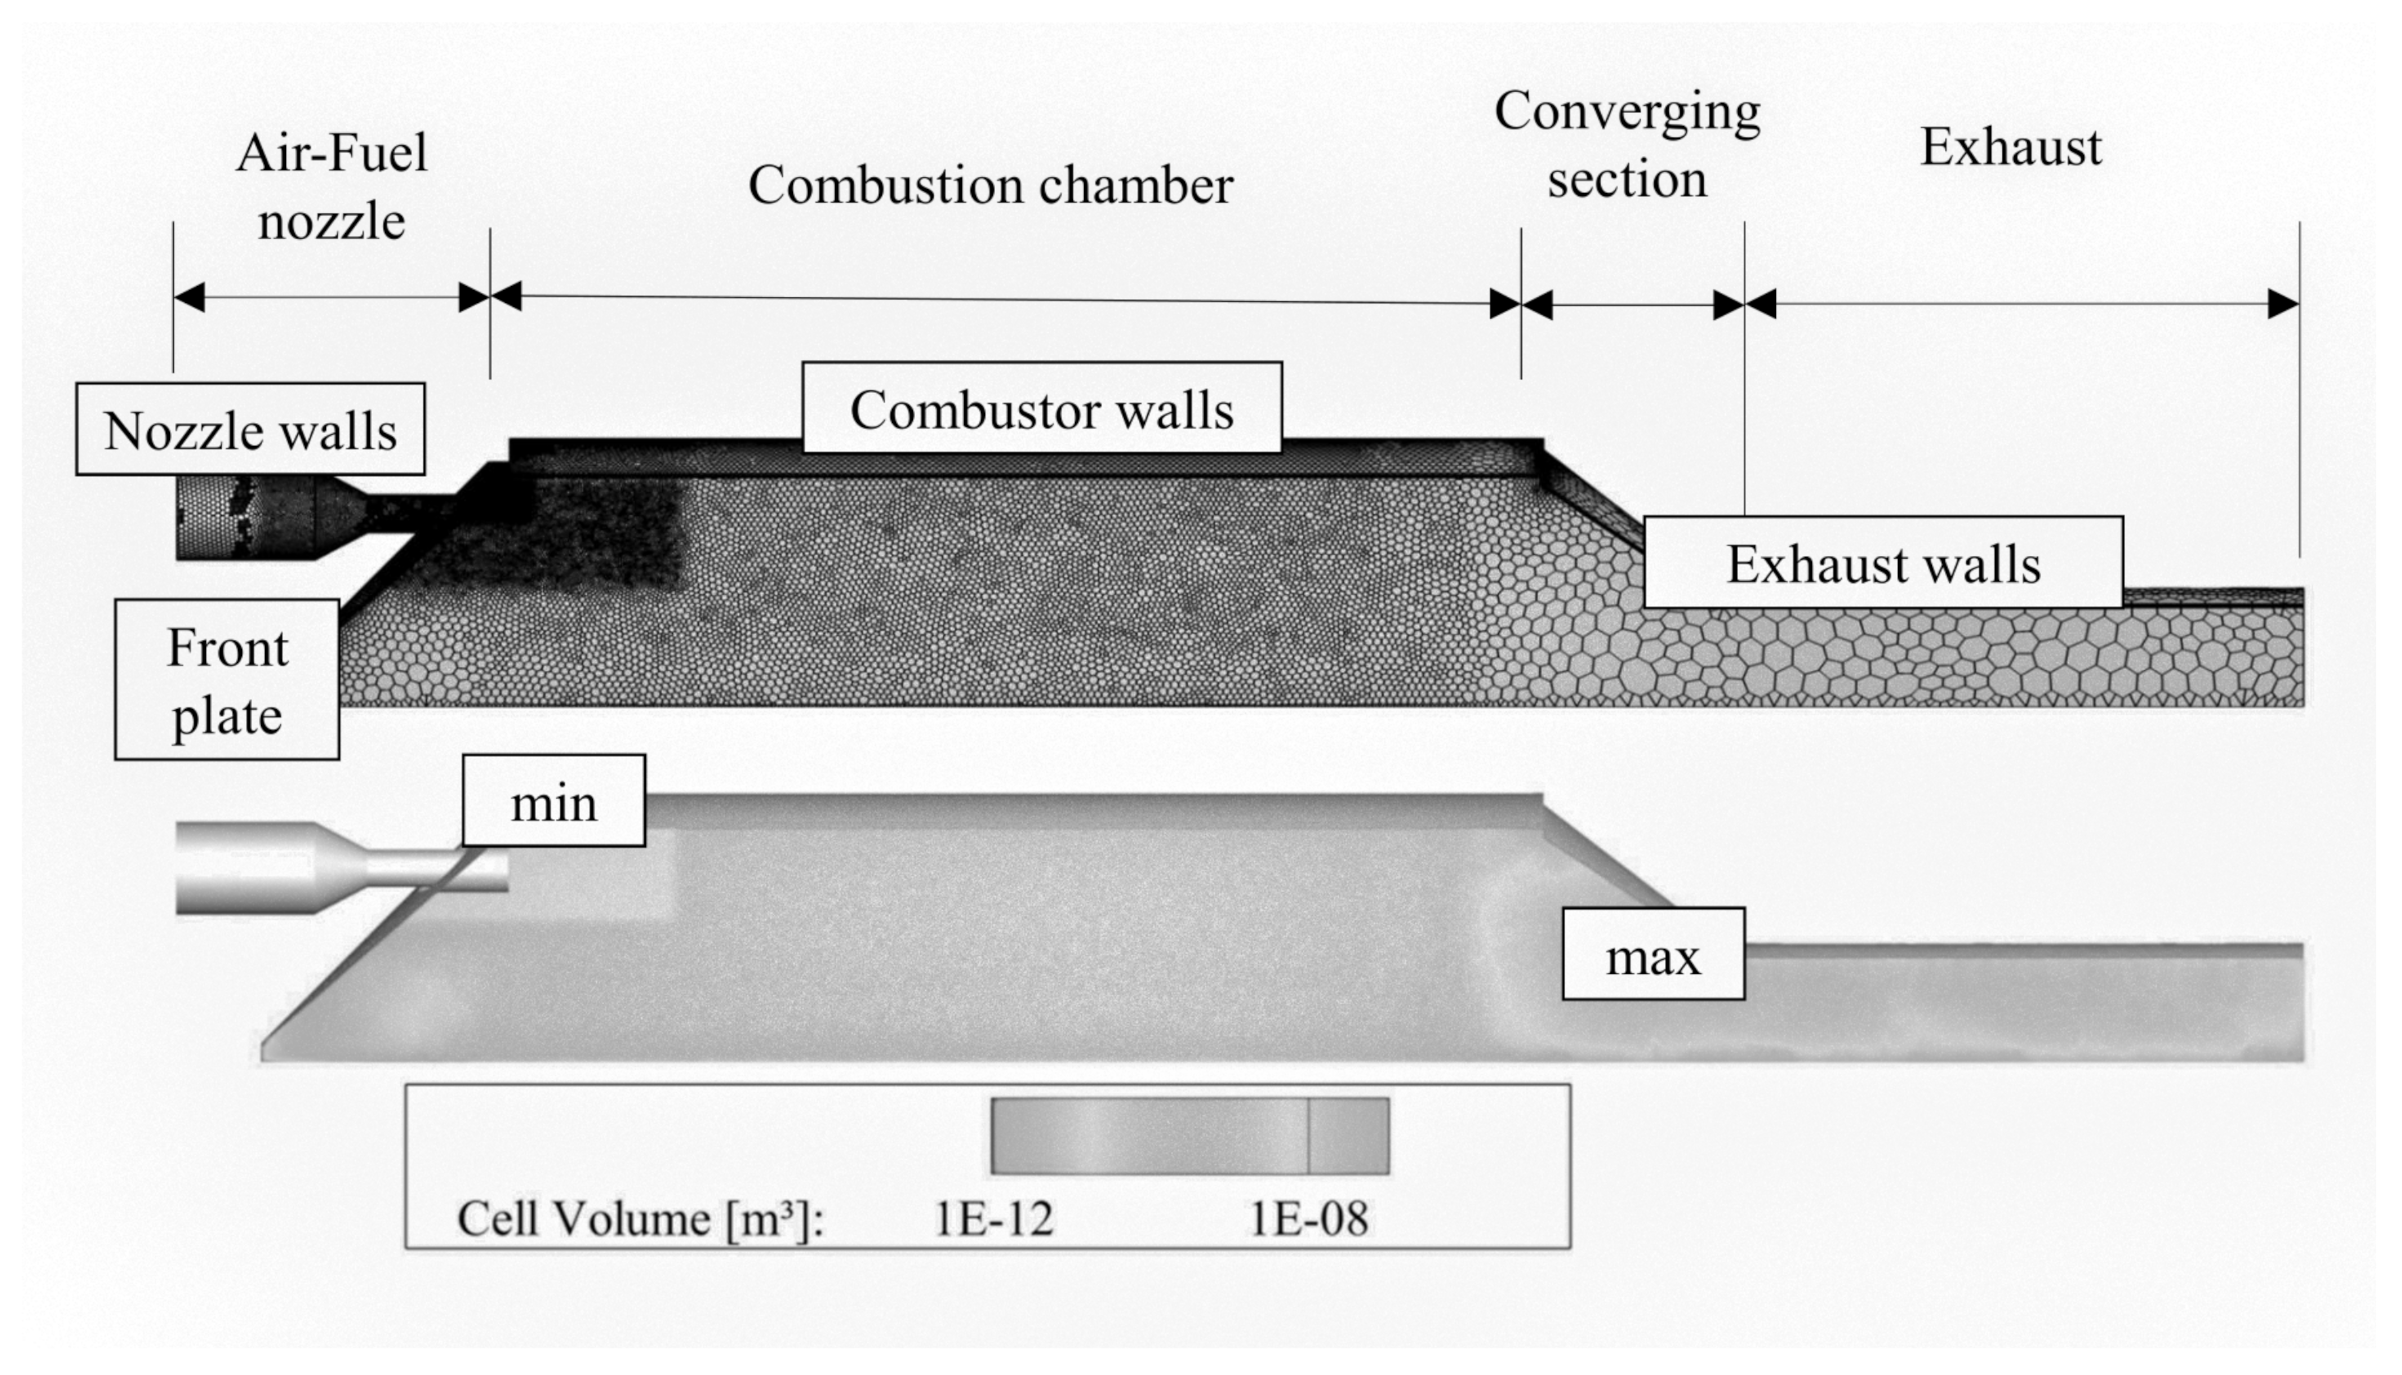
3.1. Numerical Setup

The numerical setup is shown in Figure 5. A 60 degree segment of the burner is explicitly simulated in order to save computational time and ease the reactor network creation.
The grid consists of 796 k polyhedral elements with 238 k nodes. This means there is an improvement compared to previous studies [46], where pure tetrahedral grids were used in terms of convergence and computational speed. However, a grid study in the previous work [46] gives a solid orientation on required local grid resolution.
All simulations are carried out in Ansys Fluent. The mesh is refined in the reaction, recirculation, and especially the mixing zones close to the burner entry. Steady-state RANS simulations are performed with a SIMPLE solution strategy. Since the k ω -SST turbulence model is used, near-wall regions are refined with prism layers that suffice y + 1 for the first near-wall cell layer. Ten prism layers are inserted with a growing rate of 10 % towards the flow domain. The k ω -SST turbulence model is chosen, since the flow field is highly influenced by wall effects but air-fuel jets issuing into the combustion chamber should be modeled with free stream effects. Its transport equations have the form
t ( ρ k ) + x i ( ρ k u i ) = x j Γ k k x j + G k Y k ,
t ( ρ ω ) + x i ( ρ ω u i ) = x j Γ ω ω x j + G ω Y ω ,
where ρ denotes density, k is the turbulent kinetic energy, and ω is the turbulence frequency. G are production terms, Γ are effective diffusivities, and Y are dissipation terms due to turbulence. The production terms are evaluated with G k = μ t S 2 , with the turbulent viscosity μ t and the modulus of the mean rate of strain tensor S, and G ω = ( α α * ) / ν t G k , with the turbulent kinetic viscosity ν t . Dissipative terms follow Y k = ρ β * k ω and Y k = ρ β ω 2 . α i and β i are evaluated with blending functions
α m = F 1 α m , 1 + ( 1 F 1 ) α m , 2 ,
β n = F 1 β n , 1 + ( 1 F 1 ) β n , 2 ,
where formulations for α m and β m can be found in the literature [47]. As a particularity, the eddy viscosity of the k ω -SST turbulence model is treated with
μ t = ρ k ω ( max [ 1 α * , S F α 1 ω ] ) 1 ,
the explicit formulation of which can also be taken from the literature [47]. All model constants are taken as standard model values; particular values for the k ω -SST model are
σ k , 1 = 1.176 ; σ k , 2 = 1.0 ; σ ω , 1 = 2.0 ; σ ω , 2 = 1.168 ;
α 1 = 0.31 ; β i , 1 = 0.075 ; β i , 2 = 0.0828 .
Combustion is depicted with the eddy dissipation concept (EDC), whereas a detailed reaction scheme from Li et al. [48] is employed for the modeling of methane combustion kinetics. Since FLOX® combustion shows a large range of combustion regimes due to partial or technical premixing of fuel and air, it is essential to provide a combustion scheme that features combustion based on local kinetics rates. The EDC therefore allows for this. It is driven by the main assumption that the reaction occurs in small turbulent structures, as in jet-and-recirculation stabilized FLOX® systems. Those length fractions are modeled with
ξ = 2.1377 ν ϵ k 2 0.25 ,
and species are assumed to react over a time scale
τ = 0.4082 ν ϵ 0.5 .
In practice, multiple constant pressure reactors are solved, where initial conditions are the local species and temperature of a computational cell. This approach for combustion modeling has been proven to be feasible from the experience of FLOX® system reacting computations. The combustion source term consequently results as
R i = ρ ( ξ ) 2 τ [ 1 ξ 2 ] ( Y i * Y i ) ,
where Y i * is the fine-scale species mass fraction after reaction with the previously defined time scale.
First, a cold flow simulation is established, the results of which are compared to experimentally gained velocities from PIV. Combustion is then simulated with the previously introduced model framework. Reactor network modeling is finally carried out on the basis of the reacting field solution, taking into consideration velocities, temperatures, and local compositions.
In terms of boundary conditions, mass flows are specified at the domain inlets for fuel and air, whereas a pressure outlet boundary condition is set. As thermal boundary conditions, only inlet temperatures are predefined. Heat losses are applied as a parametric study on selected reactors later for the constructed network model, since heat loss has great effects on the prediction of pollutant emissions.
Heat losses applied to the system also account for radiation heat loss, which is not explicitly modeled in the CFD simulations.

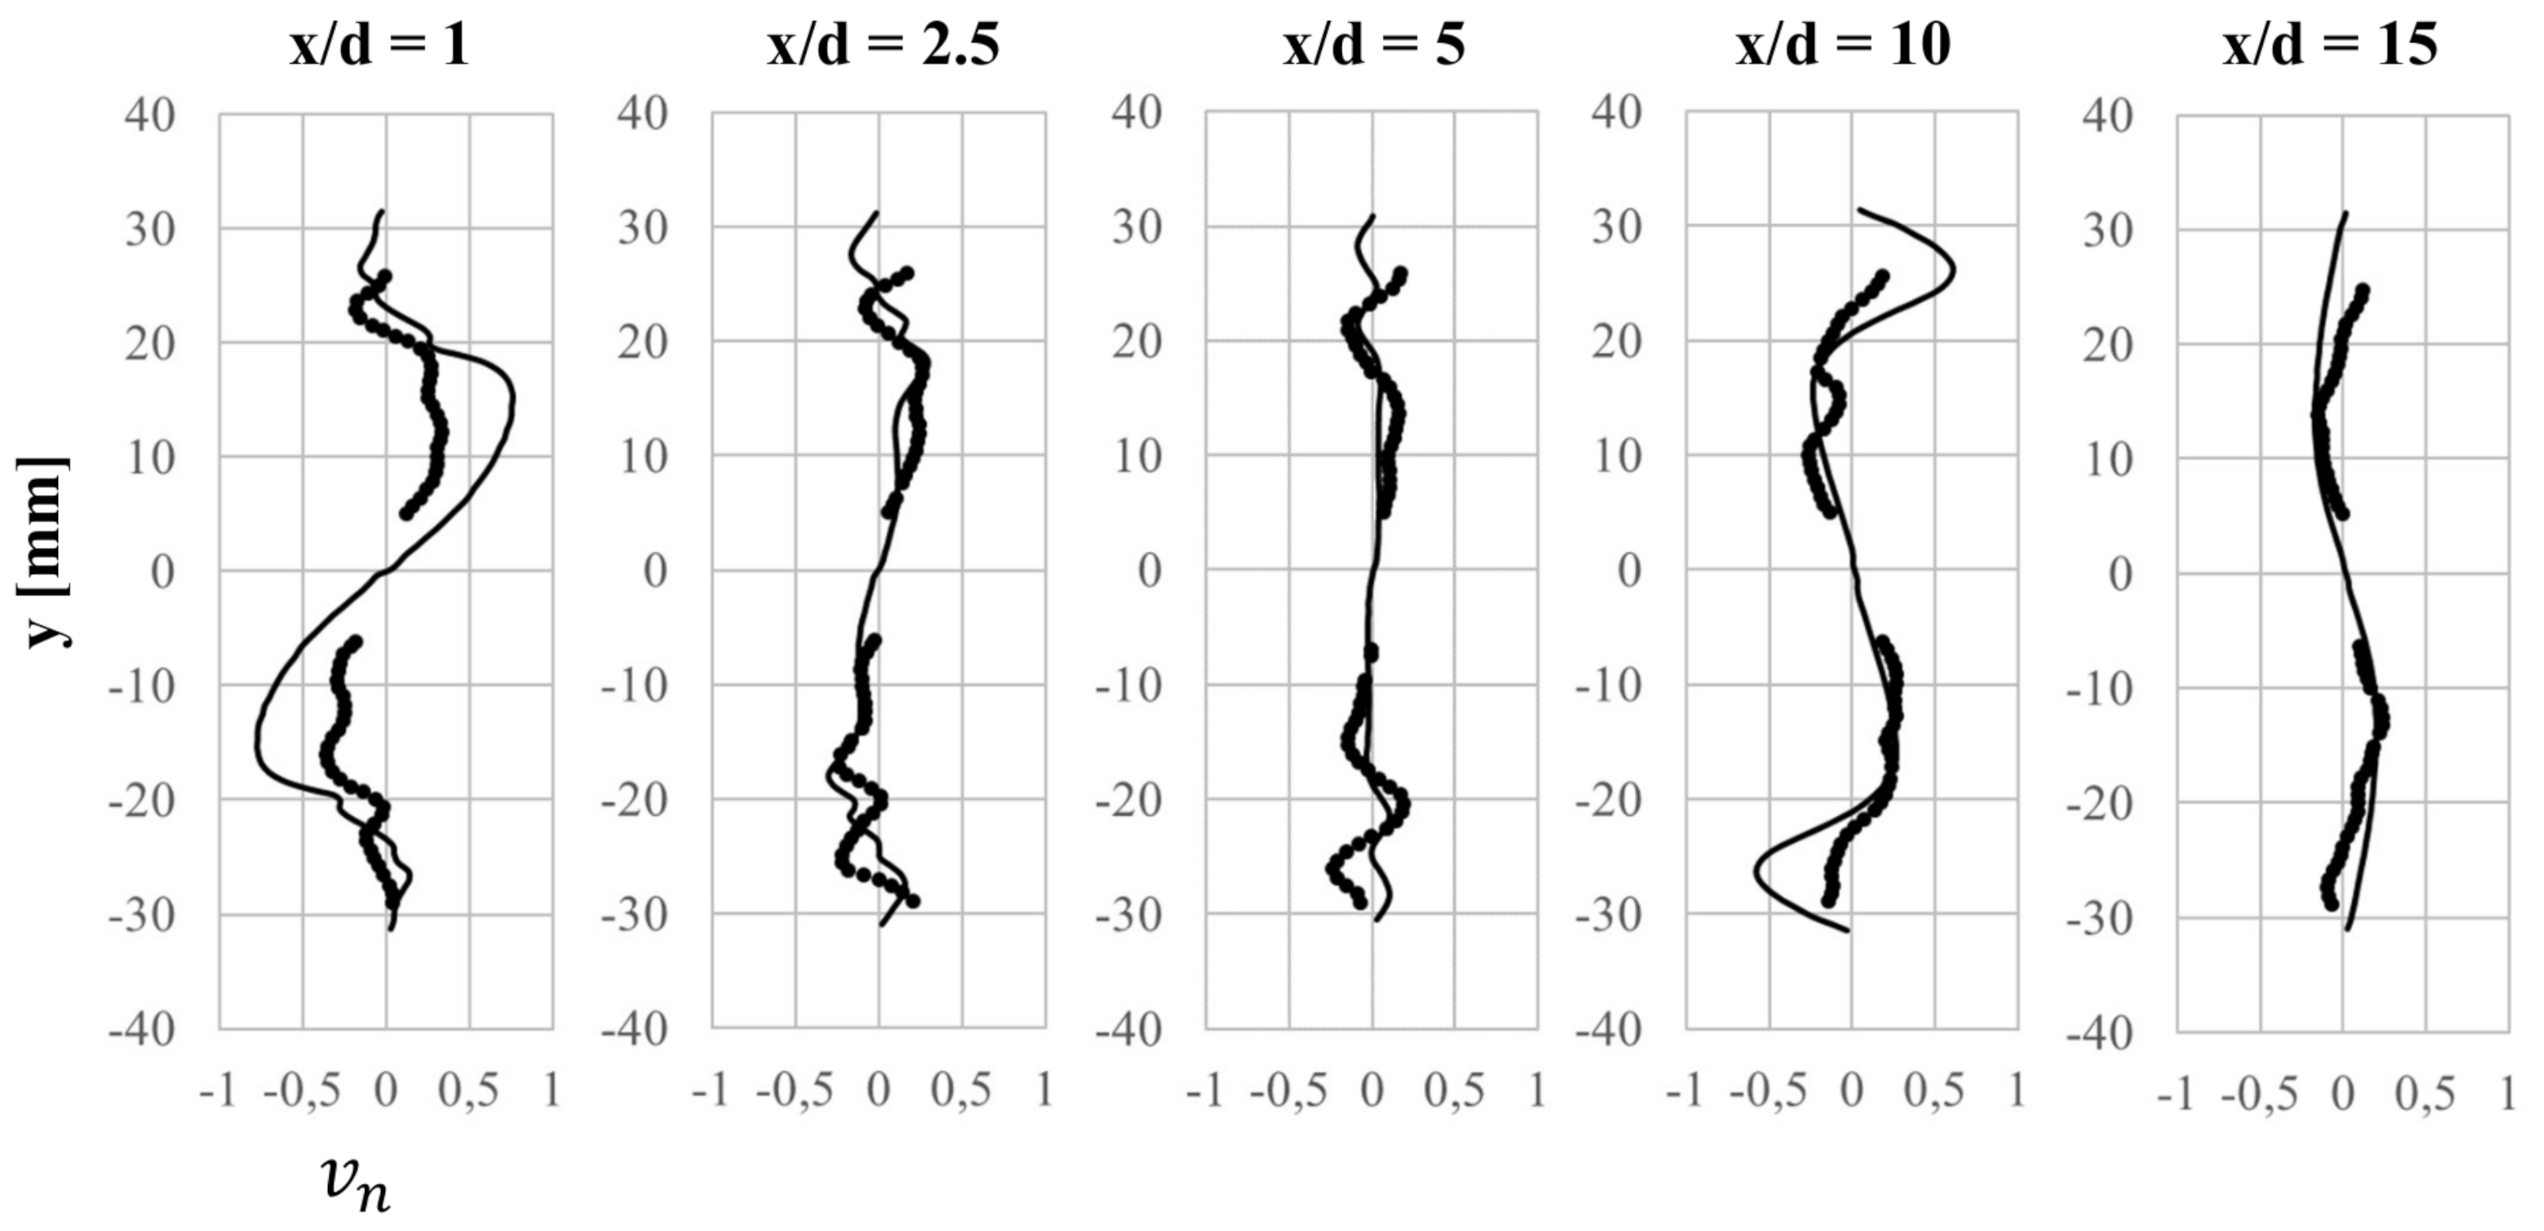
3.2. Validation with Experiments

Compared are averaged axial and radial velocities from PIV measurements with CFD velocities and flame surface density (FSD) from optical OH* chemiluminescence and specific reaction heat from the numerical simulations. The validation of the velocity field is carried out based on results in Figure 6, Figure 7 and Figure 8.
Axial velocities in Figure 6 show in total excellent agreement between experiment and numerical CFD simulation. Velocity peaks induced by the high-momentum jets are well depicted in terms of lateral position and velocity magnitude. In addition, the inner recirculation zone in terms of magnitude and extension is well met by the simulation, denoted by the negative values around the burner center axis. Deviations between measurements and simulation are present at the profile line x / d = 10 ; however, it becomes obvious that the experimental profiles show a strong asymmetry despite the symmetry of the burner setup and therefore larger downstream uncertainties are assumed in the experiment.
Another deviation from experiments becomes evident from Figure 8, where a field plot from PIV streamlines is compared with a CFD midplane cut of axial velocities (right side comparison). There, the location of the downstream stagnation point is farther downstream compared to the experimental value, which is, however, not expected to induce major errors in the reactor networks, since this deviation is relatively far away from the upstream reaction zones. In total, the axial velocity field from CFD is close enough to experimental findings in order to apply low-fildelity reactor network modeling.
Radial velocities are compared in Figure 7. Experimental and numerical data are normalized with the same peak value as in the axial velocities and therefore the data are depicted with an upscaling of a factor of eight. In total, the numerical values nicely represent the characteristics of the experimental findings; however, larger deviations can be observed for x / d = 1 and x / d = 10 . Those deviations are rated as of minor importance for the extraction of reactor networks, since radial velocities play a minor role in the overall flow field compared to the axial velocity, due to the overall large axial momentum of the flow in the combustion chamber. Deviations for x / d = 10 are pronounced by the factoring of the results, as previously introduced. Another aspect is assumed in an overprediction of inner recirculation zone extension in the combustor that can lead to increased radial velocities towards the stagnation point at this downstream position.
Chemical reactions are evaluated with a qualitative comparison between flame surface density and specific reaction heat in Figure 8. Lift-off heights between experiment and numerical simulation are in good agreement, whereas the spatial extension of the reaction zone is much more volumetric compared to the simulation. Possible explanations for this are that intermediate species production is under-predicted by the chemical kinetics reaction mechanism on the simulation side or that optical measurement results are scaled differently compared to CFD findings, resulting in regions that are less prominent in terms of reaction being highlighted more in the experiment.
This is, however, a general trend that has been seen in preceding simulations [42] and is not expected to be improved by parametric studies regarding reaction schemes or combustion models.

4. Reaction Network Modeling

This section consists of setup, modeling procedure, and results of ERN modeling with the Ansys Energico and Chemkin tool chain.

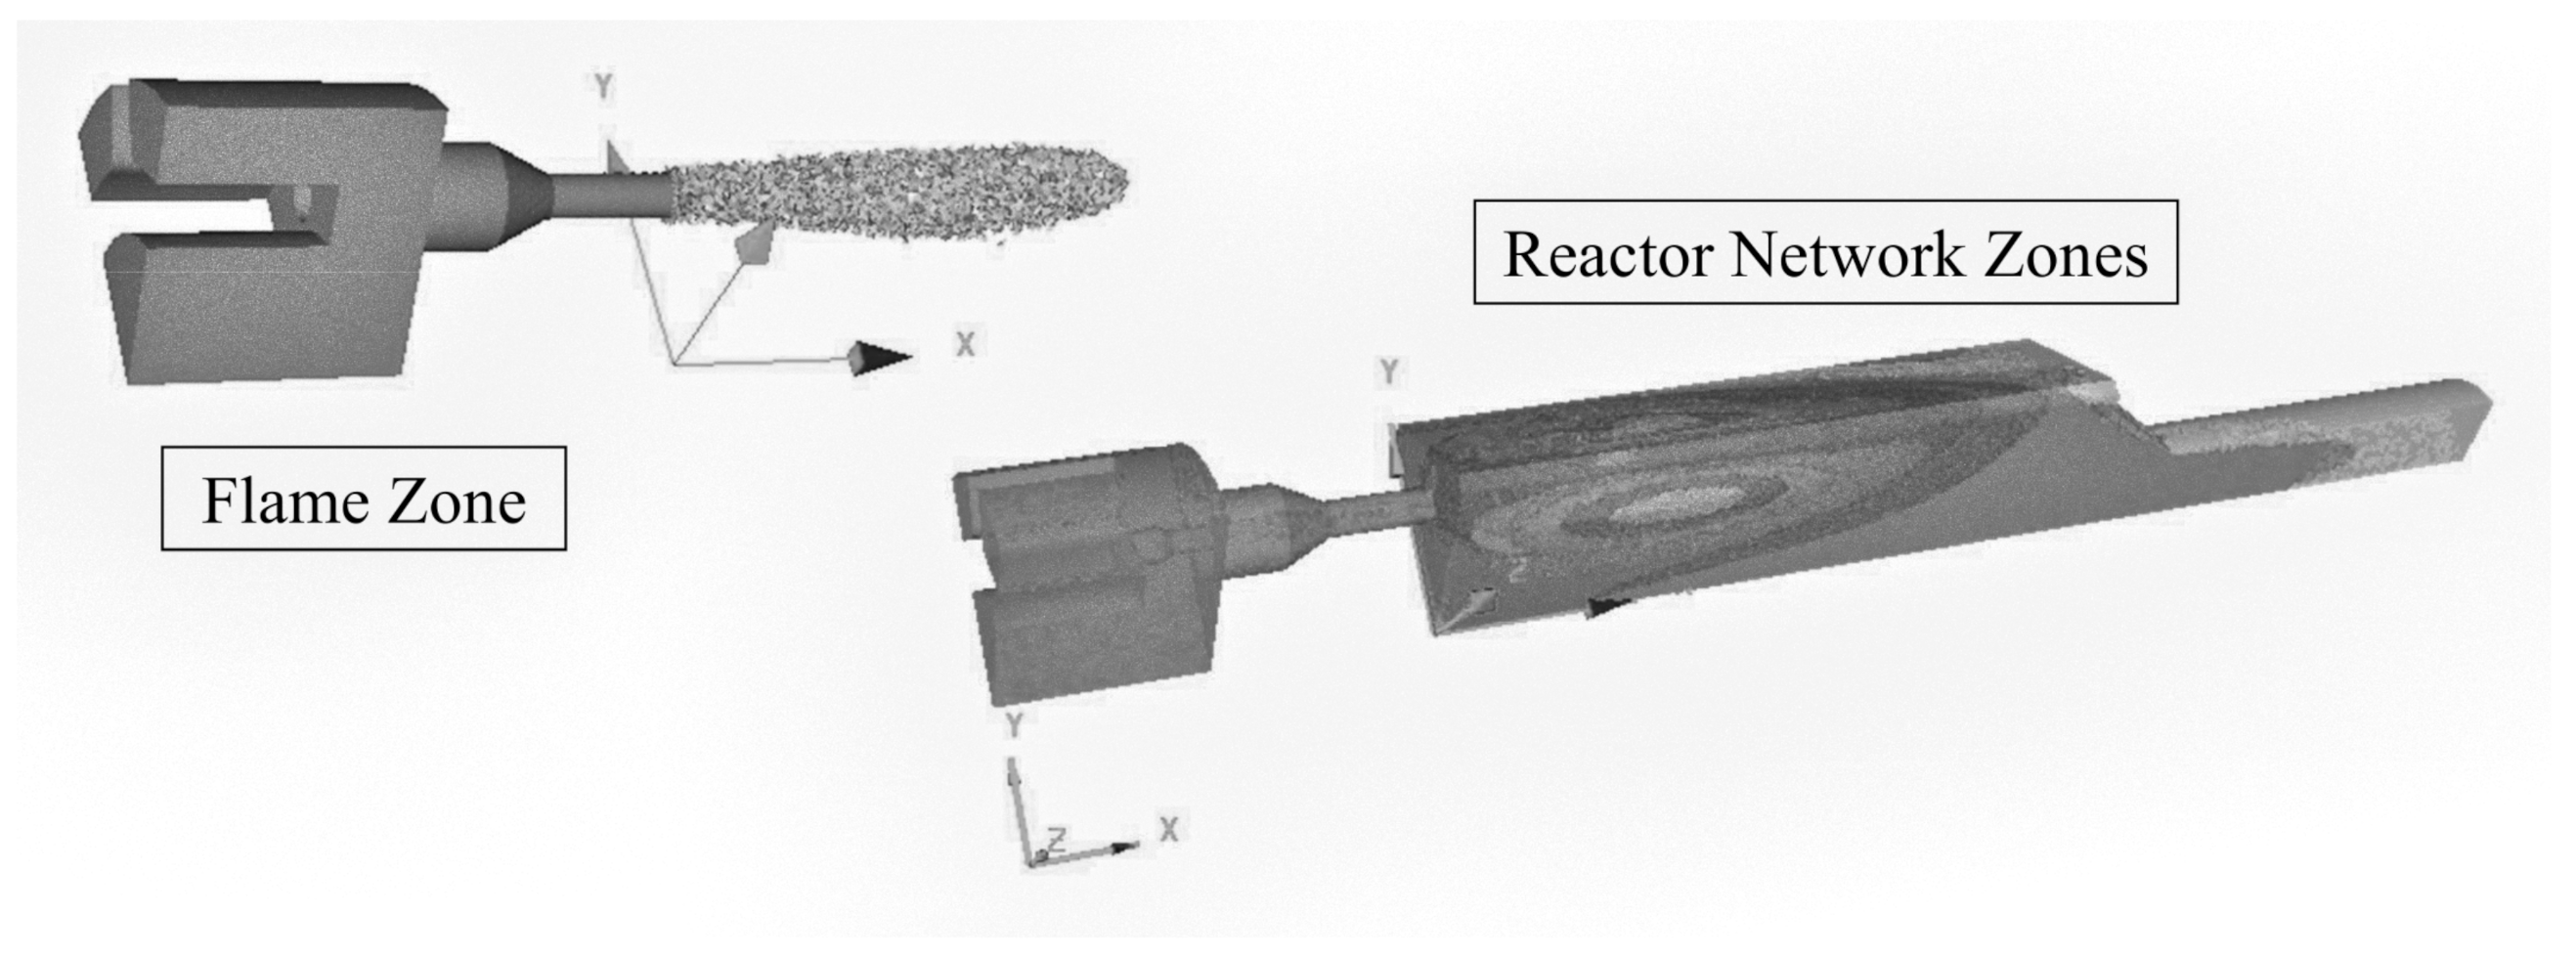
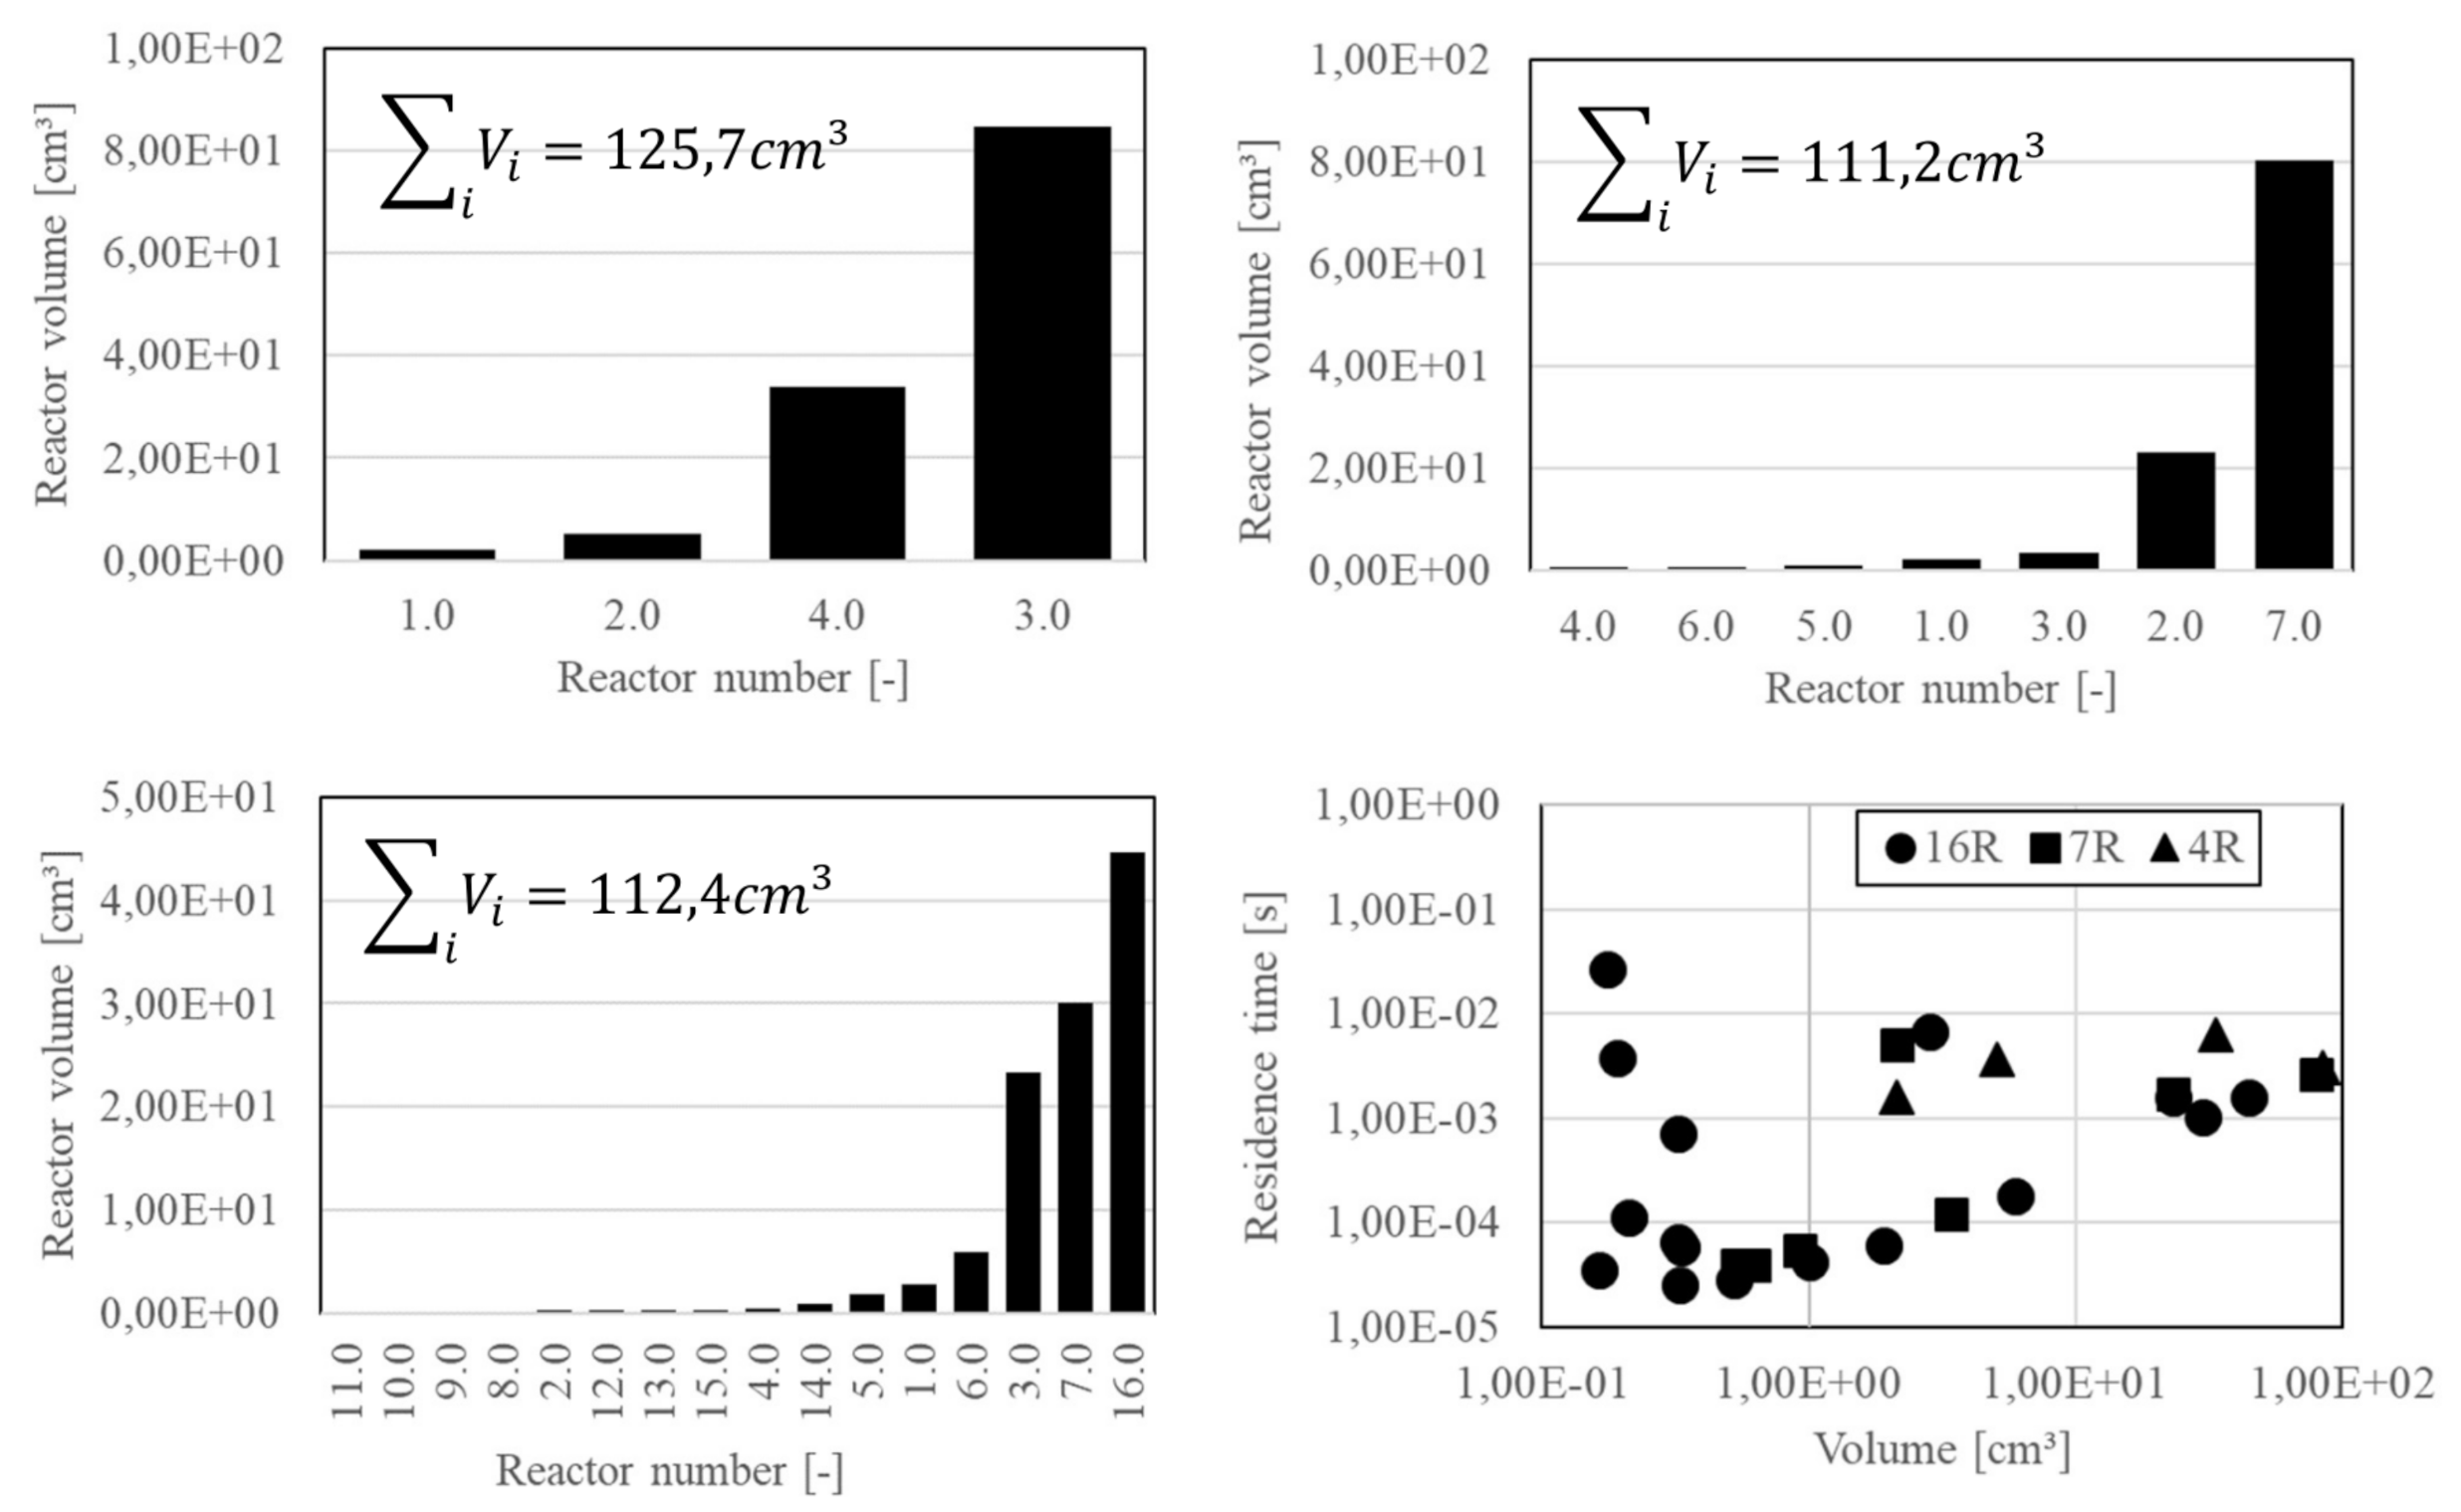
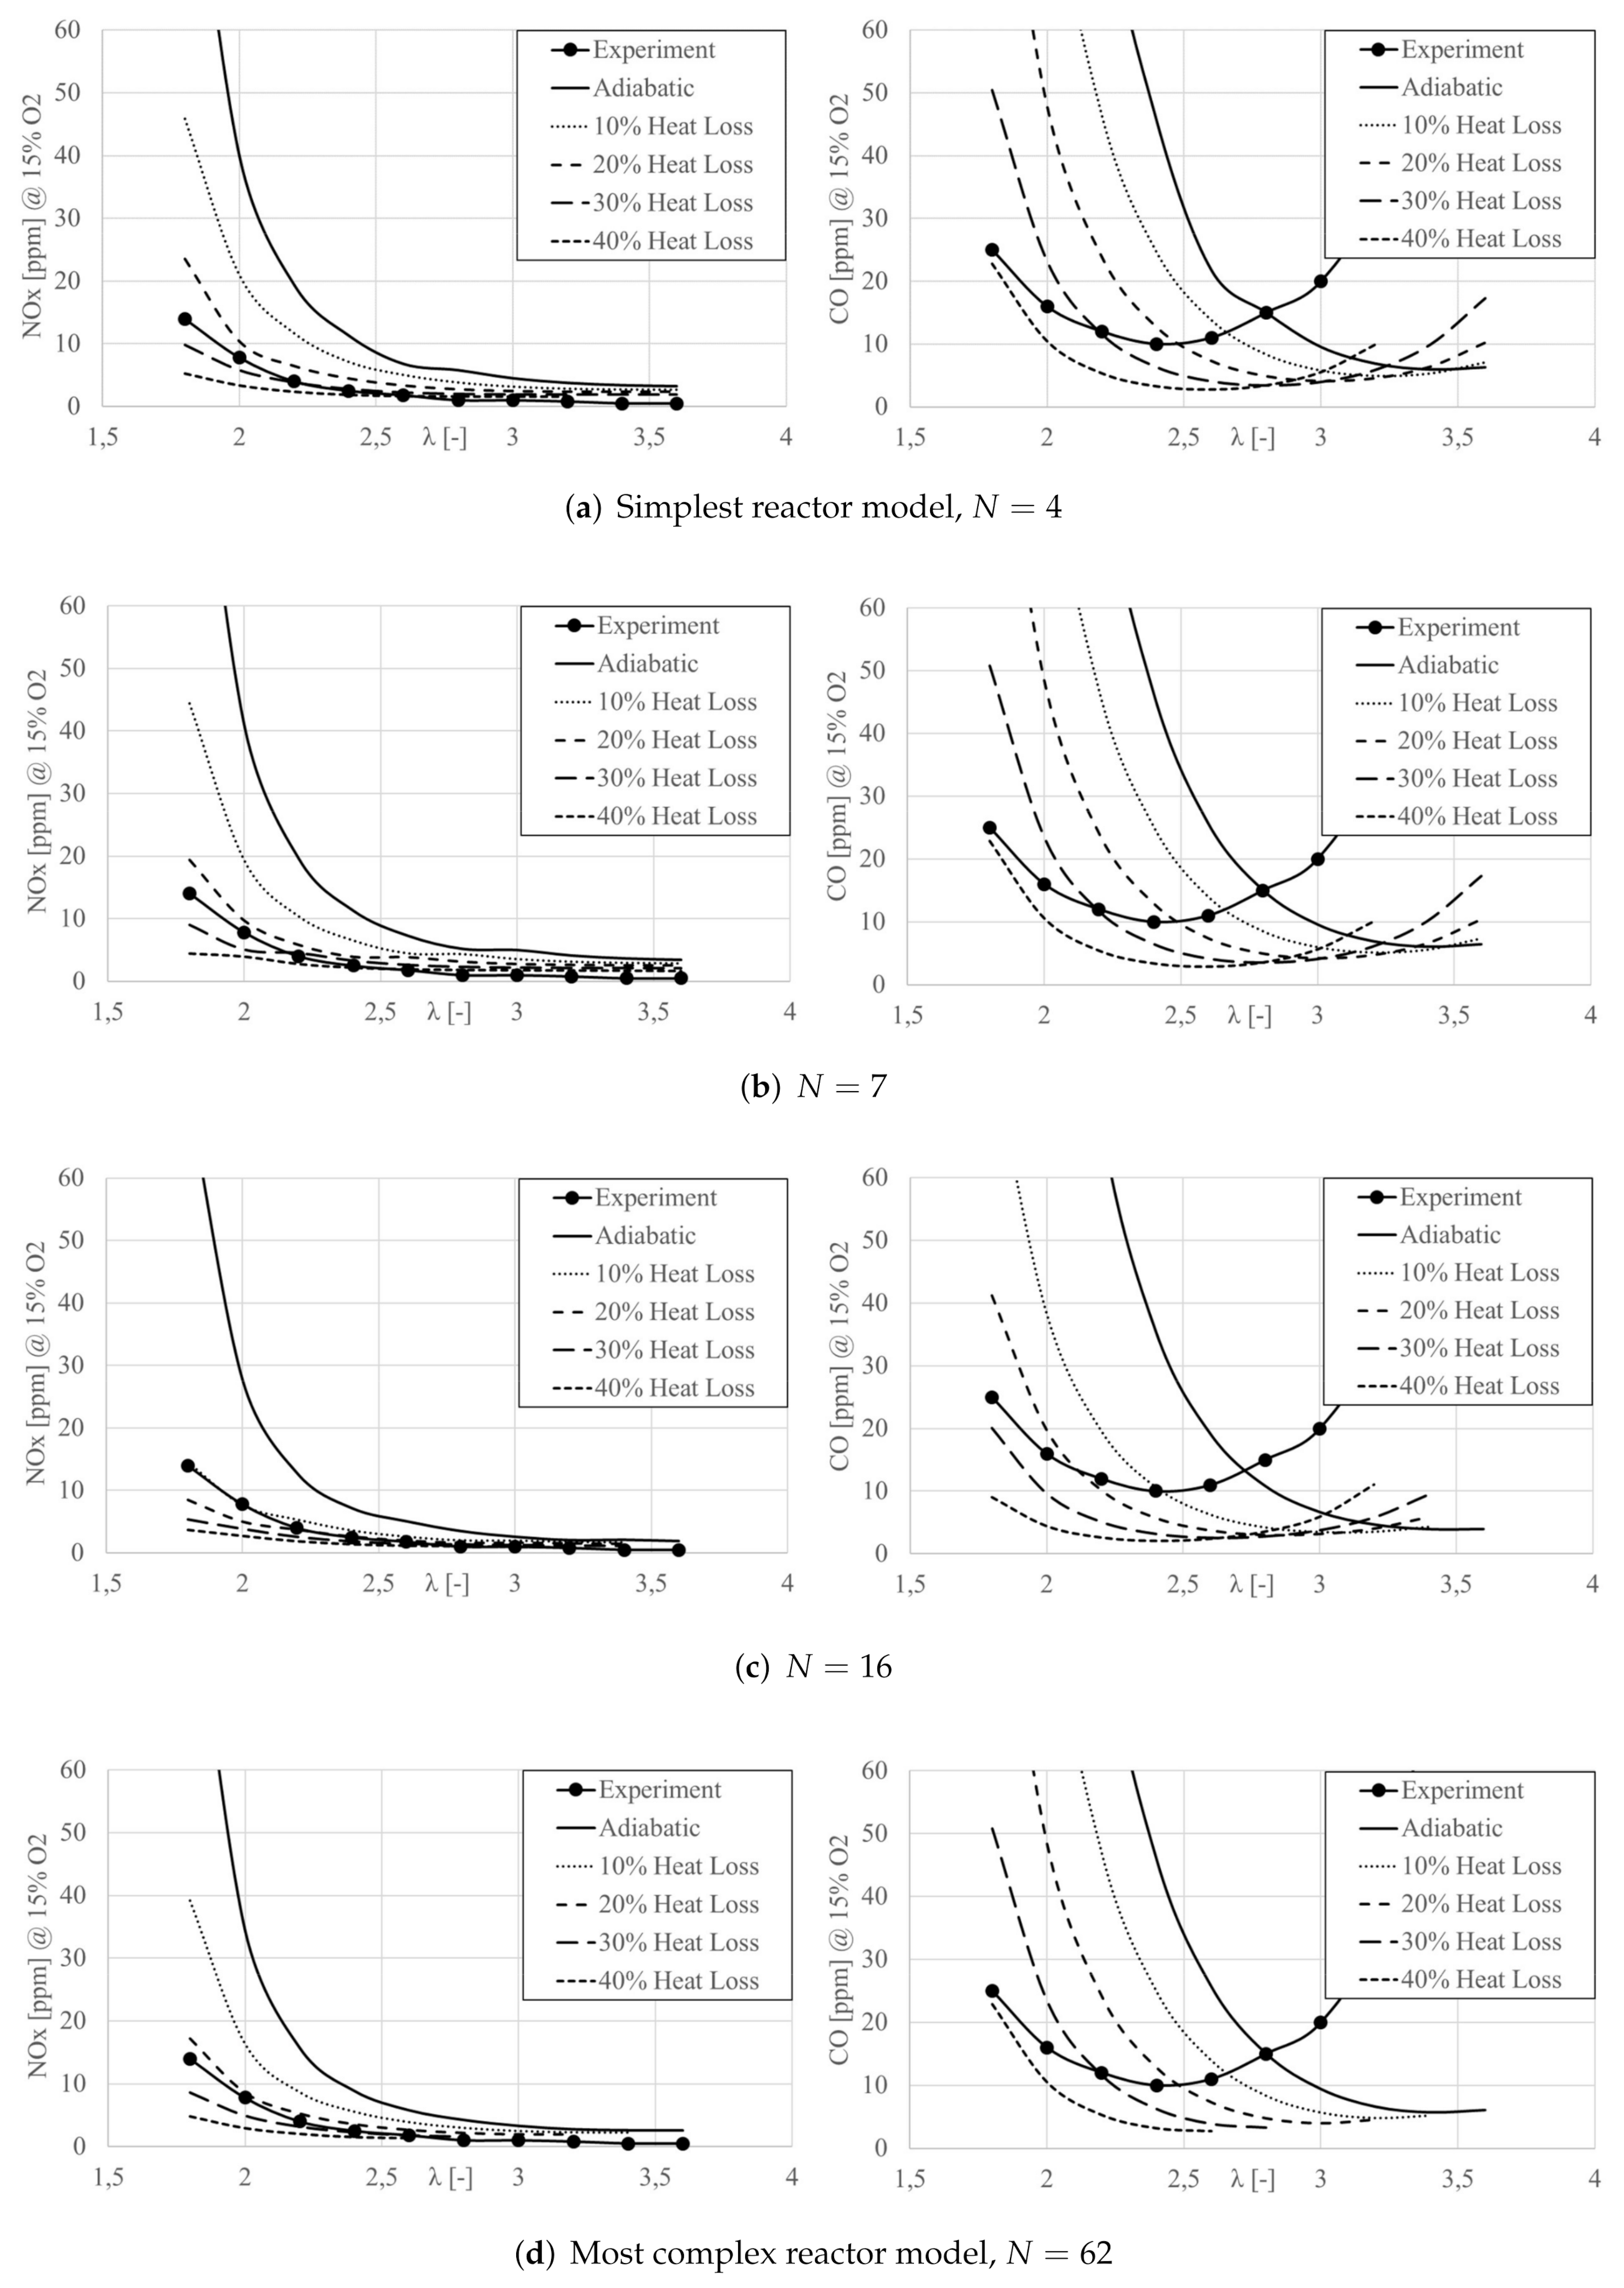
4.1. Setup and Modeling Procedure

A major aspect of the presented work is the comparison of manually and algorithmically constructed ERN models. The manually constructed network denotes the most simple one. Alignment and distribution of reactors is shown in Figure 9.
The reactor network in Figure 9 consists of mainly PSR (perfectly stirred reactor) elements, which are clustered for the chemistry solver Chemkin. Fuel and air are fed separately to the system, as in the real FLOX configuration. The PSR cluster consists of elements for the upstream mixing section, a reaction, and a large recirculation zone. The burner exhaust section is modeled with a PFR (plug flow reactor) element.
This most simple model is compared with algorithmically created networks. Filtering of reactors for the sections mixing, combustion, and recirculation is based on the local temperature gradient. Therefore, a flame zone is identified and based on the temperature; most reactor sections are gathered around the flame zone, as indicated in Figure 10.
In order to test different degrees of ERN resolution, the filter width based on temperature is adapted in Energico, resulting in different network models, which are shown in Figure 11. Three different reactor networks are investigated, mainly differing in the number of PSR reactor elements. As becomes obvious from Figure 11, a decreased filter width results in a higher reactor resolution in the mixing, reaction, and recirculation zones. This is expected due to the fact that temperature gradients are used as filtering criteria and the largest temperature gradients are present in the mixing and combustion section.
Again, for the algorithmically created networks, PSR elements are clustered and solved iteratively by Chemkin, before the PFR section is computed. An energy equation is solved for each PSR element, in the algorithmically created networks as well as in the manually created setup.
In cases where heat loss due to convection and radiation is applied to the network, at first adiabatic simulations are carried out. Therefrom, reactors with a significantly increased heat production rate are identified. Heat loss is then applied to those PSR reactors. Different methods of heat loss application to the whole PSR cluster with even distribution were tested but resulted in non-converging Chemkin computations.
For all investigated cases, the detailed GRI3.0 reaction scheme is used for the chemical properties in the Chemkin simulations. Computational turnaround times are in the order of magnitude of seconds for the manually created network and range up to minutes for the largest investigated network with 62 PSR elements.

4.2. Results and Discussion

Selected reactor network statistics are shown in Figure 12. Compared are the automatically and manually reproduced distributions of reactor volumes and residence times. It has to be noted that the manually created ERN was constructed and solved prior to automatic network generation with the more complex cases.
From the statistics in Figure 12, it appears that the manually created network considers an overall slightly higher network volume of the combustor compared to the automatically created 7R and 16R cases; however, absolute values and the distribution of volumes are similar. Automatically created networks for 7R and 16R consider almost identical total volumes, indicating a highly consistent network composition method, where ERN refinement takes place within the reaction zone regions.
In terms of residence times, as shown in the bottom-right figure of Figure 12, similar ranges are covered for all displayed cases, whereas the more detailed 16R network adds information for smaller reactors in terms of volume with a relatively broad range of residence times. It has to be concluded from detailed emissions results, whether this leads to significantly different results compared to the more simple ERNs. However, the depiction of similar residence times of the 7R and 16R cases with respect to the ERN volumes further substantiates that automatic ERN creation is consistent in terms of reproduction of chemical properties from CFD.
Detailed results of the emissions calculations with Chemkin are displayed in Figure 13. Shown are emissions simulation results compared with experimental data for NOx and CO over air-fuel number λ for different degrees of reactor network model fidelities. For each study, the applied heat loss is varied in a sensible range for atmospheric testing [49].
From a qualitative standpoint, NOx and CO trends over air-fuel number give a good representation of experimental findings, for all investigated levels of model fidelity (numbers of PSR reactors). For NOx the trends are more distinctive towards less heat loss applied and vice versa for CO. Another global observation is that no general improvement can be stated with increasing degree of model fidelity. It therefore appears feasible to use a simple CFD discretization approach with reactors in order to obtain estimations for emissions in the combustor design process, which is highly beneficial, since very simple and robust design studies can be carried out.
In terms of heat loss application to the ERN, it can be stated that values between 20 and 30% with respect to overall fuel energy content give the best agreement with experimental findings for NOx and towards 40% heat loss application for CO prediction. As shown in preceding studies, those fractions represent realistic values [49].
At this point it has to be stated that results shown in Figure 13 predict absolute values of emissions; results are not artificially scaled. Therefore, overall agreement is in a quantitative agreement that allows for reliable consideration of the method for combustor design.
As previously stated, having an idea about the amount of heat loss in a system is important in order to obtain quantitative emissions predictions. This plays a major role for either NOx or CO simulation results. From a combustor design point of view it is crucial to find an optimum range in which the system operates. As shown in Figure 13, NOx developments are nicely reproduced by the ERN and therefore it is possible to derive the optimum operation in terms of NOx, which is expected at higher air-fuel numbers.
Characteristic troughs of CO emissions are also qualitatively reconstructed with the ERN approach, almost regardless of the degree of model fidelity. Higher values of CO are due to a hindered reaction of CO to CO2. The overall trough shape is displaced towards lower air-fuel numbers for increasing heat loss, which is plausible, since this effect is more pronounced the more heat loss is applied to the system. Surprisingly, with increased model fidelity, the trough shape of CO emission curves is more poorly predicted. The main reason for this circumstance is assumed to be the application method of heat loss on reactors with pronounced chemical reaction. With higher model fidelity (increased number of PSRs), the reaction is more distributed to more reactor elements. This leads to computational instabilities when a significant amount of heat loss is applied and consequently regions with larger air-fuel number give no sensible results. Thus, using a more robust ERN model with a smaller number of reactors is not only more applicable in practical situations, but also results in better prediction of CO emissions values.
The emissions prediction results in Figure 13 furthermore show an inconsistency for N = 16 , where CO increasing towards richer regimes is displaced to richer conditions, compared to the other results. This is presumably also linked to inaccuracies in heat loss application to selected reactors. A more differentiated application of heat loss to selected reactors based on location in the combustor is, however, not always workable, especially when network model fidelity increases.
Overall it can be stated that the presented approach is highly suitable for application in combustor design, since it is possible to pre-estimate optimum operation conditions in terms of NOx and CO emissions.

5. Conclusions

A low-order reactor network approach for the prediction of NOx and CO emissions in a FLOX® combustor design was introduced, validated, and discussed. The approach was tested on the basis of an atmospheric test rig with a large experimental data set. The approach relies on the construction of reactor networks based on CFD data and solution in Ansys Chemkin. Therefore, CFD results were successfully validated with experimental velocities from PIV and flame shape and position from chemiluminescence measurements.
Subsequently, networks with different degrees of fidelity (number of PSRs) and several degrees of heat loss application were studied. It was shown that all reconstructed chemical reactor networks were able to reliably predict emissions trends as a function of global air-fuel number. Even very low-order networks that were manually created with CFD results as guidance showed good results in terms of reproduction of experimental findings. In terms of NOx values, the ERN models were able to predict absolute emissions values with realistic values of heat loss application. For CO emissions, the ERN models were able to provide emissions levels in the correct order of magnitude and an orientation for the measured optimum operation conditions. However, the approach showed weaknesses in the prediction of CO emissions, especially when model fidelity was increased, presumably due to modeling issues.
Heat loss application to the Chemkin ERN model is a clear weakness of the approach, since it can lead to computational instabilities, especially in regimes with high air-fuel numbers and larger amounts of heat loss. Different approaches for heat loss application to the system were tested, like global application to the PSR cluster or application to fixed reactors. The most practical approach was the application to reactors with significant heat production, which then have to be identified a priori.
Overall the method can be seen as highly suitable for combustor design applications, since it is easy to use and features computational turnaround times in the order of minutes, even for a larger amount of PSR elements. In such cases, the modeling effort exceeds the computational times by far. The approach can be readily applied to large-scale combustion, industrial applications, or combustor applications in actual gas turbines.

Funding

This research received no external funding.

Institutional Review Board Statement

Not applicable.

Informed Consent Statement

Not applicable.

Data Availability Statement

Not applicable.

Acknowledgments

Aurelia Drude from the German Aerospace Center (DLR) is gratefully acknowledged for the provision of Chemkin Pro simulation data.

Conflicts of Interest

The author declares no conflict of interest.

Abbreviations

The following abbreviations are used in this manuscript:
CFDComputational fluid dynamics
DESDetached eddy simulation
DLRGerman Aerospace Center
EDCEddy dissipation concept
EDMEddy dissipation model
ERNEmission reactor network
FLOX® Flameless oxidation
FSDFlame surface density
LBOLean blow-out
LESLarge eddy simulation
MGTMicro gas turbine
MILDModerate or intense low oxygen dilution
MTTMicro Turbine Technology b.v.
PFRPlug flow reactor
PIVParticle image velocimetry
PSRPerfectly stirred reactor
RANSReynolds-averaged Navier–Stokes
UHCUnburned hydrocarbon

References

  1. Bundesministerium fuer Umwelt, N.u.R. TA Luft. 2021. Available online: http://www.verwaltungsvorschriften-im-internet.de/bsvwvbund_18082021_IGI25025005.htm (accessed on 1 January 2022).
  2. Nguyen, T. Improved Chemical Reactor Network Application for Predicting the Emission of Nitrogen Oxides in a Lean Premixed Gas Turbine Combustor. Combust. Explos. Shock Waves 2019, 55, 267–273. [Google Scholar] [CrossRef]
  3. Zeldovich, Y. Oxidation of Nitrogen in Combustion and Explosions. In Selected Works of Yakov Borisovich Zeldovich, Volume I; Princeton University Press: Princeton, NJ, USA, 1992. [Google Scholar] [CrossRef]
  4. Fenimore, C. Formation of nitric oxide in premixed hydrocarbon flames. Symp. (Int.) Combust. 1971, 13, 373–380. [Google Scholar] [CrossRef]
  5. Malte, P.; Pratt, D. Measurement of atomic oxygen and nitrogen oxides in jet-stirred combustion. Symp. (Int.) Combust. 1975, 15, 1061–1070. [Google Scholar] [CrossRef]
  6. Gruhlke, P.; Beck, C.; Janus, B.; Kempf, A. LES Analysis of CO Emissions from a High Pressure Siemens Gas Turbine Prototype Combustor at Part Load. Energies 2020, 13, 5751. [Google Scholar] [CrossRef]
  7. Lieuwen, T.; Yang, V. Gas Turbine Emissions; Cambridge University Press: Cambridge, UK, 2013. [Google Scholar] [CrossRef]
  8. Lovett, J.; Abuaf, N. Emissions and Stability Characteristics of Flameholders for Lean-Premixed Combustion. In ASME Turbo Expo; ASME: New York, NY, USA, 1992; 92-GT-120, V003T06A017. [Google Scholar] [CrossRef] [Green Version]
  9. Nguyen, Q.; Edgar, B.; Dibble, R.; Gulati, A. Experimental and Numerical comparison of extractive and in situ laser measurements of non-equilibrium carbon monoxide in lean-premixed natural gas combustion. Combust. Flame 1995, 100, 395–406. [Google Scholar] [CrossRef]
  10. Howard, J.; Williams, G.; Fine, D. Kinetics of carbon monoxide oxidation in postflame gases. Symp. (Int.) Combust. 1973, 14, 975–986. [Google Scholar] [CrossRef]
  11. Bulat, G.; Jones, W.; Marquis, A. NO and CO formation in an industrial gas-turbine combustion chamber using LES with the Eulerian sub-grid PDF method. Combust. Flame 2014, 161, 1804–1825. [Google Scholar] [CrossRef]
  12. Jaravel, T.; Riber, E.; Cuenot, B.; Bulat, G. Large Eddy Simulation of an industrial gas turbine combustor using reduced chemistry with accurate pollutant prediction. Proc. Combust. Inst. 2017, 36, 3817–3825. [Google Scholar] [CrossRef]
  13. Wegner, B.; Gruschka, U.; Krebs, W.; Egorov, Y.; Forkel, H.; Ferreira, J.; Aschmoneit, K. CFD Prediction of Partload CO Emissions Using a Two-Timescale Combustion Model. J. Eng. Gas Turbines Power 2011, 133, 071502. [Google Scholar] [CrossRef]
  14. Klarmann, N.; Zoller, B.; Sattelmayer, T. Numerical modeling of CO-emissions for gas turbine combustors operating at part-load conditions. J. Glob. Power Propuls. Soc. 2018, 2, 376–387. [Google Scholar] [CrossRef]
  15. Maas, U.; Pope, S. Simplifying chemical kinetics: Intrinsic low-dimensional manifolds in composition space. Combust. Flame 1992, 88, 239–264. [Google Scholar] [CrossRef]
  16. Bhargava, A.; Kendrick, D.; Colket, M.; Sowa, W.; Casleton, K.; Maloney, D. Pressure Effect on NOx and CO Emissions in Industrial Gas Turbines. In ASME Turbo Expo; American Society of Mechanical Engineers: New York, NY, USA, 2000. [Google Scholar] [CrossRef]
  17. Falcitelli, M.; Pasini, S.; Rossi, N.; Tognotti, L. CFD+reactor network analysis: An integrated methodology for the modeling and optimisation of industrial systems for energy saving and pollution reduction. Appl. Therm. Eng. 2002, 22, 971–979. [Google Scholar] [CrossRef]
  18. Falcitelli, M.; Pasini, S.; Tognotti, L. Modelling practical combustion systems and predicting NOx emissions with an integrated CFD based approach. Comput. Chem. Eng. 2002, 26, 1171–1183. [Google Scholar] [CrossRef]
  19. Falcitelli, M.; Tognotti, L.; Pasini, S. An algorithm for extracting chemical reactor network models from cfd simulation of industrial combustion systems. Combust. Sci. Technol. 2002, 174, 27–42. [Google Scholar] [CrossRef]
  20. Mohamed, H.; Ticha, H.; Mohamed, S. Simulation of pollutant emissions from a gas-turbine combustor. Combust. Sci. Technol. 2004, 176, 819–834. [Google Scholar] [CrossRef]
  21. Novosselov, I.; Malte, P.; Yuan, S.; Srinivasan, R.; Lee, Y. Chemical Reactor Network Application to Emissions Prediction for Industial DLE Gas Turbine. In ASME Turbo Expo; American Society of Mechanical Engineers: New York, NY, USA, 2006; GT2006-90282. [Google Scholar] [CrossRef]
  22. Russo, C.; Mori, G.; Anisimov, V.; Parente, J. Micro Gas Turbine Combustor Emissions Evaluation Using the Chemical Reactor Modelling Approach. In ASME Turbo Expo; American Society of Mechanical Engineers: New York, NY, USA, 2007; GT2007-27687. [Google Scholar] [CrossRef]
  23. Benedetto, D.; Pasini, S.; Falcitelli, M.; La Marca, C.; Tognotti, L. NOx Emission Prediction from 3-D Complete Modelling to Reactor Network Analysis. Combust. Sci. Technol. 2008, 153, 279–294. [Google Scholar] [CrossRef]
  24. Fichet, V.; Kanniche, M.; Plion, P.; Gicquel, O. A reactor network model for predicting NOx emissions in gas turbines. Fuel 2010, 89, 2202–2210. [Google Scholar] [CrossRef]
  25. Lee, D.; Park, J.; Jin, J.; Lee, M. A simulation for prediction of nitrogen oxide emissions in lean premixed combustor. J. Mech. Sci. Technol. 2011, 25, 1871–1878. [Google Scholar] [CrossRef]
  26. Lyra, S.; Cant, R. Analysis of high pressure premixed flames using Equivalent Reactor Networks for predicting NOx emissions. Fuel 2013, 107, 261–268. [Google Scholar] [CrossRef]
  27. De Toni, A.; Hayashi, T.; Schneider, P. A reactor network model for predicting NOx emissions in an industrial natural gas burner. J. Braz. Soc. Mech. Sci. Eng. 2013, 35, 199–206. [Google Scholar] [CrossRef]
  28. Colorado, A.; McDonell, V. Reactor Network Analysis to asses fuel composition effects on NOx emissions from a recuperated gas turbine. In ASME Turbo Expo; American Society of Mechanical Engineers: New York, NY, USA, 2014; GT2014-26361. [Google Scholar]
  29. Nguyen, T. Chemical reactor network application to predict the emission of nitrogen oxides in an industrial combustion chamber. Combust. Explos. Shock Waves 2017, 53, 406–410. [Google Scholar] [CrossRef]
  30. Nguyen, T.; Kim, S.; Park, J.; Jung, S.; Kim, S. CFD-CRN validation study for NOx emission prediction in lean premixed gas turbine combustor. J. Mech. Sci. Technol. 2017, 31, 4933–4942. [Google Scholar] [CrossRef]
  31. Innocenti, A.; Andreini, A.; Bertini, D.; Facchini, B.; Motta, M. Turbulent flow-field effects in a hybrid CFD-CRN model for the prediction of NOx and CO emissions in aero-engine combustors. Fuel 2018, 215, 853–864. [Google Scholar] [CrossRef] [Green Version]
  32. Kaluri, A.; Malte, P.; Novosselov, I. Real-time prediction of lean blowout using chemical reactor network. Fuel 2018, 234, 797–808. [Google Scholar] [CrossRef] [Green Version]
  33. Gupta, S.; Malte, P.; Brunton, S.; Novosselov, I. Prevention of lean flame blowout using a predictive chemical reactor network control. Fuel 2019, 236, 583–588. [Google Scholar] [CrossRef]
  34. Perpignan, A.; Sampat, R.; Gangoli, R. Modeling Pollutant Emissions of Flameless Combustion With a Joint CFD and Chemical Reactor Network Approach. Front. Mech. Eng 2019, 5, 63. [Google Scholar] [CrossRef]
  35. Zhang, Q.; Hai, H.; Li, C.; Wang, Y.; Zhang, P.; Wang, X. Predictions of NOx and CO emissionsfrom a low-emission concentric stagedcombustor for civil aeroengines. J. Aerosp. Eng. 2020, 234, 1075–1091. [Google Scholar] [CrossRef]
  36. Wünning, J.; Wünning, J. Flameless oxidation to reduce thermal NO-formation. Prog. Energy Combust. Sci. 1997, 23, 81–94. [Google Scholar] [CrossRef]
  37. Cavaliere, A.; Joannon, M. Mild Combustion. Prog. Energy Combust. Sci. 2004, 30, 329–366. [Google Scholar] [CrossRef]
  38. Lückerath, R.; Meier, W.; Aigner, M. FLOX® Combustion at High Pressure With Different Fuel Compositions. J. Eng. Gas Turbines Power 2008, 130, 011505. [Google Scholar] [CrossRef]
  39. Flamme, M. Low NOx Combustion Technologies for High Temperature Applications. Energy Convers. Manag. 2001, 42, 1919–1935. [Google Scholar] [CrossRef]
  40. Flamme, M. New combustion systems for gas turbines (NGT). Appl. Therm. Eng. 2004, 24, 1551–1559. [Google Scholar] [CrossRef]
  41. Lammel, O.; Stöhr, M.; Kutne, P.; Dem, C.; Meier, W.; Aigner, M. Experimental Analysis of Confined Jet Flames by Laser Measurement Techniques. In ASME Turbo Expo; American Society of Mechanical Engineers: New York, NY, USA, 2011; GT2011-45111. [Google Scholar]
  42. Seliger-Ost, H. Entwicklung eines FLOX-Basierten Brennersystems Für eine Rekuperierte Mikrogasturbine im Kleinen Leistungsbereich. Ph.D. Thesis, Universität Stuttgart, Stuttgart, Germany, 2019. [Google Scholar]
  43. Seliger-Ost, H.; Kutne, P.; Zanger, J.; Aigner, M. Experimental Investigation of the Impact of Biogas on a 3 kW Micro Gas Turbine FLOX-based Combustor. In ASME Turbo Expo 2020: Power for Land, Sea and Air; American Society of Mechanical Engineers: New York, NY, USA, 2020; GT2020-15556. [Google Scholar]
  44. Seliger-Ost, H.; Kutne, P.; Zanger, J.; Aigner, M. Experimental Investigation of the Impact of Biogas on a 3 kW Micro Gas Turbine FLOX-Based Combustor. J. Eng. Gas Turbines Power 2021, 143, 081020. [Google Scholar] [CrossRef]
  45. Seliger, H.; Stöhr, M.; Yin, Z.; Huber, A.; Aigner, M. Experimental and Numerical Analyses of a FLOX-based Combustor for a 3 kW Micro Gas Turbine under Atmospheric Conditions. In ASME Turbo Expo 2017: Power for Land, Sea and Air; American Society of Mechanical Engineers: New York, NY, USA, 2017; GT2017-63317. [Google Scholar]
  46. Cirigliano, D.; Grimm, F.; Kutne, P.; Aigner, M. Thermo-Structural Analysis of a Micro Gas Turbine Jet- and Recirculation- Stabilized Combustion Chamber. In ASME Turbo Expo 2020: Power for Land, Sea and Air; American Society of Mechanical Engineers: New York, NY, USA, 2020; GT2020-14561. [Google Scholar]
  47. Ansys Inc. ANSYS Fluent Theory Guide; Release 2020R1; Ansys. Inc.: Canonsburg, PA, USA, 2020. [Google Scholar]
  48. Li, J.; Zhao, Z.; Kazakov, A.; Dryer, F.L. An updated comprehensive kinetic model of hydrogen combustion. Int. J. Chem. Kinet. 2004, 36, 566–575. [Google Scholar] [CrossRef]
  49. Grimm, F.; Lingstaedt, T.; Kutne, P.; Aigner, M. Numerical and Experimental Study of a Jet-and-Recirculation Stabilized Low Calorific Combustor for a Hybrid Power Plant. Energies 2021, 14, 537. [Google Scholar] [CrossRef]
Figure 1. Tool chain of the ERN setup and solution approach.
Energies 15 01740 g001
Figure 2. Schematic of the FLOX® burner principle.
Energies 15 01740 g002
Figure 3. Setup of the laboratory scale burner system [42,43,44].
Energies 15 01740 g003
Figure 4. Alignment of experimental tools for PIV, OH-PLIF, and OH* chemiluminescence measurements. Courtesy of [45].
Energies 15 01740 g004
Figure 5. Grid and computational domain of the numerical CFD simulations.
Energies 15 01740 g005
Figure 6. Comparison of PIV (dots) [42] and CFD (lines) axial velocities at different heights x / d above the burner nozzles. Normalized velocities.
Energies 15 01740 g006
Figure 7. Comparison of PIV (dots) [42] and CFD (lines) radial velocities at different heights x / d above the burner nozzles. Normalized velocities, scaled by factor 8.
Energies 15 01740 g007
Figure 8. (Left): Comparison of OH* chemiluminescence flame surface density (FSD) [42] with specific reaction heat. (Right): Comparison of experimental PIV axial velocities [42] and averaged CFD flow field. Light colors denote high values and vice versa.
Energies 15 01740 g008
Figure 9. Manually constructed ERN scheme of the FLOX® single-nozzle setup with underlying CFD contour of static temperature.
Energies 15 01740 g009
Figure 10. Results of zone identification by Energico for the flame zone and reactor network zones.
Energies 15 01740 g010
Figure 11. FLOX® ERNs with different numbers of PSR reactors, automatically constructed in Ansys Energico.
Energies 15 01740 g011
Figure 12. ERN volume distribution and comparison of residence time distribution.
Energies 15 01740 g012
Figure 13. NOx and CO emissions at 15 % oxygen, evaluated for the reactor network models. N: number of PSR reactors. Variation of system heat loss in sensible ranges for atmospheric testing [49] with respect to overall fuel energy content.
Energies 15 01740 g013
Table 1. Literature overview on ERN-based pollutant emission prediction, selected studies. C » E: extraction of networks from CFD. C+E: using CFD as guidance or estimation for ERN creation. E: reactor networks without CFD.
SourceYearC » EC + EEApplication
Bhargava et al. [16]2000 xSingle-nozzle experiments and numerical modeling, study of pressure effects
Falcitelli et al. [17]2002x NOx prediction in industrial energy combustion systems
Falcitelli et al. [18]2002x NOx prediction in industrial furnaces, NOx reduction techniques
Falcitelli et al. [19]2002x Methodical assessment of ERN pollutant prediction from CFD
Mohamed et al. [20]2004 xNOx, UHC, and CO for gas turbine combustion (model only)
Novosselov et al. [21]2006x NOx and CO in a swirl-stabilized burner
Russo et al. [22]2007 x NOx and CO in a recuperated micro gas turbine
Benedetto et al. [23]2008 x Industrial furnace facilities
Fichet et al. [24]2010x NOx emissions in a staged gas turbine combustor
Lee et al. [25]2011x NOx emissions in a simplified combustor, GE7FA gas turbine
Lyra and Cant [26]2013x NOx emissions in a high-pressure nozzle test case
De Toni et al. [27]2013 x NOx emissions in a BERL 300 kW furnace combustor
Colorado et al. [28]2014 x NOx emissions in a C60 gas turbine combustor
Nguyen [29]2017 x NOx emissions for a generic gas turbine burner using Chemkin
Nguyen et al. [30]2017x NOx prediction with Chemkin for a gas turbine combustor
Innocenti et al. [31]2018x NOx and CO in a swirl-stabilized aero-engine combustor
Kaluri et al. [32]2018 xReal-time reactor network for LBO predictions
Nguyen [2]2019x Emissions in a swirl-stabilized combustor using Chemkin
Gupta et al. [33]2019 xReal-time reactor network for LBO predictions
Perpignan et al. [34]2019x NOx and CO emissions at flameless oxidation combustion
Zhang et al. [35]2020x NOx and CO emissions in a swirl-stabilized aero-engine combustor sector
Publisher’s Note: MDPI stays neutral with regard to jurisdictional claims in published maps and institutional affiliations.

