Abstract
This paper compares multiple techniques to detect suboptimal conditions in the PV system. Detection of suboptimal conditions in the PV system is required to achieve optimal photovoltaic (PV) systems. Therefore, maintenance managers need to choose the most suitable techniques objectively. However, there is a lack of objective information comparing the effectiveness of the methods. This article calculates and compares the effectiveness of Infrared thermography (IRT), visual inspection (VI), and electrical analysis (EA) in detecting soiling, partial shadows, and electrical faults experimentally. The results showed that the VI was the best at detecting soiling and partial shading with 100% of effectiveness. IRT and EA had an effectiveness of 78% and 73%, respectively, detecting the three types of conditions under study. It was not possible to achieve maximum detection using only one of the techniques, but that VI must be combined with IR or EA. This research represents a significant contribution by achieving an objective comparison between techniques for detecting suboptimal conditions, being very useful to guide PV system maintainers and designers of fault detection techniques.
1. Introduction
In the area of PV systems engineering, an important topic is the operation, performance, and maintenance of PV Sytems, that is, all the activities related to the monitoring, predictive and corrective maintenance, system failure analysis, system reliability, and operational safety.
PV Systems’ benefits depend on their performance over their lifetime. Suboptimal conditions and faults such as electrical failures, partial shading, and soiling make the power delivered by solar modules decrease and may even generate irreversible damage [1]. There are design assumptions to avoid future suboptimal conditions such as partial shadows [2]; however, they can still occur in the future due to changes in surrounding installation factors. Therefore, it is critical to be able to detect these conditions effectively.
Using fault detection techniques it is possible to detect suboptimal conditions to act promptly before there is a significant impact on delivered power or a fire [3]. Research into fault detection techniques has led to their implementation in inverters [1], however there are still many limitations. In [4] a summary of the types of faults and available techniques is made, among which, we can find visual inspection, the use of drones for infrared thermography [5] and the analysis of electrical variables such as power [6].
Efforts to make photovoltaic (PV) system maintenance more effective and efficient have led to the development of continuous monitoring systems and extensive research into fault detection techniques (e.g., [2,7]). However, a lack of quantitative information to assess its effectiveness has been identified as it is mentioned in [8]. In [9] an initial contribution to this situation was presented. In this case, a methodology was proposed to compare the effectiveness of failure detection of infrared thermography (IRT) and visual inspection (VI), however the electrical analysis (EA) technique was not considered.
This paper presents an extension of the work mentioned above. Besides IRT and VI, a third fault detection technique has been included, namely, EA, which detects faults by analyzing the estimated and actual electrical power. More specifically, the work assesses the effectiveness of IRT, VI, and EA to detect failures by partial shading (PS), soiling (S), and electrical faults (E). The previously mentioned faults are detailed in the next subsection.This research contributes to:
- the generation of quantitative indicators of effectiveness for failure identification methods, which are very limited or do not exist at the experimental level,
- a more detailed experimental characterization of each method, identifying strengths and limitations under different types of conditions,
- a more objective selection of the method(s) to be used at a PV installation for a more efficient operation and maintenance of the plant.
The rest of the paper is structured as follows: the following subsection presents the suboptimal conditions considered. Section 2 describes the material and methods used. Section 3 presents the main results and discussion, and Section 4 describes the main conclusions. The list of nomenclatures and abbreviates are listed at the end of this document.
1.1. Related Work and Research Gap
Other works have characterized and compared fault detection techniques in order to understand the limitations and possibilities of each technique (see Table 1). Table 1 shows that the research developed so far for the comparison of techniques for the detection of suboptimal conditions has been based on literature reviews, without experimental evaluation. Experimental investigation has been done mainly on each particular method and under specific suboptimal conditions, which does not allow a direct comparison between the different techniques.

Table 1.
Some relevant research related to the characterization or comparison of failure detection techniques.
Although there is previous research that characterizes or compares failure detection techniques, there is a lack of quantitative indicators that would allow a comparison to guide maintenance managers in choosing the most effective method. It was recently reviewed 40 failure detection techniques and found that quantitative indicators such as accuracy were lacking in order to make a better comparison between them [8]. This research specifically addresses the comparison of techniques for the detection of suboptimal conditions, based on an experimental approach, generating quantitative effectiveness indicators.
1.2. Suboptimal Conditions Considered
A suboptimal condition is a situation, event, or disturbance that causes a PV system to produce less than it could if that condition did not exist. In this paper, only the most common suboptimal conditions are considered, namely,
- Partial shadowing: A partial shadow on a PV array creates a specific region in which the irradiance is lower, resulting in a decrease in the power of the entire array [3]. Figure 1a shows a PV array with a shaded region due to a tree on the left, and Figure 1b shows a PV array with dirt on the PV module. Both cases cause a decrease in power, which will depend on the size and degree of shading [12,13].
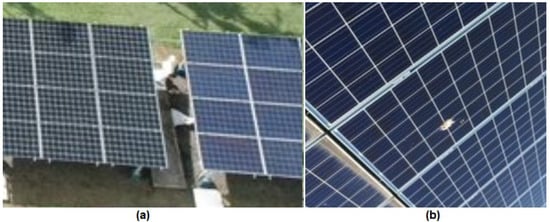 Figure 1. (a) PV-chain with partial shade due to a tree, (b) PV-chain with dirt due to a bird drop.
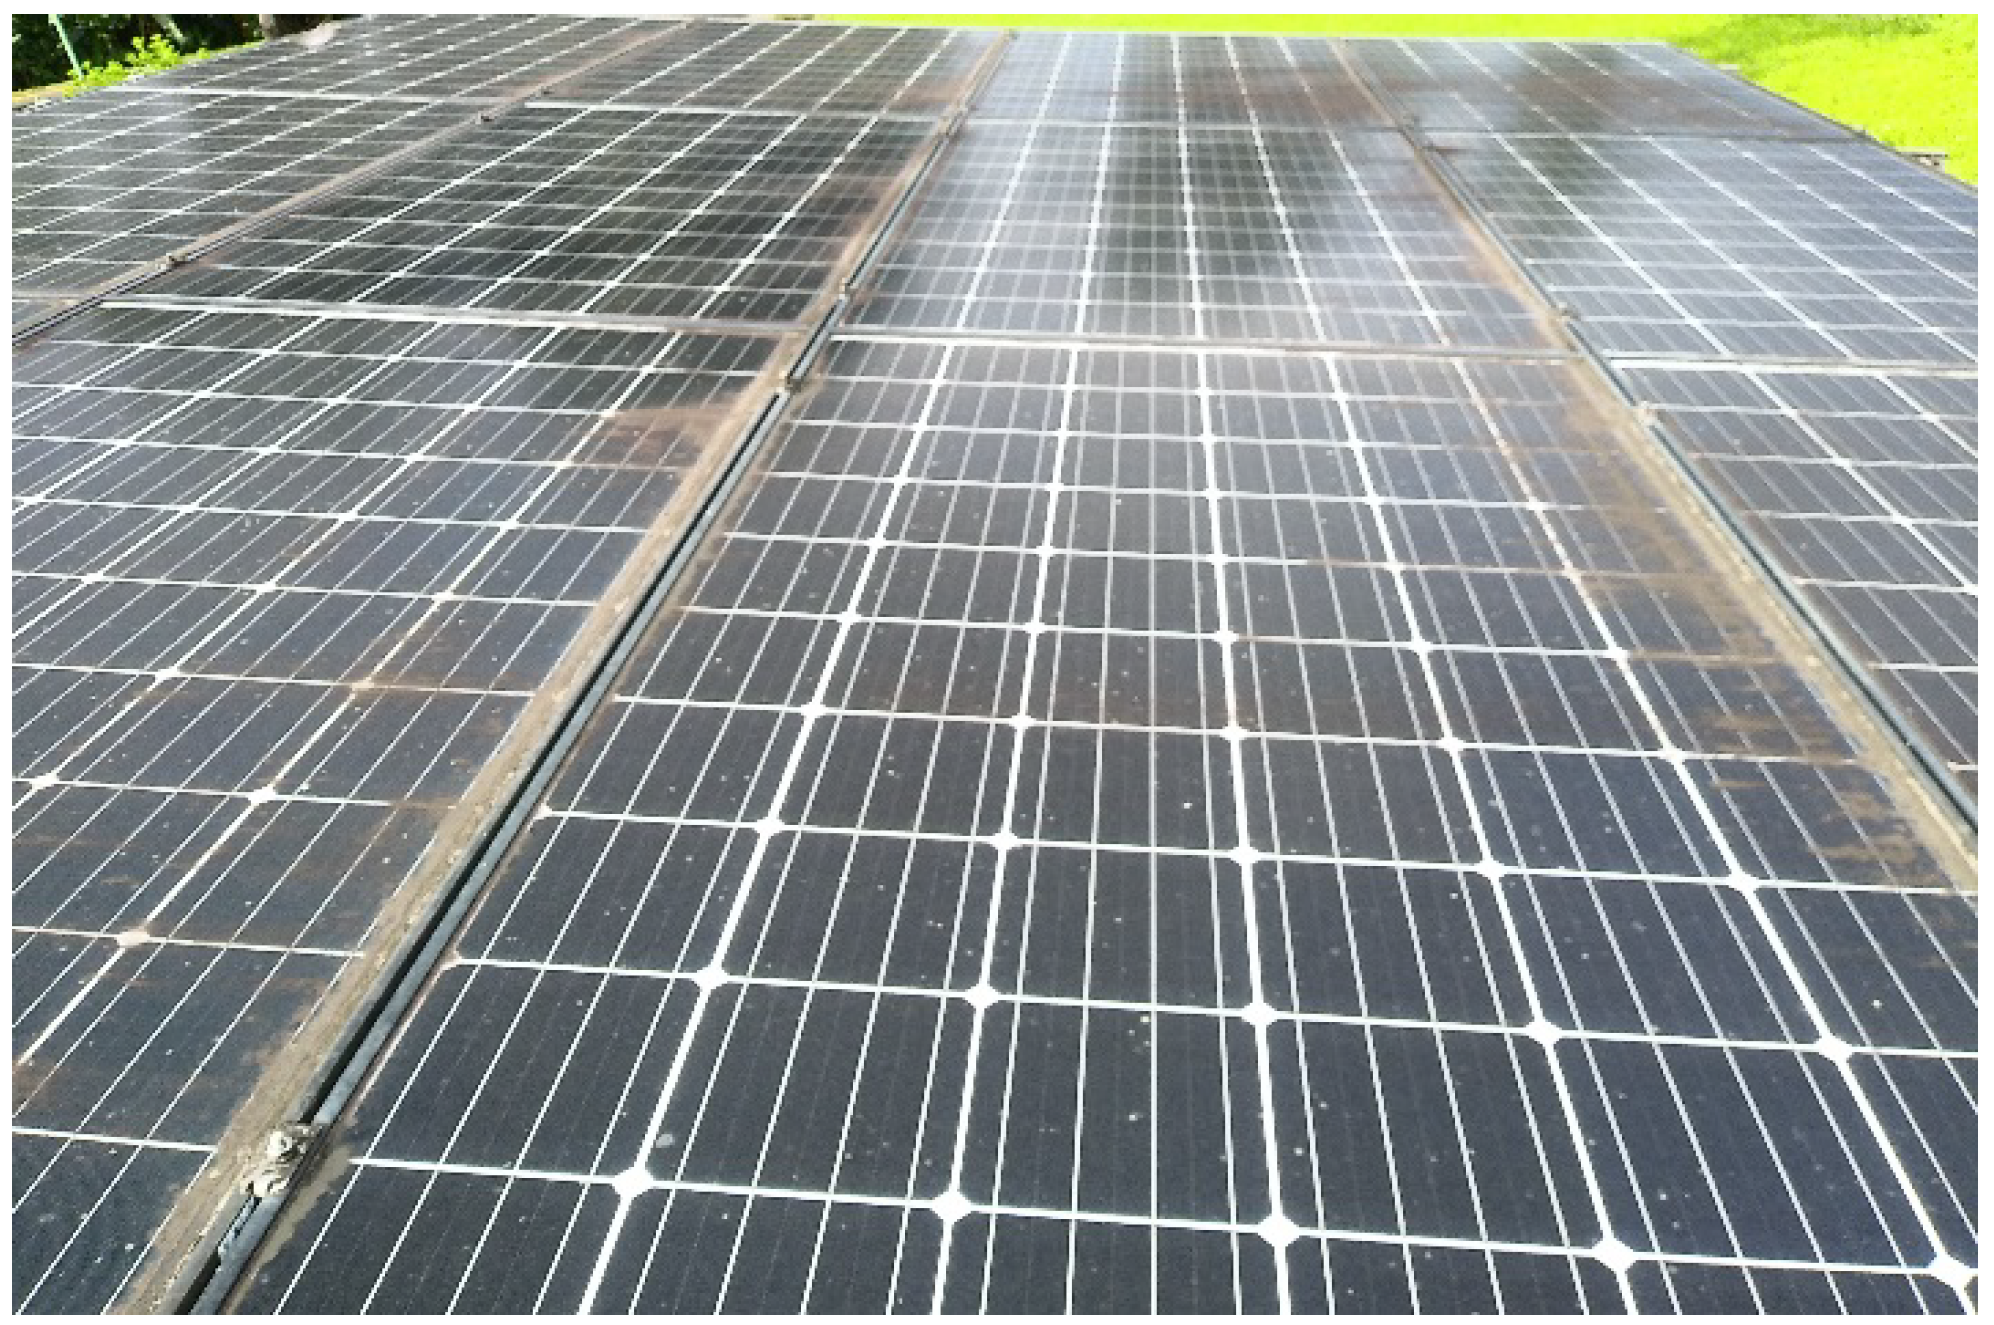
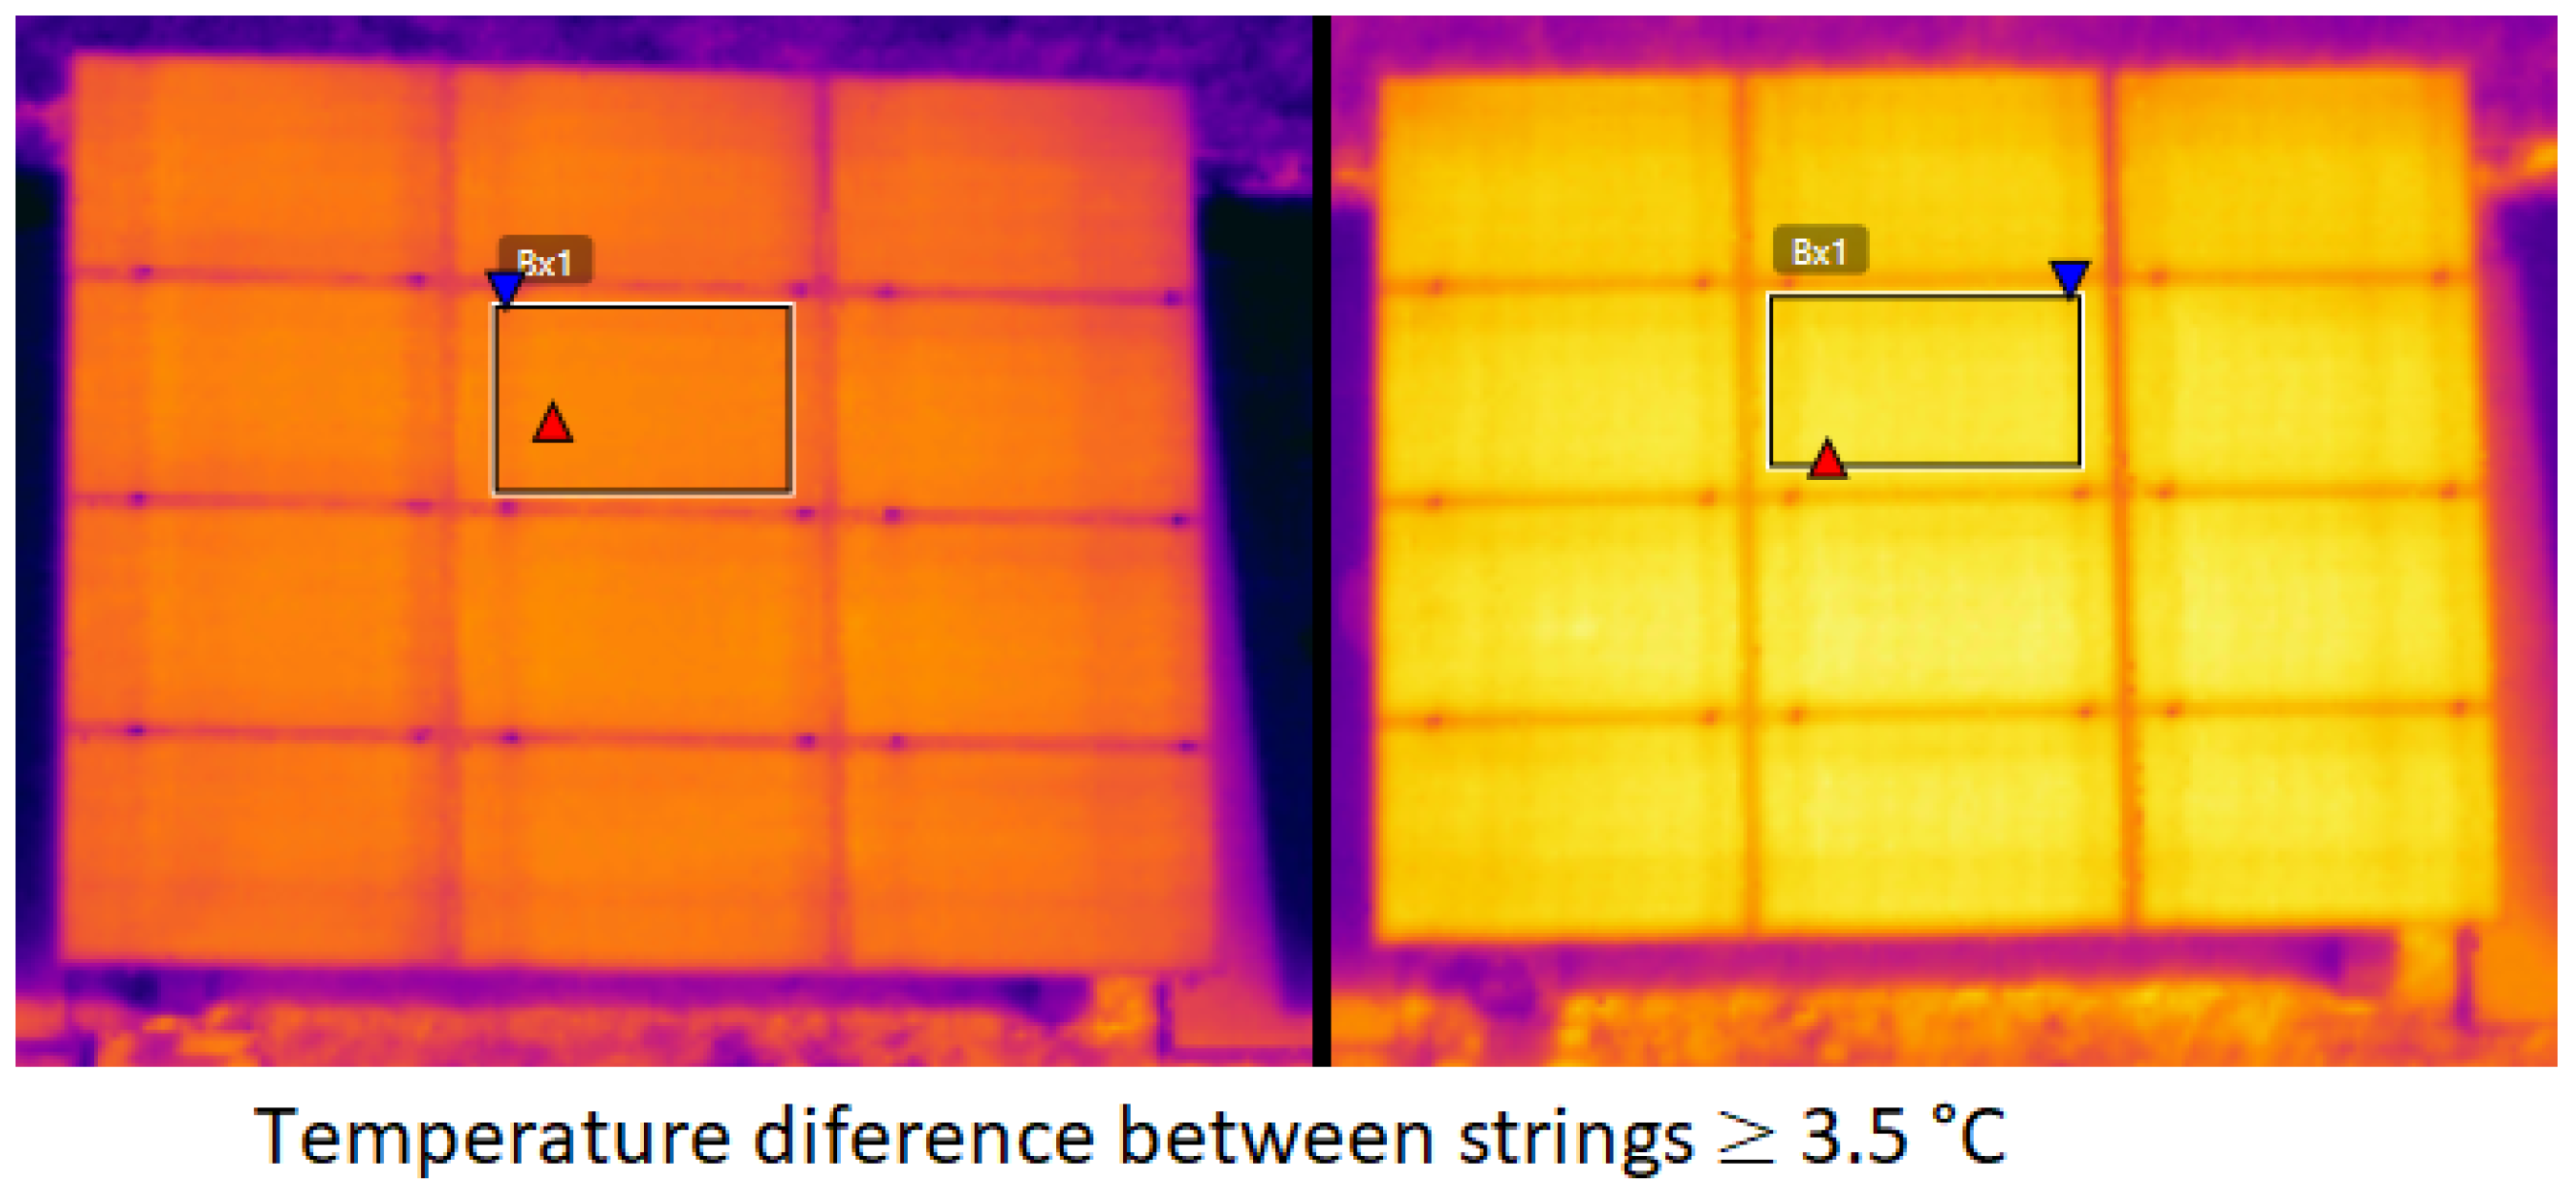
 - Soiling: The presence of dust, leaves, dirt, and generally any dirt will cause a decrease in the power generated by a solar array, which will be more significant as the amount of dirt increases [13]. Uniform dirt (evenly distributed dust) and non-uniform dirt (patches of dirt or bird drops) will have an affection on the power; the latter can also be classified as shading since it creates a decrease in the irradiance that affects the PV module, equivalent to a partial shade [14]. The effect on the power due to non-uniform dirt causes a hot spot to be formed [13]. Figure 2 shows a PV array with natural dirt, in which non-uniform dirt can be observed.
 Figure 2. Monocrystalline PV module analyzed with the presence of natural non-uniform dirt.
 - Electrical Faults: From the electrical point of view, and according to [1], failures can be classified as (1) Ground faults, (2) Interline faults, (3) Open circuit faults, (4) others. It has been reported that faults cause a decrease in the power delivered and an increase in the temperature that varies according to the type of fault [8,15,16,17]. The following faults were applied in this investigation: short circuit in a PV module, ground fault, and open circuit. These are represented in Figure 3 with red lines.
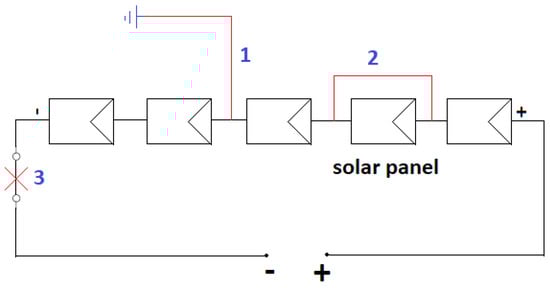 Figure 3. Types of electrical failures analyzed in this research. (1) Short circuit to ground, (2) Short circuit in PV module and (3) Open circuit.
2. Materials and Methods
This section details the installation, protocols, measuring instruments and the main methodological aspects used for the experimental tests.
2.1. The PV Installation Analyzed
The photovoltaic installation used is located in the northern part of Costa Rica, 10°32 latitude and −84°31 longitude. According to the Köppen-Geiger system, the climate in this location is classified as tropical rainforest climate (Af). The PV plant it is located at the San Carlos Local Technological Campus in Santa Clara, Costa Rica. It is made up of six PV arrays, of which, three of monocrystalline technology were used for the development of the experiment because the EA method is designed for monocrystalline modules. The details of the PV arrays used are shown in the Table 2.
Table 2.
Information about the PV arrays under study.
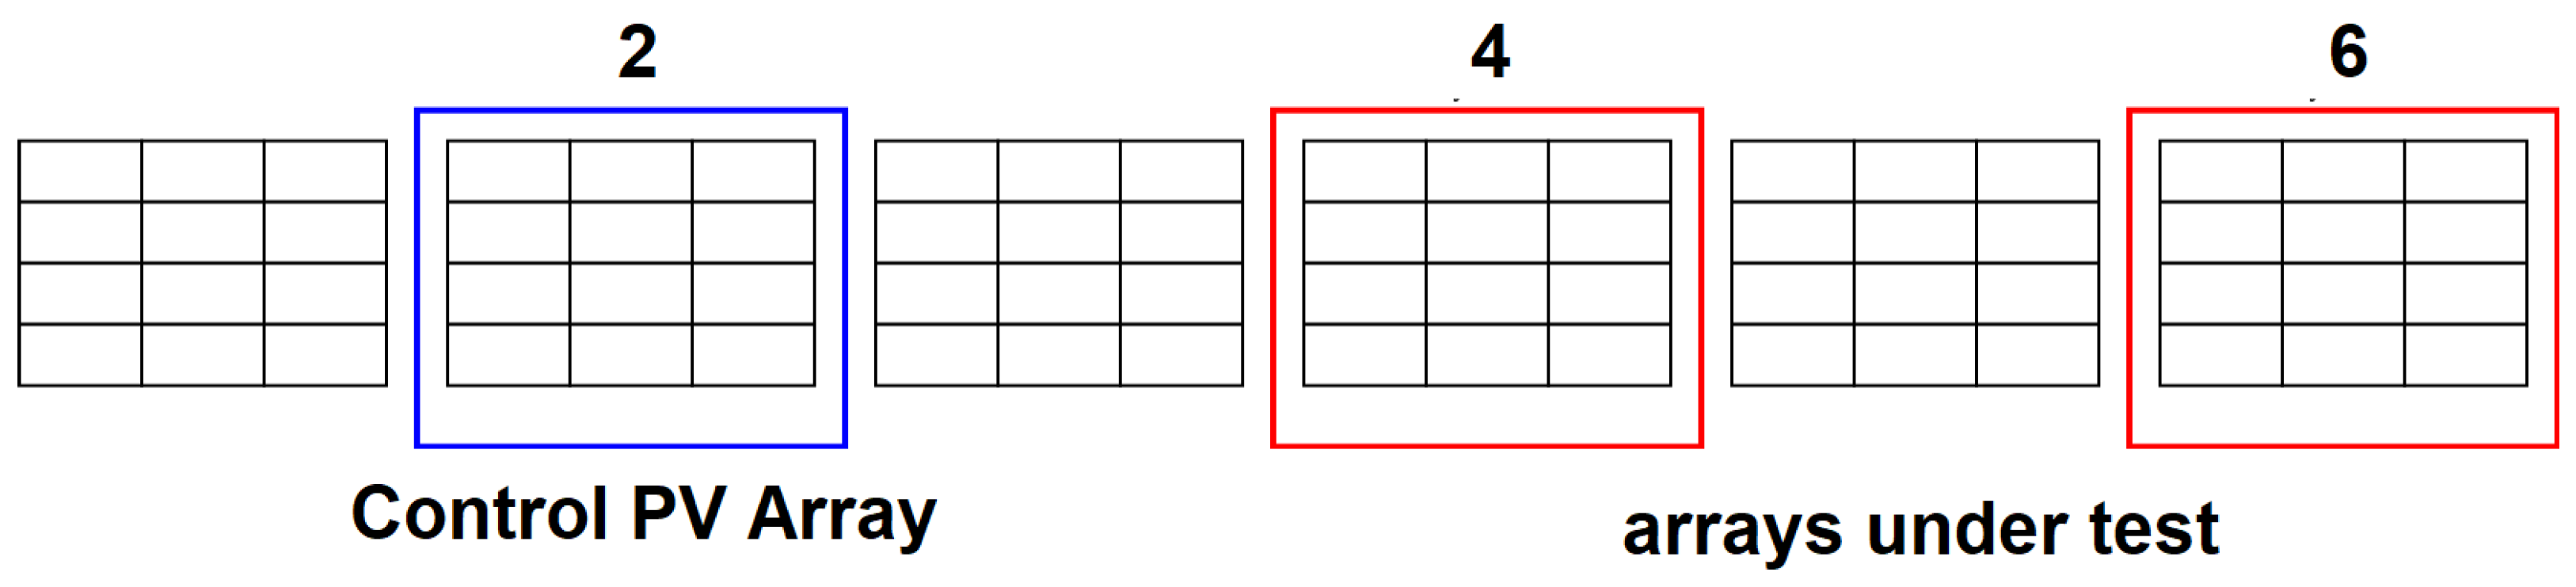
The installation used in the research consists of 6 PV arrays of 12 monocrystalline and polycrystalline modules in series, each connected to a Sunny Boy 3000TL-US SMA inverter. The monocrystalline PV arrays selected for the experiment in this research are identified by the numbers 2, 4, and 6 in Figure 4.
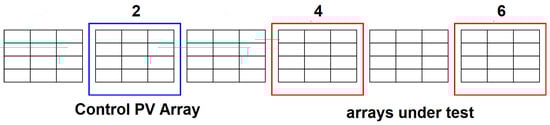
Figure 4.
Diagram of the analyzed PV installation. The monocrystalline PV arrays 2, 4 and 6 were used in this research.
2.2. Protocol for the IRT and VI Missions
The procedure used was based on the one used by [9]. In this research, for each suboptimal condition, a flight was made with the UAV capturing RGB and infrared images of the PV chains. The flight height was set at 25 m, considering that this allows detecting possible failures with a resolution of the photovoltaic cell [9]. The irradiance was always higher than 700 with an angle around 20° from the PV module’s perpendicular, the sky was clear and there were no wind currents. Emissivity was 0.85 for IRT. Consecutive images were taken every 1 s for the IRT and 2 s for the VI. The thermal images were configured to contain the radiometric information in RJPEG format.
For each test, the irradiance, ambient temperature and relative humidity were recorded. Each suboptimal condition was applied 15 min before the measurement was taken to ensure that thermal equilibrium existed [18].
2.3. Description for Electrical Measurements
This method was based on comparing the real generated power and the estimated theoretical power. The model used to estimate the generated power is the one proposed by [19]; the model starts from estimating the efficiency with Equation (1).
For greater accuracy in the model, wiring and aging losses were included as shown below:
where, = 0.01 and represents the electrical wiring losses and = 0.03625 represents the aging losses according to the manufacturer’s information. Then, in order to calculate the power and compare it with the power measured in the inverters, Equation (4) was used.
Finally, the system was tested under normal conditions to be empirically calibrated using the control PV array (string 2), so a correction factor k was applied, and a constant a was added to obtain the equation used by the EA method:
When applying each suboptimal condition, it was waited at least 5 min to take the measurements of the required physical variables, ensuring that the measurement corresponds to the steady-state of the failure. In order to establish this parameter, it was considered that in case of a variation in the PV array conditions (e.g., a failure), the inverter takes time to reach the stability of the new operation point [20], although this time can be less than 1 s, it was decided to leave a longer time.
Each measurement was obtained from the average of 1 min to have a measurement that was not affected by external fluctuations, namely: (a) sudden changes in weather conditions and (b) difference between the sampling times of the real power and the variables to estimate the theoretical power.
2.4. Fault Detection Criteria
The criteria used for the detection of suboptimal conditions were established from the review of scientific literature with experimental information. Taking [21,22] as a reference, the suboptimal conditions for infrared thermography considered were: (1) hot spot with a temperature differential of 10 °C or more, (2) PV string with a differential of 3.5 °C or more. For VI, the detection of shadows or dirt was established as a criterion [23]. For the electrical analysis, a power drop of 4% or more was considered as a suboptimal condition [24].
Table 3 details the suboptimal detection criteria used in the experiment.
Table 3.
Criteria used for each technique evaluated to detect the failures induced from each suboptimal condition.
2.5. Instrumentation
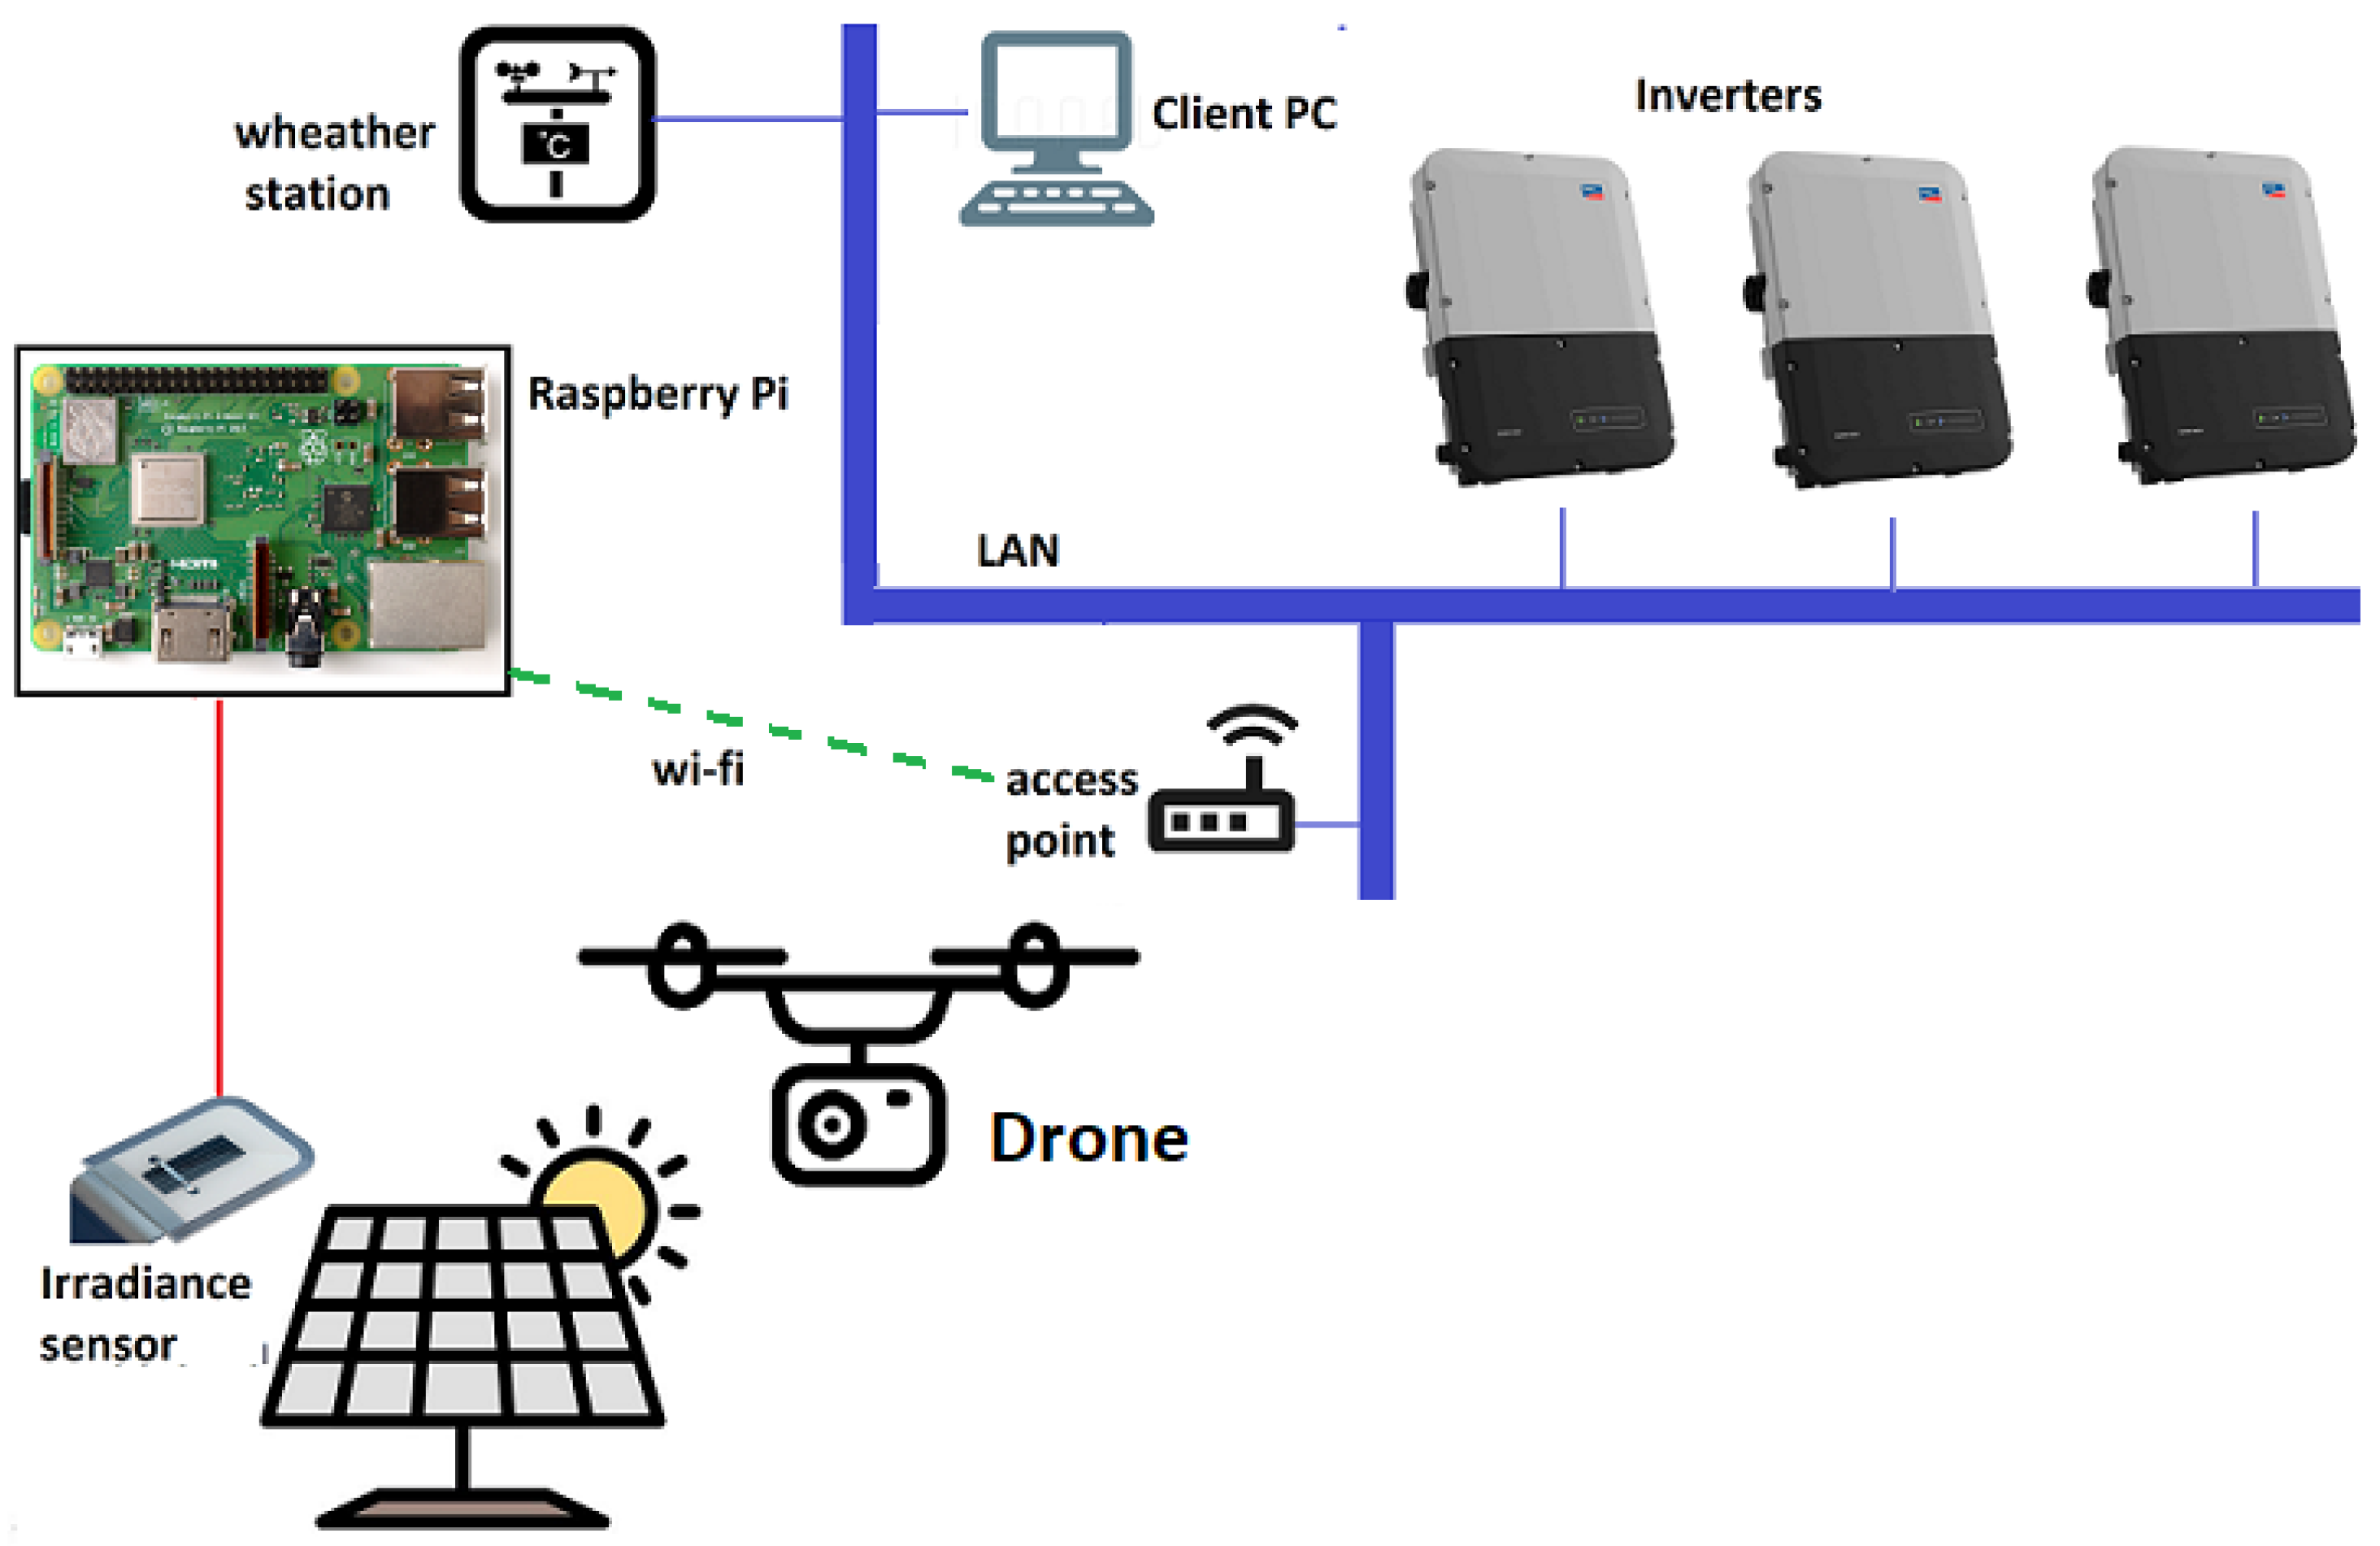
Figure 5 shows a diagram of the instruments used for the experiment. Below the many characteristics of the instruments and equipment used:
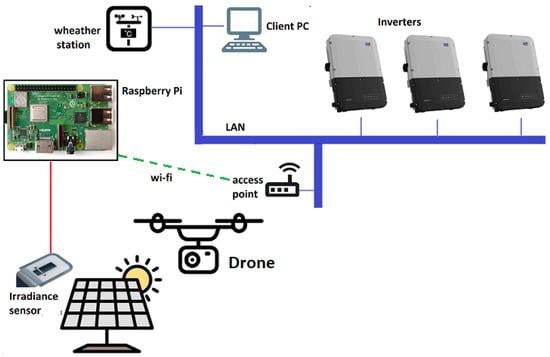
Figure 5.
Schematic diagram of the instrumentation and communication links used to access the information sources of the experiment.
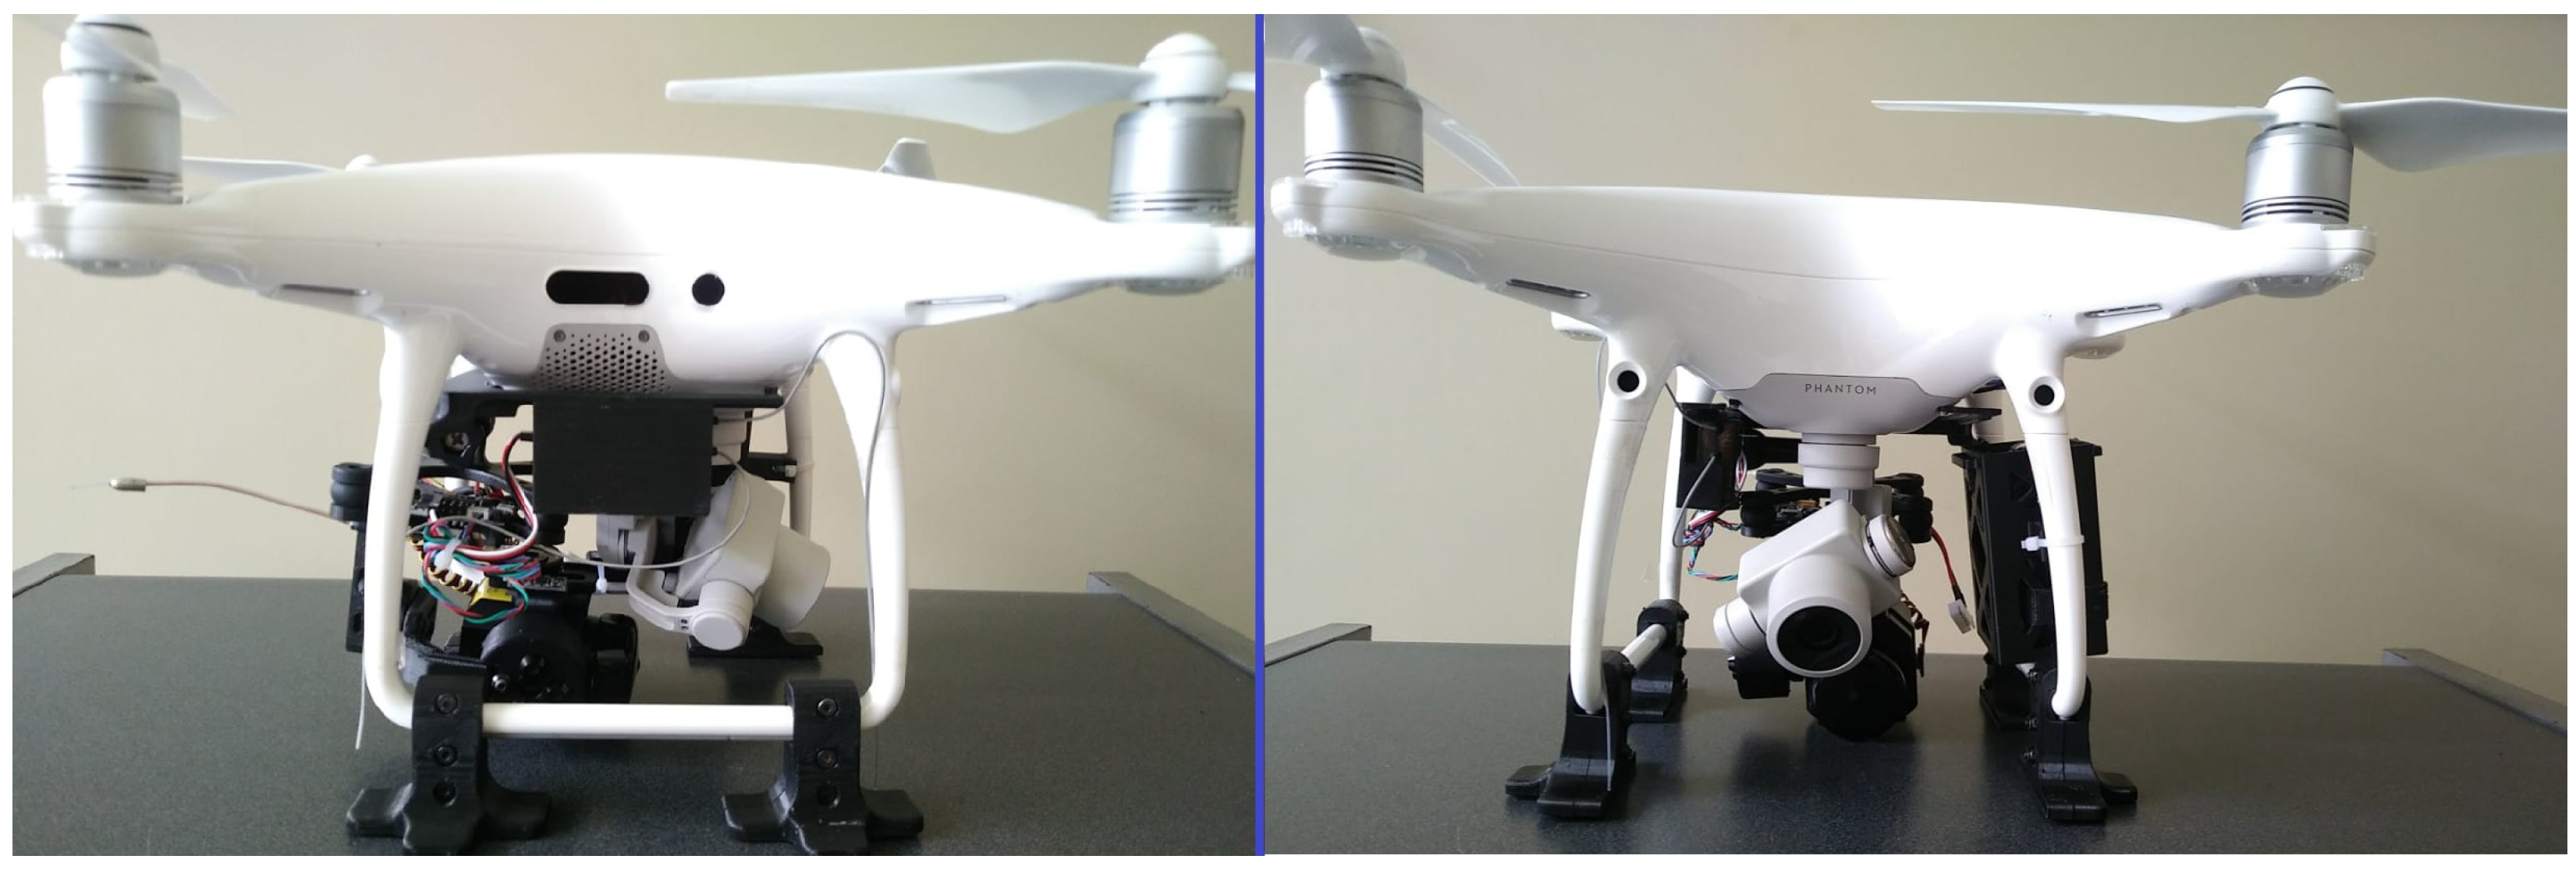
- Drone Phanton 4 Pro with a FLIR VUE PRO R 336 thermal camera (see Figure 6).
 Figure 6. Side (left) and front (right) view of the UAV with infrared and RGB cameras used in the investigation.
 - The RGB camera used for the VI has the following features: 1″ CMOS sensor, lens with an 84° FOV of 8.8 mm/24 mm, 4096 × 2160 resolution, JPEG format images, image size of 3:2; 4:3; 16:9 and an ISO range of 100–3200 (auto).
- The thermal camera has an uncooled microbolometer sensor, specifications are in [25,26], which are: HFOV × VFOV of 25° × 19°, 5.764 mm × 4.351 mm sensor, 13.00 mm focal length, 336 × 256 resolution, 9 Hz frequency, accuracy of ±5 °C or 5% from reading and thermal sensitivity of 40 mK.
- Vantage Pro2 Weather Station with temperature sensor to measure the ambient temperature required for thermogram analysis. The accuracy of the temperature sensor is ±0.3 °C.
- Spektron 210 pyranometer to verify that minimum irradiance conditions are met and to apply the EA method. The accuracy is ±5% of the annual measurement of the annual mean.
- Invert for the measurement of real power required by the EA. Accuracy is class 0.5 in accordance with ANSI C12.20.
- Digital contact temperature sensor model DS18B20 to apply the EA. Accuracy is ±0.5 °C.
2.6. Experiments
An experiment was developed by inducing the suboptimal conditions of interest and the three fault detection techniques were applied to each one.
The experiment used a repeated measurement design because multiple suboptimal conditions had to be applied to the same PV array [27]. A total of 28 cases were analyzed from the 11 suboptimal conditions applied to the two PV arrays. (Strings 4 and 6). String 2 was used as a control subject to establish a reference condition in each case for the normal operation of the PV strings, i.e., without applying failures. The factors and levels evaluated are shown in Table 4.
Table 4.
Factors (types of failures) and levels used to generate the diverse suboptimal conditions to be evaluated in the experiment.
The suboptimal conditions were applied to the PV arrays without interaction between the type of suboptimal conditions analyzed. Each level was applied in both PV arrays making two repetitions (Except S1 and S2, which were each applied to a single PV array because it was natural soiling). The selection of the modules of each string to which the failure was applied was chosen at random. It was assumed that there is an independent relationship between the suboptimal conditions because they were randomized and did not generate a residual effect in the PV array [28], i.e., the PV string returned to their normal state once the suboptimal condition is removed. Each of the suboptimal conditions are described in the following section.
2.7. Description of Each Factor and the Levels of the Experiment
To continue the work started by [29], the same suboptimal conditions of soiling and partial shading were used, and the suboptimal conditions corresponding to electrical failures were included. Each is described in this section.
- A. Soiling
Six soiling conditions were used; these are identified as S1-S6 in Table 4. The suboptimal conditions S3 and S5 were prepared by applying white paint to the glass. Suboptimal conditions S4 and S6 used leaves and seeds found on-site around the solar PV modules. These suboptimal conditions are described as strong shading [13]. The glasses used to emulate the soiling condition are described in detail in [29].
- B. Partial shading
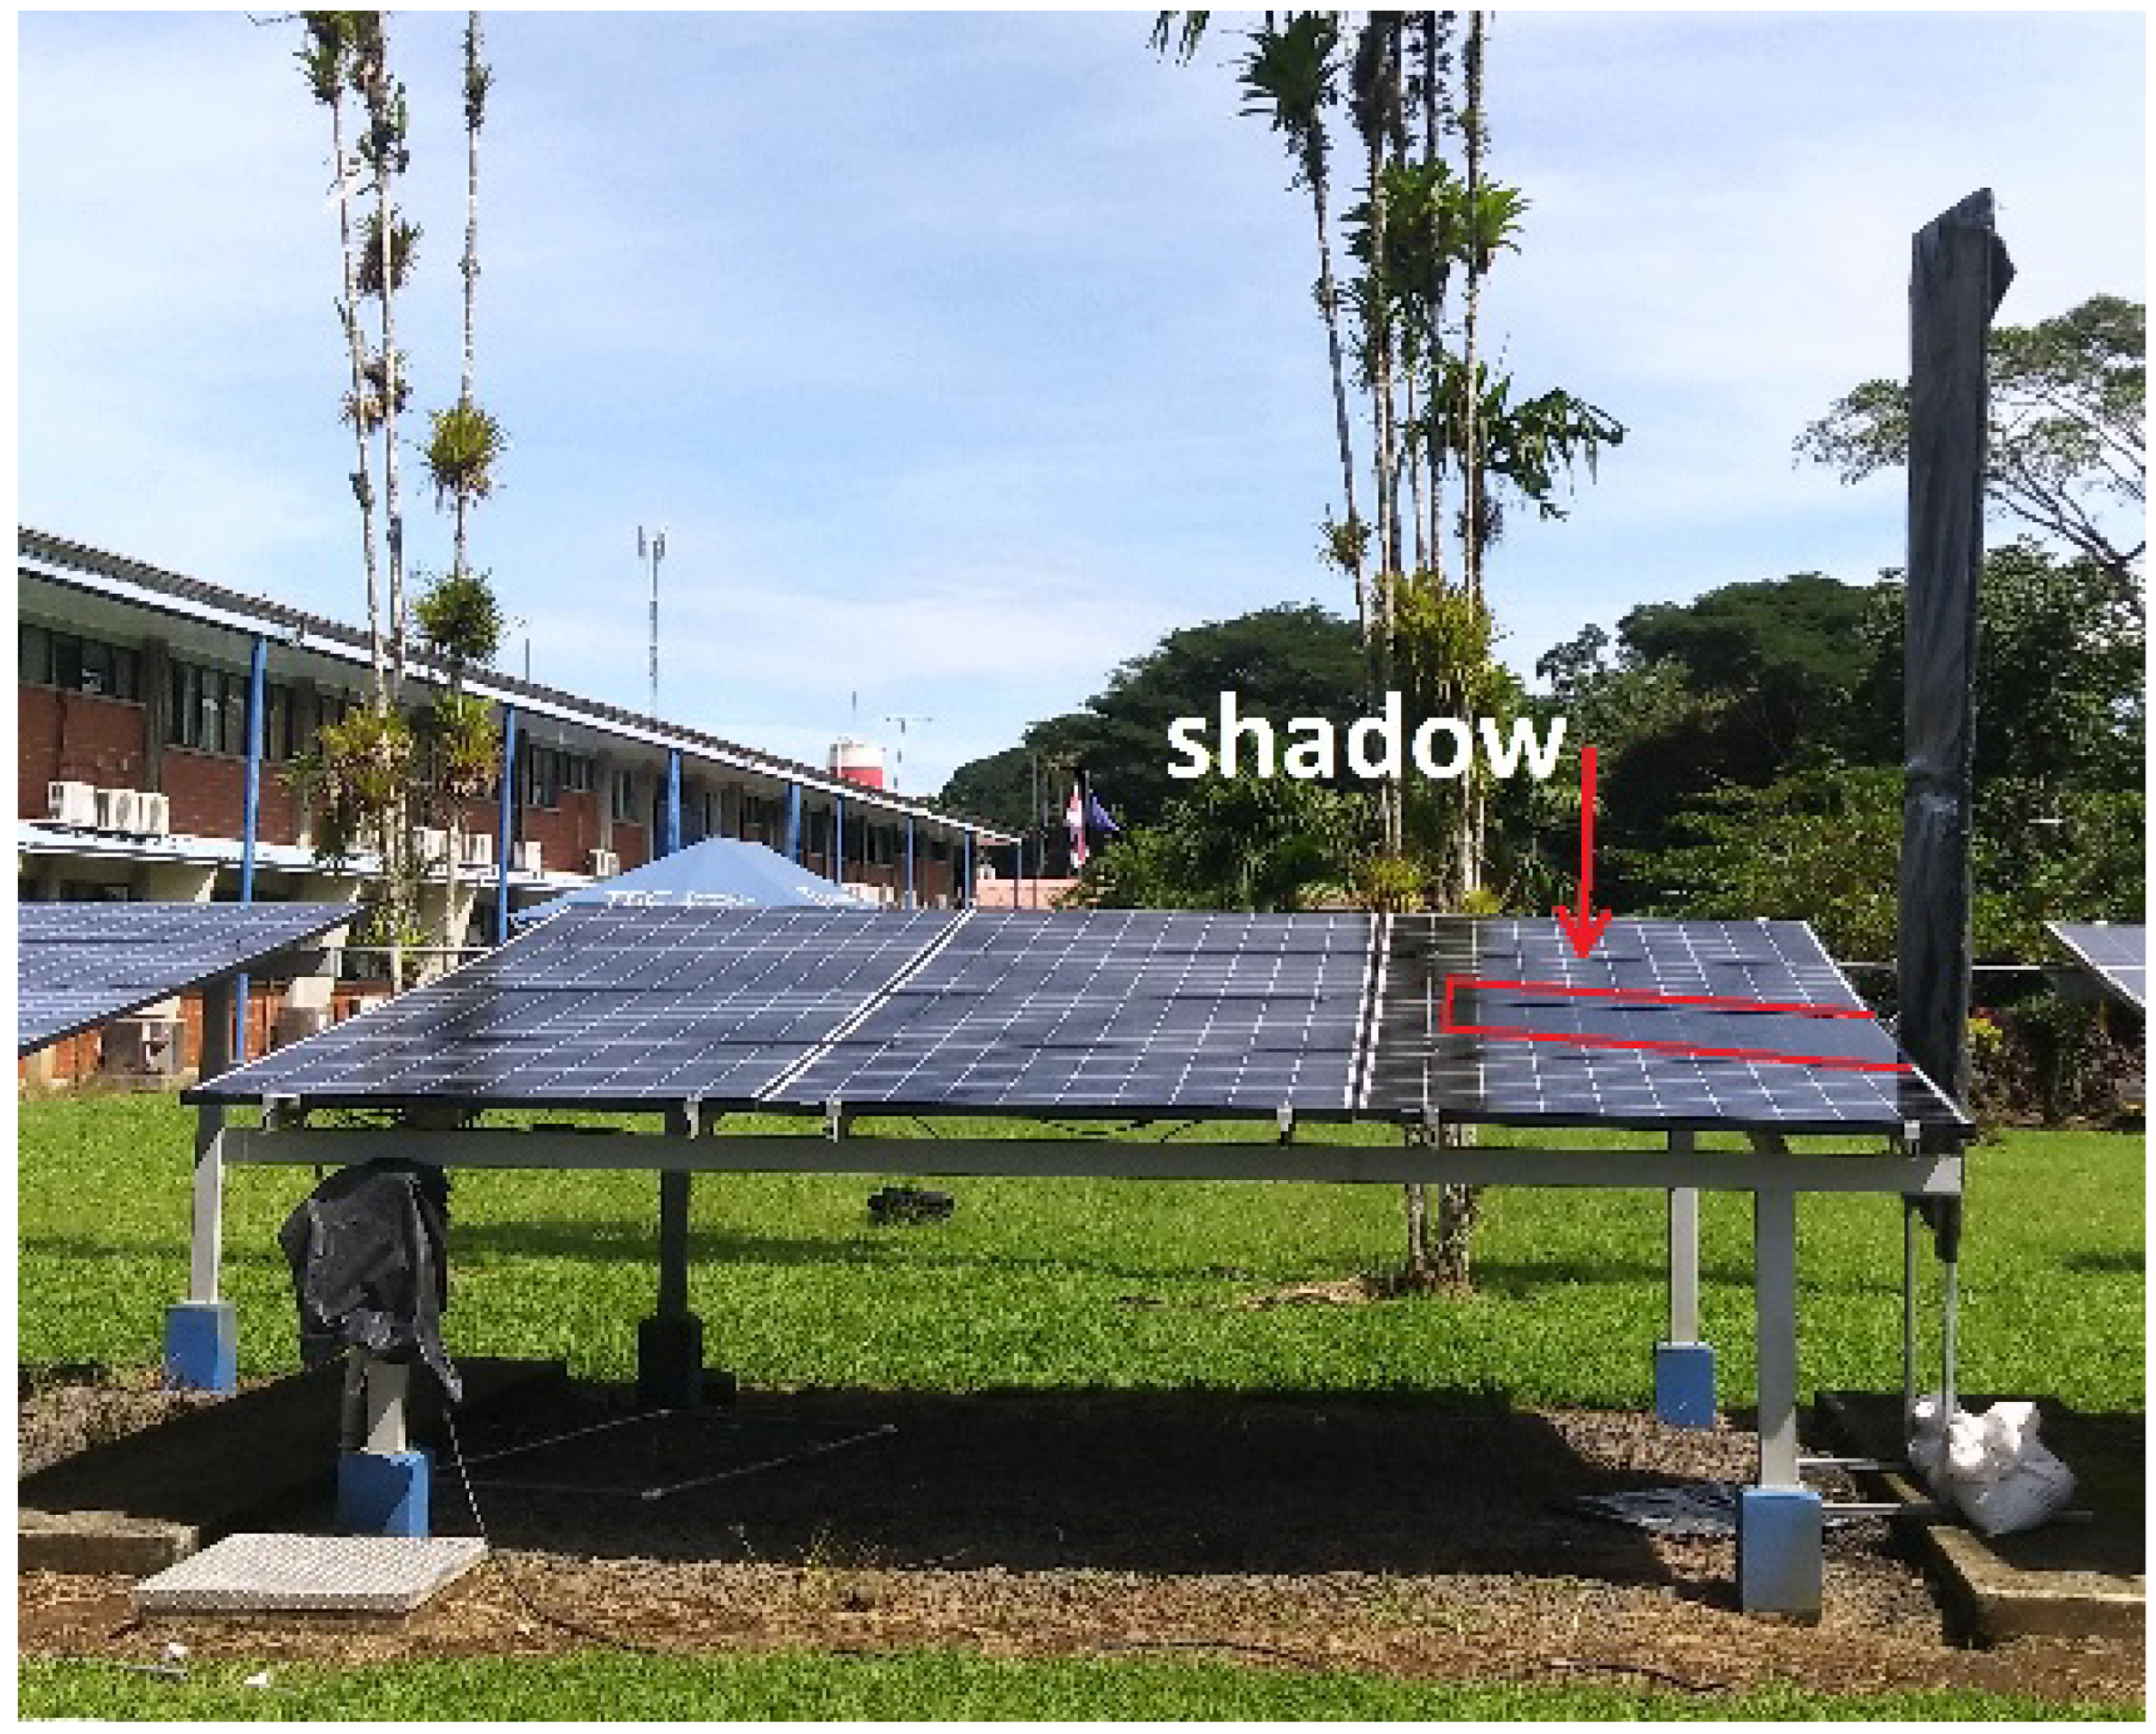
The PS1 and PS2 suboptimal conditions generated a natural shade allowing the incidence of diffuse radiation [30]. For this, an object was placed next to the PV array (see Figure 7) at 9:30 a.m. for PS1 and at 10:30 a.m. for PS2.
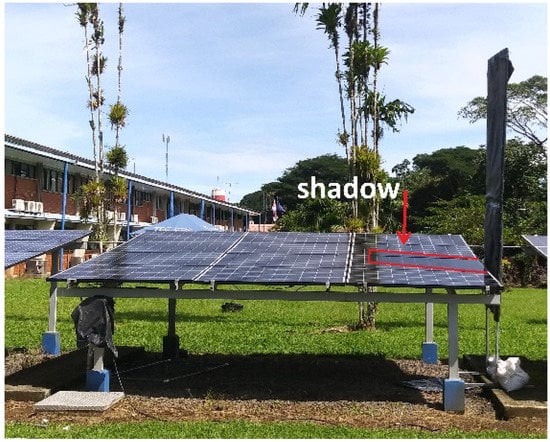
Figure 7.
Object used to generate partial shade conditions. The shadow generated corresponds to the PS1 suboptimal condition.
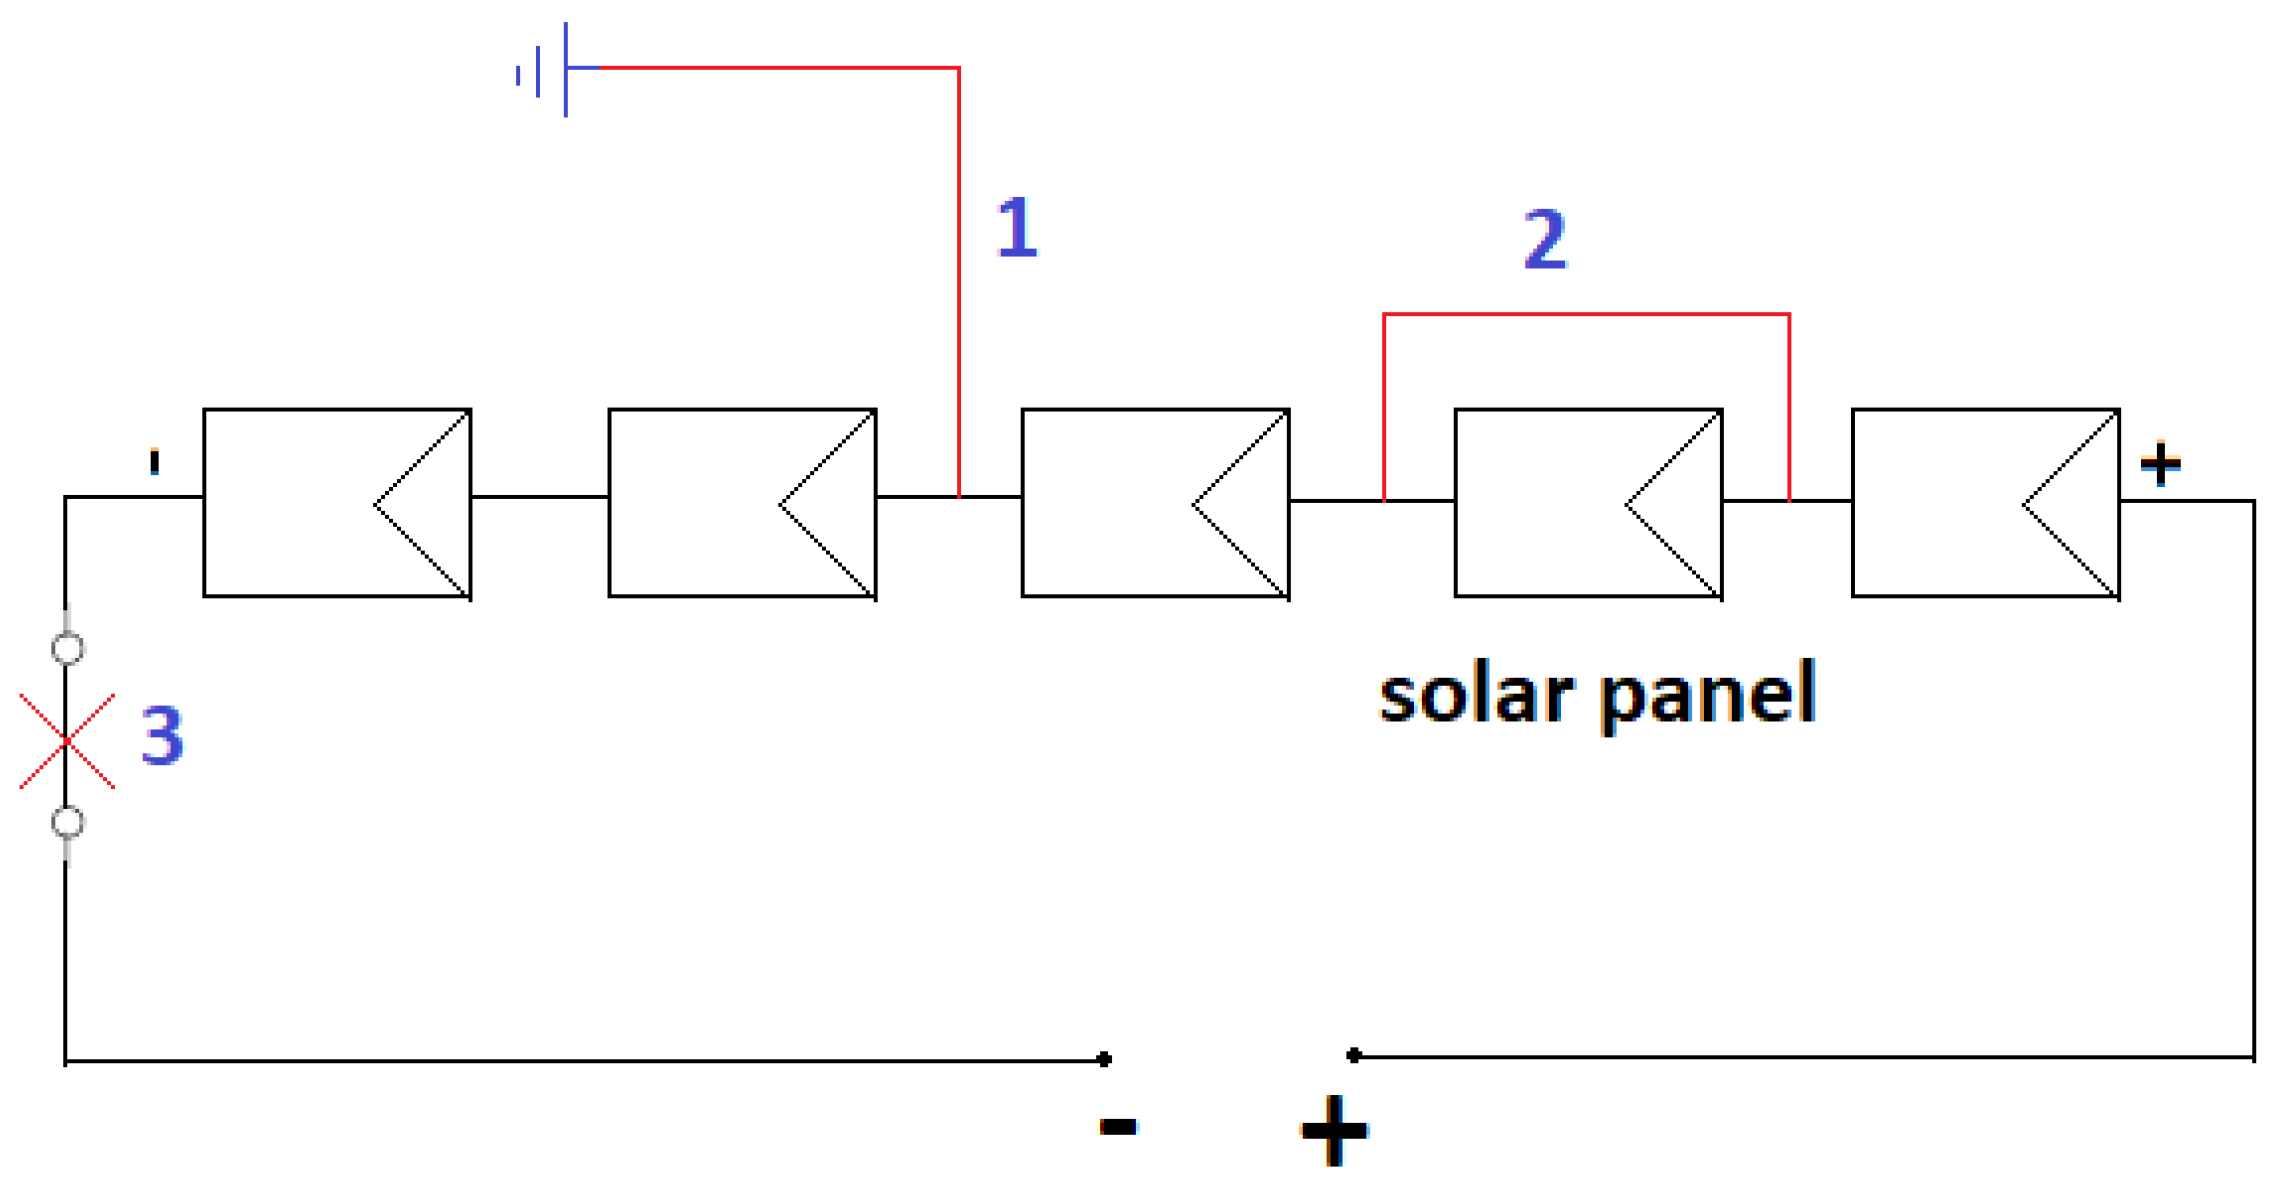
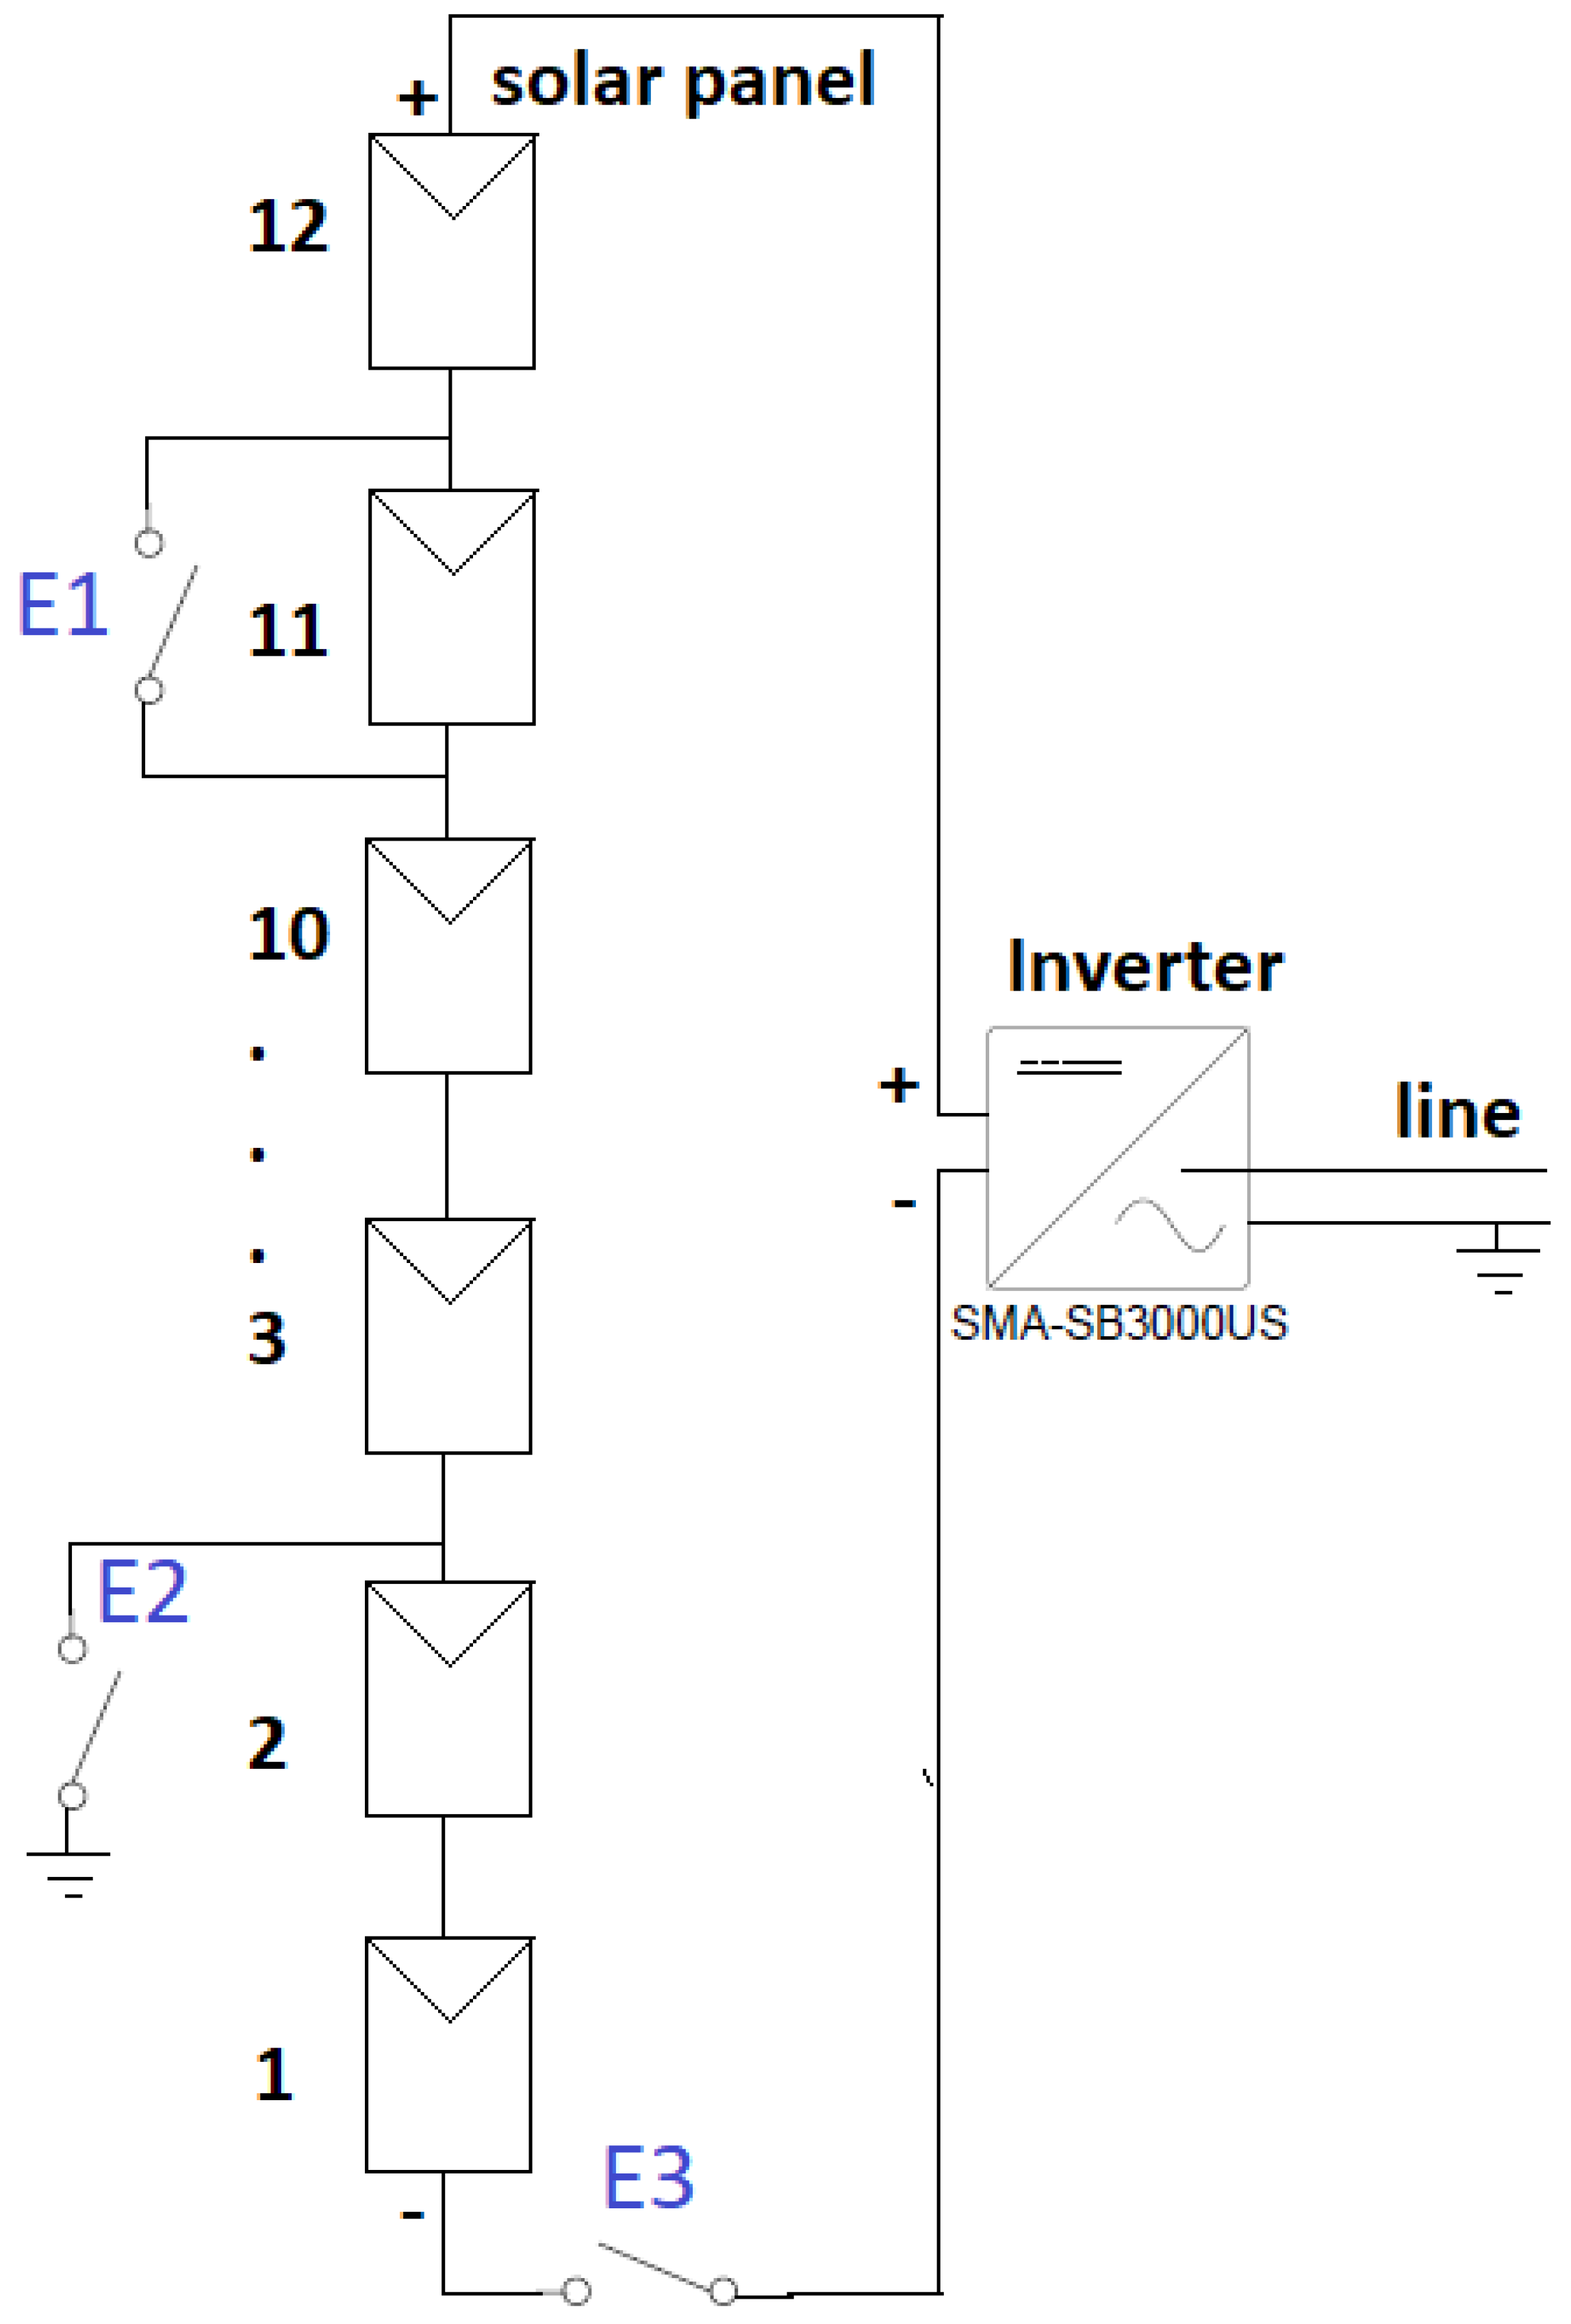
- C. Electrical faultsIn previous research work, electrical failures were evaluated at the experimental level by modifying the electrical connections of the PV system, e.g., open circuits and short circuits. Using [31] as a reference, switches were installed in the study PV arrays to emulate that effect; an electrical diagram of how this was implemented is shown in Figure 8. The E1 suboptimal conditions was randomly located in each of the evaluated cases. E2 was applied, maintaining the fixed position to generate a short circuit at a low voltage and not to expose the circuit to electric arcs. The E3 suboptimal conditions has the same effect in any location due to all the modules’ series circuit configuration. Therefore, the location of the switch was not changed.
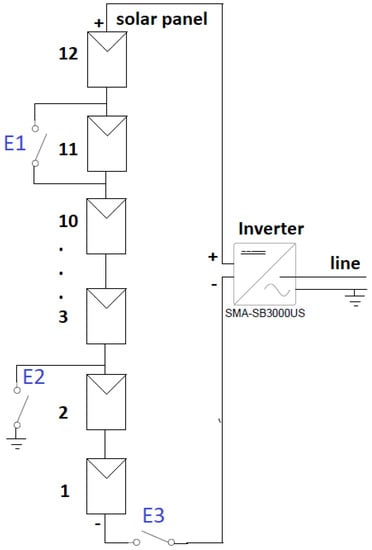 Figure 8. Diagram of the location of the switches used to generate the electrical suboptimal conditions evaluated in the experiment.
2.8. Date and Conditions of the Experiment
The IRT and VI measurements were made between 18 August and 2 September 2020. EA measurements were made between 17 September and 30 October. The average ambient temperature was 30 °C, the relative humidity 60%, and the reflected temperature 22 °C.
2.9. Power Normalizing
A comparison was made of the average power generated between the study PV arrays (strings 4 and 6) and the control PV array (string 2). The measurement was made during two hours with an irradiance greater than . A difference of 0.67% and −0.59% was obtained for strings 4 and 6, respectively. These results allowed us to consider that the strings are equivalent.
3. Results and Discussion
3.1. Power Affect for Each Case Evaluated in the Experiment
Each suboptimal condition was applied to the study PV arrays (strings 4 and 6) and was compared with the control PV array (string 2); with this, it was verified that all the cases had an affectation of at least 4%, i.e., that it met the criteria of failure. The results are shown in Table 5; these considered the normalization of the power measurements with respect to the reference array [29].
Table 5.
Validation of the effect on power of each of the suboptimal conditions evaluated in the experiment.
3.2. Results of the Experiment
For each case evaluated, a discrete output variable was generated to indicate whether or not the technique detected failure; the results are shown in Table 6. This table incorporates the VI and IRT measurements that had been reported by [29] for consideration in this new analysis.
Table 6.
Summary of the results of the experiment. D = Detected, ND = Not detected, NA = Not apply, S = soiling, PS = partial shading and E = electrical fault.
3.3. Image Analysis
Each case evaluated was analyzed manually for IRT and VI. The thermographs were processed with Flir Tools 5.13, and the RGB images were analyzed with traditional photo viewing software. Figure 9, Figure 10 and Figure 11 show some electrical failures analyzed with IRT. Employing the VI, it was not possible to detect electrical failures.
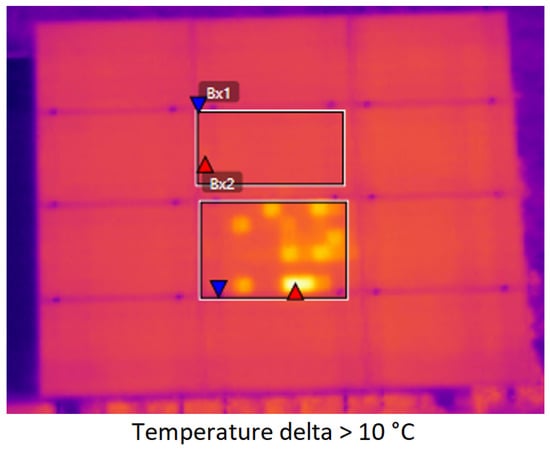
Figure 9.
IR image analyzed for case 37. In this one, the heating generated in a solar PV module due to the presence of a short circuit is observed.
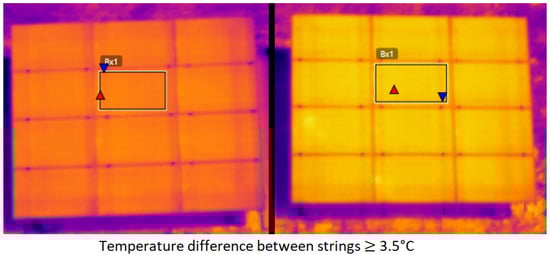
Figure 10.
IR images analyzed for case 39. String 2 (left) and string 6 (right). In this one, it can be seen that string 6 had a higher temperature than the control PV array (string 2) due to the open circuit.
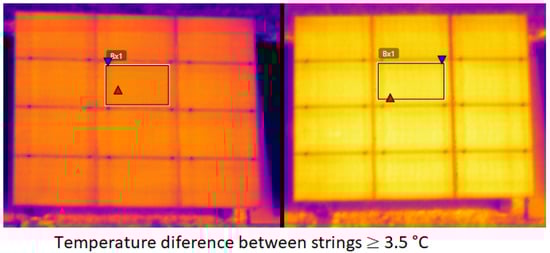
Figure 11.
IR images analyzed for case 30. String 2 (left) and string 4 (right). In this case, the short circuit to earth caused the inverter to open the circuit (electrical protection), causing an increase in the temperature of the entire string.
3.4. EA Analysis
Table 7 shows the detail of the measurements with the EA. It is observed that for all types of failures, in some cases, the failure was not detected; this is due to the fact that the estimated power was less than it should be under conditions without failure (cases 18, 21, and 33). Also, cases were found in which the estimated power affect deviated by less than 1% from the criteria for detecting failure (cases 13, 19, 20, and 34); which shows that accuracy errors of less than 1% will affect the effectiveness of the technique. This requires high precision in the instrumentation, in the parameters of the mathematical model, and in the processing of the information, with their respective experimental validation.
Table 7.
Electrical measurements for the evaluation of each suboptimal condition with the EA technique. The last column on the right indicates the output variable of this method.
3.5. Comparison of the Three Techniques
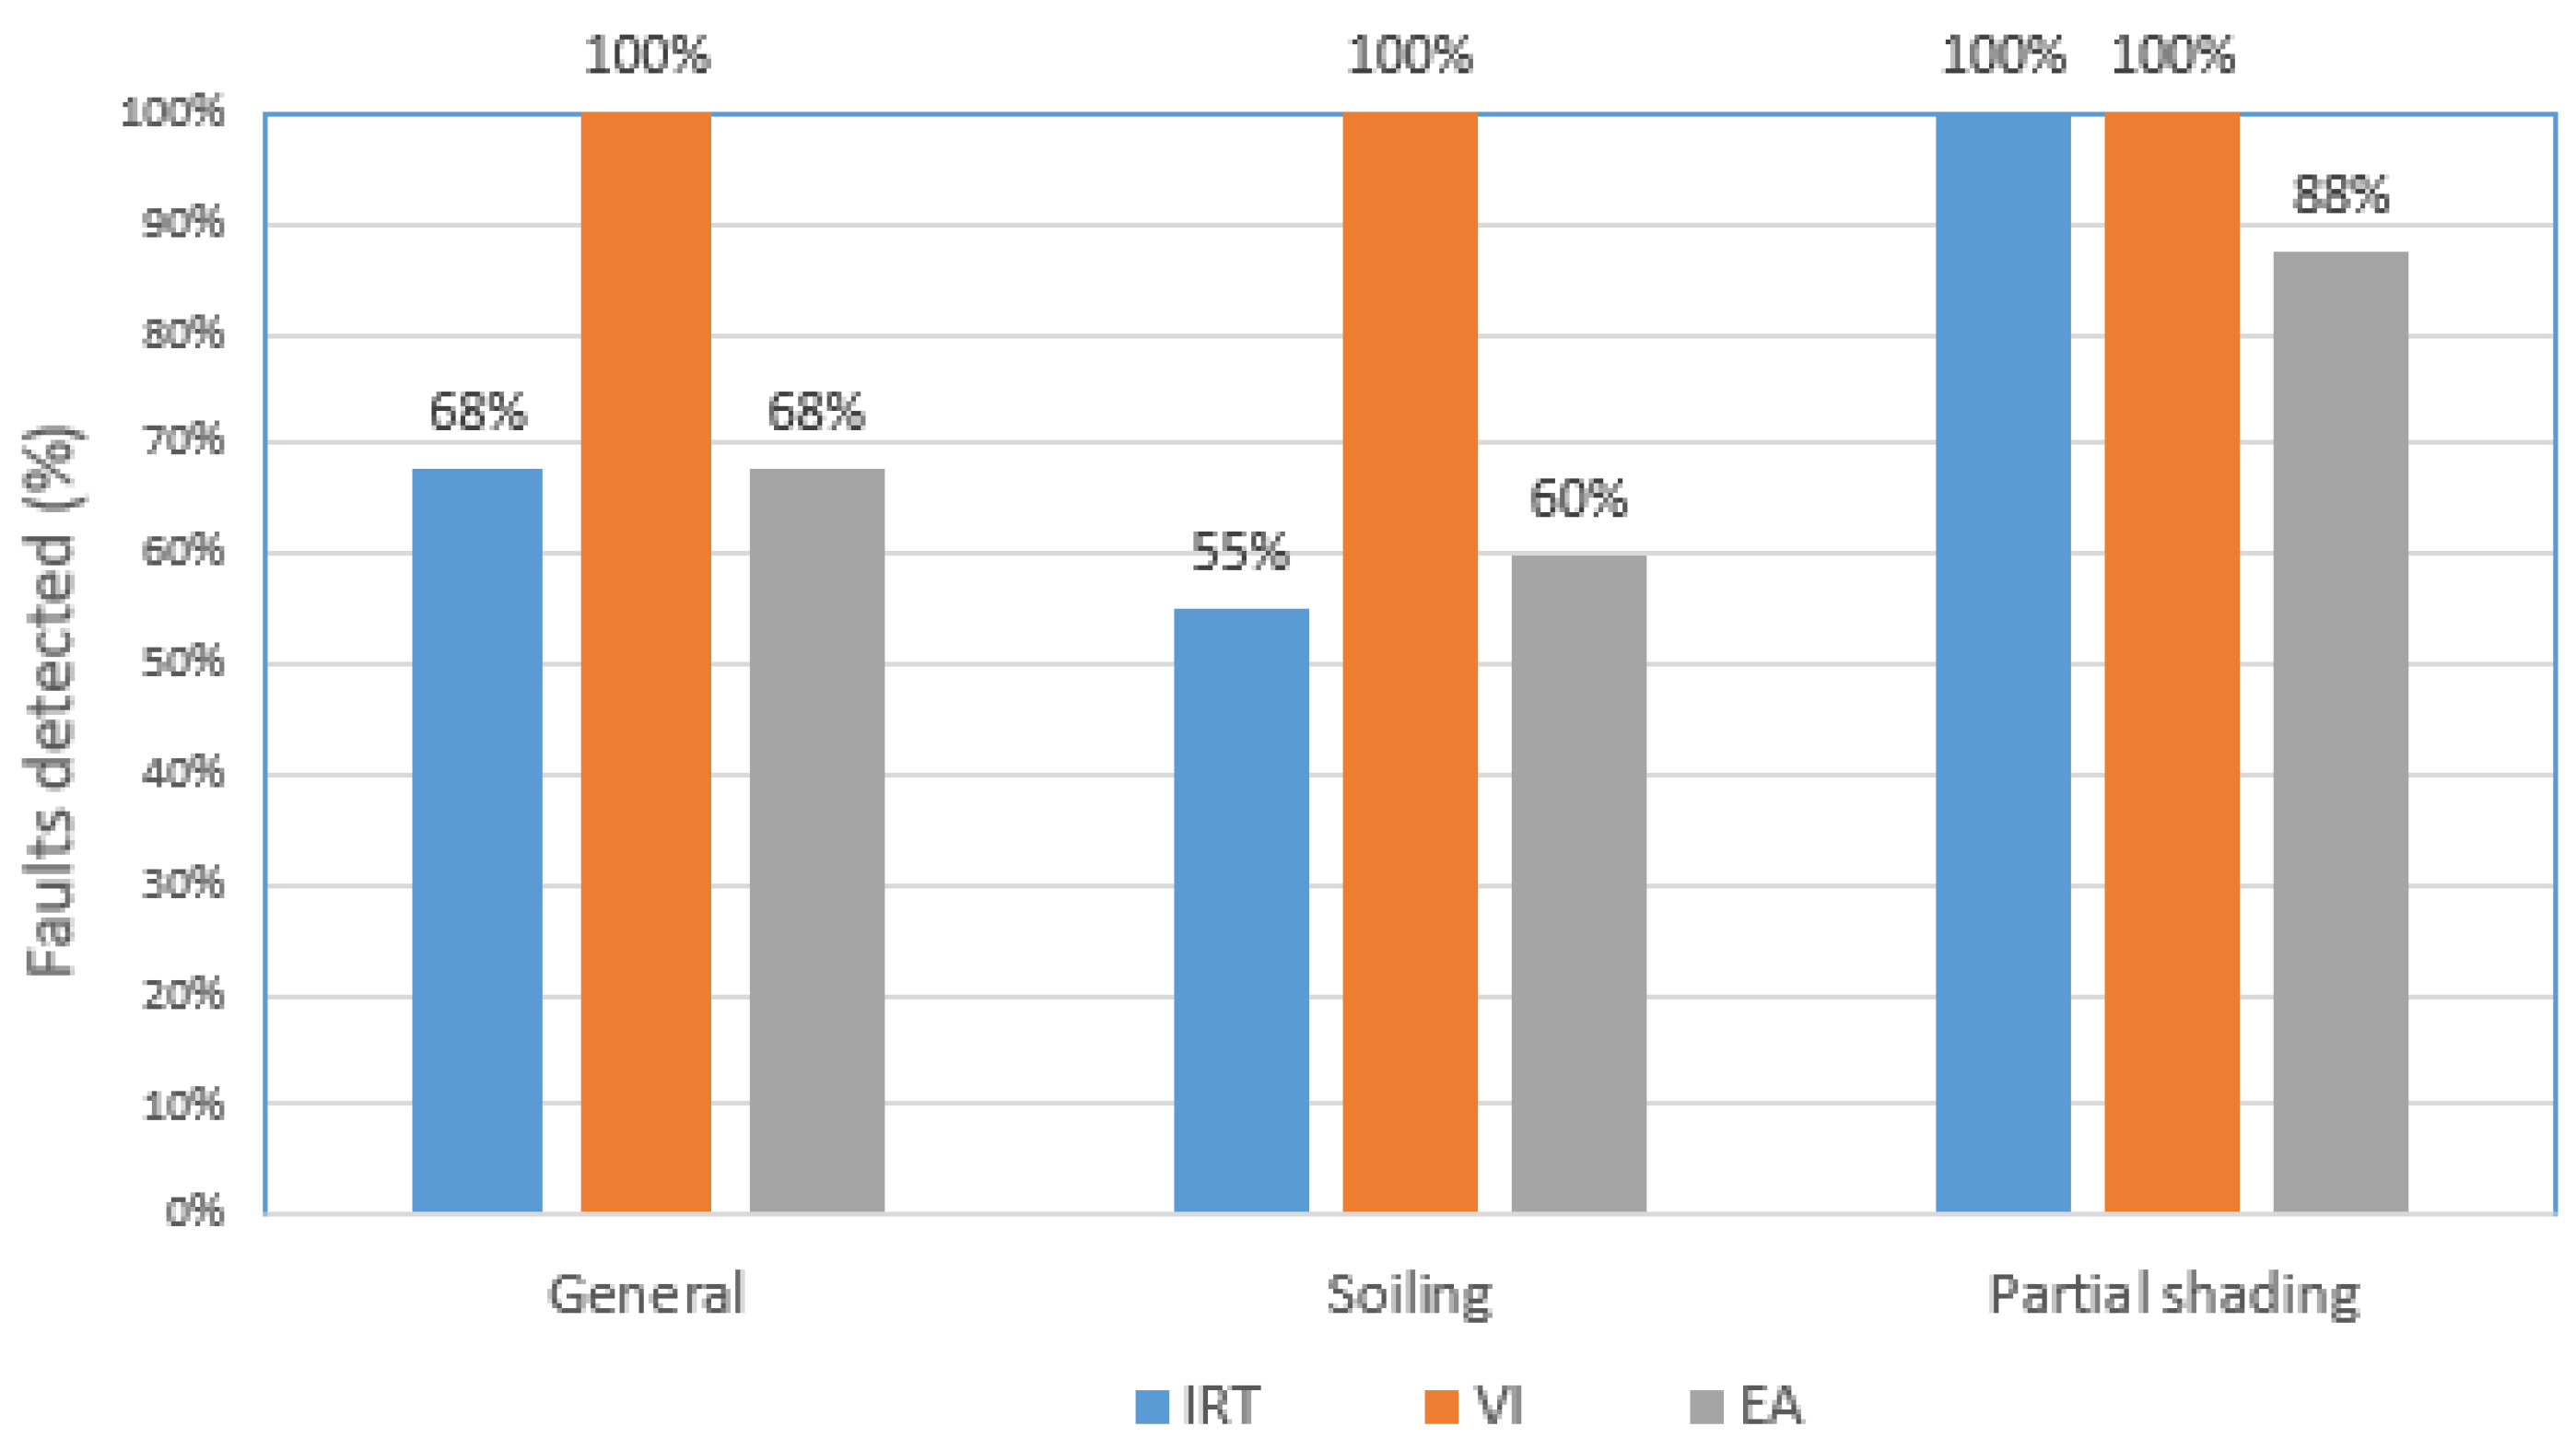
Considering that visual inspection does not detect the electrical faults examined, we initially compared the effectiveness of the techniques for detecting soiling and partial shading; this is shown in Figure 12. It was found that IV achieved the maximum effectiveness (100%), outperforming the other two techniques (68% each). These results reinforce the findings found in [29] on the high effectiveness of VI in detecting this type of failure concerning other techniques. Comparing the number of cases detected by IRT and EA shows that EA outperformed IRT in the soiling tests but had lower performance in the partial shadowing tests.

Figure 12.
Percentage of failures detected by the techniques under study for soiling and partial shading conditions.
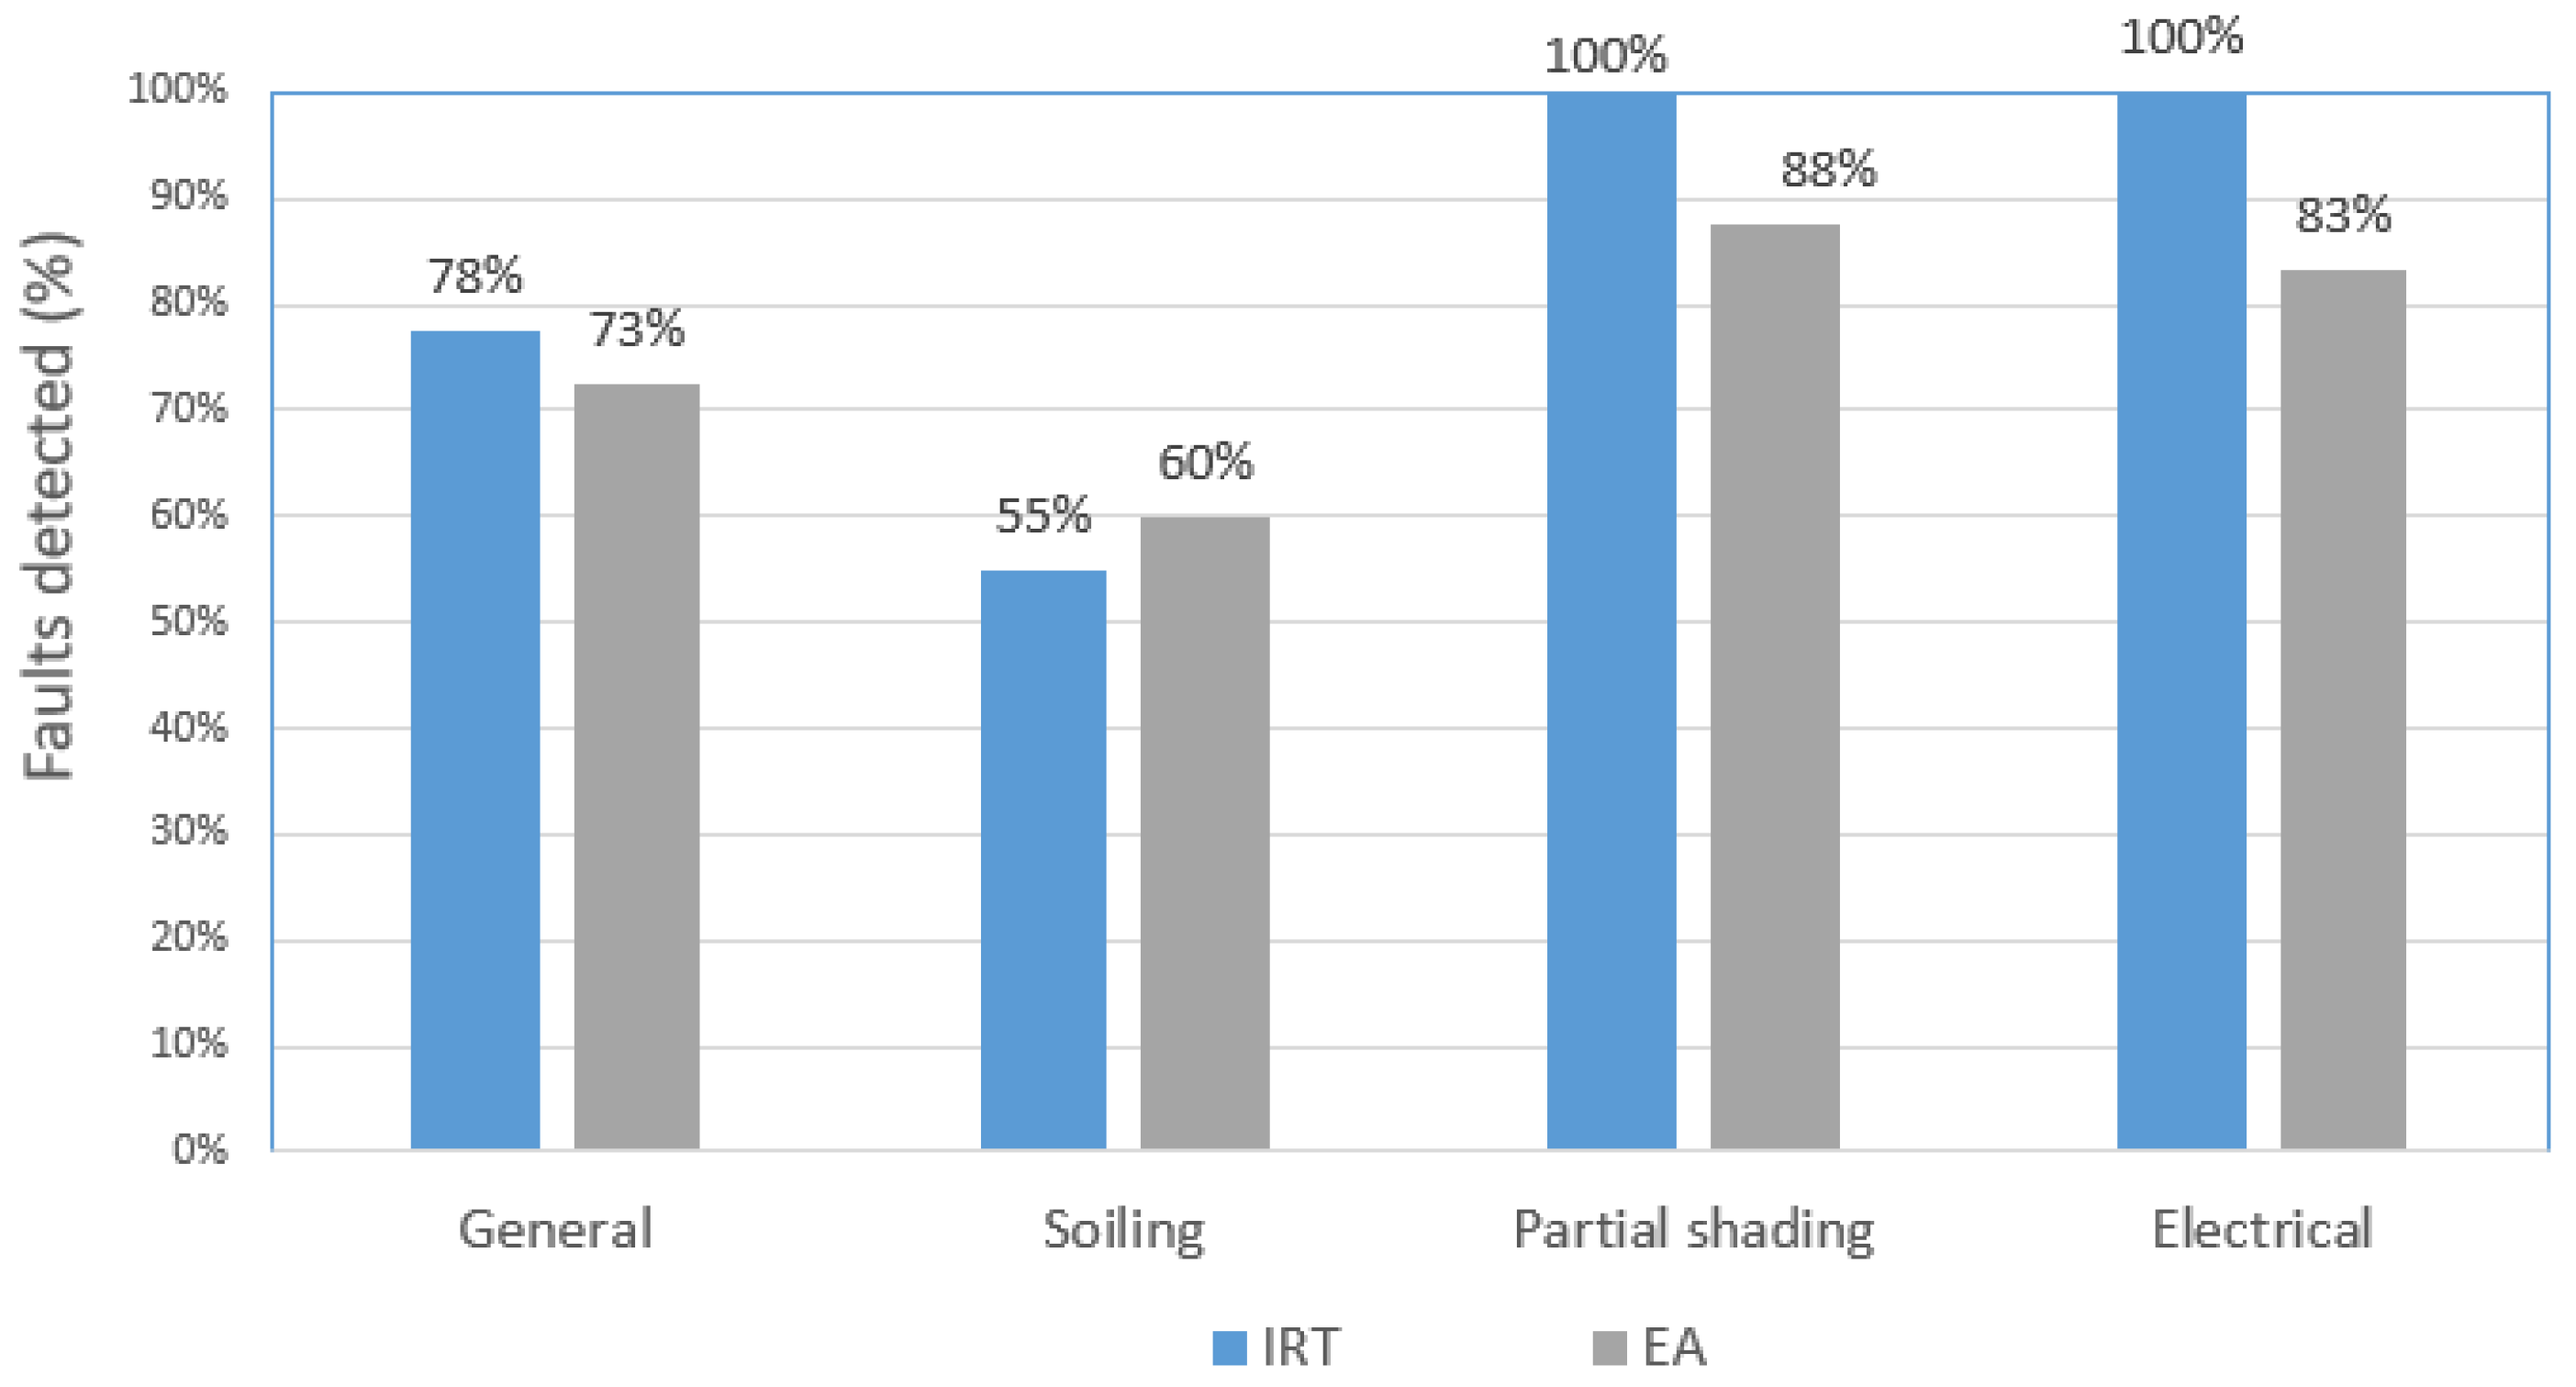
Figure 13 shows the number of failures detected for IRT and EA for the three types of failures studied in this research. It can be observed that, in general, the IRT detected more faults, being surpassed by EA only for soiling detection.

Figure 13.
Percentage of failures detected by IRT and EA for the three types of failures analyzed in this research.
From Figure 12 and Figure 13 it can be seen that in general, soiling is the type of condition that was least detected, while partial shading was the most detected. Electrical faults were also mainly detected; however, it should be considered that VI does not work for this type of fault.
Considering the output variable of continuous type (1 = detected and 0 = not detected), an analysis of the variance was made. The variances were 0.219, 0.0417, and 0.0797 for the soiling, partial shading, and electrical faults, respectively. This indicates that the detection of soiling faults had greater variability. The high variability detecting soiling indicates that more research should be done focused on improving the effectiveness of IRT and EA detecting soiling.
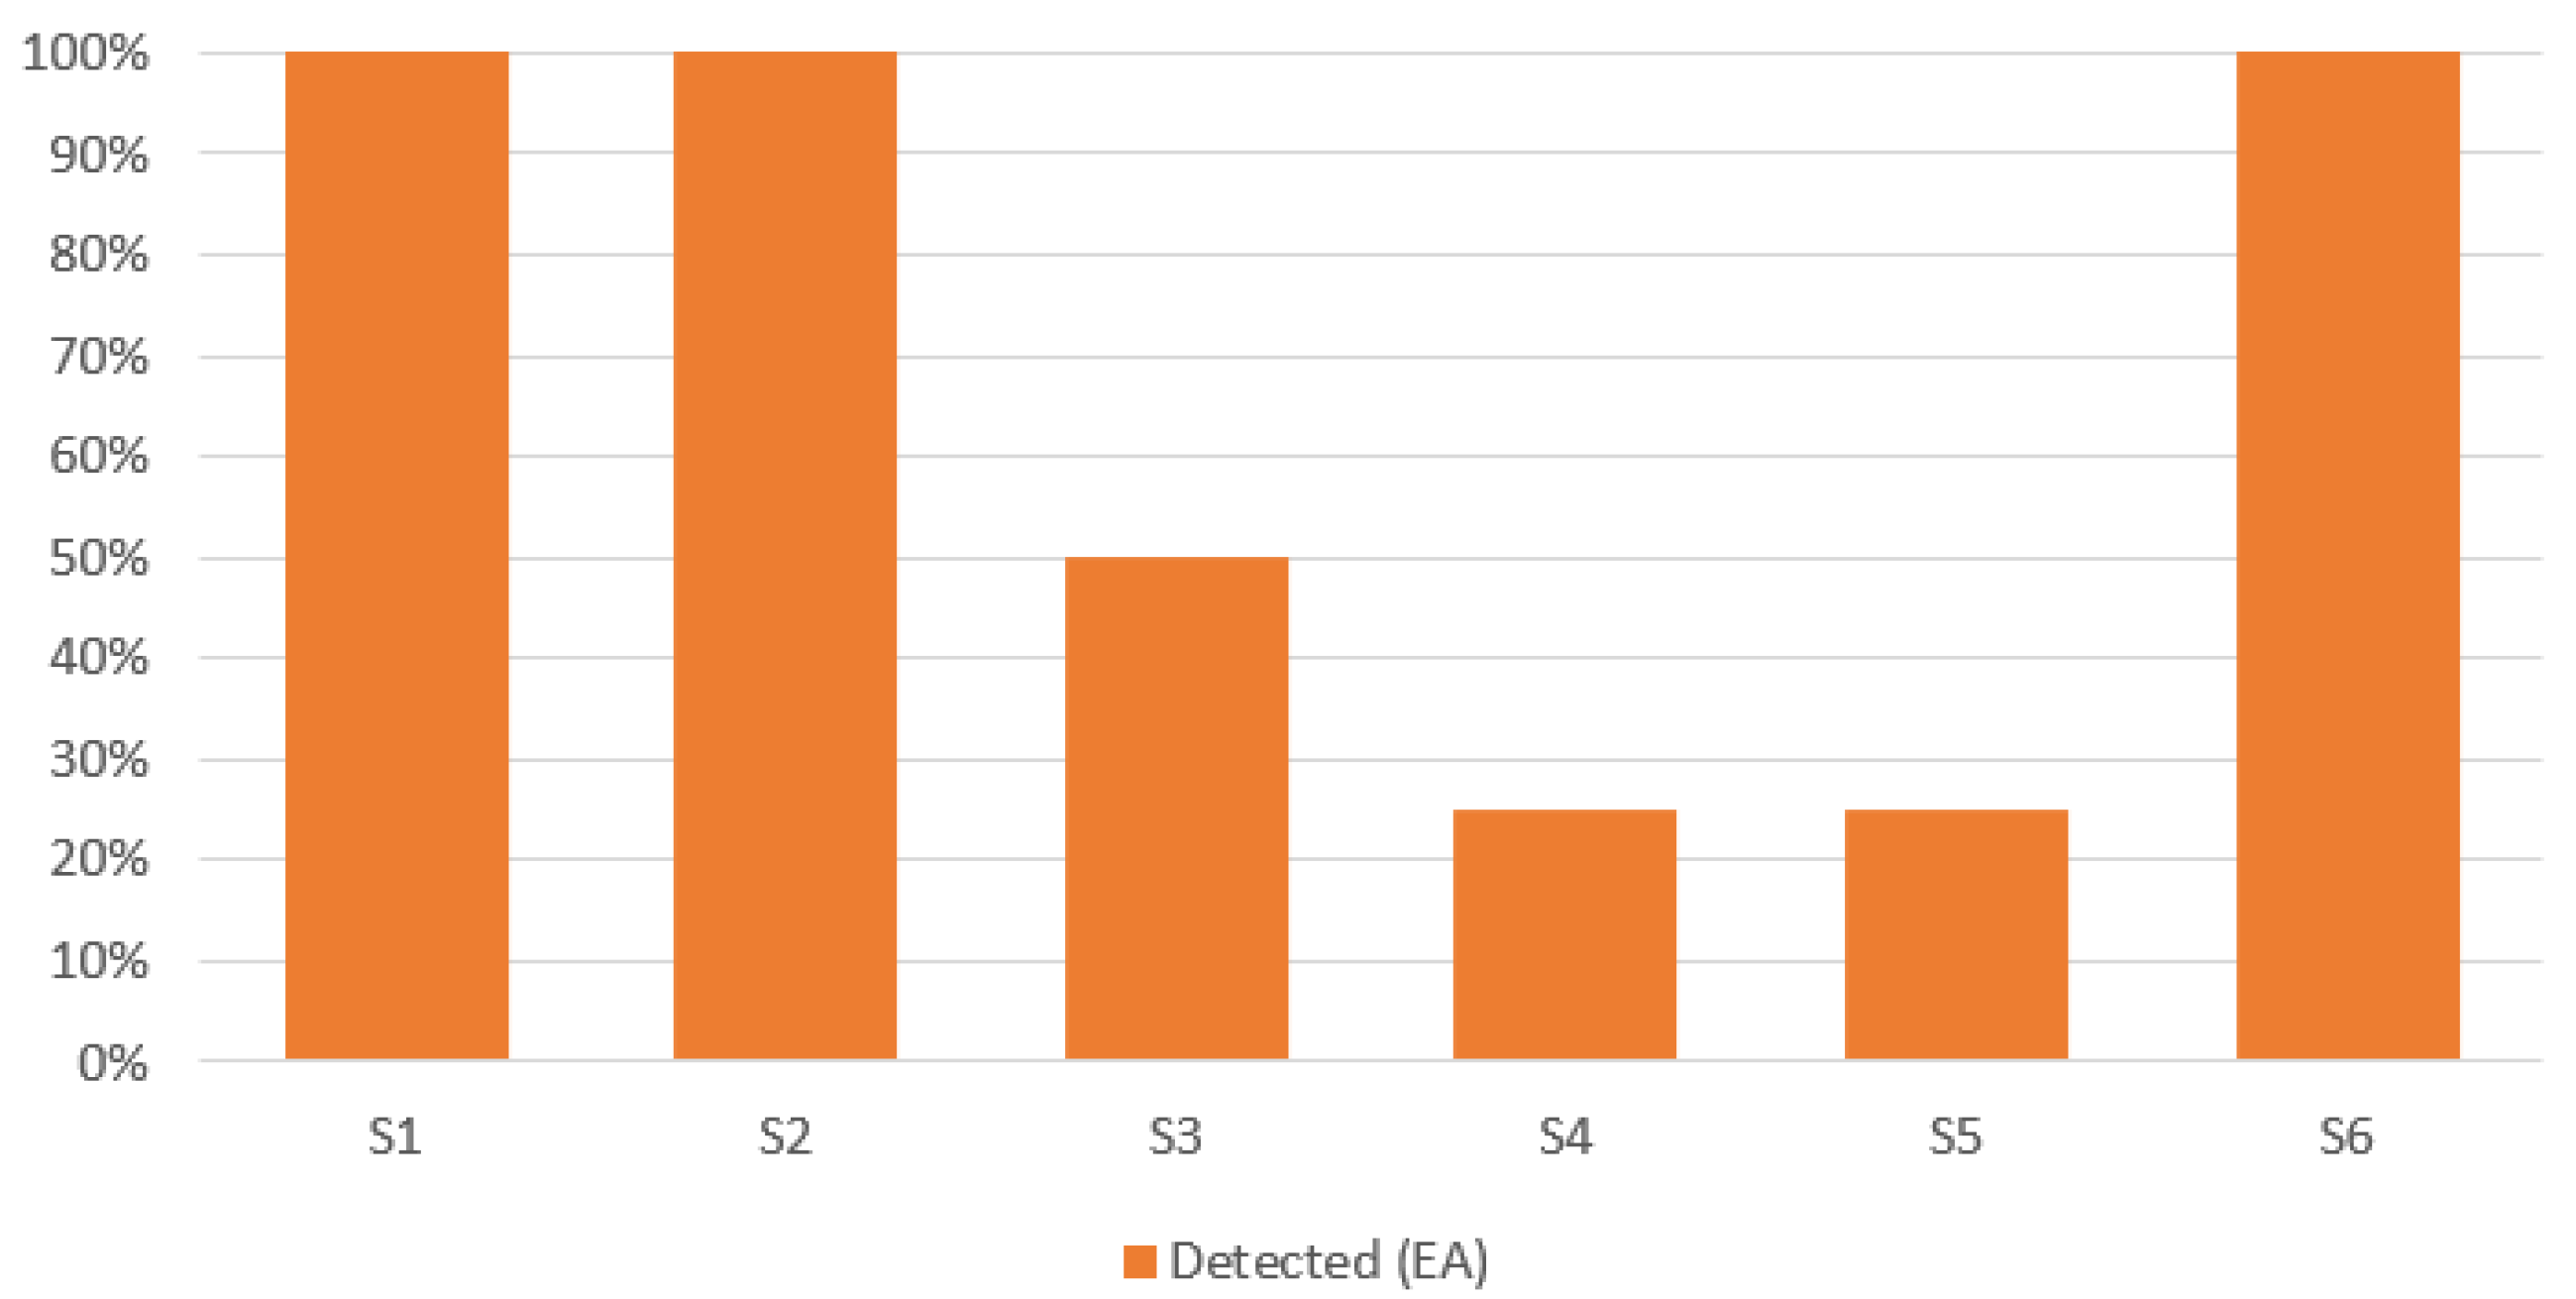
Figure 14 shows the results of soiling detection by EA, in which it can be seen that all types of soiling were detected at least in a low percentage of occasions. This indicates that the EA technique does detect the types of soiling evaluated but with less effectiveness. The reasons why, in some cases, this type of failure was detected and in others not, requires a more detailed study specifically on this subject. This compartment had also been identified for IRT detecting soiling [29].
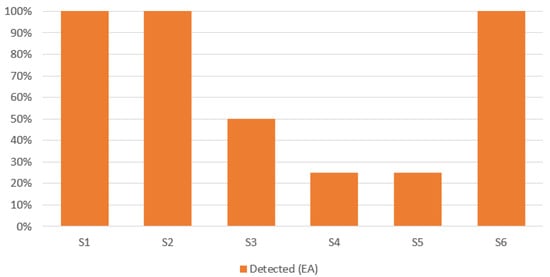
Figure 14.
Percentage of soiling failures that were detected by the EA. S1 and S2 were applied twice, the other four times.
The only technique based on qualitative criteria for the detection of failures was the VI, which implies that its effectiveness could be affected due to the subjectivity that could exist before other types of failures. Therefore, the definition of quantitative criteria for the VI is an area that could vary the technique’s performance for certain types of failures.
From Table 6 it can be seen that each of the suboptimal conditions that were evaluated were detected by at least one of the failure detection techniques. Therefore, for the suboptimal conditions evaluated and the techniques used, combining them is the way to achieve maximum detection.
3.6. Statistical Hypothesis Testing
Using contingency tables and Fisher’s exact test, the effectiveness of the techniques can be evaluated by comparing them in pairs [32,33]. To determine if there is a significant difference between the total number of failures detected by each technique, the following hypothesis tests were defined: as follows:
where N is the number of identified failures, i, j, and k are IRT, VI, and EA techniques, respectively. Table 8 shows the p-values obtained for each hypothesis test.
Table 8.
p-value obtained for each of the hypotheses evaluated.
Considering a significance level = 0.05 because no major requirement has been identified [34], the hypotheses and are rejected; that is, significant differences were found between the number of faults detected. Each of the techniques was also compared for the different types of failure applied, for which p-value and odd ratio (OR) was obtained for the cases shown in Table 9.
Table 9.
p-value less than and OR obtained by analyzing significant differences for each type of failure.
From the analysis of Table 8 and Table 9, it was interpreted which method was better than another for each type of failure; this is summarized in Table 10. The OR coefficients shown indicate that, in addition to accepting the alternative hypotheses for these types of failure, there is a high probability that the technique will succeed in detecting a failure of this type compared to the other technique [35].
Table 10.
Significant differences in the detection of each type of failure between the methods studied. Note: The types of failures not indicated had no significant differences.
4. Conclusions
The effectiveness of IRT and EA detecting soiling, partial shading and electrical faults was 78% and 73% respectively. Comparing the three techniques, it was determined that to detect soiling and partial shadows, VI is the most effective technique; reaching 100% effectiveness for the suboptimal conditions under study. However, we cannot say that this technique in general terms is better than the other two, as VI could not be used to detect electrical faults. It should also be considered that there are multiple techniques for fault detection by means of electrical analysis, one of them was used in this study. The effectiveness of other techniques by electrical analysis remains to be studied.
Analyzing each type of failure, significant differences were found for the VI. This was the best technique detecting soiling (100%) in comparison to IRT (55%) and EA (60%). In addition, partial shadows were the type of fault that was mostly detected by all the techniques, finding that none of the techniques is more effective than the others for this failure.
When comparing these results with those found in [29], it is identified that the calculated effectiveness depends on the design of the experiment, therefore, the procedures of each technique, the criteria for detection of failures and the suboptimal conditions to be evaluated, must be carefully selected and documented in detail to support the results found.
The determination of the effectiveness of EA detecting soiling showed that the same suboptimal condition can be detected in some cases and not in others, therefore, this type of failure can be analyzed in more detail using this methodology increasing the replication of the suboptimal conditions to increase the statistical power.
For maximum detection of suboptimal conditions such as those studied in this research, VI should be combined with IRT or EA, using only one of the techniques will leave failures undetected and it was not found necessary to combine EA with IRT, since both have equivalent effectiveness. It is still pending to make a comparison around other capabilities of the techniques, for example, the location and identification of faults.
The results obtained in this work allow a quantitative comparison of the effectiveness of IRT, EA, and VI techniques, which contributes to mitigating a knowledge gap detected in this area. Furthermore, it contributes to improving fault detection techniques since information regarding the strengths and limitations of each of them has been obtained experimentally. Moreover, future work that combines the methods mentioned above can improve existing fault detection techniques under challenging conditions, for instance, when a high level of diffuse irradiance is present.
Author Contributions
Conceptualization, C.M.; Investigation, L.C.-V.; Methodology, A.M.-P.; Supervision, L.D.M.-S. and C.M. All authors have read and agreed to the published version of the manuscript.
Funding
This research was funded by the Vice Rector’s Office for Research and Extension of the Costa Rica Institute of Technology, grant number 5402-1360-4201.
Institutional Review Board Statement
Not applicable.
Informed Consent Statement
Not applicable.
Data Availability Statement
Not applicable.
Conflicts of Interest
The authors declare no conflict of interest.
Nomenclature and Abbreviates
| Symbol | Quantity | Unit/Value |
| Electrical efficiency | % | |
| Electrical efficiency with wiring and aging losses | % | |
| P | Electical efficiency with losses | W |
| Calibrated electrical efficiency of the array | W | |
| T | Cell temperature | °C |
| G | Irradiance | W/m |
| Array area | m | |
| k | Experimental efficiency correction factor | 1.0111 |
| a | Experimental efficiency correction constant | −35.73% |
| Wire losses | 0.01 | |
| Aging losses | 0.0365 | |
| HFOV | Horizontal Field of View | ° |
| VFOV | Vertical Field of View | ° |
| Significance level | 0.05 | |
| Abbreviaton | Description | |
| PV | Photovoltaic | |
| IRT | Infrared thermography | |
| VI | Visual inspection | |
| EA | Electrical analysis | |
| PS | Partial shading | |
| S | Soiling | |
| E | Electrical Faults | |
| UAV | Unmanned Aerial Vehicle | |
| RGB | Red, green and blue | |
| S1 | Soiling condition 1 | |
| S2 | Soiling condition 2 | |
| S3 | Soiling condition 3 | |
| S4 | Soiling condition 4 | |
| S5 | Soiling condition 5 | |
| S6 | Soiling condition 6 | |
| PS1 | Partial shading condition 1 | |
| PS2 | Partial shading condition 2 |
References
- Zhao, Y. Fault Detection, Classification and Protection in Solar Photovoltaic Arrays; Technical Report; Northeastern University: Boston, MA, USA, 2015. [Google Scholar]
- Zsiborács, H.; Zentkó, L.; Pintér, G.; Vincze, A.; Baranyai, N.H. Assessing shading losses of photovoltaic power plants based on string data. Energy Rep. 2021, 7, 3400–3409. [Google Scholar] [CrossRef]
- Mellit, A.; Tina, G.; Kalogirou, S. Fault detection and diagnosis methods for photovoltaic systems: A review. Renew. Sustain. Energy Rev. 2018, 91, 1–17. [Google Scholar] [CrossRef]
- Madeti, S.R.; Singh, S. A comprehensive study on different types of faults and detection techniques for solar photovoltaic system. Sol. Energy 2017, 158, 161–185. [Google Scholar] [CrossRef]
- Zefri, Y.; ElKettani, A.; Sebari, I.; Lamallam, S.A. Thermal Infrared and Visual Inspection of Photovoltaic Installations by UAV Photogrammetry—Application Case: Morocco. Drones 2018, 2, 41. [Google Scholar] [CrossRef] [Green Version]
- Murillo-Soto, L.D.; Meza, C. Diagnose Algorithm and Fault Characterization for Photovoltaic Arrays: A Simulation Study. In Lecture Notes in Electrical Engineering; Springer International Publishing: Base, Switzerland, 2020; pp. 567–582. [Google Scholar] [CrossRef]
- Corrales, D.; Cardinale-Villalobos, L.; Meza, C.; Murillo-Soto, L.D. Detection of Suboptimal Conditions in Photovoltaic Installations for Household-Prosumers. In Proceedings of the International Conference on Sustainable Smart Cities and Territories, Doha, Qatar, 27–29 April 2021; pp. 26–36. [Google Scholar] [CrossRef]
- Appiah, A.Y.; Zhang, X.; Ayawli, B.B.K.; Kyeremeh, F. Review and Performance Evaluation of Photovoltaic Array Fault Detection and Diagnosis Techniques. Int. J. Photoenergy 2019, 2019, 6953530. [Google Scholar] [CrossRef]
- Cardinale-Villalobos, L.; Rimolo-Donadio, R.; Meza, C. Solar Panel Failure Detection by Infrared UAS Digital Photogrammetry: A Case Study. Int. J. Renew. Energy Res. (IJRER) 2020, 10, 1154–1164. [Google Scholar]
- Alam, M.K.; Khan, F.; Johnson, J.; Flicker, J. A Comprehensive Review of Catastrophic Faults in PV Arrays: Types, Detection, and Mitigation Techniques. IEEE J. Photovoltaics 2015, 5, 982–997. [Google Scholar] [CrossRef]
- Zhao, Y.; Ball, R.; Mosesian, J.; de Palma, J.F.; Lehman, B. Graph-Based Semi-supervised Learning for Fault Detection and Classification in Solar Photovoltaic Arrays. IEEE Trans. Power Electron. 2015, 30, 2848–2858. [Google Scholar] [CrossRef]
- Mäki, A.; Valkealahti, S. Power Losses in Long String and Parallel-Connected Short Strings of Series-Connected Silicon-Based Photovoltaic Modules Due to Partial Shading Conditions. IEEE Trans. Energy Convers. 2012, 27, 173–183. [Google Scholar] [CrossRef]
- Maghami, M.R.; Hizam, H.; Gomes, C.; Radzi, M.A.; Rezadad, M.I.; Hajighorbani, S. Power loss due to soiling on solar panel: A review. Renew. Sustain. Energy Rev. 2016, 59, 1307–1316. [Google Scholar] [CrossRef] [Green Version]
- Javed, W.; Wubulikasimu, Y.; Figgis, B.; Guo, B. Characterization of dust accumulated on photovoltaic panels in Doha, Qatar. Sol. Energy 2017, 142, 123–135. [Google Scholar] [CrossRef]
- Chaudhary, A.S.; Chaturvedi, D. Analyzing Defects of Solar Panels under Natural Atmospheric Conditions with Thermal Image Processing. Int. J. Image Graph. Signal Process. 2018, 10, 10–21. [Google Scholar] [CrossRef] [Green Version]
- Tsanakas, J.A.; Ha, L.; Buerhop, C. Faults and infrared thermographic diagnosis in operating c-Si photovoltaic modules: A review of research and future challenges. Renew. Sustain. Energy Rev. 2016, 62, 695–709. [Google Scholar] [CrossRef]
- Wang, Y.; Itako, K.; Kudoh, T.; Koh, K.; Ge, Q. Voltage-Based Hot-Spot Detection Method for Defective Cell in Photovoltaic Module Using Projector. J. Energy Power Eng. 2016, 10, 489–496. [Google Scholar] [CrossRef]
- International Energy Agency. Review on Infrared and Electroluminescence Imaging for PV Field Applications; Technical Report; Photovoltaic Power Systems Programme; IEA: Paris, France, 2018. [Google Scholar]
- Murillo-Soto, L.; Meza, C. Fault detection in solar arrays based on an efficiency threshold. In Proceedings of the 2020 IEEE 11th Latin American Symposium on Circuits Systems (LASCAS), San Jose, CA, USA, 25–28 February 2020; pp. 1–4. [Google Scholar] [CrossRef]
- Pradhan, R.; Panda, A. Performance evaluation of a MPPT controller with model predictive control for a photovoltaic system. Int. J. Electron. 2020, 107, 1543–1558. [Google Scholar] [CrossRef]
- Moretón, R.; Lorenzo, E.; Narvarte, L. Experimental observations on hot-spots and derived acceptance/rejection criteria. Sol. Energy 2015, 118, 28–40. [Google Scholar] [CrossRef] [Green Version]
- International Energy Agency. Review of Failures of Photovoltaic Modules; Technical Report; Performance and Reliability of Photovoltaic Systems; IEA: Paris, France, 2014. [Google Scholar]
- National Renewable Energy Laboratory. Development of a Visual Inspection Data Collection Tool for Evaluation of Fielded PV Module Condition; NREL: Golden, CO, USA, 2012.
- Acciani, G.; Falcone, O.; Vergura, S. Typical defects of PV-cells. In Proceedings of the 2010 IEEE International Symposium on Industrial Electronics, Bari, Italy, 4–7 July 2010; pp. 2745–2749. [Google Scholar] [CrossRef]
- Flir.com. Adjusting Sensitivity & Gain on the FLIR Vue Pro R; FLIR: Boston, MA, USA, 2019. [Google Scholar]
- Flir. Flir Vue Pro and Flir Vue Pro R; FLIR: Boston, MA, USA, 2019. [Google Scholar]
- Tango, T. Repeated Measures Design with Generalized Linear Mixed Models for Randomized Controlled Trials; Taylor & Francis Group: Tokyo, Japan, 2017. [Google Scholar]
- Gutiérreza-Pulido, H.; De la Vara-Salazar, R. Análisis y Diseño de Experimentos, 2nd ed.; McGraw-Hill Interamericana: Mexico City, Mexico, 2008. [Google Scholar]
- Cardinale-Villalobos, L.; Meza, C.; Murillo-Soto, L.D. Experimental comparison of visual inspection and infrared thermography for the detection of soling and partial shading in photovoltaic arrays. In Proceedings of the Third Ibero-American Congress, ICSC-Cities 2020, San José, Costa Rica, 9–11 November 2020. [Google Scholar] [CrossRef]
- Mekki, H.; Mellit, A.; Salhi, H. Artificial neural network-based modelling and fault detection of partial shaded photovoltaic modules. Simul. Model. Pract. Theory 2016, 67, 1–13. [Google Scholar] [CrossRef]
- Zhao, Y.; Lehman, B.; Ball, R.; Mosesian, J.; de Palma, J.F. Outlier detection rules for fault detection in solar photovoltaic arrays. In Proceedings of the 2013 Twenty-Eighth Annual {IEEE} Applied Power Electronics Conference and Exposition ({APEC}), Long Beach, CA, USA, 17–21 March 2013. [Google Scholar] [CrossRef]
- Jones, J.B.; Schropp, M.A. Research fundamentals: Statistical considerations in research design: A simple person’s approach. Acad. Emerg. Med. 2000, 7, 194–199. [Google Scholar] [CrossRef] [Green Version]
- Bolboacă, S.D.; Jäntschi, L.; Sestraş, A.F.; Sestraş, R.E.; Pamfil, D.C. Pearson-Fisher Chi-Square Statistic Revisited. Information 2011, 2, 528–545. [Google Scholar] [CrossRef] [Green Version]
- Ventura-León, J.L. El significado de la significancia estadística: Comentarios a Martínez-Ferrer y colaboradores. Salud Púb. México 2017, 59, 499. [Google Scholar] [CrossRef] [Green Version]
- Mchugh, M.L. The odds ratio: Calculation, usage, and interpretation. Biochem. Med. 2009, 19, 120–126. [Google Scholar] [CrossRef]


Publisher’s Note: MDPI stays neutral with regard to jurisdictional claims in published maps and institutional affiliations. |
© 2022 by the authors. Licensee MDPI, Basel, Switzerland. This article is an open access article distributed under the terms and conditions of the Creative Commons Attribution (CC BY) license (https://creativecommons.org/licenses/by/4.0/).