
Pool Boiling Heat Transfer Performance and Bubble Dynamics from Pin Fin-Modified Surfaces with Geometrical Shape Variation


Abstract
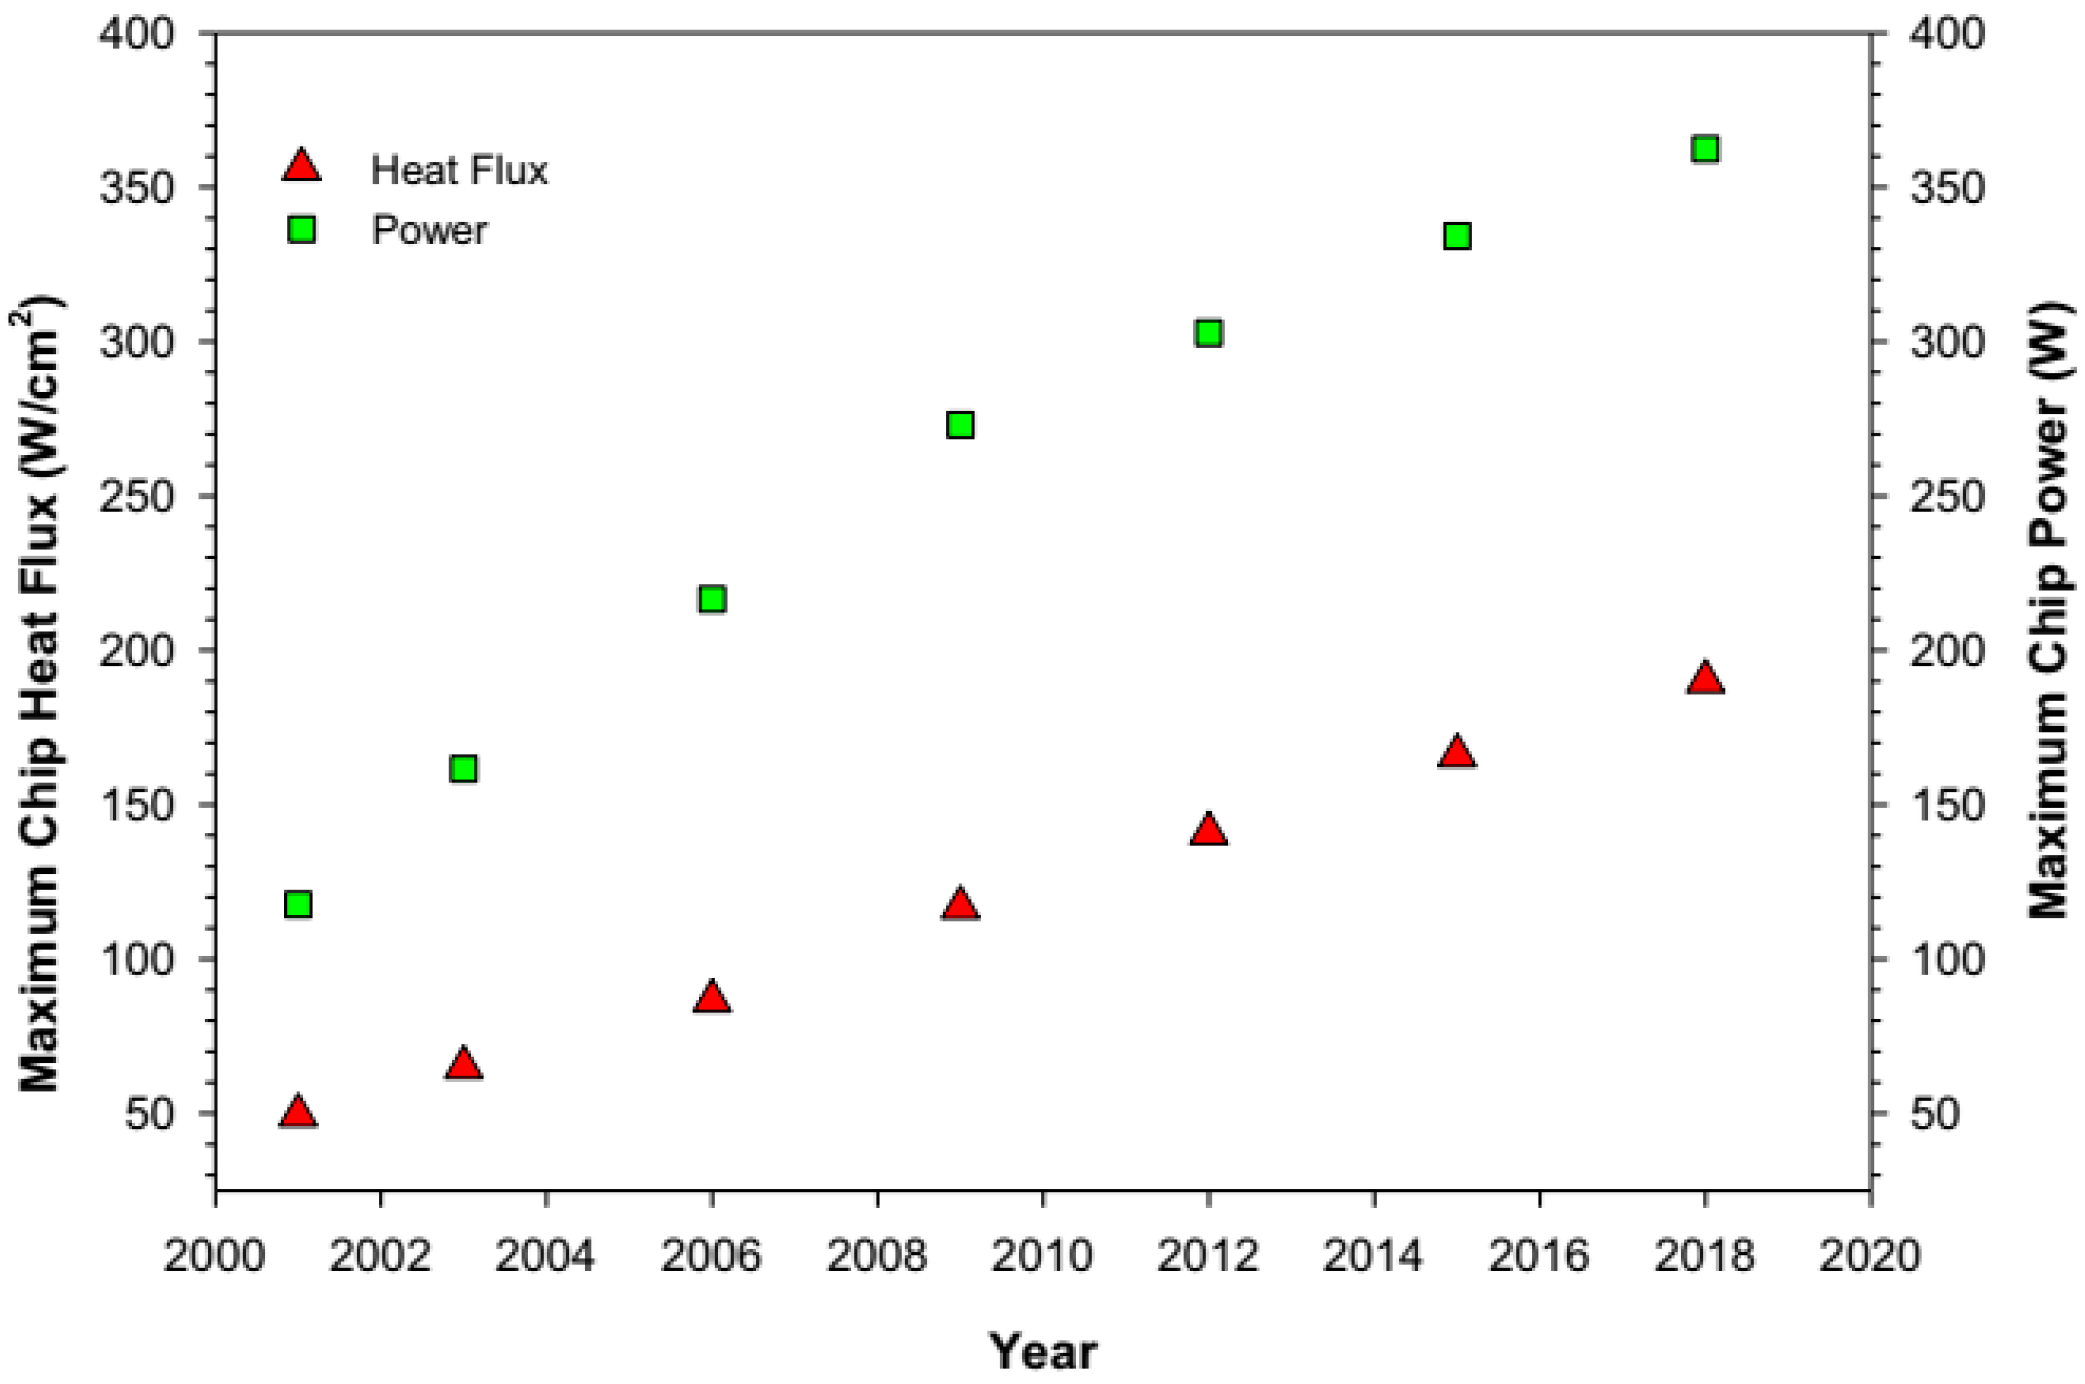
:1. Introduction
2. Experiment
2.1. Experimental Facility
2.2. Test Samples
2.3. Experimental Procedures and Uncertainty Analysis
3. Results and Discussion
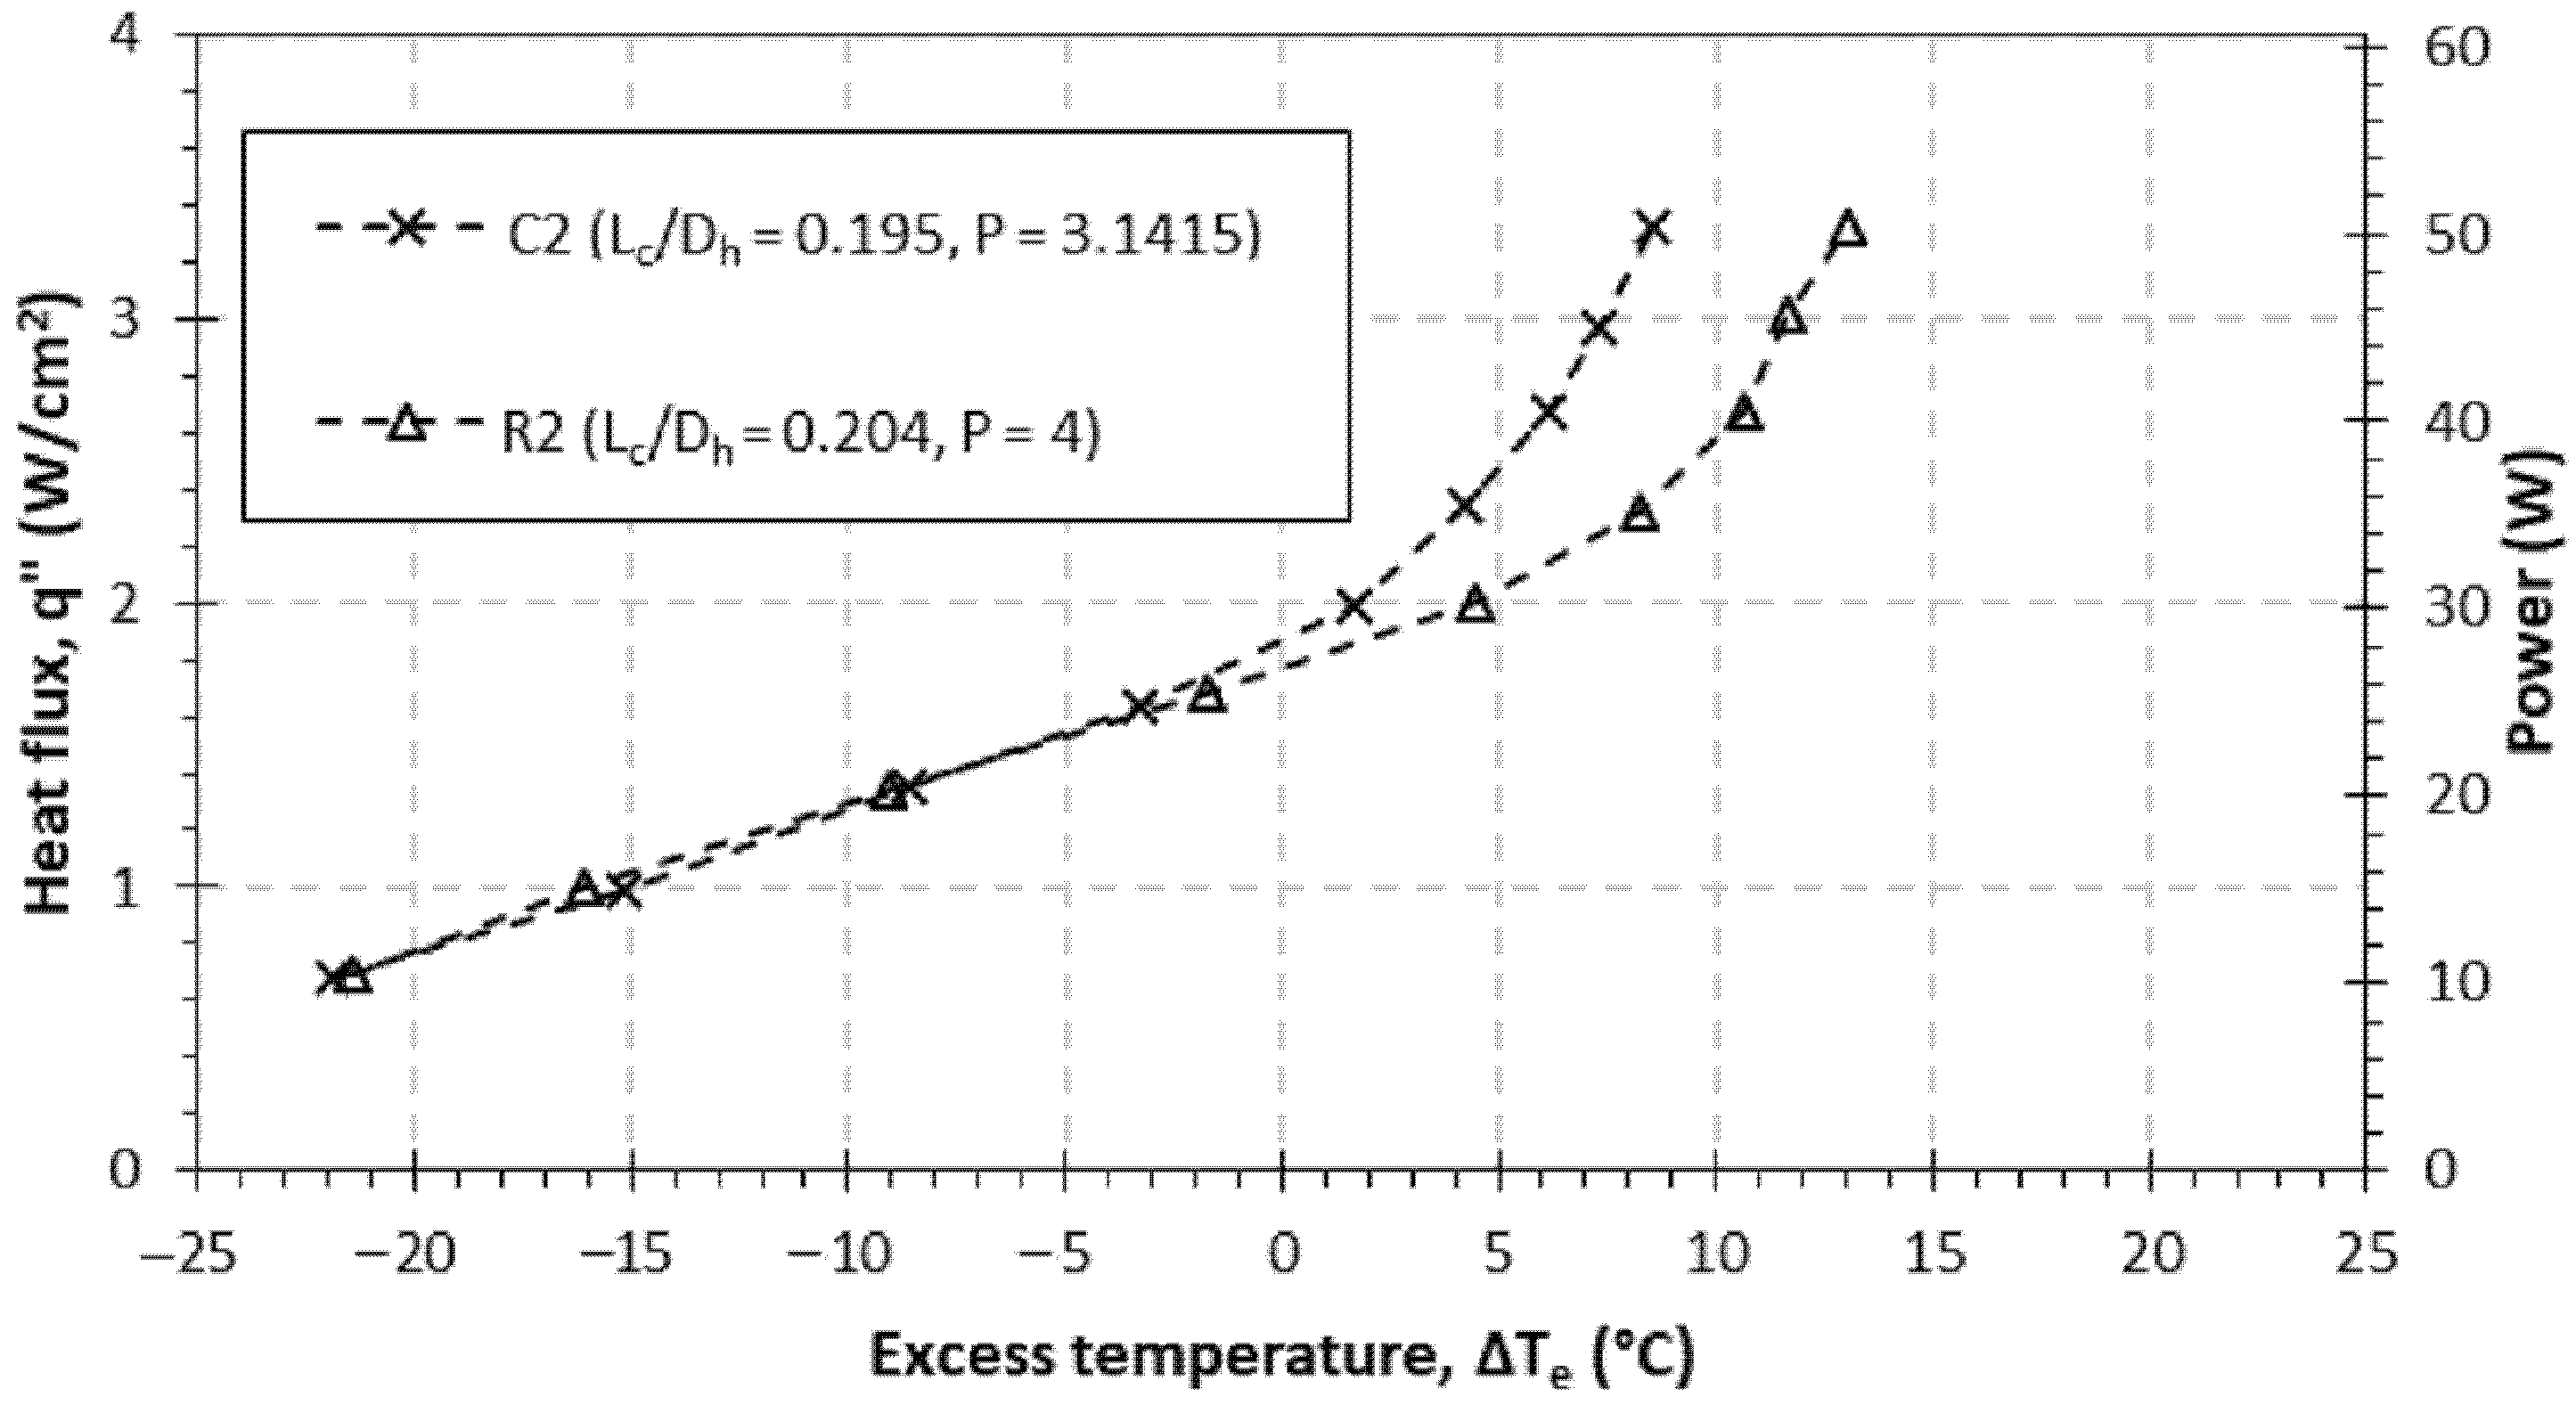
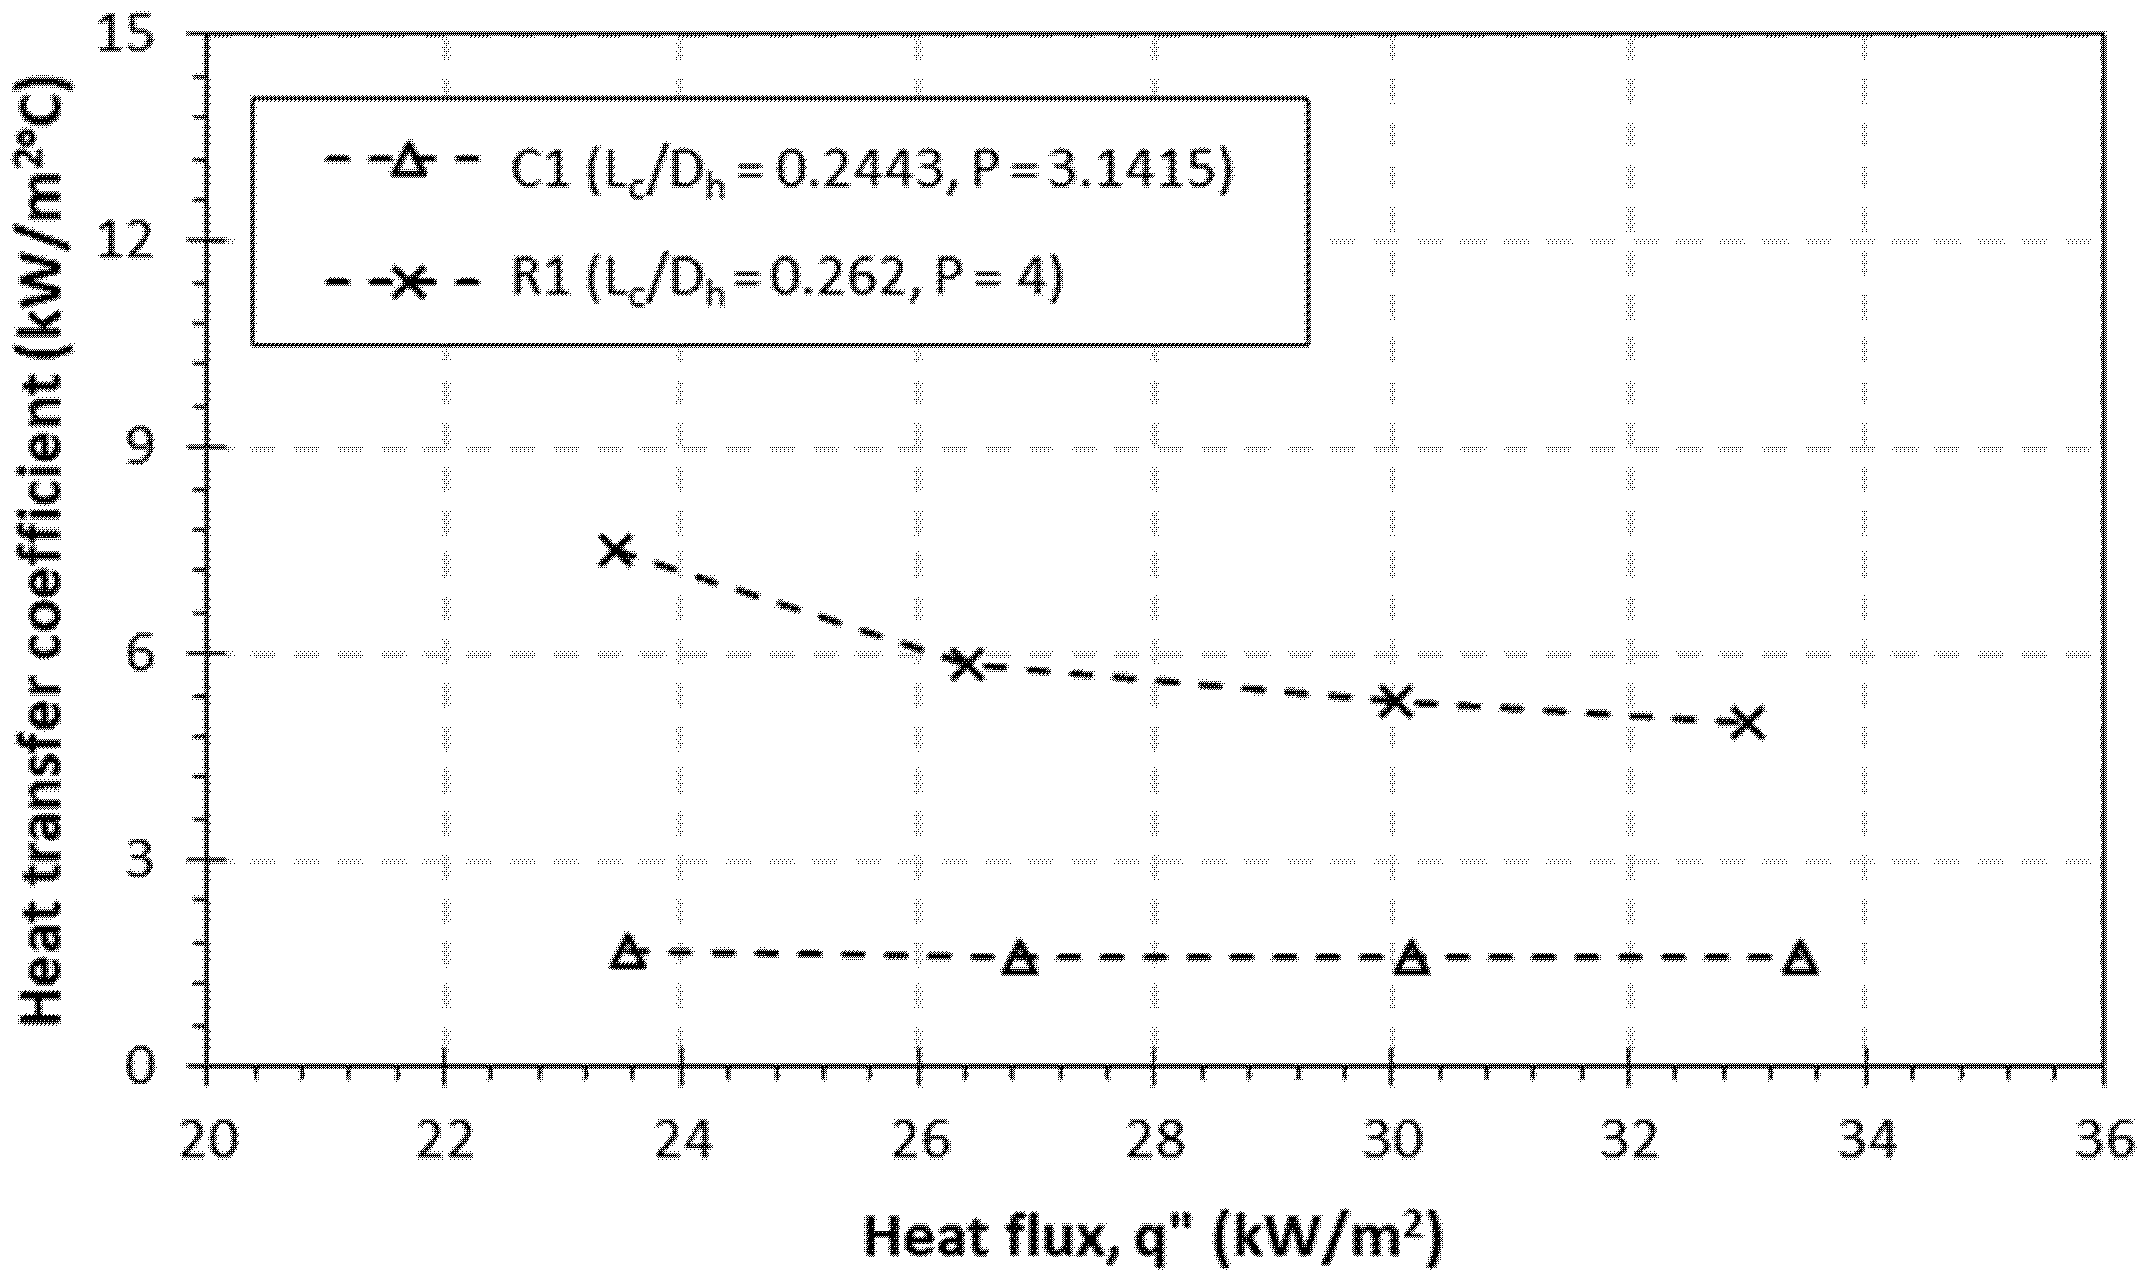
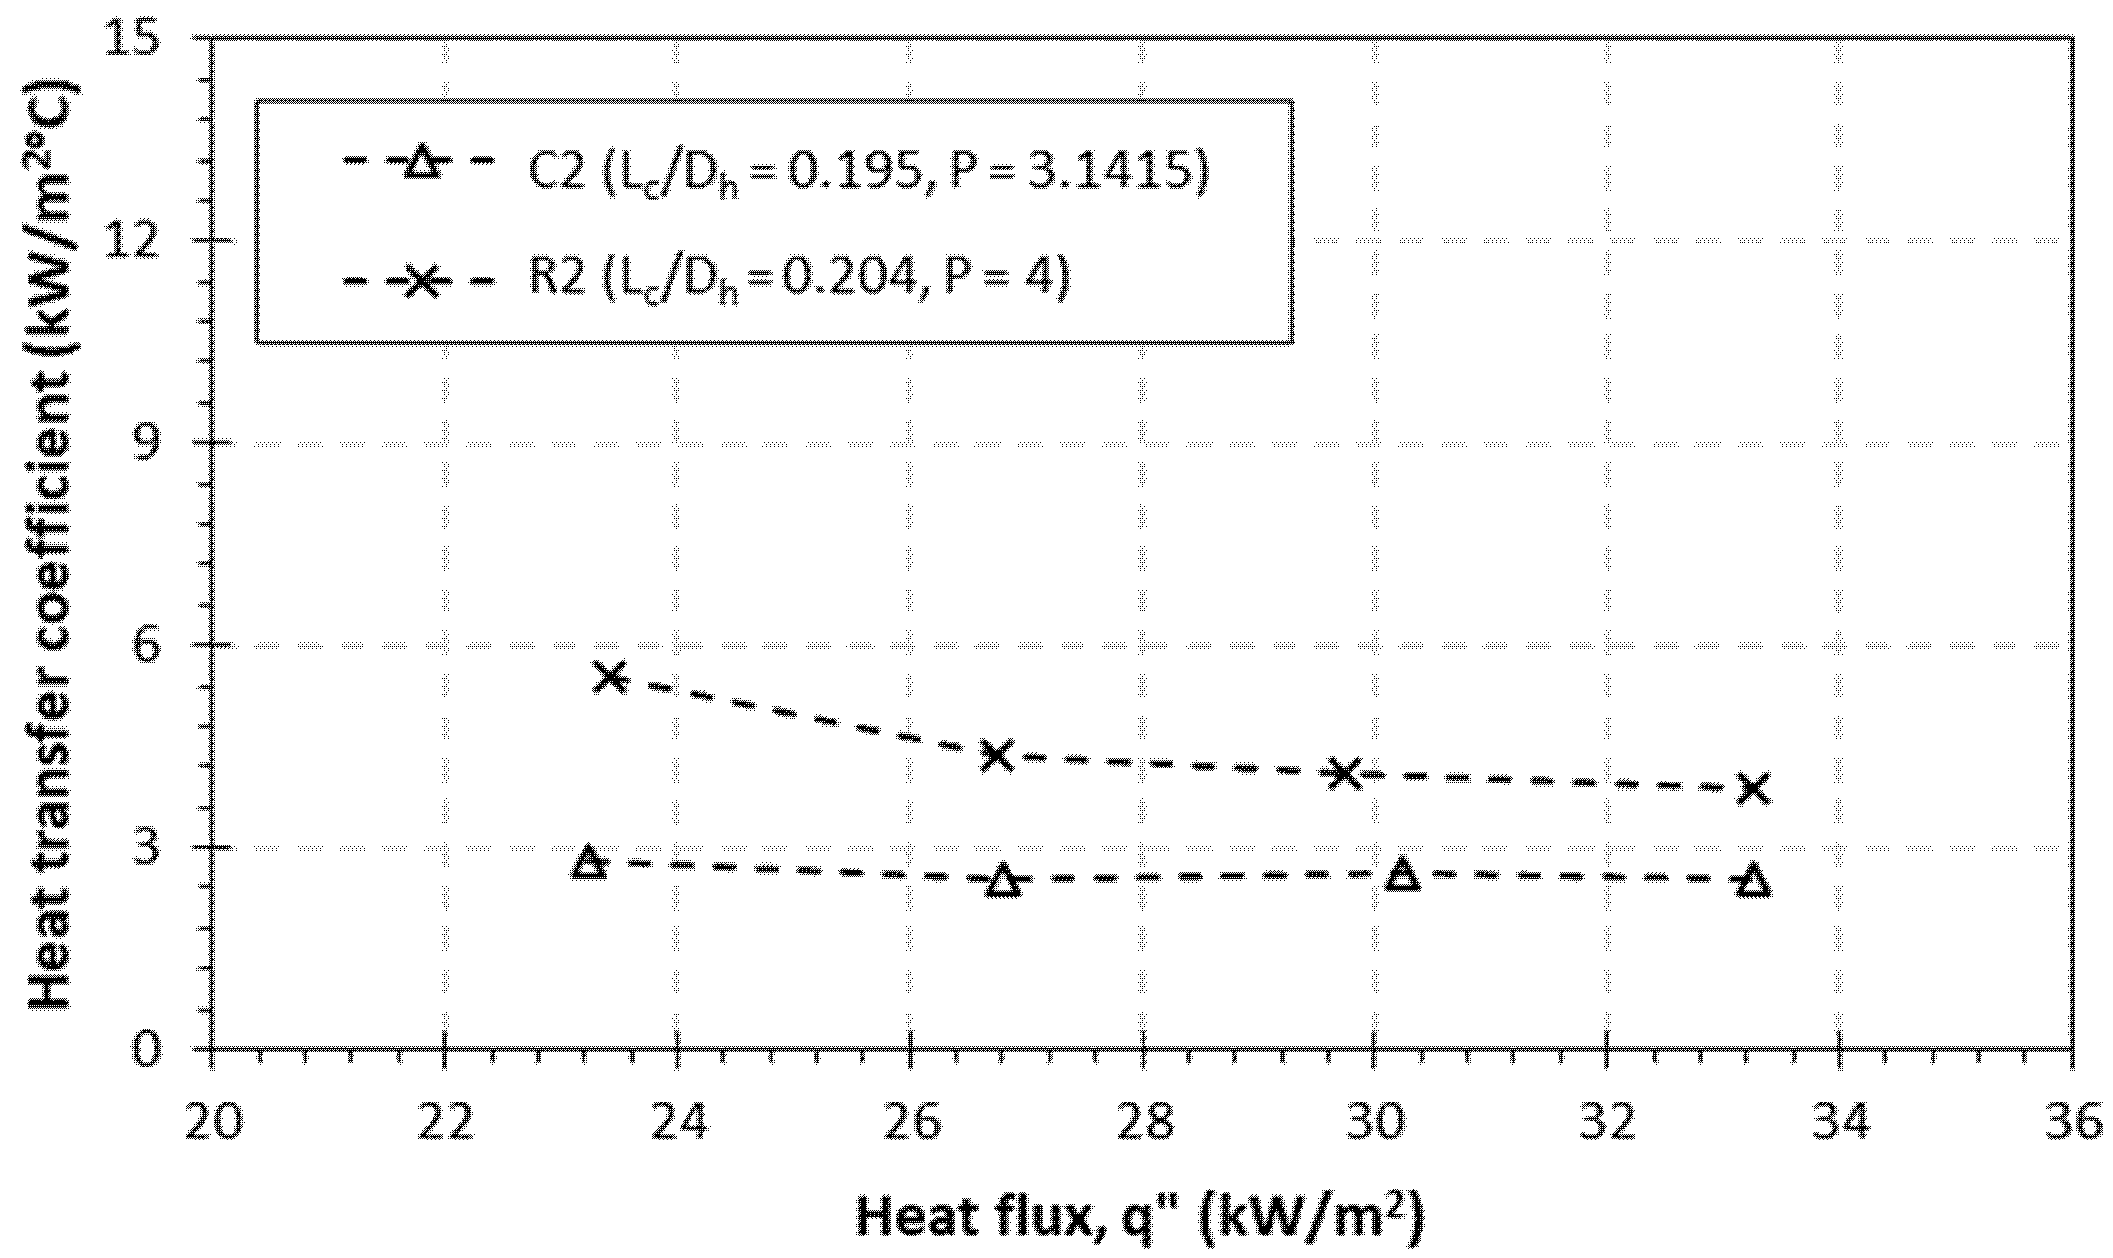
3.1. Boiling Curve and Heat Transfer Performance
3.2. Effect of Geometrical Shape
4. Conclusions
- The boiling performances of the rectangular and circular pin fins are enhanced after ONB, which is the result of the agitated movement by evaporation and rewetting process during the bubble detachment. On this regime, an increase in the same increment in heat flux results in a smaller increase in the surface temperature.
- The heat transfer performance of the rectangular pin fin is better than that of the circular pin, which has an average value of 5.95 kW/m2∙°C and 4.49 kW/m2∙°C for the test case with 196 and 144 pin fins, respectively. Meanwhile, the circular test cases only show the average value of 1.68 kW/m2∙°C and 2.84 kW/m2∙°C. On average, the heat transfer performance of the rectangular pin fin is 2.54 times higher than the circular pin fin.
- The flow resistance, due to the fin arrangement, of the rectangular pin fin is slightly higher (around 1.06 times), resulting in the lower bubble departure frequency. However, the nucleation site has a larger probability of a cavity site due to the longer wetted perimeter in the same area, up to 1.27 times longer. This leads to an increase in the overall heat transfer performance despite having a lower bubble departure frequency.
Author Contributions
Funding
Conflicts of Interest
Nomenclature
| Fin width (mm) | |
| Boiling area fraction (dimensionless) | |
| Fin gap (mm) | |
| Fin height (mm) | |
| Specific heat of the liquid (kJ/kg°∙C) | |
| Bubble departure diameter (mm) | |
| Hydraulic diameter (mm) | |
| Bubble departure frequency (Hz) | |
| Boiling heat transfer coefficient (kW/m2∙°C) | |
| Average boiling heat transfer coefficient (kW/m2∙°C) | |
| Enthalpy of vaporization (kJ/kg) | |
| Thermal conductivity of the fluid (W/m°∙C) | |
| Characteristic length (mm) | |
| Wetted perimeter (m) | |
| Net heat flux = (W/m2) | |
| Evaporation heat flux (W/m2) | |
| Heat input of cartridge heater (W/m2) | |
| Heat loss through the heating base wall (W/m2) | |
| Rewetting heat flux (W/m2) | |
| Surface temperature (°C) | |
| Density of the liquid (kg/m3) |
References
- Kurul, N.; Podowski, M.Z. Multidimensional effects in forced convection subcooled boiling. In International Heat Transfer Conference Digital Library; Begel House Inc.: Danbury, CT, USA, 1990. [Google Scholar]
- El-Genk, M.S. Nucleate boiling enhancements on porous graphite and microporous and macro—Finned copper surfaces nucleate boiling enhancements on porous graphite and microporous and macro—Finned copper surfaces. Heat Transfer. Eng. 2012, 33, 175–204. [Google Scholar] [CrossRef]
- Giustini, G. Modelling of boiling flows for nuclear thermal hydraulics applications—A brief review. Invention 2020, 5, 47. [Google Scholar] [CrossRef]
- Chung, S.; Seo, Y.; Jeon, G.; Kim, J.; Park, J. Parameter study of boiling model for CFD simulation of multiphase-thermal flow in a pipe. J. Ocean. Eng. Technol. 2020, 35, 50–58. [Google Scholar] [CrossRef]
- Liang, G.; Mudawar, I. Review of pool boiling enhancement by surface modification. Int. J. Heat Mass Transf. 2021, 128, 892–933. [Google Scholar] [CrossRef]
- Kraus, A.D.; Bar-Cohen, A. Thermal Analysis and Control of Electronic Equipment; Hemisphere Publishing Corporation: Washington, DC, USA, 1983. [Google Scholar]
- Murshed, S.M.S.; Castro, C.A.N. A critical review of traditional and emerging techniques and fluids for electronics cooling. Renew. Sustain. Energy Rev. 2017, 78, 821–833. [Google Scholar] [CrossRef]
- Bergles, A.E.; Webb, R.L.; Junkhan, G.H.; Jensen, M.K. Bibliography on augmentation of convective heat and mass transfer. In Heat Transfer Laboratory Report HTL-19; Iowa State University: Ames, IA, USA, 1979. [Google Scholar]
- Pranoto, I.; Leong, K.C. An experimental study of flow boiling heat transfer from porous foam structures in a channel. Appl. Therm. Eng. 2014, 70, 100–114. [Google Scholar] [CrossRef]
- Pranoto, I.; Leong, K.C.; Rofiq, A.A.; Arroisi, H.M.; Rahman, M.A. Study on the pool boiling bubble departure diameter and frequency from porous graphite foam structures. In Advances in Heat Transfer and Thermal Engineering; Wen, C., Yan, Y., Eds.; Springer Singapore: Singapore, 2021; pp. 217–223. [Google Scholar]
- Milanova, D.; Kumar, R. Heat transfer behavior of silica nanoparticles in pool boiling. J. Heat Transf. 2018, 130, 042401. [Google Scholar] [CrossRef]
- Wang, W.; Wu, F.; Yu, Q.; Jin, H. Experimental investigation of titanium tetrachloride in pool boiling heat transfer. Int. J. Heat Mass Transf. 2018, 122, 1308–1312. [Google Scholar] [CrossRef]
- Sur, A.; Lu, Y.; Pascente, C.; Ruchhoeft, P.; Liu, D. Pool boiling heat transfer enhancement with electrowetting. Int. J. Heat Mass Transf. 2018, 120, 202–217. [Google Scholar] [CrossRef]
- Rainey, K.N.; You, S.M. Pool boiling heat transfer from plain and microporous, square pin-finned surfaces in saturated FC-72. J. Heat Transf. 2000, 122, 509–516. [Google Scholar] [CrossRef]
- Parker, J.; El-Genk, M.S. Saturation boiling of HFE-7100 dielectric liquid on copper surfaces with corner pins at different inclinations. J. Enhanc. Heat Transf. 2009, 16, 103–122. [Google Scholar] [CrossRef]
- Klein, G.; Westwater, J. Heat transfer from multiple spines to boiling liquids. AIChE J. 1971, 17, 1050–1056. [Google Scholar] [CrossRef]
- Zhang, Y.; Zhou, J.; Zhou, W.; Qi, B.; Wei, J. CHF correlation of boiling in FC-72 with micro-pin-fins for electronics cooling. Appl. Therm. Eng. 2018, 138, 494–500. [Google Scholar] [CrossRef]
- Hdhiri, N.; Ben-Beya, B.; Lili, T. Effects of internal heat generation or absorption on heat transfer and fluid flow within partially heated square enclosure: Homogeneous fluids and porous media. J. Porous Media. 2015, 18, 415–435. [Google Scholar] [CrossRef]
- Hdhiri, N.; Souayeh, B.; Alfannakh, H.; Ben-Beya, B. Natural convection study with internal heat generation on heat transfer and fluid flow within a differentially heated square cavity filled with different working fluids and porous media. BioNanoScience 2015, 9, 702–722. [Google Scholar] [CrossRef]
- Taylor, J.R. An Introduction to Error Analysis, 2nd ed.; University of Science Book: Sausalito, CA, USA, 1997. [Google Scholar]
- Takouna, I.; Dawoud, W.; Meinel, C. Accurate multicore processor power models for power-aware resource management. In Proceedings of the IEEE International Conference on Dependable, Autonomic and Secure Computing 9, Sydney, Australia, 12–14 December 2011. [Google Scholar]
- Yong, J.; Kim, M.; Kaviany, M.; Young, S. Bubble nucleation in microchannel flow boiling using single artificial cavity. Int. J. Heat Mass Transf. 2011, 54, 5139–5148. [Google Scholar]


| Test Sample | Number of Fins | Fin Width (a), mm | Fin Gap (b), mm | Fin Height (c), mm | Dh, mm | P, mm |
|---|---|---|---|---|---|---|
| C1 | 196 | 1 | 1 | 1 | 4.09 | 3.14 |
| C2 | 196 | 1 | 1.5 | 1.36 | 6.96 | 3.14 |
| S1 | 144 | 1 | 1 | 0.79 | 3 | 4 |
| S2 | 144 | 1 | 1.5 | 1.07 | 5.25 | 4 |
| Properties | Values |
|---|---|
| Boiling point (°C) | 61 |
| Vapour pressure (kPa) | 27 |
| Liquid density (kg/m3) | 1520 |
| Specific heat (J/kg∙°C) | 1170 |
| Latent heat vaporization (kJ/kg) | 112 |
| Thermal conductivity (W/m∙K) | 0.068 |
| Surface tension (mN/m) | 13.6 |
| Dielectric strength 0.1″ gap (kV) | 40 |
| Number of Fin | |||
|---|---|---|---|
| 196 | 1.07 | 1.27 | 3.54 |
| 144 | 1.04 | 1.27 | 1.58 |
Publisher’s Note: MDPI stays neutral with regard to jurisdictional claims in published maps and institutional affiliations. |
© 2022 by the authors. Licensee MDPI, Basel, Switzerland. This article is an open access article distributed under the terms and conditions of the Creative Commons Attribution (CC BY) license (https://creativecommons.org/licenses/by/4.0/).
Share and Cite
Pranoto, I.; Rahman, M.A.; Mahardhika, P.A.P. Pool Boiling Heat Transfer Performance and Bubble Dynamics from Pin Fin-Modified Surfaces with Geometrical Shape Variation. Energies 2022, 15, 1847. https://doi.org/10.3390/en15051847
Pranoto I, Rahman MA, Mahardhika PAP. Pool Boiling Heat Transfer Performance and Bubble Dynamics from Pin Fin-Modified Surfaces with Geometrical Shape Variation. Energies. 2022; 15(5):1847. https://doi.org/10.3390/en15051847
Chicago/Turabian StylePranoto, Indro, Muhammad Aulia Rahman, and Pradhana A. P. Mahardhika. 2022. "Pool Boiling Heat Transfer Performance and Bubble Dynamics from Pin Fin-Modified Surfaces with Geometrical Shape Variation" Energies 15, no. 5: 1847. https://doi.org/10.3390/en15051847
APA StylePranoto, I., Rahman, M. A., & Mahardhika, P. A. P. (2022). Pool Boiling Heat Transfer Performance and Bubble Dynamics from Pin Fin-Modified Surfaces with Geometrical Shape Variation. Energies, 15(5), 1847. https://doi.org/10.3390/en15051847