
Heating/Cooling Fresh Air Using Hot/Cold Exhaust Air of Heating, Ventilating, and Air Conditioning Systems

 ,
,  ,
,
Abstract
:1. Introduction
2. Materials and Methods
3. Results and Discussion
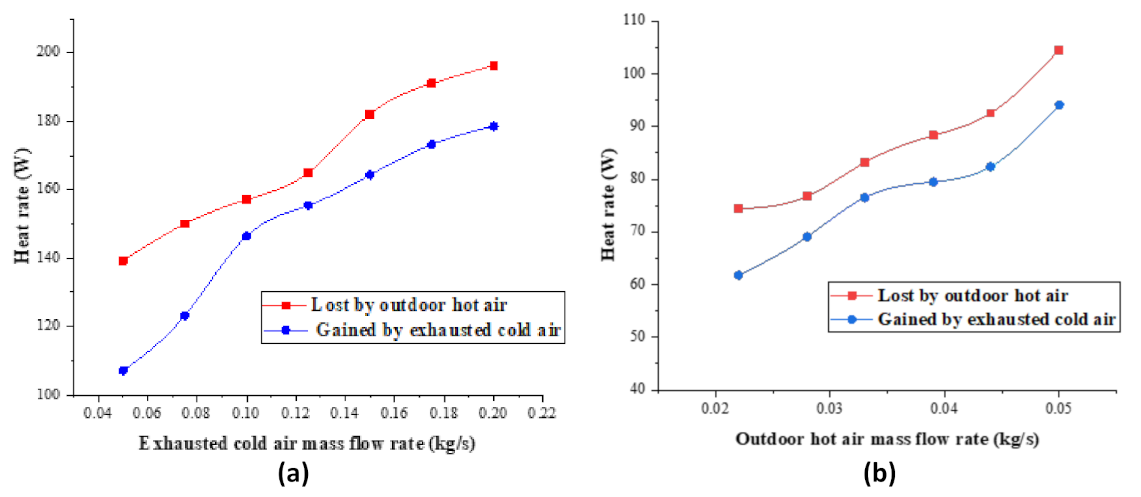
3.1. Results for Hot Day Conditions
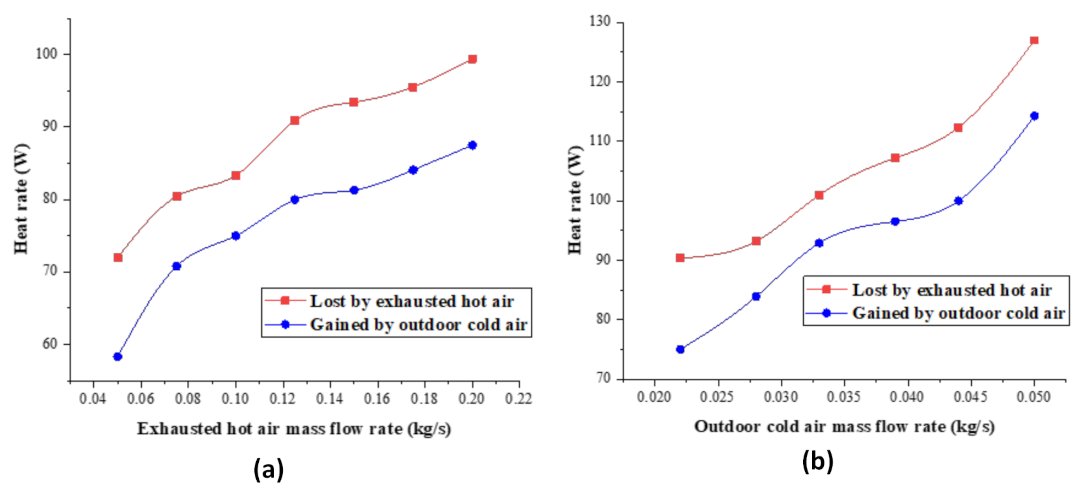
3.2. Results for Cold Day Conditions
4. Economic and Environmental Study
5. Conclusions
Author Contributions
Funding
Institutional Review Board Statement
Informed Consent Statement
Data Availability Statement
Conflicts of Interest
Nomenclature
| A | Area (m2) |
| Specific heat at constant pressure (kJ/kg·K) | |
| E | Energy (kJ) |
| Air mass flow rate (kg/s) | |
| M | Mass (kg) |
| Heat transfer rate (kW) | |
| T | Temperature (°C) |
| V | Air velocity (m/s) |
| Greek | |
| Effectiveness | |
| Density (kg/m3) | |
| Energy conversion efficiency | |
| Subscripts | |
| a | Air |
| av | Average |
| c,f | Cold fluid |
| d | Days |
| E | Electric |
| h,f | Hot fluid |
| h | Recovered |
| hr | Hours |
| Acronym | |
| MS | Amount of money saved in US dollars |
| PBP | Payback period in years |
References
- Abualigah, L.; Abu Zitar, R.; Almotairi, K.H.; Hussein, A.M.; Elaziz, M.A.; Nikoo, M.R.; Gandomi, A.H. Wind, Solar, and Photovoltaic Renewable Energy Systems with and without Energy Storage Optimization: A Survey of Advanced Machine Learning and Deep Learning Techniques. Energies 2022, 15, 578. [Google Scholar] [CrossRef]
- Akhatova, A.; Kranzl, L.; Schipfer, F.; Heendeniya, C.B. Agent-Based Modelling of Urban District Energy System Decarbonisation—A Systematic Literature Review. Energies 2022, 15, 554. [Google Scholar] [CrossRef]
- Arraño-Vargas, F.; Shen, Z.; Jiang, S.; Fletcher, J.; Konstantinou, G. Challenges and Mitigation Measures in Power Systems with High Share of Renewables—The Australian Experience. Energies 2022, 15, 429. [Google Scholar] [CrossRef]
- Thummar, K.; Abang, R.; Menzel, K.; de Groot, M.T. Coupling a Chlor-Alkali Membrane Electrolyzer Cell to a Wind Energy Source: Dynamic Modeling and Simulations. Energies 2022, 15, 606. [Google Scholar] [CrossRef]
- Herez, A.; Ramadan, M.; Khaled, M. Review on solar cooker systems: Economic and environmental study for different Lebanese scenarios. Renew. Sustain. Energy Rev. 2018, 81, 421–432. [Google Scholar] [CrossRef]
- Jaber, H.; Khaled, M.; Lemenand, T.; Faraj, J.; Bazzi, H.; Ramadan, M. Effect of Exhaust Gases Temperature on the Performance of a Hybrid Heat Recovery System. Energy Proc. 2017, 119, 775–782. [Google Scholar] [CrossRef]
- Jaber, H.; Khaled, M.; Lemenand, T.; Ramadan, M. Effect of generator load on hybrid heat recovery system. Case Stud. Therm. Eng. 2019, 13, 100359. [Google Scholar] [CrossRef]
- Xu, Z.; Wang, R.; Yang, C. Perspectives for low-temperature waste heat recovery. Energy 2019, 176, 1037–1043. [Google Scholar] [CrossRef]
- Christodoulides, P.; Agathokleous, R.; Aresti, L.; Kalogirou, S.A.; Tassou, S.A.; Florides, G.A. Waste Heat Recovery Technologies Revisited with Emphasis on New Solutions, Including Heat Pipes, and Case Studies. Energies 2022, 15, 384. [Google Scholar] [CrossRef]
- Wang, F.; Wang, L.; Ou, Y.; Lei, X.; Yuan, J.; Liu, X.; Zhu, Y. Thermodynamic analysis of solid oxide electrolyzer integration with engine waste heat recovery for hydrogen production. Case Stud. Therm. Eng. 2021, 27, 101240. [Google Scholar] [CrossRef]
- Danieli, P.; Masi, M.; Lazzaretto, A.; Carraro, G.; Volpato, G. A Smart Energy Recovery System to Avoid Preheating in Gas Grid Pressure Reduction Stations. Energies 2022, 15, 371. [Google Scholar] [CrossRef]
- Salimzadeh, S.; Grandahl, M.; Medetbekova, M.; Nick, H.M. A novel radial jet drilling stimulation technique for enhancing heat recovery from fractured geothermal reservoirs. Renew. Energy 2019, 139, 395–409. [Google Scholar] [CrossRef]
- Khaled, M.; Ramadan, M.; El Hage, H. Parametric Analysis of Heat Recovery from Exhaust Gases of Generators. Energy Procedia 2015, 75, 3295–3300. [Google Scholar] [CrossRef] [Green Version]
- Khaled, M.; Ramadan, M. Study of the thermal behavior of multi concentric tube tank in heat recovery from chimney—Analysis and optimization. Heat Transf. Eng. J. 2017, 8, 399–409. [Google Scholar]
- Khaled, M.; Ramadan, M.; Chahine, K.; Assi, A. Prototype implementation and experimental analysis of water heating using recovered waste heat of chimneys. Case Stud. Therm. Eng. 2015, 5, 127–133. [Google Scholar] [CrossRef] [Green Version]
- Jaber, H.; Khaled, M.; Lemenand, T.; Murr, R.; Faraj, J.; Ramadan, M. Domestic thermoelectric cogeneration drying system: Thermal modeling and case study. Energy 2019, 170, 1036–1050. [Google Scholar] [CrossRef]
- Jaber, H.; Ramadan, M.; Lemenand, T.; Khaled, M. Domestic thermoelectric cogeneration system optimization analysis, energy consumption and CO2 emissions reduction. Appl. Therm. Eng. 2018, 130, 279–295. [Google Scholar] [CrossRef]
- Pochwat, K.; Kordana, S.; Starzec, M.; Słyś, D. Comparison of two-prototype near-horizontal Drain Water Heat Recovery units on the basis of effectiveness. Energy 2019, 173, 1196–1207. [Google Scholar] [CrossRef]
- Ramadan, M.; Lemenand, T.; Khaled, M. Recovering heat from hot drain water—Experimental evaluation, parametric analysis and new calculation procedure. Energy Build. 2016, 128, 575–582. [Google Scholar] [CrossRef]
- Salameh, W.; Castelain, C.; Faraj, J.; Murr, R.; El Hage, H.; Khaled, M. Improving the efficiency of photovoltaic panels using air exhausted from HVAC systems: Thermal modelling and parametric analysis. Case Stud. Therm. Eng. 2021, 25, 100940. [Google Scholar] [CrossRef]
- Kanaan, M. CFD optimization of return air ratio and use of upper room UVGI in combined HVAC and heat recovery system. Case Stud. Therm. Eng. 2019, 15, 100535. [Google Scholar] [CrossRef]
- O’Connor, D.; Calautit, J.K.; Hughes, B.R. A review of heat recovery technology for passive ventilation applications. Renew. Sustain. Energy Rev. 2016, 54, 1481–1493. [Google Scholar] [CrossRef]
- McQuiston, F.; Parker, J.D.; Spitler, J.D. Heating, Ventilating and Air Conditioning: Analysis and Design, 6th ed.; John Wiley & Sons: New York, NY, USA, 2005. [Google Scholar]
- Mancini, F.; Nardecchia, F.; Groppi, D.; Ruperto, F.; Romeo, C. Indoor Environmental Quality Analysis for Optimizing Energy Consumptions Varying Air Ventilation Rates. Sustainability 2020, 12, 482. [Google Scholar] [CrossRef] [Green Version]
- Ramadan, M.; El Rab, M.G.; Khaled, M. Parametric analysis of air–water heat recovery concept applied to HVAC systems: Effect of mass flow rates. Case Stud. Therm. Eng. 2015, 6, 61–68. [Google Scholar] [CrossRef] [Green Version]
- Shen, S.; Cai, W.; Wang, X.; Wu, Q.; Yon, H. Investigation of liquid desiccant regenerator with fixed-plate heat recovery system. Energy 2017, 137, 172–182. [Google Scholar] [CrossRef]
- Nasif, M.S.; Al-Waked, R. Effect of Air to Air Fixed Plate Enthalpy Energy Recovery Heat Exchanger Flow Profile on Air Conditioning System Energy Recovery. Appl. Mech. Mater. 2016, 819, 245–249. [Google Scholar] [CrossRef]


| Test Number | Exchanger Flow Rate | Duct Flow Rate | Conditions |
|---|---|---|---|
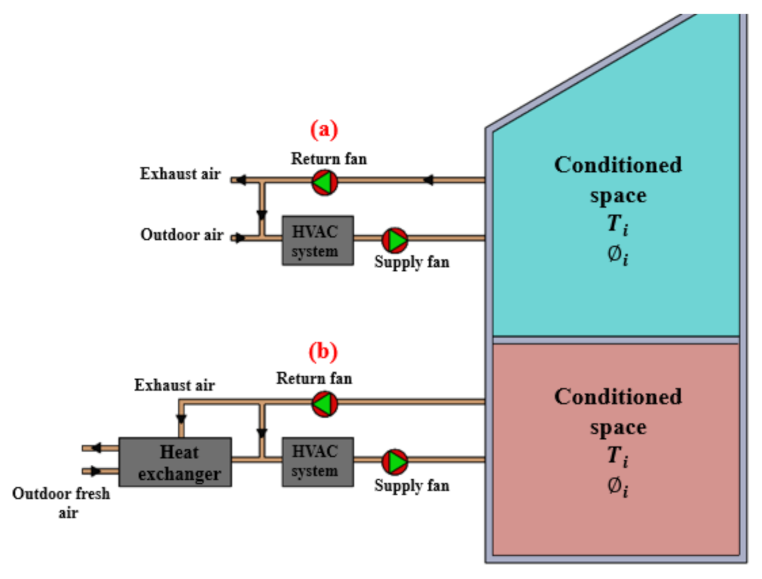
| 1 | Constant | Variable | For hot days simulations. The exchanger and its associated duct system are placed at the lower window of the room.
|
| (0.044 kg/s) | (0.05–0.2 kg/s) | ||
| 2 | Variable (0.022–0.05 kg/s) | Constant (0.111 kg/s) | |
| 3 | For cold days simulations, ice is used to obtain low temperatures of air at the exchanger inlet. The exchanger and its associated duct system are placed at the upper window of the room.
| ||
| Constant (0.022 kg/s) | Variable (0.05–0.2 kg/s) | ||
| 4 | Variable (0.022–0.05 kg/s) | Constant (0.111 kg/s) | |
Publisher’s Note: MDPI stays neutral with regard to jurisdictional claims in published maps and institutional affiliations. |
© 2022 by the authors. Licensee MDPI, Basel, Switzerland. This article is an open access article distributed under the terms and conditions of the Creative Commons Attribution (CC BY) license (https://creativecommons.org/licenses/by/4.0/).
Share and Cite
Khaled, M.; Ali, S.; Jaber, H.; Faraj, J.; Murr, R.; Lemenand, T. Heating/Cooling Fresh Air Using Hot/Cold Exhaust Air of Heating, Ventilating, and Air Conditioning Systems. Energies 2022, 15, 1877. https://doi.org/10.3390/en15051877
Khaled M, Ali S, Jaber H, Faraj J, Murr R, Lemenand T. Heating/Cooling Fresh Air Using Hot/Cold Exhaust Air of Heating, Ventilating, and Air Conditioning Systems. Energies. 2022; 15(5):1877. https://doi.org/10.3390/en15051877
Chicago/Turabian StyleKhaled, Mahmoud, Samer Ali, Hassan Jaber, Jalal Faraj, Rabih Murr, and Thierry Lemenand. 2022. "Heating/Cooling Fresh Air Using Hot/Cold Exhaust Air of Heating, Ventilating, and Air Conditioning Systems" Energies 15, no. 5: 1877. https://doi.org/10.3390/en15051877
APA StyleKhaled, M., Ali, S., Jaber, H., Faraj, J., Murr, R., & Lemenand, T. (2022). Heating/Cooling Fresh Air Using Hot/Cold Exhaust Air of Heating, Ventilating, and Air Conditioning Systems. Energies, 15(5), 1877. https://doi.org/10.3390/en15051877