Article

A Multiobjective Fractional Programming for a CHP System Operation Optimization Based on Energy Intensity

1
State Key Laboratory of Power Grid Safety and Energy Conservation, China Electric Power Research Institute, Beijing 100192, China
2
MOE Key Laboratory of Regional Energy and Environmental Systems Optimization, College of Environmental Science and Engineering, North China Electric Power University, Beijing 102206, China
3
State Key Laboratory of Operation and Control of Renewable Energy & Storage Systems, China Electric Power Research Institute, Beijing 100192, China
*
Author to whom correspondence should be addressed.
Energies 2022, 15(6), 1965; https://doi.org/10.3390/en15061965
Submission received: 24 January 2022 / Revised: 2 March 2022 / Accepted: 2 March 2022 / Published: 8 March 2022

Abstract

:
The objective of this research is to establish a multiobjective fractional programming (MOFP) model for supporting the operational management of a combined heat and power (CHP) system. Compared with the traditional operational optimization model of the CHP system, the importance of the energy intensity (i.e., the ratio of energy consumption and energy production) was emphasized in the MOFP model, which is considered as the system objective for replacing the common objective of minimizing the economic cost. This innovative transformation effectively reduces excessive energy consumption, accompanied by improvement in the system revenue. The CHP system of an industrial park in the City of Jinan, China, was used as a study case for demonstration. The obtained results reflected that the combination of two gas turbines (GTs) ensured safe, efficient, and stable output for meeting daily power requirements in various seasons. As for the steam load, during the summer, two heat recovery steam generators (HRSGs) play a major role, where the insufficient part is supplemented by two gas-fired boilers (SBs); conversely, the steam load in winter is mainly satisfied by the aid of two SBs. The successful application of the MOFP model in the park could provide a good demonstration for CHP management in many other districts and cities.

1. Introduction

According to the report released by the National Energy Administration of China, the utilization of conventional energy sources, including petroleum and coal, still reached more than 85% of total energy provision amounts in recent years. Besides, the total consumption of primary energy increased from 0.57 billion tons to 4.49 billion tons of standard coal from 1978 to 2017, with the proportion of the coal consumption always remained above 60% [1]. However, with the increase in energy demand caused by human production and living activities, the easy-to-exploit coal mines and oil deposits were being exhausted gradually, leading to the exploitation of traditional energy becoming difficult. Moreover, significant coal-fired energy consumption has caused serious ecological and environmental issues, such as acid precipitation and haze, which have a profound effect on the security and quality of life. Furthermore, the traditional centralized energy supply system still has some problems, such as low energy efficiency and high heat loss, which bring difficulties to the improvement in primary energy utilization ratio. Although the large thermal power plant was capable of transmitting the electricity from a long distance, it was dependent on a series of auxiliary facilities such as power grids, substations, and distribution stations, where the farther the transmission distance is, the greater the loss is. In the case of cold and heat energy, long-distance transportation similar to that of electric energy was impossible. In addition, once a link in the centralized energy supply network system was compromised, its adverse effects were more widespread and caused many inconveniences for normal life and production activities. Therefore, it was of great significance to develop the natural gas-fired distributed energy (NGDE) system in China in order to mitigate the energy shortage crisis, improve energy efficiency, and control environmental pollution issues.
NGDE system is a small or medium-sized energy generation and conversion system that could directly meet the users’ demands and provide various kinds of energy forms in situ. The NGDE system was capable of saving large number of the initial investments in power generation, transmission, and distribution facilities, reducing the transmission loss of the entire energy network system, and providing a safety guarantee for the power provision in the regional power grid. The principle of energy cascade utilization based on cogeneration of cold, heat, and electricity ensured that the integrated energy efficiency of the NGDE system reached more than 70% [2]. Moreover, the rapid and comprehensive development of the NGDE system could relieve the pressure on traditional large-scale power generation, transmission, and distribution sections, especially in public utilities and other remote areas (such as remote islands) that could not be covered by the power grid. NGDE system has a wide range of available energy sources, including natural gas, solar, wind, biomass, geothermal, and fuel cells. Currently, the most commonly used energy form in the NGDE system is natural gas because of its safety and stability properties.
In recent years, the NGDE system gained more attention because of its advantages, such as flexible operation, low emission density, and high utilization efficiency. Numerous scholars and researchers have conducted studies on how to generate rational design and operation mechanisms for further improving the energy utilization efficiency of the NGDE system. For example, Tan et al. [3] formulated a multiobjective operation optimization model for the large-scale NGDE system. Jing et al. [4] designed an optimal operation scheme for cold, hot, and combined supply systems using a mixed integer nonlinear programming algorithm. Wang et al. [5] proposed a multiobjective optimization model for the NGDE system in a high-tech industrial park in China. Zhao et al. [6] formulated a multiobjective optimization model for the cold, heat, and electricity supply system of a hospital in northern China and finally projected a more environment-friendly and high-benefit operational pattern. Zheng et al. [7] formulated the operation optimization model of a hospital’s cogeneration system under different climate conditions and generated a cost-effective energy provision strategy based on different scenarios. Luo et al. [8] developed a bi-level optimization model for combined desalination and standalone CCHP system. Luo et al. [9] developed a bi-level optimization model of hybrid solar and CCHP systems in an island state and generated the optimal system scale and operation strategy. Yang et al. [10] simulated and modeled a CCHP system integrating solar photovoltaic and solar thermal systems, which is beneficial for realizing the balance between energy supply and demand. Yang et al. [11] proposed the operation optimization model of the CCHP system for typical buildings in different climatic regions and examined the influence of critical meteorological factors on the energy-supply scheme. Wang et al. [12] established an improved version of the operation optimization model of a solar hybrid CCHP system, where the optimal operational scheme adapted to climate change was proposed.
Previous studies demonstrated that the projected optimal operational mechanism of the NGDE system was helpful in realizing efficient utilization of limited resources and achieving expected goals based on the optimization techniques. Nevertheless, the existing objective function mainly focused on improving the economic benefits without the considerations of relevant resource consumption. Recently, the promotion and development of the green consumption conception further emphasized the importance of economic output per unit of energy input. Therefore, based on the conception of energy intensity, this research innovatively formulated a new operation optimization model of the CHP system with the new objective function of minimizing the ratio of energy utilization and economic output. It firstly realized the integration of the fractional programming (FP) and traditional operation optimization model of the NGDE system in order to maximize the economic benefits and improve energy efficiency simultaneously.
Previously, the FP model was applied in many fields because of its unique fractional objective function with the advantage in estimating the system efficiency, including waste management [13], air quality management, water resource allocation, target recognition [14], and communication systems [15]. However, its application in the NGDE system was rare. Therefore, a MOFP model was proposed for supporting the optimal operation of the CHP system located in the industrial park of Jinan. This paper will (i) introduce the main elements, configuration, and problems associated with the CHP system at the industrial park in Section 2; (ii) formulate and solve the proposed MOFP model in Section 3; (iii) demonstrate and analyze the operational mechanism of CHP system and discuss the difference between the MOFP model and traditional optimization model in Section 4; and (iv) conclude with remarks on potential future improvement in Section 5.

2. Case study

2.1. Overview of Studied Region

Jinan (36°01′–37°32′ N, 116°11′–117°44′ E) is the capital city of Shandong Province, bordering the cities of Liaocheng, Dezhou, Binzhou, Zibo, and Taian. The annual frost-free period is about 230 days, the precipitation 600–900 mm approximately, and annual sunshine hours reach almost 1870 h. Subject to specific climatic impacts, the annual average temperature ranges from 13.5 to 15.5 °C, the highest monthly average temperature is 27.2 °C (in July), and the lowest one is −3.2 °C (in January).
In this study, a case of CHP system operation management located in an industrial park in Jinan will be used to demonstrate the advancement and applicability of the proposed method. This industrial park lies in the Licheng District, covering an area of about 4560 m2. The energy-utilization units in the park are mainly pharmaceutical factories as well as some office buildings and staff apartments. At present, the main energy load of this park is the thermal load for industry and residential users in winter and the electricity load of the entire park. Thermal load is provided by two SBs and two HRSGs available in the park, and the power demand is satisfied by the aid of two GTs and the municipal power grid. According to the site survey and respondents’ consultation, it is clear that the hourly electric load is basically stable, at about 2882–3581 kW. Compared with relatively stable electric load, thermal demand varies remarkably at different periods. For instance, there is no heating load in summer because of the high temperature of Jinan; conversely, the high heat provision was required in winter. In addition, major industrial production activities are mostly arranged in the daytime (8:00 a.m. to 6:00 p.m.), while low-intensity activities normally occur at night (6:00 p.m. to 8:00 a.m.), leading to various steam requirements per day. According to the development planning and related statistical information of the park, the industrial steam loads both in day and night during the summer are 15 t/h and 7 t/h, respectively. Considering the meteorological condition and relevant regulations of Jinan, the actual domestic steam load in winter is designated to 13–15 t/h. The CHP system was adopted for meeting the thermal and electric loads in this park, mainly because of the following: (i) the design and operation of the CHP system is capable of improving energy efficiency and mitigating the amounts of the pollutants, compared with traditional mode, which is in line with national macro policy; (ii) it could realize stable energy provision and ensure normal production and life, where annual service-failure time could be shortened from 24 h to 7 s.

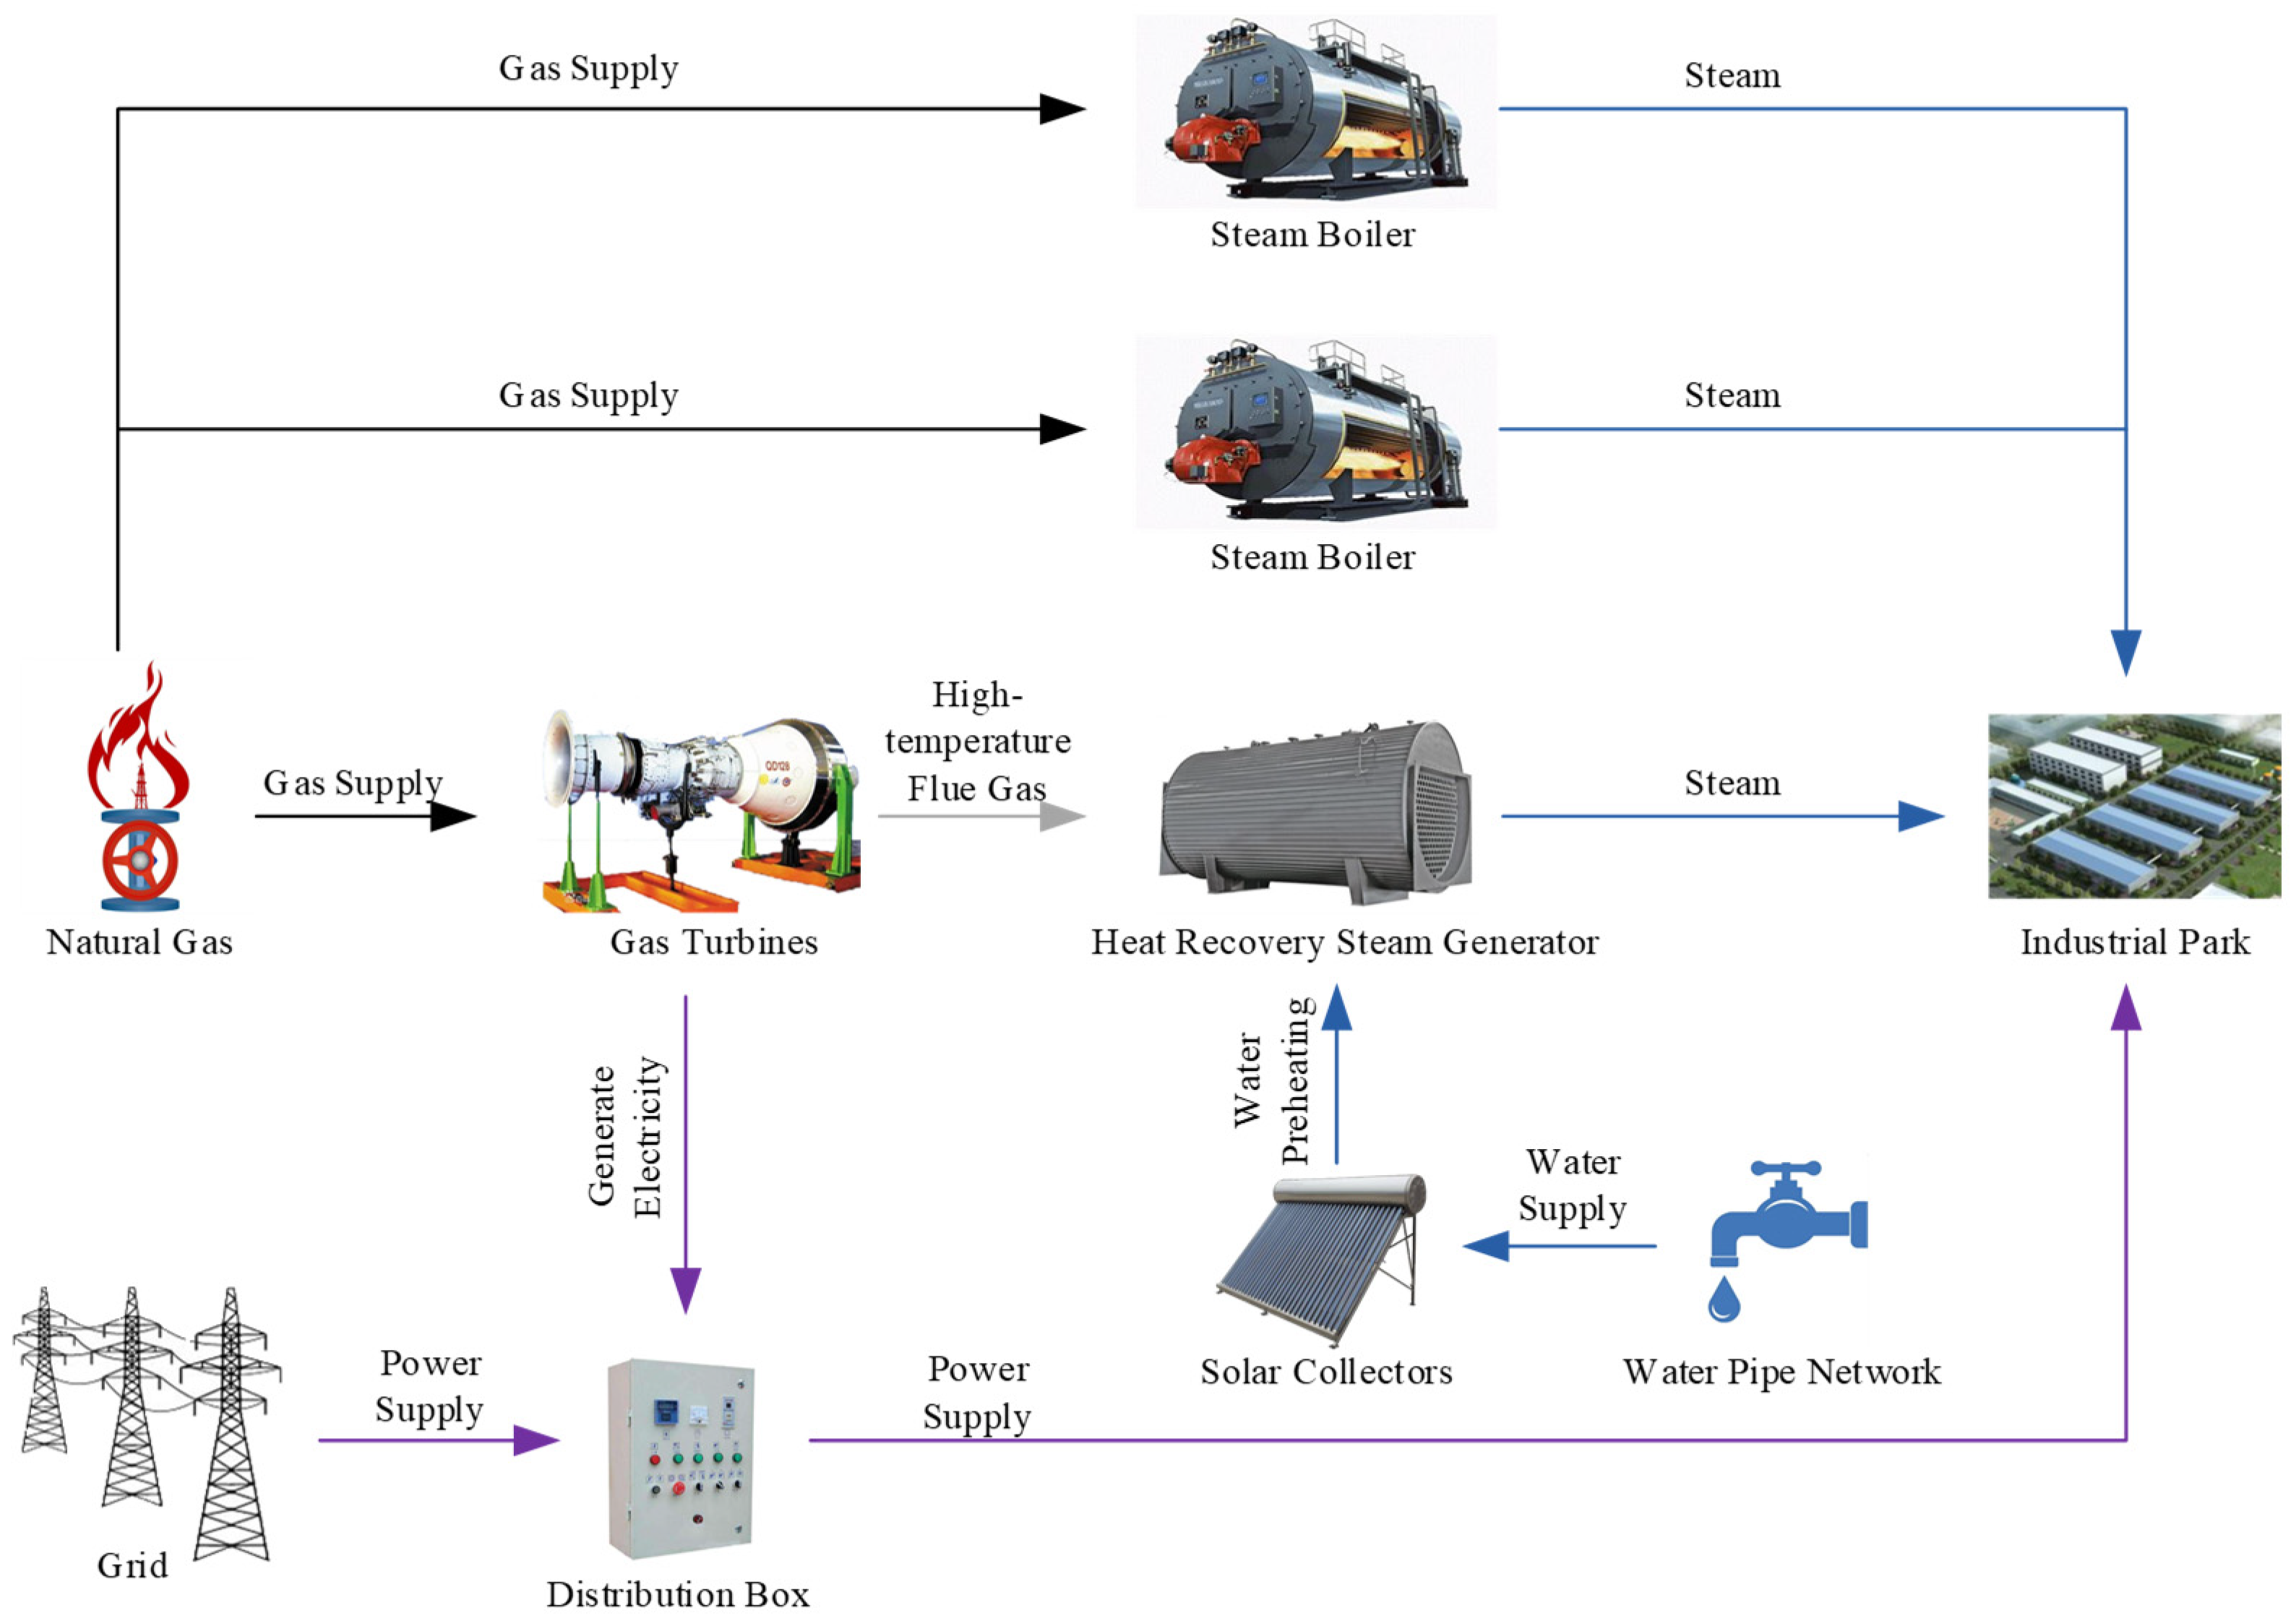
2.2. The Description of CHP System

As regulated, the park’s CHP system must adopt the “grid-connected with no power injection” mode as a double guarantee for the electric and thermal load. The main system components and configuration are shown in Figure 1. The system is composed of several modules, including two GTs generator groups with a rated capacity of 1.8 MW, two vertical single pressure natural circulation HRSGs, and two horizontal three-pass SBs with the total steam production capacity of 30 t/h, as well as other auxiliary modules (e.g., auxiliary pumps, pressure-regulation stations, and water treatment equipment). The major parameters associated with each device are shown in Table 1. The electricity load of this park is mainly satisfied by the CHP system; meanwhile, the insufficient load is supplemented by the municipal power grid. This operational mode is helpful to enhance the reliability and stability of electricity provision. Moreover, it is designed to meet the heating requirement with the aid of HRSG and SB, which are capable of realizing the double guarantee for steam demand. As demonstrated in Figure 1, the first step of system operation is that the pressure of part of natural gas will increase to 1.3–1.6 MPa with the aid of a pressurizer. It is then sent to the inlet of GT in order to provide the fuel for electricity production. At the same time, another part of natural gas was decompressed to the 15 kPa by a pressure-regulation device, then entered into SB, mixed with air, and burned through the burner. Secondly, generated radiant heat will be transmitted to the hot surface of SB, which provides heat to softened water restrained in the hot surface. Next, the steam–water mixture is generated and then enters the steam pocket. Finally, the saturated steam was produced by the steam separator. Unlike SB, HRSG uses high-temperature flue gas discharged from GT as a heat source to generate the low-pressure saturated steam through the heat exchanger. The water required by two HRSGs is sourced from the pipeline network of water supply for the park [16].

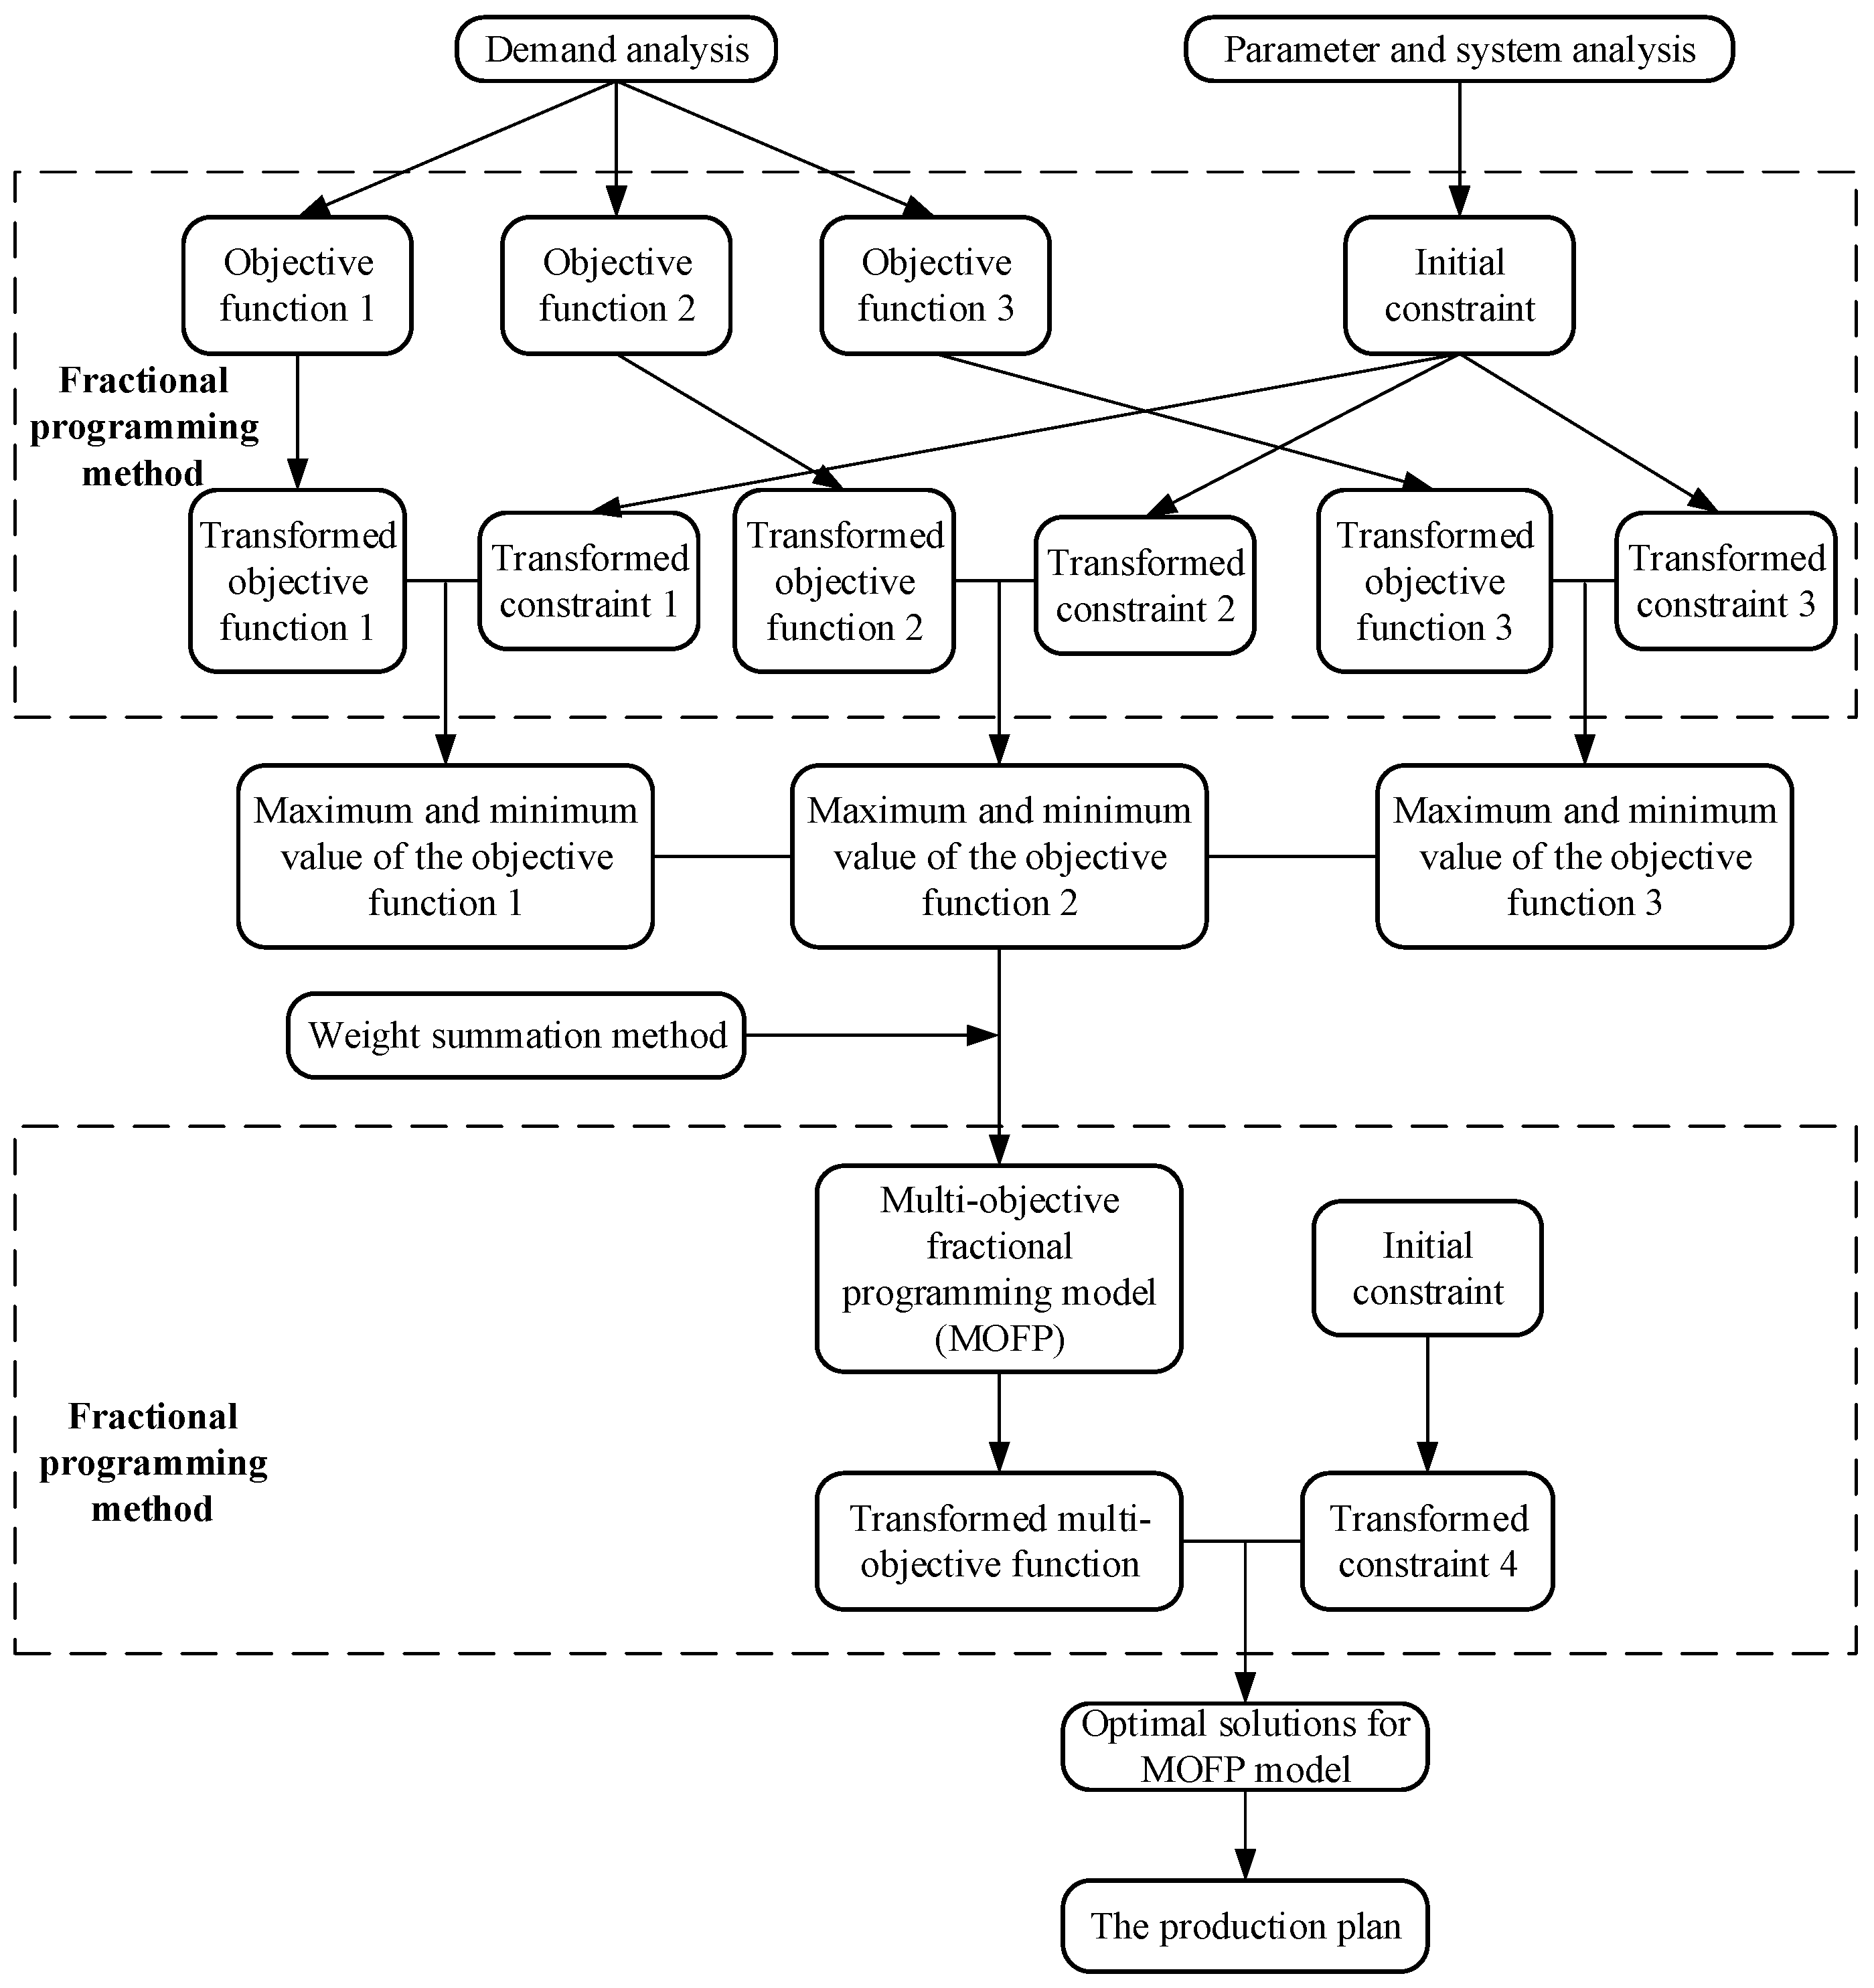
3. Formulation and Solution of MOFP Model for Operational Management of CHP System

The rapid development and extensive application of the CHP project were able to reduce the consumption rate of traditional energy (i.e., coal), improve energy efficiency, mitigate pollutants-discharge amounts, and support sustainable social and economic development. CHP is an integrated energy utilization system with many interactive factors, multilayer structure, and complex operational mechanism. For example, it usually involves many kinds of components, such as GT, HRSG, SB, refrigerator, and heat exchanger. Moreover, in the system schedule design and execution, the interdependence of the system capacity, energy conversion, and consumption, as well as the interactive relationship of energy flow (cold, heat, and electricity) should be considered. This is why expected system advantages such as cost effectiveness, high energy efficiency, and stable energy provision are not demonstrated well only depending on personal subjective judgments and preferences of schedule staff. Therefore, it is very critical to generate a suitable operation mechanism with the aid of integrating energy system analysis, modeling, and optimization technique. In this research, an optimization model of CHP’s operation mechanism based on FP (i.e., MOFP) is formulated in order to ensure the full use of limited resources and create higher economic benefits.

3.1. Objective Functions

This optimization model aims to minimize the ratio of energy consumption (including natural gas, electric power, and water) to net income, as described in the three objective functions ((1)–(3)). Moreover, some critical parameters involved into the calculation of ratio were obtained based on the Equations (4)–(8), respectively.
min   f ( t ) = T C G / ( G P T C )
min   g ( t ) = T C E / ( G P T C )
min   h ( t ) = T W C / ( G P T C )
T C G = i = 1 I t = 1 T ( h g c t i t + h g c f i t )
T C E = i = 1 I t = 1 T ( h e c t i t + h e c e i t + h e c f i t )
T W C = λ × i = 1 I t = 1 T ( h s t i t + h s f i t )
G P = i = 1 I t = 1 T ( e p t × h e t i t + p s × ( h s e i t + h s f i t ) )
T C = i = 1 I ( d c t i + d c e i + d c f i ) + d w + d e c
where TCG, TCE, and TWC = total consumption amounts of natural gas (m3), electricity power (kW), and water (t) in one day, respectively; GP and TC = total system revenues and cost in that day, respectively (RMB); f(t), g(t) and h(t) = total consumption amounts of natural gas, electric power, and water corresponding to unit benefits, respectively; In this research, they are defined as the energy intensity. i (i = 1, 2, …, I) = the index of devices, where I is total number of devices; t (t = 1, 2, …, T) = the index of time periods (h), where T is total number of time periods; hgct = the natural gas consumption of GT per hour (m3/h); hgcf = the natural gas consumption of SB per hour (m3/h); hect = the electricity power consumption of GT per hour (kW/h); hece = the electricity power consumption of HRSG per hour (kW/h); hecf = the electricity power consumption of SB per hour (kW/h); λ = conversion coefficient of water vapor and water; hst = the heat generated by GT per hour (t/h); hsf = the steam production from SB erper hour (t/h); ep = the time-of-use electricity price (RMB); het = the electricity production of GT per hour (kW); ps = the unit price of steam (RMB/t); hse = the steam production from HRSG per hour (t); dct = daily operation cost of GT (RMB); dce = daily operation cost of HRSG (RMB); dcf = daily operation cost of SB (RMB); dw = daily cost of water consumption (RMB); dec = daily environmental cost (RMB). The three objective functions ((1)–(3)) were used to reflect the energy intensity, which is defined as the ratio of energy consumption (including natural gas, electric power, and water) to net income, respectively. Equation (4) calculated total natural gas consumption amounts of two types of facilities (GT and SB). Equation (5) represented total electricity-consumption amounts of three types of facilities (GT, HRSG, and SB). Equation (6) determined total water-consumption amounts of two types of facilities (GT and SB) with the aid of conversion coefficient of water vapor and water. Equation (7) was used to calculate the total revenue sourced from selling electricity and steam. Equation (8) counted the total cost, including facilities’ operational cost, energy consumption cost, and environmental cost. Moreover, the calculation of total system cost (i.e., TC) is described as follows:
h c t i t = h g c t i t × p n g + h e c t i t × e p t
d c t i = t = 1 T h c t i t
h c e i t = h e c e i t × e p t
d c e i = t = 1 T h c e i t
h c f i t = h g c f i t × p n g + h e c f i t × e p t
d c f i = t = 1 T h c f i t
h w t = λ × w p × i = 1 I ( h s e i t + h s f i t )
d w = t = 1 T h w t
d e c = c = 1 C i = 1 I t = 1 T e c × V c × ( h g c t i t + h g c f i t )
where hct = the operation cost of GT per hour (RMB); png = the price of nature gas (RMB/m3); hce = the operation cost of HRSG per hour (RMB); hcf = the operation cost of SB per hour (RMB); hw = the consumption cost of water caused by devices utilization (RMB); wp = the water price (RMB/t); ec = emission coefficient (kg/106 m3); c = different atmospheric pollutants, (c = 1 for SO2, c = 2 for NOx, c = 3 for CO2); Vc = the charge for pollutant c discharge (RMB/kg). Equation (9) was used to calculate the operating cost of GT at t hour, which is sourced from its natural gas and electricity consumption. Equation (10) represents the daily operation cost of GT. Equation (11) determined the electricity-consumption cost of HRSG at t hour. Equation (12) reflects the daily operation cost of HRSG. Equation (13) represented the operation cost of SB at t hour caused by natural gas and electricity consumption. Equation (14) counted the daily operation cost of SB. Equation (15) described the water-consumption cost of GT and SB at t hour. Equation (16) counted the daily water-consumption cost. Equation (17) determined the total environmental cost of three types of atmospheric pollutants (SO2, NOx, and CO2).

3.2. Subject to

(i) Steam demand:
h s d t = i = 1 I ( h s e i t + h s f i t )
where hsd = the steam demand of users per hour (t/h). Constraint (18) regulates the balance of steam demand and supply.
(ii) Electricity demand:
i = 1 I h e t i t h e d t
where hed = the electricity demand of users per hour (kW/h). Constraint (19) required that the electricity-generation amounts are more than the electricity demand.
(iii) Operational limitations of GTs:
h e c t i t = G am × C pa × ( T 2 T 1 ) × Δ t
h g c t i t = G am × Δ t / ρ
h s t i t = α GT 1 × h g c t i t β GT 1
h e t i t = α GT 2 × h g c t i t β GT 2
h e t i t h e t max
where Gam = inlet flow of compressor (kg/s); Cpa = specific heat at constant pressure (J/kg.K); T1 and T2 are inlet and outlet temperature of compressor, respectively; Δt = operational time (s); ρ = density of natural gas (kg/m3); αGT1 and βGT1 are coefficients of the fit function describing the relationship between excess heat and natural gas consumption; αGT2 and βGT2 are the coefficients of fit function that represents the relationship between power generation and natural gas consumption; hetmax is the maximum power generation of GT, kW. Equations (20) and (21) were used to calculate the electricity and natural gas consumption of GT based on simplified linear equations, respectively. Equations (22) and (23) were used to determine the heat and electricity generation of GT with the aid of simplified linear equations, respectively. Constraint (24) reflected the capacity limitation of GT.
(iv) Operational limitations of HRSGs:
h s e i t = α HRSG × h e c e i t β HRSG
h s e i t = η 1 × h s t i t
h s e i t h s e max
where η1 = efficiency of HRSG; αHRSG and βHRSG are coefficients of fit function that represents the relationship between the power consumption and steam production; hsemax is regulated maximum steam provision amount. Equation (25) established the relationship between steam production and electricity consumption of HRSG. Equation (26) calculated HRSG’s steam production based on the heat provision of GT. Constraint (27) regulated the maximum steam production amount of HRSG.
(v) Operational limitations of SBs:
h e c f i t = α SB 1 × h s f i t β SB
h g c f i t = α SB 2 × h s f i t × Q g × Δ t × η 2
h s f i t h s f max
where aSB1 and bSB are the coefficients of the fit function describing the relationship between the power consumption and steam production; αSB2 = empirical coefficient of thermal power conversion of SB; Qg = the calorific value of natural gas; η2 = efficiency of SBs; hsfmax (t/h) = the rated power of SBs. Equation (28) established the relationship between steam production and electricity consumption of SB. Equation (29) counted the natural gas consumption of SB based on a simplified linear equation. Constraint (30) reflected the capacity limitation of SB.
To demonstrate the solution procedure of the proposed FP method, a simplified example is presented, which is formulated as follows:
min   i m i z e   f 1 = A X + α B X + β
Subject to:
C X D
X 0
A , B , C 0
where X is a vector of decision variables; A, B, C, and D are the vectors of auxiliary variables; α and β are the fixed values. To solve above model, two new variables, Z and Y, were introduced first, which are expressed as follows:
Z = 1 B X + β
Y = Z X
Next, the objective function (31) and constraint (32) were transformed as their respective equivalents, which are rewritten as follows:
A X + α B X + β = A X B X + β + α B X + β = A X Z + α Z = A Y + α Z
C X D C Y Z D C Y D Z C Y D Z 0
Then, the new constraint (39) could be derived, which is written as follows:
Z = 1 B X + β Z ( B X + β ) = 1 B X Z + β Z = 1 B Y + β Z = 1
The original FP model could be converted to a new linear optimization model, which was formulated as follows:
min   i m i z e   f 2 = A Y + α Z
Subject to:
C Y D Z 0
B Y + β Z = 1
A , B , C 0
Y 0 , Z 0
Finally, two decision variables (i.e., Y and Z) were obtained through solving above new model, leading to the optimal objective function (f1) and decision variables (X) of the original FP model.
Referring to the above solution processes of the FP model, the original objective function (1) and its related constraints can be converted to:
min   f ( t ) τ = i = 1 I t = 1 T ( h g c t i t τ + h g c f i t τ )
( G P T C ) × τ 1 = 1
h c t i t × τ 1 = h g c t i t τ × p n g + h e c t i t × e p t × τ 1
h c f i t × τ 1 = h g c f i t τ × p n g + h e c f i t × e p t × τ 1
d e c × τ 1 = c = 1 C i = 1 I t = 1 T e c × V c × ( h g c t i t τ + h g c f i t τ )
h g c t i t τ = G am × Δ t × τ 1 / ρ
h s t i t × τ 1 = α GT 1 × h g c t i t τ β GT 1 × τ 1
h e t i t × τ 1 = α GT 2 × h g c t i t τ β GT 2 × τ 1
h g c f i t τ = α SB 2 × h s f i t × Q g × Δ t × η 2 × τ 1
Similarly, the original objective function (2) and its related constraints are rewritten as follows:
min   g ( t ) τ = i = 1 I t = 1 T ( h e c t i t τ + h e c e i t τ + h e c f i t τ )
( G P T C ) × τ 2 = 1
h c t i t × τ 2 = h g c t i t × p n g × τ 2 + h e c t i t τ × e p t
h c e i t × τ 2 = h e c e i t τ × e p t
h c f i t × τ 2 = h g c f i t × p n g × τ 2 + h e c f i t τ × e p t
h e c t i t τ = G am × C pa × ( T 2 T 1 ) × Δ t × τ 2
h s e i t × τ 2 = α HRSG × h e c e i t τ β HRSG × τ 2
h e c f i t τ = α GSB 1 × h s f i t × τ 2 β GSB 1 × τ 2
Moreover, the original objective function (3) and its related constraints are reformulated as follows:
min   h ( t ) τ = λ × i = 1 I t = 1 T ( h s t i t τ + h s f i t τ )
( G P T C ) × τ 3 = 1
h w t × τ 3 = λ × w p × i = 1 I ( h s e i t × τ 3 + h s f i t τ )
h s d t × τ 3 = i = 1 I ( h s e i t × τ 3 + h s f i t τ )
h s t i t τ = a GT 1 × h g c t i t × τ 3 b GT 1 × τ 3
h s e i t × τ 3 = η 1 × h s t i t τ
h e c f i t × τ 3 = α SB 1 × h s f i t τ β SB 1 × τ 3
h g c f i t × τ 3 = α SB 2 × h s f i t τ × Q g × Δ t × η 2
h s f i t τ h s f max × τ 3
where τ1, τ2, and τ3 are the intermediate variables, respectively.
Next, the weighted summation method is used to convert three objectives (i.e., (45), (54), and (62)) to the integrated one by assigning three weight coefficients to them. Finally, the new optimization model is reformulated as follows:
min   E I τ = ω 1 ( g max ( t ) g min ( t ) ) ( h max ( t ) h min ( t ) ) i = 1 I t = 1 T ( h g c t i t τ + h g c f i t τ ) ω 2 ( f max ( t ) f min ( t ) ) ( h max ( t ) h min ( t ) ) i = 1 I t = 1 T ( h e c t i t τ + h e c e i t τ + h e c f i t τ ) ω 3 λ ( f max ( t ) f min ( t ) ) ( g max ( t ) g min ( t ) ) i = 1 I t = 1 T ( h s t i t τ + h s f i t τ )
( G P T C ) ( f max ( t ) f min ( t ) ) ( g max ( t ) g min ( t ) ) ( h max ( t ) h min ( t ) ) × τ = 1
h c t i t × τ = h g c t i t τ × p n g + h e c t i t × e p t × τ
h c e i t × τ = h e c e i t τ × e p t
h c f i t × τ = h g c f i t × p n g × τ + h e c f i t τ × e p t
h w t × τ = λ × w p × i = 1 I ( h s e i t × τ + h s f i t τ )
h s d t × τ = i = 1 I ( h s e i t × τ + h s f i t τ )
h e c t i t τ = G am × C pa × ( T 2 T 1 ) × Δ t × τ
h g c t i t τ = G am × Δ t × τ / ρ
h s t i t × τ = α GT 1 × h g c t i t τ β GT 1 × τ
h e t i t × τ = α GT 2 × h g c t i t τ β GT 2 × τ
h s e i t × τ = α HRSG × h e c e i t τ β HRSG × τ
h s e i t × τ = η 1 × h s t i t τ
h e c f i t × τ = α SB 1 × h s f i t τ β SB 1 × τ
h g c f i t × τ = α SB 2 × h s f i t τ × Q g × Δ t × η 2
h s f i t τ h s f max × τ
where EI = the new integrated objective function; ωi = the weight value related to each objective function ((45), (54), and (62)), where i is the type of objective function.
Figure 2 shows the formulation and solution procedure of the MOFP model, which is described as follows: (i) collect and analyze the data information such as economic parameters, equipment parameters, and user demands; (ii) design the objective function as the ratio between energy consumption and economic benefit based on the energy intensity conception; (iii) formulate the MOFP model for supporting the optimal operation of CHP system based on FP; (iv) transform three fractional objectives into their deterministic equivalents; (v) convert multiobjective function to single objective function with the aid of weighted summation method and solve it; and (vi) generate optimal operation schedule for the CHP system.

4. Results Analysis and Discussion

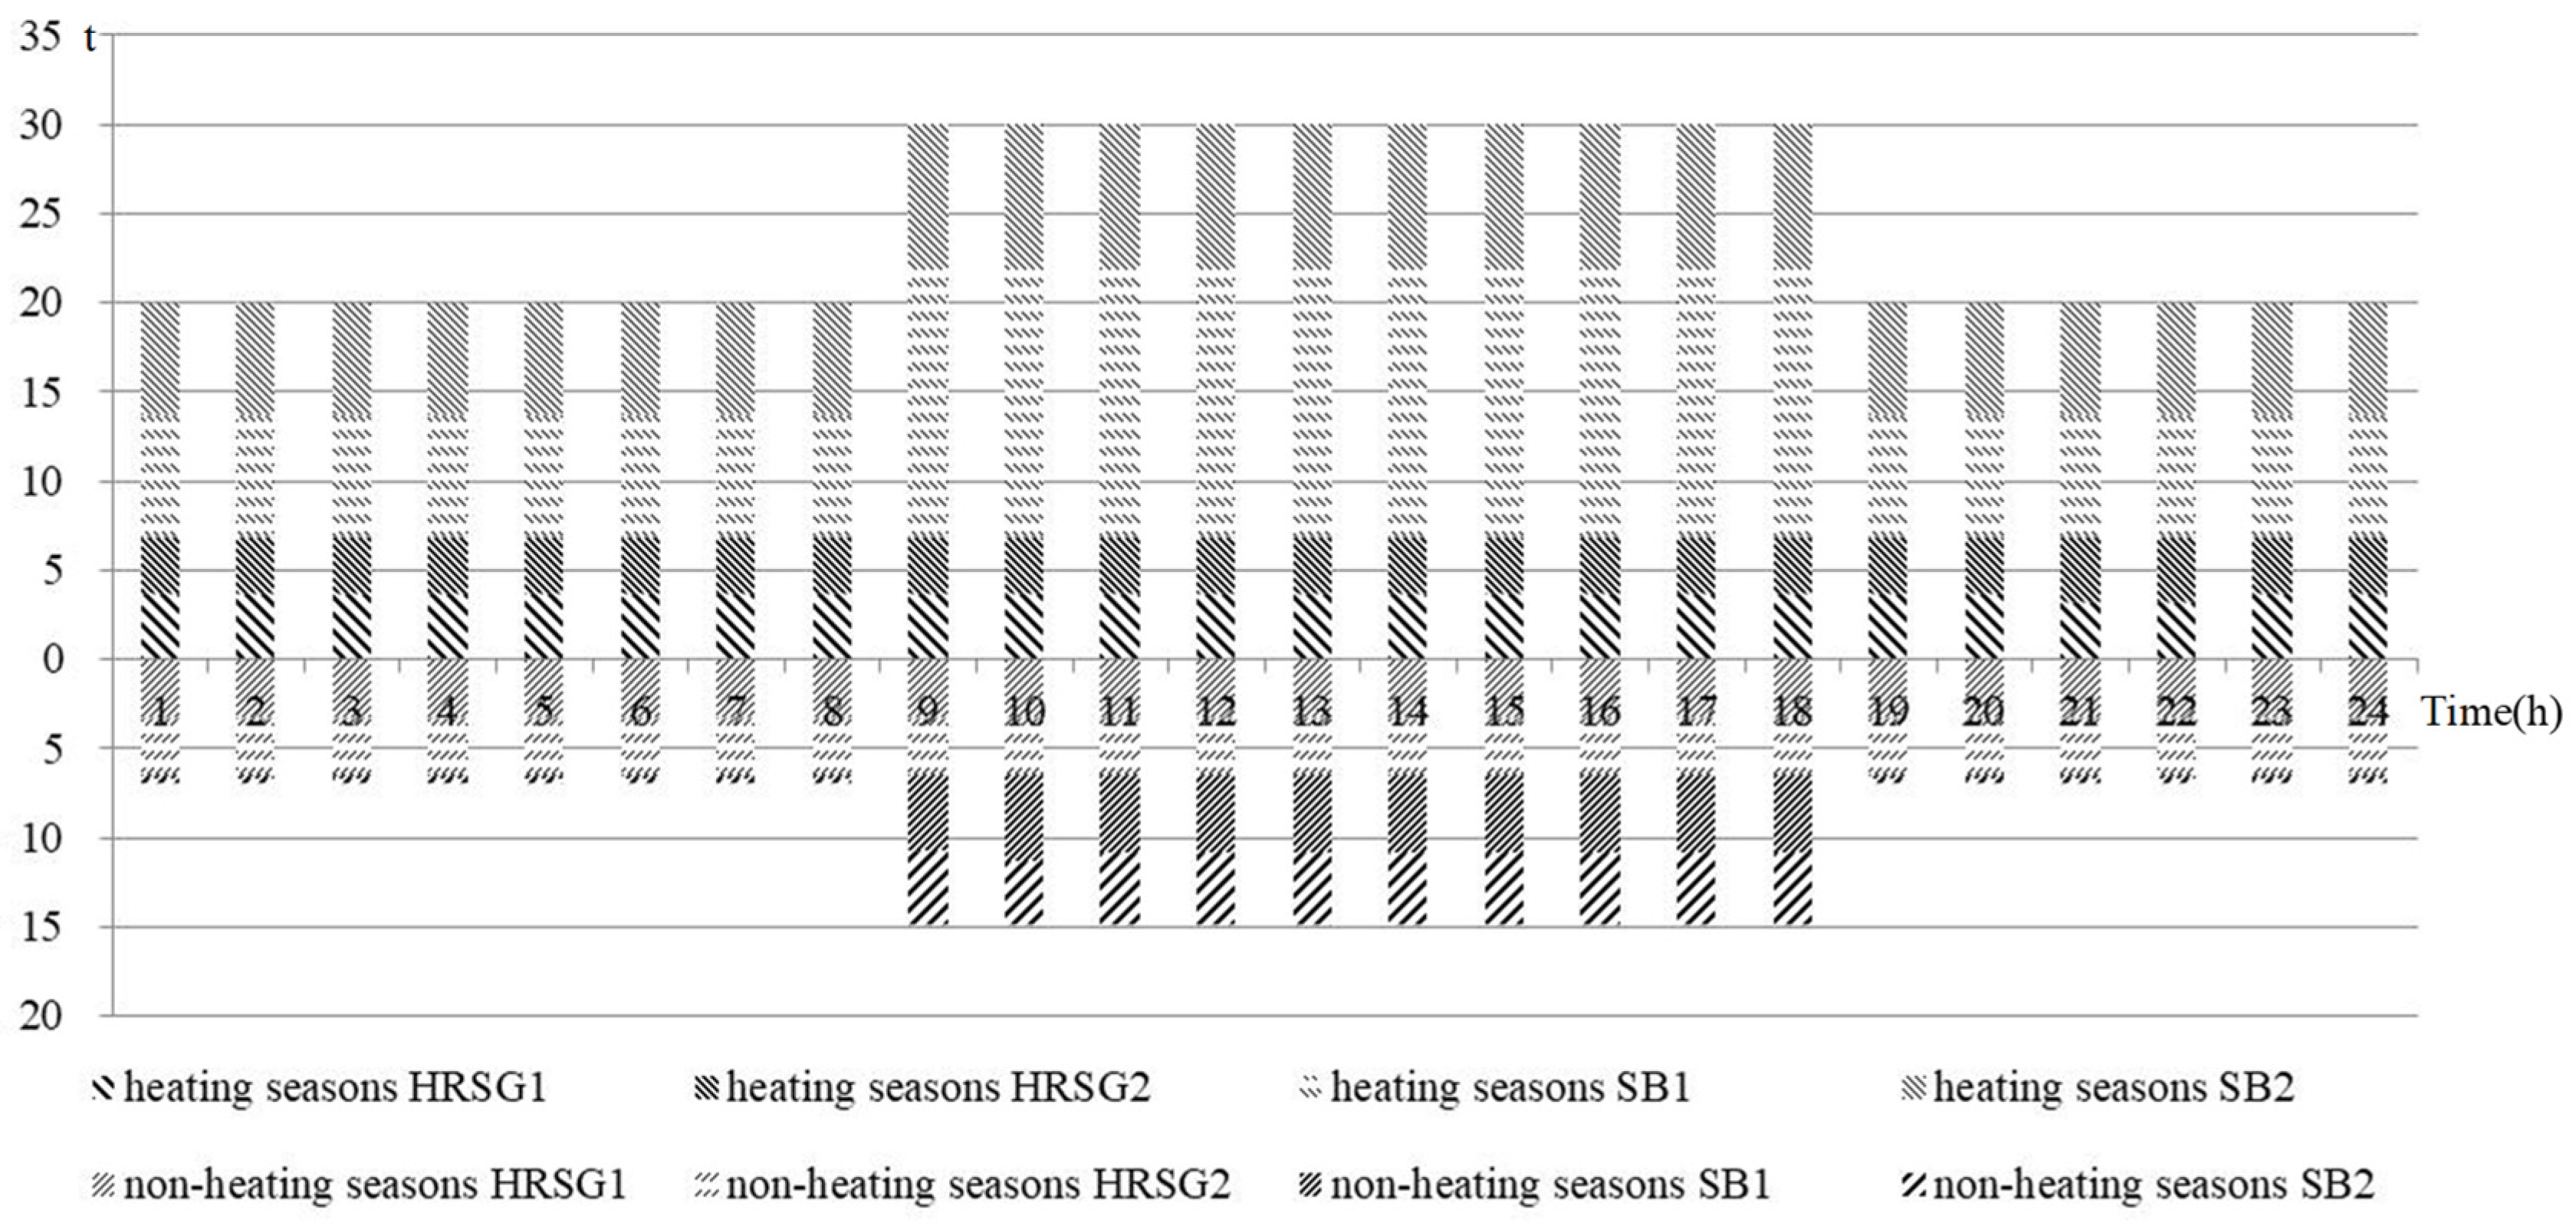
4.1. Result Analysis

Figure 3 shows the operation schedule of GTs during different periods over two seasons (i.e., the heating and nonheating seasons), which are provided by the MOFP model. As shown in Figure 3, the cooperation of two GTs is preferred during the heating season in order to meet the daily power demand of the park, and there is no need to purchase electricity from the external power grid. The power supply load is mainly provided by GT1, where the daily generation of GT1 was 43,910.42 kW; correspondingly, the total power generation of GT1 and GT2 was 84,216 kW. There were two reasons for this arrangement. Firstly, the preferential use of two GTs instead of an external power grid could improve the overall economic benefits while their discharged flue gas is recycled by HRSGs. Secondly, during the heating season, the electricity demand of the park was 3509 kW, which is lower than the total maximum output power of two GTs, being 3700 kW. When operated together, it was sufficient to meet the daily demand of the park. The output power of GT1 from 8 a.m. to 6 p.m. was 1850 kWh, that is, full-load operation, which was primarily determined by the maximum steam demand during this period. For the rest of the time, GT2 shared part of the load. The power output of two GTs was kept at about 1659–1840 kWh, with the load ratio exceeding 89%. This is because it could effectively avoid the long-term full-load operation of a single device, which may impair the equipment. Secondly, the high load operation can not only guarantee the normal electric load of the park but also improve power-generation efficiency. During the nonheating season, it is still preferred that GT is responsible for meeting the electricity needs. Although the electricity demand is the same as that during the heating season, because of the low temperature, the output power of GTs is lower than during the heating season (only 1711 kW). Therefore, even if two GTs operated together at full load, they were still incapable of meeting the daily power demand of the park, where insufficient electricity supply was supplemented by the external power grid.
The steam, which was produced during the heating season by the CHP system, was used to meet the production and living activities of the park, where the total heat demand was about 580 tons per day. Figure 4 shows the output of two types of boilers during the heating and nonheating seasons. From Figure 4, it is obvious that the HRSG was preferred to provide steam for users during the heating season, although the main steam load was satisfied by SB. It is designed that the HRSG uses high-temperature flue gas generated during the operation of the GT to produce steam in order to realize cascade utilization of natural gas, which was more conducive to realizing the goal of maximizing total revenue and improving the secondary utilization rate of energy. Therefore, the use of HRSG equipment to meet the users’ needs should be prioritized. However, due to the large demand during the heating season and the limited rate of the HRSG, the load shortage was satisfied by SB. For instance, from 8 a.m. to 6 p.m., the two HRSGs were able to provide 3.64 and 3.17 t/h, and for the rest of the time, the steam output of the two HRSGs fluctuated between 3.19–3.62 t/h, being maintained at a stable state. As for the provision amounts, those of HRSG1 are higher than those of HRSG2. This is because the HRSG produced steam by recovering the flue gas generated by the GT, where the flue gas produced by the GT correlated positively with its output, and the output of GT1 was greater than that of GT2. This will lead to the fact that the amount of steam generated by HRSG1 was larger than that of HRSG2. Because the full load operation of the HRSG cannot meet the user’s needs, the rest was provided by the SB. For example, the heat load was mainly supplied by the SB1 and is assisted by the SB2. SB1 runs at full capacity from 8 a.m. to 6 p.m. and supplies 15 tons of steam per hour. For the rest of the time, the SB2 shares part of the load, keeping the load between 6.25 and 6.94 t/h. Such distribution helps reduce the maintenance cost of equipment and extends the service life of the two SBs. As for the nonheating season, the output of two HRSGs was 3.3 t/h approximately, and the total output was about 158.2 t/d. Similarly, the steam generated by the HRSGs was still the first option to meet the production and living activities, and the inadequate portion was provided by the SBs. The difference was that, during the nonheating season, the HRSGs are enough to bear most of its steam load, so the gas-fired boiler was only supplementary.
The revenue of this system comprises power and steam output, and the operational cost mainly consisted of equipment maintenance and energy consumption. As shown in Table 2, the net profits for the heating season and nonheating season were 91,675 RMB/d and 89,085 RMB/d, respectively, while the operating costs are 128,252 RMB/d and 42,808 RMB/d, respectively. Both profit and cost for the heating season were much higher than for the nonheating season, because of the large difference in steam demand caused by different user demands. The greater the energy demand was, the higher was the revenue and cost. In fact, the steam production during the heating season could reach 2.3 times that of the nonheating season, i.e., 580 t/d and 248 t/d, respectively. The daily natural gas consumption, electricity consumption, and water consumption during the heating season were higher than during the nonheating season. For example, the natural gas consumption in the heating season was 32,611.48 m3, which is three times that of the nonheating season. In addition, the water demand during the heating season was twice the one in the nonheating season (634.47 t/d). Although the nonheating season has an additional cost of purchasing electricity, it is very limited. So it was not enough to change the fact that the operating cost for the CHP system during the heating season was higher than during the nonheating season.

4.2. Discussion

Table 3 shows the energy intensity and benefits of traditional models and MOFP model separately, where the traditional model considered the maximization of total system benefit as the objective function. It is clear that the energy intensity of the MOFP model is superior to the traditional model. The consumption amounts of the natural gas, electricity, and water corresponding to a profit of one million RMB by MOFP model were lower than those obtained relying solely on the traditional model, where their differences are 1243.39 m3, 126.64 kW, and 14.19 t, respectively. This is because the objective function of the MOFP model emphasizes the minimization of energy consumption per unit of economic output instead of the maximization in economic output involved in the traditional optimization model. The performance of the MOFP model in energy conservation is superior to that of the traditional model, where supplied steam amounts of HRSG with the low energy consumption are higher than those in the traditional model, although total system benefits of the MOFP model were lower than those of traditional one. This not only helps the gas-fired DES system to produce a good profit but also highlights the “greenness” of the revenue, with the capabilities of improving energy efficiency and reducing environmental pollution.
The above comparison and analysis suggest that the MOFP optimization model, which takes into account the maximized revenue and minimized energy consumption, helps enterprises pay more attention to resource preservation and environmental protection. However, it still has many aspects that need to be improved. For example, this is the first attempt of the FP method to support the operational management of the CHP system by incorporating the conception “energy intensity” into the optimization model. However, due to the limited production scale and simple structure of the CHP system, compared with the conventional optimization model, the advantages of the proposed model are not outstanding. To better reflect the advantages of the proposed MOFP model, a large-scale project is more suitable in the future. Secondly, some model parameters were based on empirical values, while some of the input–output responses for calculating the equipment’s capacities were fitted using simple linear equations. To ensure the MOFP model is more realistic, it may be possible to collect actual data and estimate the capacities with the aid of an integrated mechanistic and intelligent model [17]. Finally, although the steam demand is essentially stable, the actual electricity consumption varies. In the future, a stochastic or interval uncertainty optimization algorithm can be incorporated into the MOFP model in order to identify critical system parameters accurately.

5. Conclusions

The primary goal of this paper was to develop a fractional multiobjective optimization model for supporting the optimal operation of the CHP system in Jinan, China. This is the first application of the FP method for a natural gas cogeneration system, which innovatively considered the “energy intensity” as the objective function and emphasized the importance of the minimization in the energy consumption economic benefits per unit, instead of simple maximization in the system benefits. It greatly improves energy efficiency and realizes a stable and sustainable energy supply for social and economic development. The weighted summation method was used to tackle the multiobjective issue, where the results under equal weight are considered representative because of the small differences among obtained results under various weight combination conditions. The comparison results with the traditional optimization model reflected the advantage of the proposed model in enhancing the greenness of the operational schedule, although it is not outstanding. To enhance the practicability and reliability of the proposed model, some improvements need to be accomplished. Firstly, it is necessary to realize the accurate estimation of equipment’s capacities with the aid of an integrated mechanistic and intelligent model. Secondly, some irrational simplifications of critical system parameters (including economic, engineering, and demand parameters) should be avoided with the aid of suitable uncertain optimization algorithms. Finally, a large-scale CHP system coupled with renewable energy should be considered as the study case in order to realize the promotion of the proposed model.

Author Contributions

Y.X.: Software, Formal analysis, Writing—Original Draft. N.M.: Supervision, Conceptualization. X.W.: Methodology, Investigation. J.T.: Conceptualization, W.L.: Methodology. All authors have read and agreed to the published version of the manuscript.

Funding

This research was funded by the State Key Laboratory of Power Grid Safety and Energy Conservation, grant number YDB51202001924.

Conflicts of Interest

The authors declare no conflict of interest.

Nomenclature

cdifferent atmospheric pollutants, (c = 1 for SO2, c = 2 for NOX, c = 3 for CO2)
dcedaily operation cost of HRSG (RMB)
dcfdaily operation cost of SB (RMB)
dctdaily operation cost of GT (RMB)
decdaily environmental cost (RMB)
dwdaily cost of water consumption (RMB)
ecemission coefficient (kg/106 m3)
epthe time-of-use electricity price (RMB)
EIthe new integrated objective function
f(t)total consumption amounts of natural gas corresponding to unit benefits
g(t)total consumption amounts of electricity power corresponding to unit benefits
Gaminlet flow of compressor (kg/s)
Cpaspecific heat at constant pressure (J/kg.K)
GPtotal system revenues in that day (RMB)
h(t)total consumption amounts of water corresponding to unit benefits
hcethe operation cost of HRSG per hour (RMB)
hcfthe operation cost of SB per hour (RMB)
hctthe operation cost of GT per hour (RMB)
hecethe electricity power consumption of HRSG per hour (kW/h)
hecfthe electricity power consumption of SB per hour (kW/h)
hectthe electricity power consumption of GT per hour (kW/h)
hetthe electricity production of GT per hour (kW)
hetmaxthe maximum power generation of GT, kW
hgcfthe natural gas consumption of SB per hour (m3/h)
hgctthe natural gas consumption of GT per hour (m3/h)
hsethe steam production from HRSG per hour (t)
hsemaxregulated maximum steam provision amount
hsfthe steam production from SB erper hour (t/h)
hsfmaxthe rated power of SBs
hstthe heat generated by GT per hour (t/h)
hwthe consumption cost of water caused by devices utilization (RMB)
Itotal number of devices
psthe unit price of steam (RMB/t)
pngthe price of nature gas (RMB/m3)
Qgthe calorific value of natural gas
t (t = 1, 2, …, T)the index of time periods (h)
Δtoperational time (s)
Ttotal number of time periods
T1inlet temperature of compressor (°C)
T2outlet temperature of compressor (°C)
TCtotal system cost in that day (RMB)
TCEtotal consumption amounts of electricity power (kW)
TCGtotal consumption amounts of natural gas (m3)
TWCtotal consumption amounts of water (t)
Vcthe charge for pollutant c discharge (RMB/kg)
wpthe water price (RMB/t)
αGT1 and βGT1coefficients of fit function describing the relationship between excess heat and natural gas consumption
αGT2 and βGT2the coefficients of fit function that represents the relationship between power generation and natural gas consumption
αHRSG and βHRSGcoefficients of fit function that represents the relationship between the power consumption and steam production
aSB1 and bSB1the coefficients of fit function describing the relationship between the power consumption and steam production
αSB2empirical coefficient of thermal power conversion of SB
Λconversion coefficient of water vapor and water
ρdensity of natural gas (kg/m3)
η1efficiency of HRSG
η2efficiency of SBs
τ1, τ2 and τ3the intermediate variables, respectively

References

  1. Mohn, K. The gravity of status quo: A review of IEA’s World Energy Outlook. Econ. Energy Environ. Policy 2020, 9, 63–81. [Google Scholar] [CrossRef]
  2. Cao, Y.; Wang, Q.; Wang, Z.; Jermsittiparsert, K.; Shafiee, M. A new optimized configuration for capacity and operation improvement of CCHP system based on developed owl search algorithm. Energy Rep. 2020, 6, 315–324. [Google Scholar] [CrossRef]
  3. Tan, Z.-F.; Zhang, H.-J.; Shi, Q.-S.; Song, Y.-H.; Ju, L.-W. Multi-objective operation optimization and evaluation of large-scale NG distributed energy system driven by gas-steam combined cycle in China. Energy Build. 2014, 76, 572–587. [Google Scholar] [CrossRef]
  4. Jing, Y.-Y.; Bai, H.; Wang, J. Multi-objective optimization design and operation strategy analysis of BCHP system based on life cycle assessment. Energy 2012, 37, 405–416. [Google Scholar] [CrossRef]
  5. Wang, J.; Yang, Y.; Sui, J.; Jin, H. Multi-objective energy planning for regional natural gas distributed energy: A case study. J. Nat. Gas Sci. Eng. 2016, 28, 418–433. [Google Scholar] [CrossRef]
  6. Zhao, F.; Zhang, C.H.; Sun, B. Initiative Optimization Operation Strategy and Multi-objective Energy Management Method for Combined Cooling Heating and Power. IEEE-CAA J. Autom. Sin. 2016, 3, 385–393. [Google Scholar]
  7. Zheng, C.; Wu, J.; Zhai, X.; Wang, R. Impacts of feed-in tariff policies on design and performance of CCHP system in different climate zones. Appl. Energy 2016, 175, 168–179. [Google Scholar] [CrossRef] [Green Version]
  8. Luo, X.; Zhu, Y.; Liu, J.; Liu, Y. Design and analysis of a combined desalination and standalone CCHP (combined cooling heating and power) system integrating solar energy based on a bi-level optimization model. Sustain. Cities Soc. 2018, 43, 166–175. [Google Scholar] [CrossRef]
  9. Luo, Z.; Wu, Z.; Li, Z.; Cai, H.; Li, B.; Gu, W. A two-stage optimization and control for CCHP microgrid energy management. Appl. Therm. Eng. 2017, 125, 513–522. [Google Scholar] [CrossRef]
  10. Yang, G.; Zhai, X. Optimal design and performance analysis of solar hybrid CCHP system considering influence of building type and climate condition. Energy 2019, 174, 647–663. [Google Scholar] [CrossRef]
  11. Yang, G.; Zhai, X. Optimization and performance analysis of solar hybrid CCHP systems under different operation strategies. Appl. Therm. Eng. 2018, 133, 327–340. [Google Scholar] [CrossRef]
  12. Wang, J.; Lu, Z.; Li, M.; Lior, N.; Li, W. Energy, exergy, exergoeconomic and environmental (4E) analysis of a distributed generation solar-assisted CCHP (combined cooling, heating and power) gas turbine system. Energy 2019, 175, 1246–1258. [Google Scholar] [CrossRef]
  13. Zhu, H.; Huang, G. SLFP: A stochastic linear fractional programming approach for sustainable waste management. Waste Manag. 2011, 31, 2612–2619. [Google Scholar] [CrossRef] [PubMed]
  14. Charles, V.; Dutta, D. Identification of redundant objective functions in multi-objective stochastic fractional programming problems. Asia-Pac. J. Oper. Res. 2006, 23, 155–170. [Google Scholar] [CrossRef]
  15. Shen, K.; Yu, W. Fractional Programming for Communication Systems—Part I: Power Control and Beamforming. IEEE Trans. Signal Process. 2018, 66, 2616–2630. [Google Scholar] [CrossRef] [Green Version]
  16. Klačková, I.; Zajačko, I.; Lenhard, R.; Gritsuk, I.; Wiecek, D. Simulation of wood biomass combustion in hot water boiler. IOP Conf. Ser. Mater. Sci. Eng. 2020, 776, 012033. [Google Scholar] [CrossRef]
  17. Zhong, Y.F.; Yan, W.D. Research on modeling and simulation of a micro gas turbine based on MATLAB. Power Equip. 2019, 33, 325–330. [Google Scholar]
Figure 1. The structure and operational process of the CHP system.
Energies 15 01965 g001
Figure 2. The formulation and solution framework of the MOFP model.
Energies 15 01965 g002
Figure 3. The output of GTs in different periods.
Energies 15 01965 g003
Figure 4. The output of HRSGs and SBs in different periods.
Energies 15 01965 g004
Table 1. The device parameters of the CHP system.
Main Machines
GTsNote HRSGsSBs
Rated speed26,000 r/min/Production6 t/h15 t/h
Generating output1850 kWAmbient temperature: 5 °CRated steam pressure1.25 MPa1.25 MPa
171 kWAmbient temperature: 15 °CRated steam temperature193.4 °C193.4
Efficiency24.4%Ambient temperature: 5 °CEconomizer feed temperature104 °C104 °C
23.6%Ambient temperature: 15 °CBlowdown rate2%2%
Natural gas consumption742 Nm3/hAmbient temperature: 5 °CInlet flue gas temperature570 °C/
709 Nm3/hAmbient temperature: 15 °CGas mass flow9.09 kg/s/
Exhaust temperature570 °CAmbient temperature: 5 °CExhaust temperature<100 °C~137 °C
578 °CAmbient temperature: 15 °CEfficiency~75%~93.4%
Gas mass flow9.09 kg/sAmbient temperature: 5 °CHeating area/286.19 m2
8.73 kg/sAmbient temperature: 15 °CEnergy consumption/1038 Nm3/h
Table 2. Energy consumption and economic performance of the CHP system over two seasons.
TimeHeating SeasonsNonheating Seasons
Energy ConsumptionEconomic EfficiencyEnergy ConsumptionEconomic Efficiency
Gas (m3)Power (kW)Water (t)Cost (RMB)Profit (RMB)Gas (m3)Power (kW)Water (t)Cost (RMB)Profit (RMB)
11066.27231.7922.274205.693099.71166.94182.609.20873.792999.41
21066.27231.7922.274205.693099.71166.94182.609.20873.792999.41
31066.27231.7922.274205.693099.71166.94182.609.20873.792999.41
41066.27231.7922.274205.693099.71166.94182.609.20873.792999.41
51066.27231.7922.274205.693099.71166.94182.609.20873.792999.41
61066.27231.7922.274205.693099.71166.94182.609.20873.792999.41
71066.27231.7922.274205.693099.71166.94182.609.20873.792999.41
81066.27231.7922.274205.693099.71166.94182.609.20873.792999.41
91768.37269.8932.276803.353102.05728.62213.0817.202951.923001.28
101768.37269.8932.276884.324073.78728.62213.0817.203015.843963.96
111768.37269.8932.276884.324073.78728.62213.0817.203015.843963.96
121768.37269.8932.276884.324073.78728.62213.0817.203015.843963.96
131768.37269.8932.276884.324073.78728.62213.0817.203015.843963.96
141768.37269.8932.276884.324073.78728.62213.0817.203015.843963.96
151768.37269.8932.276884.324073.78728.62213.0817.203015.843963.96
161768.37269.8932.276884.324073.78728.62213.0817.203015.843963.96
171768.37269.8932.276884.324073.78728.62213.0817.203015.843963.96
181768.37269.8932.276938.294721.61728.62213.0817.203058.464605.74
191066.27231.7922.274321.584738.32166.94182.609.20965.094619.11
201066.27231.7922.274321.584738.32166.94182.609.20965.094619.11
211066.27231.7922.274321.584738.32166.94182.609.20965.094619.11
221066.27231.7922.274275.224082.88166.94182.609.20928.573971.23
231066.27231.7922.274275.224082.88166.94182.609.20928.573971.23
241066.27231.7922.274275.224082.88166.94182.609.20928.573971.23
aggregate32,611.485943.92634.47128,252.0791,675.239623.434687.23300.7442,808.3389,085.07
Table 3. The comparison between two models.
Heating Seasons
Objective FunctionsTraditional ModelMOFP ModelGap
f(x)48,023,330,907.0948,023,329,663.711243.3895
g(x)8,752,958,259.868,752,958,133.22126.6447
h(x)981,030,925.43981,030,911.2414.1943
EI−0.00334281−0.012084540.0087
A Year
Objective FunctionsTraditional ModelMOFP ModelGap
f(x)72,869,132,006.1572,869,131,089.21916.9460
g(x)20,854,468,697.7120,854,468,730.08−32.3698
h(x)1,796,291,165.261,796,291,161.783.4822
EI7537.98997537.98990.000031
Publisher’s Note: MDPI stays neutral with regard to jurisdictional claims in published maps and institutional affiliations.

