Article

The Role of Anaerobic Digestion and Solar PV to Achieve GHG Neutrality in a Farm Setting

by
Horacio Andres Aguirre-Villegas
1,*,
Erin Cortus
2 and
Douglas J. Reinemann
1
1
Biological Systems Engineering, University of Wisconsin-Madison, 460 Henry Mall, Madison, WI 53706, USA
2
Bioproducts and Biosystems Engineering, University of Minnesota, 1390 Eckles Avenue, Saint Paul, MN 55108, USA
*
Author to whom correspondence should be addressed.
Energies 2022, 15(6), 1975; https://doi.org/10.3390/en15061975
Submission received: 7 February 2022 / Revised: 27 February 2022 / Accepted: 3 March 2022 / Published: 8 March 2022

Abstract

:
Dairy farms are challenged to increase productivity while achieving environmental sustainability, where greenhouse gas (GHG) emissions are at the center of the discussion. The U.S. dairy industry leadership has committed to a Net Zero Initiative to achieve GHG neutrality, but the specifics on how to achieve this are still uncertain. Life cycle assessment methods were used to quantify GHGs and net energy intensity (NEI) of a large (1000 cows) and a small (150 cows) farm in Wisconsin. The GHGs are 1.0 and 1.3 kg CO2-eq/kg FPCM and the NEI is 2.4 and 3.2 MJ/kg FPCM for the large and small farm, respectively. The GHG benefits from anaerobic digestion (AD, sized to process all manure on both farms) and PV (sized to match AD electricity production) are not enough to achieve GHG neutrality. Increasing the capacity of these systems showed that AD is more cost-effective for the larger farm, but the challenges and costs related to securing and disposing the extra manure needed for energy production limit its feasibility. For the smaller farm, the total annualized costs to achieve GHG neutrality are lower for PV vs. AD, even before accounting for any transportation costs related to handling the extra manure.

1. Introduction

In 2020, the Innovation Center for U.S. Dairy set forth the “Net Zero Initiative” (NZI) to achieve greenhouse gas (GHG) neutrality and other environmental stewardship goals related to water and manure nutrient use by 2050 [1]. The purpose of this article is to determine if this goal is achievable using anaerobic digestion (AD) and solar photovoltaics (PV) to generate renewable electrical energy and displace grid electrical energy. In 2019, agriculture contributed 9.6% of total U.S. GHG emissions, with dairy being a major contributor [2]. In addition, consumers have been shifting their buying preferences and behavior toward more sustainable products. Between 2017 and 2019, the percentage of consumers purchasing products classified as “sustainable” because of earth/environmental reasons rose from 31% to 51%, surpassing family and community reasons [3]. Capper et al. [4], and Capper and Cady [5] quantified continuous efficiency improvements in the U.S. dairy industry from 1944 to 2017, resulting in reduced GHG emissions per unit of milk produced, However, achieving GHG neutrality will require additional improvements.
The “Net Zero” GHG goal is a common goal among many industries. GHG neutrality describes systems that do not increase atmospheric GHGs through the avoidance, reduction, or offsetting of emissions [6]. Pathways to net zero dairy production are system-specific and currently largely theoretical. Eckard and Clark [7] predicted that already-high organic carbon levels in soils will limit the role of the soil as a carbon sink in the Australian dairy industry’s NZI. For Italy, De Vivo and Zicarelli [8] suggested carbon fixation by vegetation grown for livestock feed exceeds that emitted by the animals, making carbon neutrality a likely reality. The NZI is usually envisioned as voluntary actions of the industry as a whole, accounting for variable farm sizes and geographies, and using current but also yet-to-be-discovered technologies [1]. In the U.S., different studies have evaluated alternative feeding, field, manure, and barn management practices at the farm level to reduce GHG emissions [9,10,11]. In addition, different dairy cooperatives are targeting cover crops, crop rotations, rotational grazing to promote carbon capture [12]. However, the overall impact on farm GHG is still uncertain. There is a business case to reach GHG neutrality in the U.S., with supportive technology and market developments [13]. Among these evaluated practices, the integration of dairy farms with renewable energy production is positioned as a feasible pathway to both reduce GHG emissions and turn the farm into a net energy producer. This is possible when considering the benefits of replacing fossil energy [10,14,15], an approach already adopted in the U.S. by the Renewable Energy Standard (RES) and the California Low Carbon Fuel Standard (LCFS). However, there are additional challenges when installing a renewable energy system on a dairy farm, including the required costs, inputs, and areas that need to be evaluated. Moreover, the systems need to be properly sized if the objective is to achieve GHG neutrality on-farm, resulting in additional costs and inputs which might make a specific renewable energy system more feasible than others. A study addressing all these issues is not available in the literature.
At the dairy farm level, energy and carbon are parts of the processes of growing feed, raising a dairy calf, and sustaining a cow through her productive life, and are directly related to the emission of GHGs. The energy and carbon flows entering, within, and exiting the system manifest in many forms. Fossil fuel use contributes to both carbon and energy flows, as an energy source entering the system and a source of GHG emissions during conversion of the energy for various purposes on farm. Developed countries have a greater reliance on fossil fuels for agricultural production, and expanded supply chains requiring processing, transportation, and refrigeration, which increase GHG emissions from energy use [16]. Feed production, enteric fermentation, and manure storage further contribute to emissions of methane (CH4) and nitrous oxide (N2O). Thus, two key environmental stewardship metrics for dairy farms are GHG emissions (commonly referred to as carbon emissions) and net energy intensity (NEI).
The life cycle assessment (LCA) is a common tool for evaluating environmental impacts, such as GHG emissions and NEI. Baldini et al. [17] summarized 44 LCAs applied to milk production in the last 10 years, with 29 and 17 studies evaluating global warming potential and energy use, respectively. Life cycle analyses of NEI—the difference between the energy required by the system and the energy supplied by the system—have considered direct (energy consumed at a system point) and indirect sources of energy use (cumulative upstream or embodied energy requirements) [16]. Direct on-farm energy use (excluding feed production) is a minor contributor to cradle-to-farm gate GHG emissions [5,14]. However, for an example dairy farm in Wisconsin, on-farm energy use was a major component to net energy use for ventilation within the dairy cow rearing area to collect and safely store milk prior to processing. In addition, on-farm energy use was also vital to supporting the cows’ environment via ventilation and/or manure management [14]. Herd size and production practices influence both the NEI and GHG [18]. On-farm energy generation can serve to reduce both of these and support the industry goals of the NZI.
In terms of the renewable energy systems that can be integrated on a dairy farm, AD of manure (with and without additional agricultural byproducts) is a recognized form of manure treatment that can reduce GHGs through CH4 conversion to usable energy forms, which offsets energy use [19,20], contributing to improve both GHG and NEI indicators. Whereas the AD process is well known, numerous reviews have recounted the feedstock, digester design and management factors that influence biogas production [21,22,23]. Among the 17 factors, the net present value for solid state anaerobic digesters was most sensitive to electricity or bio-methane price, digestate price, and labor price [24]. Despite technical and economic challenges, there were 317 manure-based anaerobic digesters in the U.S. in 2021 [25]. Photovoltaic energy is another means of on-farm energy generation, for direct use or to offset energy use. The capture and conversion of solar energy to electricity is regarded as clean and renewable. Agrivoltaics, the combined use of PV and agriculture (e.g., use of solar panels for shading livestock), have received increasing attention from farms [26,27]. Despite the advantages of both renewable energy systems, the benefits and trade-offs of installing AD and PV to achieve NZI in dairy farms has yet to be evaluated. This paper quantifies GHG emissions and NEI of modeled dairy farms in Wisconsin and evaluates the costs, inputs (e.g., land and manure), and environmental trade-offs for the farm to reach GHG neutrality by installing a renewable energy system based on AD and solar PV.

2. Materials and Methods

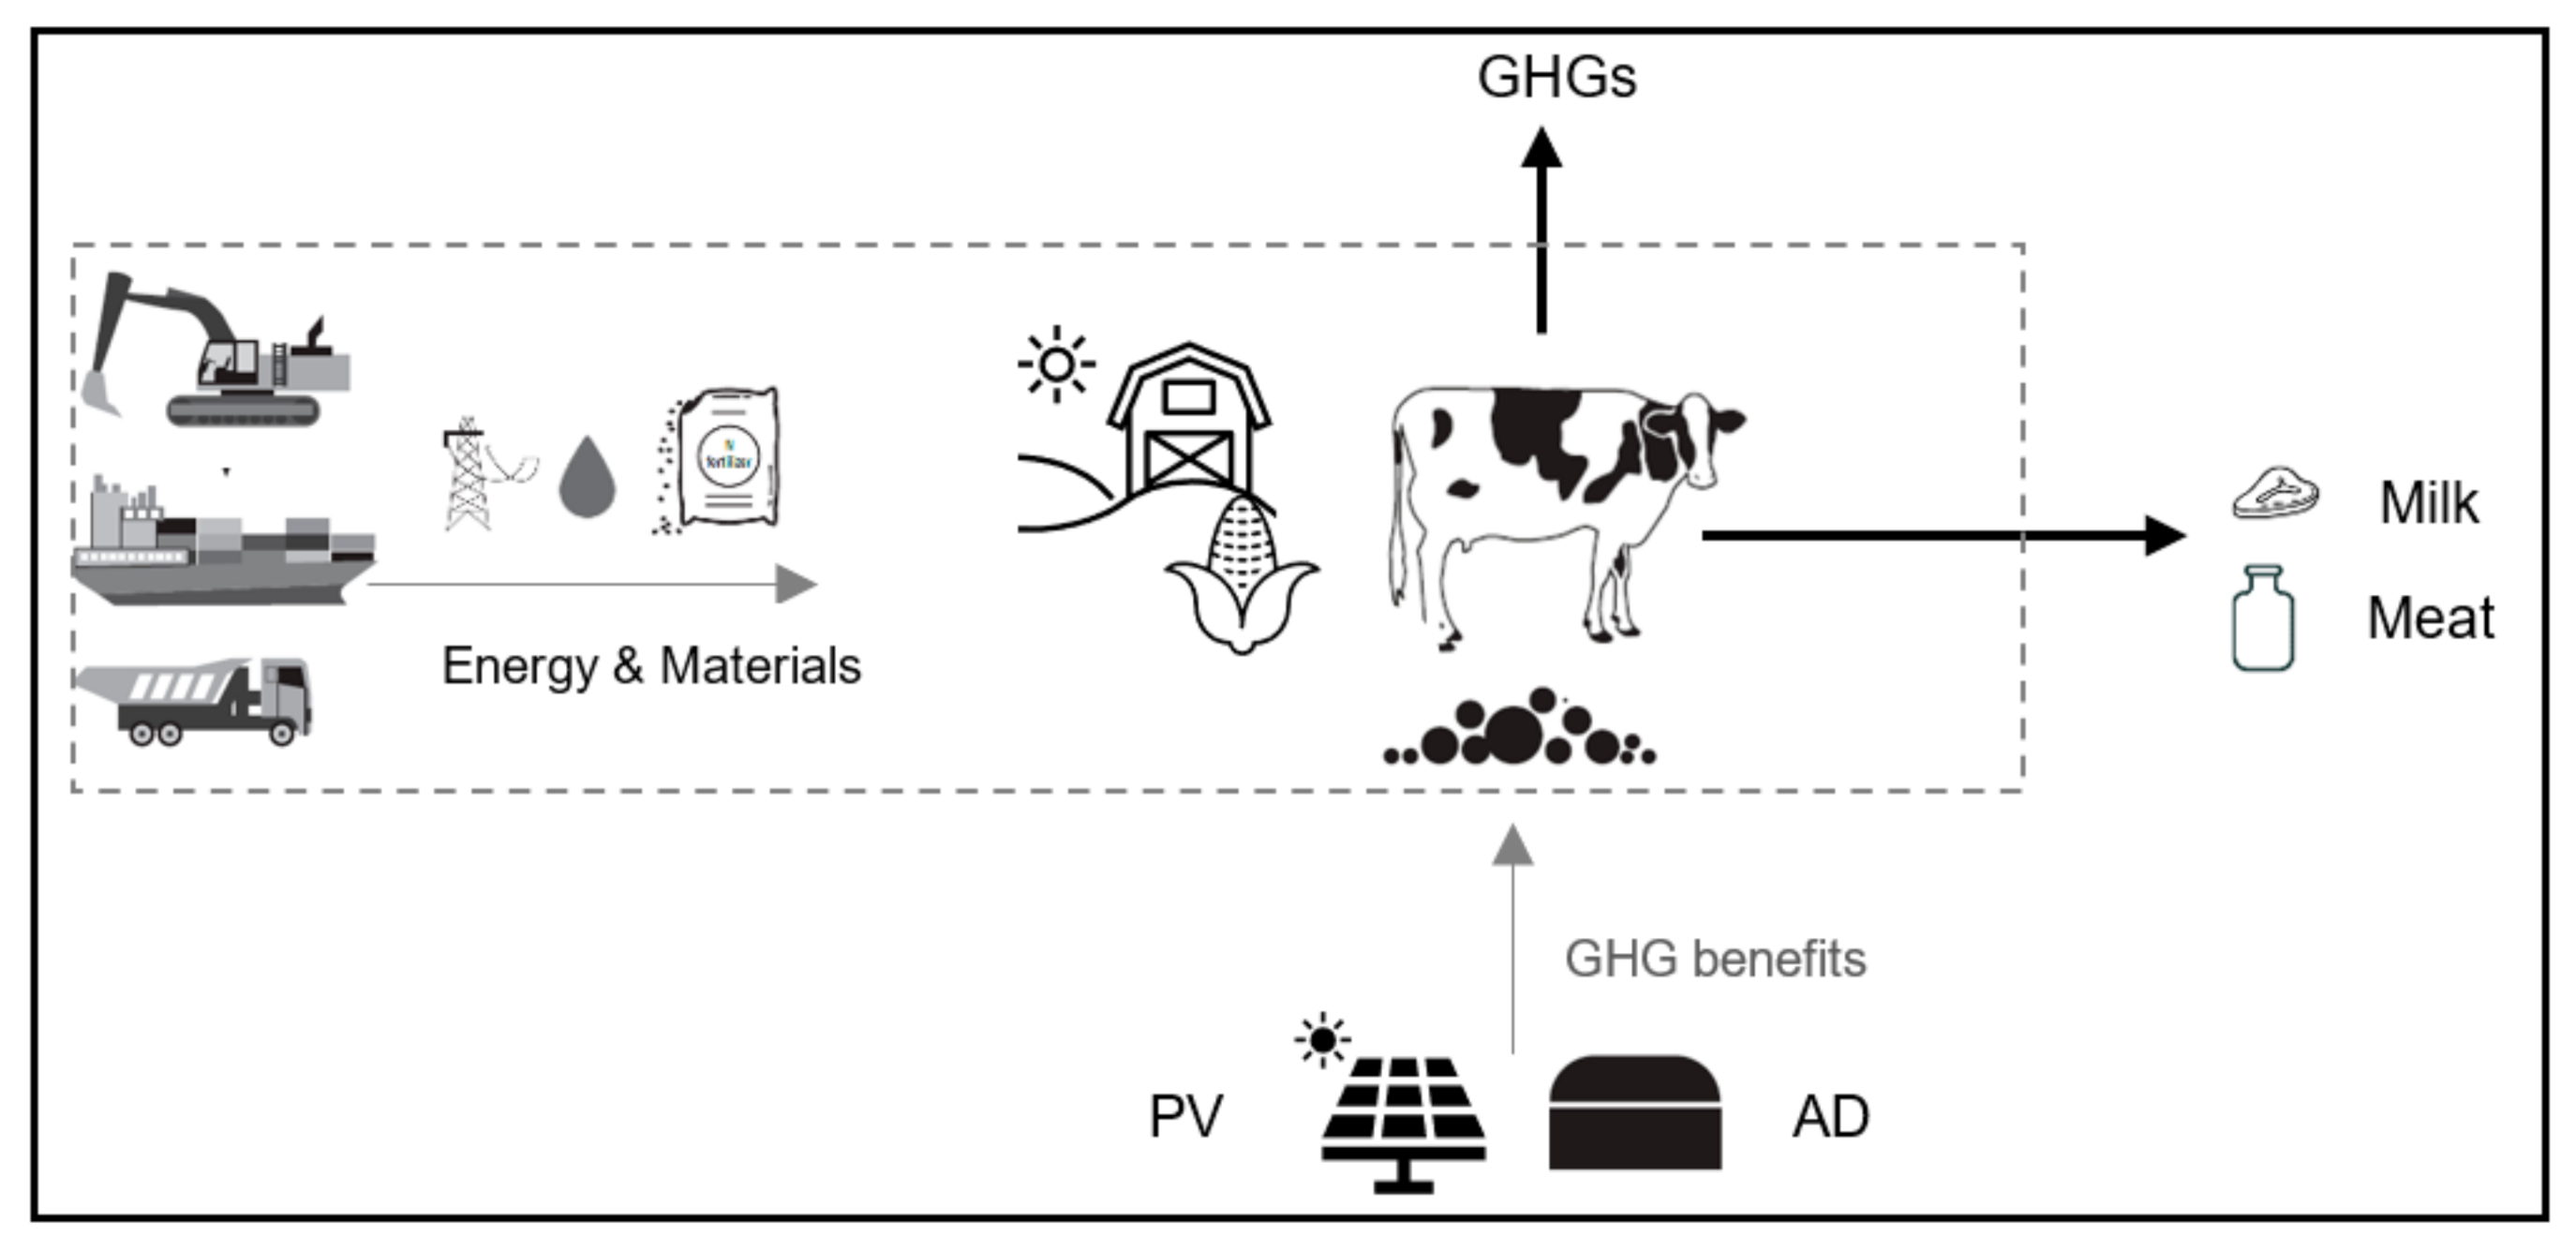
2.1. LCA Model Description: System Boundaries, Functional Unit, and Data

GHG emissions and NEI from two dairy farms representative of Wisconsin practices were quantified using a partial LCA model, from cradle-to-farm gate, as described by Aguirre-Villegas et al. [14]. This model replicates a dairy farm by considering daily dietary requirements and feed composition for each animal type, following the guidelines recommended by the National Research Council [28]. The model keeps track of all materials (e.g., commercial fertilizers, lime, seed, pesticides, herbicides) and energy inputs (e.g., gasoline, diesel, natural gas, and electricity) consumed at the farm and all outputs (e.g., GHG emissions, milk, and meat) during feed production, herd management, milking, and manure management. Embedded GHG emissions and energy consumed during the production of material and energy inputs are also included as this study considers a life cycle approach.
GHG emissions are expressed in kilograms of carbon dioxide equivalents (kg CO2-eq) and include the characterization factors of 28, 265, and 1 for CH4, N2O, and CO2 from fossil sources, respectively, over 100 years [29]. NEI is expressed in MJ and defined as the difference between the life cycle energy required by the system and the energy supplied by the system (negative energy indicates that the system is producing energy). Both GHG emissions and NEI were normalized per kg of fat- and protein-corrected milk (FPCM), corrected to 4% fat and 3.3% protein [30]. A nutritional allocation approach based on the fat and protein content in milk and meat assigned 99% of the GHG emissions and NEI to milk [14]. The GHG emissions and energy involved in the production of infrastructure and machinery were not included in the analysis.
Three modeling steps were taken to quantify environmental impacts and evaluate the resources and costs needed to achieve GHG neutrality: (1) A large and a small dairy farm without the production of renewable energy were defined as “base-cases”, and the GHG and NEI from these base-cases were estimated. (2) AD and solar PV systems were added to each of these dairy farm base-cases, where the AD systems in both farms were sized to process all manure generated by the base-case farms and the PV systems were sized to match the electricity production of the AD systems. (3) The capacity in both the AD and the PV systems was increased to the point where the benefits of producing renewable energy offset the total GHG emissions at the base-case farms and GHG neutrality was achieved (Figure 1). The description of the farms, as well as the AD and solar PV systems used to model the GHG and NEI, are presented below.

2.2. Large Farm Characteristics

The large farm example has 1000 Holstein milking cows (650 kg/animal), 286 mature heifers and dry cows (650 kg/animal), 605 growing heifers less than 21 months old (347 kg/animal), and 31 calves (52 kg/animal), for a total of 2306 animal units (1 AU = 454 kg of animal). The daily milk production is set at 35 kg/day at 3.5% fat and 3.0% protein. The dairy ration is presented in Table 1. This ration defines the nutrient flows from feed to milk and manure (NRC, 2001). It was assumed that all crops, except for cottonseed and soybean meal, were produced on farm. It was assumed that manure was land-applied on-farm, and any remaining N, P, and K needs were met with synthetic fertilizers.
Material and energy inputs consumed on- and off-farm for crop production, as well as their related impacts, were presented by Aguirre-Villegas et al. [14]. The total solids (TS) and volatile solids (VS) content of excreted manure, which determine the overall production of biogas, were estimated for each animal type based on [31]. After excretion, manure is tracked during collection, transportation, processing, storage, and land application. It was assumed that manure was collected, along with chopped straw used as bedding, by an electric alley scraper. Then, the manure was transported to storage. Manure was stored for 6 months as a slurry in a lined basin structure where a crust form on top of the manure, which was then land-applied by surface application twice a year in April and October. Life cycle inventory data of materials and energy and equations used to estimate GHG emissions from manure were presented by Aguirre-Villegas et al. [14].

2.3. Small Farm Characteristics

To capture the differences of farm management, a small organic dairy farm, representative of Wisconsin, was modeled based on data provided by the Cooperative Regions of Organic Producers Pools (CROPP), marketed as Organic Valley (OV), the largest organic dairy cooperative in the U.S. Farm characteristics. Data about herd management, milk production, crop production, energy use, manure, and cropping management for each farm type and region were provided by OV and compiled through internal surveys, and interviews with farmers, in-house veterinarians, and feed specialists. The small dairy farm is composed of 150 lactating Holstein cows, 38 mature heifers and dry cows, 78 growing heifers, and 8 calves. The daily milk production is 22.7 kg, at 4.2% fat and 3.1% protein, with the dairy ration presented in Figure 2. This farm maximizes grazing, which occurs for 6 months (May to October). Crop production areas receive manure as the only nitrogen and P fertilizer source, with some crops supplemented with potassium, gypsum, lime, and micronutrients. Cows are housed in a free stall. Manure is handled in its slurry form and stored for 6 months before land application in spring and fall. It is assumed that 90% of manure is collected during the non-grazing season and 50% of manure is collected during the grazing season.

2.4. Anaerobic Digestion System

For both farm types, a plug-flow anaerobic digester paired to a cogeneration system (combined heat and power) was sized to process all manure from the dairy herd and produce electricity and thermal energy. Biogas-based electricity production was determined by the CH4 content in biogas, which, at the same time, was determined by the VS content in manure (Table 2). Digestate was separated by a screw press following the separation efficiencies presented by Aguirre-Villegas et al. [32]. Both the liquid and solid fractions were stored for 6 months before on-farm land application.
After digestion, the GHG emission reductions come from the manure itself, the production of renewable electricity, and the production of thermal energy. Both the digestion and separation processes (referred as the AD system) reduce the overall VS content in the stored liquid manure, which reduce the CH4 emissions from manure storage. The produced biogas-based electricity replaces grid electricity and avoids the impacts associated with its generation. It was assumed that all biogas-based electricity was injected into the Wisconsin grid. As a result, the GHG emission and NEI benefits (−0.207 kg CO2-eq/MJ and −10.97 MJ/kWh, respectively [39]) of replacing grid-based electricity have a negative value. This also happens with the production of thermal energy that is modeled to replace thermal heat produced by natural gas, with benefits of −72 g CO2-eq/MJ for GHG and −1.1 MJ/MJ for EI [39]. There are also changes after digestion that result in GHG emission increments. The reduction in TS content avoids the formation of a natural crust on top of the manure during storage, which creates anaerobic conditions that promote CH4 emissions. In addition, a 1% CH4 leakage rate was considered from the digester [38].
Capital costs, as well as operation and maintenance costs, were included in the analysis. As expected, costs decreased with the increasing system size. Capital costs for the digester, generator, hydrogen sulfide removal system, and screw press were estimated with: Cost (US$) = −0.2485 × (number of lactating cows)2 + 1584.1 × number of lactating cows + 212,907 (R2 = 1), based on Lazarus [40]. Operation costs were set at USD 40,000/year [41], and maintenance costs were set at USD 0.0175/kWh [40]. The lifetime of the anaerobic digestor was considered to be 20 years [42].
Different studies have highlighted that despite important GHG emission reductions from AD, the dairy farm is still a source of emissions [9,14,38]. This study quantifies the additional capacity of the AD system modeled at the dairy farm to achieve GHG neutrality. This was achieved by applying the electricity production rate from the manure estimated for the AD system. It was assumed that this additional manure was imported from neighboring farms with no related environmental benefits or burdens. Transportation costs were considered, but it was assumed that the manure itself was free.

2.5. Solar PV System

A solar system matching the electricity rate produced by the AD system was evaluated to compare the GHG, NEI, and cost trade-offs for both dairy farm base-cases. For Wisconsin, a 14% capacity factor was used in the model [43]. Based on this size, a ground-mounted system was assumed with a lifetime of 25 years [44]. An average land requirement of 1.7 HA/GWh/year was considered for PV systems between 1 and 20 MW of capacity [45]. It was assumed that the produced solar-based electricity was also injected into the Wisconsin grid. As a result, the avoided GHG emissions and NEI were the same per MJ of produced electricity. However, the net GHG emissions from the dairy farm were different than with the AD system because there were no reductions in the CH4 from storage nor production of thermal energy. As with AD, the costs also decreased, with the increasing system size averaging USD 1.5/watt for capital costs and USD 18.7/kW/year for operation. The maintenance costs for the systems averaged between 3 and 4 MW, with USD 1.2/watt for capital costs (average fixed-tilt and one-axis tracker) and USD 16.9/kW/year for operation and maintenance costs for systems between 6 and 10 MW [46]. To achieve GHG neutrality with solar-based electricity, the dairy farm must increase the system PV capacity until the GHG emission benefits offset all GHG emissions at the farm level. Additional land and costs were considered based on the size of the system.

3. Results

3.1. Net Energy Intensity

The farm NEI is 2.4 and MJ/kg FPCM (77,756 MJ/farm/day) for the large farm and 3.2 MJ/kg FPCM (11,053 MJ/farm/day) for the small farm, with most of the energy inputs coming from the consumption of liquid fossil fuels and electricity (Figure 3). Interestingly, electricity consumption is lower per unit of milk produced at the larger farm, suggesting higher efficiencies than the smaller farm. This is also the case for fossil fuels use, suggesting that the small farm relies more heavily on machinery that consumes liquid fuels instead of electricity (e.g., skid steer for manure collection). The production of renewable electricity makes the large farm an energy-producing system as the production of both biogas-based and solar-based electricity is higher than the total lifecycle energy consumed by the farm. This also holds for the small farm with an AD system, but not for the PV system, as the electricity production in the latter is just enough to make the farm energy neutral. For both farms, the AD system results in lower NEI (more energy produced) due to the thermal energy available from the digestion process. However, it is not common for existing dairy farms with AD systems to use all this available heat on-farm. Without the thermal benefits, NEI from farms with AD systems would be similar to those from farms with PV systems.

3.2. GHG Emissions

The GHG emissions from the large and small base-case dairy farms (no renewable energy production) under the modeled management practices are 1.0 and 1.3 kg CO2-eq/kg FPCM (31,558 and 4408 kg CO2-eq/farm/day), respectively. Whereas the small farm has less material and energy inputs (e.g., fertilizers, diesel use for fertilizer application, etc.) compared to the large farm, the overall carbon footprint per kg FPCM is higher in the former due to the lower milk yields per cow (shown consistently for each GHG in Figure 4). For both farms, the enteric CH4 represents more than 50% of the total emissions. This is consistent with a recent study that quantified 0.99 kg CO2-eq/kg FPCM in the Midwest region, with enteric CH4 representing 43% of these emissions [47]. Feed management strategies and genetics have been explored as potential practices to mitigate enteric CH4. However, the overall reduction is limited, and the implementation of these strategies at the farm level is challenging [9]. Manure management is the second source of emissions with CH4 from storage being the major contributor. Storage of liquid and slurry manure for long periods of time and at warm temperatures provides the ideal conditions for CH4 emissions to occur. A natural crust forming on top of the storage limits these emissions as it creates aerobic conditions on the surface, but manure remains a major source of emissions. The consumption of energy and material inputs represent 16–18% (energy 12–13% and materials 4%) of the total emissions, and the land application of nitrogen fertilizer (manure and synthetic fertilizers) represents 10–13% of GHGs in the form of N2O. Most of the energy-related emissions come from liquid fossil fuels used for crop production and fertilizer application, highlighting the need to export electricity to the grid to achieve important GHG emission mitigation goals.
When an AD system was installed at the farm, total GHG emissions were reduced from 45% to 0.5 kg CO2-eq/kg FPCM (17,322 kg CO2-eq/farm/day) in the large base-case, and from 31% to 0.9 kg CO2-eq/kg FPCM (3057 kg CO2-eq/farm/day) in the small base-case farm. At both farms, the installation of an AD system (including solid-liquid separation) achieved higher GHG reductions than a PV system sized to match the biogas-based electricity due to the credits from thermal energy and the reduction of CH4 emissions from manure storage. This trend remains even when credits from thermal energy are not considered, as it is difficult for a small farm to use this available heat. Nearly 40% of the reductions could be attributed to the reduced CH4 from manure storage due to the reduced VS in manure as result of the digestion and separation processes. On the other hand, the digestion process increases indirect N2O emissions from ammonia (NH3) volatilization during manure storage and posterior land application due to the mineralization process that converts part of the organic nitrogen into its inorganic form. In addition to the higher inorganic nitrogen in the digestate, NH3 losses are promoted by the absence of the organic crust formed on the manure storage surface due to reduced TS from the AD and solid-liquid separation process. Moreover, the inexistence of this crust creates anerobic conditions on the manure storage, limiting the reduction of CH4 emissions, while also reducing the direct emissions of N2O that need a mix of both aerobic and anaerobic conditions to occur.
The solar PV systems at both base-case farms were sized to match the electricity produced by the AD systems to conduct a fair comparison between systems, as it is unlikely for a digester to be installed in a farm to process less than the amount of manure produced at that farm. The solar PV systems were sized at 2.7 MW at the large farm and at 0.3 MW at the small farm, with the electricity produced by these systems reducing emissions from 22% to 0.77 kg CO2-eq/kg FPCM (or 24,765 kg CO2-eq/farm/day) and from 16% to 1.1 kg CO2-eq/kg FPCM (or 3687 kg CO2-eq/farm/day), respectively.

3.3. Manure, Land, and Costs to Install AD and PV Systems in the Base-Cases

A comparison of the costs and limiting resources use for the AD (available manure on-farm) and the solar PV system (land footprint) was conducted for both base-case farms (Table 3). In terms of capital costs at the large base-case farm, installing a digester with the capacity to process all produced manure was more economically feasible than installing a solar PV system producing the same electricity output as the AD system. However, the AD system had higher annual operation and maintenance (O&M) costs, bringing the total yearly costs closer to each other. It was assumed that this large dairy farm owned all required land to produce the feed for the herd (2022 Ha), meaning that the solar PV system would require less than 2% of the land. However, large facilities in Wisconsin (>1000 AU) reported, on average, 0.17 Ha/AU of owned land and 0.19 Ha/AU of rented land to produce part of the herd feed, with the rest purchased off-farm [10]. This means that under these circumstances, the PV system would require approximately 10% of the owned land by the farm. As a result, the land available to install a PV system might be limited, where an agrivoltaics system may enable multiple simultaneous land uses.
Contrary to the large base-case farm, a comparison of the annualized costs for the small base-case farm shows that the PV system is more competitive than the AD system for electricity production (Table 3). This is explained by the economies of the scale of AD systems that justify the installation of large digestors at dairy farms (generally processing manure from >1000 cows). On the other hand, solar PV systems are more flexible and modular, allowing lower investment costs for smaller systems. In addition, solar PV systems have lower O&M costs and longer lifespans than AD systems, which is reflected in the annualized cost estimations.

3.4. Adding AD and PV Capacity to Achieve GHG Neutrality

Neither the AD nor the PV systems achieved GHG neutrality at the current capacities, highlighting the need to install an additional renewable energy capacity to reach net zero GHGs at both base-case farms when the benefit of renewable energy production is the only variable considered to do so. In the large base-case farm, the additional costs (capital, operation, and maintenance) needed to achieve GHG neutrality were lower for the AD system than the solar PV system (Table 4). The AD system would require three-times more manure for the GHG emission benefits to offset the carbon footprint of the large dairy farm, which translates to nearly three extra farms of the same size. The solar PV system would require 3.6-times more land (in addition to the land already considered for the 2.7 MW system) to achieve GHG neutrality.
Whereas the costs increase more sharply with the solar PV system as the system size increases, the annualized costs also show that the solar PV system is as competitive as the AD system for the small farm when the target is to achieve GHG neutrality. This is further reinforced by the additional transportation costs that would have to be included in the digester scenario to both obtain the additional manure and to land-apply it at agronomic rates (explanation below). Moreover, the solar PV system makes more economic sense than the AD system in the small base-case per unit of milk produced (kg FPCM) and when analyzing the costs of sizing an AD or a PV system to achieve GHG neutrality in the base-case farms without any renewable energy production (Figure 5). As with milk production, the costs of installing a renewable energy system are higher for smaller dairy farms. In 2017, the cost of producing 1 kg of milk was USD 0.6 for a farm with 50–999 milking cows (comparable to our large base-case), and nearly USD 0.8 for a farm with 100–199 milking cows (comparable to our small base-case) [48,49]. This means that becoming GHG neutral would increase the production cost of the modeled small and large base-cases by 12–17% and 8–12%. Adding such an increase to the cost production would most likely make the farm economics not viable. However, consumers might be able to pay the extra USD 0.05–0.12/kg milk (USD 0.2–0.4/gallon) as they become more aware of their environmental footprint. Moreover, at the current buyback price for renewable electricity in Wisconsin of USD 0.05/kWh [50], the large farm and the small farm would be able to recover all of their investments (USD 0.07/kg FPCM and USD 0.09/kg FPSM, respectively).
The expansion of the AD system will only be feasible if there are existing neighboring farms and if those farms are willing to dispose of their manure. Considering a transportation cost for liquid manure of USD 0.024/gal/mile [51] and the annualized total costs based on a 20-year lifetime for the expanded AD system at the large base-case, it is estimated that extra manure can be transported a maximum distance of 214 km to remain more competitive than solar PV in order to achieve GHG neutrality. However, there is another problem arising from the extra nutrients available in the digestate. These extra nutrients can be either land-applied or transported back to their origin farms. Land application of dairy manure in Wisconsin is generally limited by the phosphorus (P) content due to building of this nutrient in the soil. The amount of P that can be land-applied depends on the type of crop and the soil conditions. If the farm has available unproductive land with clover that can take 120 lb of P2O5 per acre under high yield and low P content in the soil [52] and a P content in the separated liquid digestate of 0.91% on a dry basis, then the farm will need an additional 4748 HA to land apply the digestate. This assumption considers that the P in the separated digestate solids is sold off-farm. Having this extra land might be unfeasible for many farms, and transporting the separated liquid digestate to the origin farms would be the only option. Considering that the overall volume to be transported back is reduced because of the separation process, manure can be transported a maximum distance of 112 km for AD to remain more cost-competitive in relation to solar PV.
These uncertainties and issues associated with managing the extra manure for both small and large dairy farms challenge the feasibility of achieving GHG neutrality by only by producing biogas-based electricity, even for the large farm that achieves economies of scale. The flexibility, low maintenance, and resource availability of solar PV systems make this an interesting technology to achieve the NZI goals set by the U.S. dairy industry. However, AD systems have additional environmental benefits outside GHG emission reductions related to water quality, odor reduction, and nutrient management that need to be realized. As a result, combining AD, to treat manure management and perceive the economies of scale of these systems, with PV systems sized to produce the additional renewable energy to achieve GHG neutrality could be an interesting approach for large farms. On the other hand, small farms could make a better investment by installing solar PV systems to reach NZI goals.
This paper presents a case study to guide both small and dairy farms toward their goals to achieve GHG neutrality with renewable energy production in Wisconsin. Our results are expected to be generally applicable, but the specifics will vary in other parts of the country and world due to differences in dairy farming practices (e.g., composition of rations and associated difference in cropping practices, manure handling methods, etc.) that result in different GHG emissions baselines. Moreover, both GHG estimations and renewable energy production are affected by environmental factors such as solar radiation, temperature, and precipitation. In addition, as the grid becomes decarbonized, the GHG benefits of producing renewable energy for both the PV and AD systems will diminish. However, regardless of location, GHG reduction strategies should also consider changes in management practices (e.g., dairy diets, manure management, improvements in fertilizer application, etc.) to increase the overall resilience of NZI goals in the mid and long term. For example, enteric CH4 emissions can be reduced by improving feed efficiency (e.g., decreasing the content of mature forages, and increasing lipids and fats as feed additives), improving genetics (e.g., improving breeding and cow health), and adopting management practices (e.g., reducing the number of unproductive animals in the heard and cow disease) [53]. Emissions of CH4 from manure storage are another important source of emissions, even after installing an AD system. Additional manure processing, such as solid-liquid separation, can help further reduce these emissions [32]. Moreover, installing manure storage covers can help reduce emissions of CH4 while also reducing NH3 and the related indirect N2O emissions [37]. Kim et al. [9] found that total GHG emissions can be reduced 16% by adopting a cap-and-flare strategy. Nitrous oxide from the application of manure is also an important contributor to GHG emissions. Practices to reduce nitrogen losses from the soils include considering the time of application (e.g., avoid too hot or freezing temperatures, match application with plant uptake), and applying manure and fertilizers at agronomic rates and to growing crops.

4. Conclusions

Greenhouse gas emissions (GHG) and net energy intensity (NEI) were quantified for a modeled large dairy facility in Wisconsin. To achieve GHG neutrality, the installation of anaerobic digestion and solar PV systems was evaluated in terms of resource requirements (i.e., manure and land) and costs. Despite the fact that solar PV is more expensive, there are less variables to consider for its expansion. A larger anaerobic digestion system will require nearly three times the manure to achieve GHG neutrality, with the added complexities of nutrient disposal and transportation costs. On the other hand, a larger solar PV system also requires land that might not be available in dairy systems renting land or importing feed. Co-location of solar PV panels in agricultural soils might be the only option for these types of farms. Agrivoltaics strategies present multiple opportunities, as well as challenges, as solar and vegetation configurations need to be designed jointly to maximize dual output. In addition, this might be more challenging for conventional crops, such as corn and soybean, that require heavy machinery for planting and harvesting. A smaller farm system was also evaluated, where solar PV might be one of the few options to achieve GHG neutrality. Moreover, co-location of solar PV might be easier in smaller farms that maximize grazing as the feeding strategy. Future research on this topic includes evaluating representative farms in other states where farming practices are more intensive, the costs and extension of agricultural land lost to solar PV vs. lost land to housing developments, the GHG benefits under different electric grid fuel sources, and the replacement of transportation fuels instead of electricity with the energy produced on-farm.

Author Contributions

Data collection, LCA modeling, and writing original draft—H.A.A.-V.; writing and supervision—E.C.; funding acquisition and supervision—D.J.R. All authors have read and agreed to the published version of the manuscript.

Funding

This research was funded by the Midwest Rural Energy Council (MREC) and the U.S. Department of Agriculture—National Institute of Food and Agriculture (USDA-NIFA, grant 2021-51106-35492).

Institutional Review Board Statement

Not applicable.

Informed Consent Statement

Not applicable.

Data Availability Statement

Not applicable.

Acknowledgments

The authors would like to express their gratitude to the MREC and the USDA-NIFA that funded the elaboration of this paper.

Conflicts of Interest

The authors declare no conflict of interest.

References

  1. Dairy Management Inc. Dairy Environmental Sustainability. Available online: https://www.usdairy.com/sustainability/environmental-sustainability (accessed on 15 January 2022).
  2. U.S. Environmental Protection Agency (U.S. EPA). Inventory of U.S. Greenhouse Gas Emissions and Sinks: 1990–2019; U.S. EPA: Washington, DC, USA, 2021. Available online: https://www.epa.gov/ghgemissions/inventory-us-greenhouse-gas-emissions-and-sinks-1990-2019 (accessed on 21 January 2022).
  3. The Hartman Group. Reason for Purchasing Sustainable Products. Available online: https://www.hartman-group.com/infographics/98968421/reason-for-purchasing-sustainable-products (accessed on 15 January 2022).
  4. Capper, J.L.; Cady, R.A.; Bauman, D.E. The Environmental Impact of Dairy Production: 1944 Compared with 2007. J. Anim. Sci. 2009, 87, 2160–2167. [Google Scholar] [CrossRef] [PubMed]
  5. Capper, J.L.; Cady, R.A. The Effects of Improved Performance in the U.S. Dairy Cattle Industry on Environmental Impacts between 2007 and 2017. J. Anim. Sci. 2020, 98, skz291. [Google Scholar] [CrossRef] [PubMed]
  6. Muradov, N.Z.; Veziroǧlu, T.N. “Green” Path from Fossil-Based to Hydrogen Economy: An Overview of Carbon-Neutral Technologies. Int. J. Hydrogen Energy 2008, 33, 6804–6839. [Google Scholar] [CrossRef]
  7. Eckard, R.; Clark, H. Potential Solutions to the Major Greenhouse-Gas Issues Facing Australasian Dairy Farming. Anim. Prod. Sci. 2018, 60, 10–16. [Google Scholar] [CrossRef]
  8. De Vivo, R.; Zicarelli, L. Influence of Carbon Fixation on the Mitigation of Greenhouse Gas Emissions from Livestock Activities in Italy and the Achievement of Carbon Neutrality. Transl. Anim. Sci. 2021, 5, txab042. [Google Scholar] [CrossRef]
  9. Kim, D.; Stoddart, N.; Rotz, C.A.; Veltman, K.; Chase, L.; Cooper, J.; Ingraham, P.; Izaurralde, R.C.; Jones, C.D.; Gaillard, R.; et al. Analysis of Beneficial Management Practices to Mitigate Environmental Impacts in Dairy Production Systems around the Great Lakes. Agric. Syst. 2019, 176, 102660. [Google Scholar] [CrossRef]
  10. Aguirre-Villegas, H.A.; Larson, R.A. Evaluating Greenhouse Gas Emissions from Dairy Manure Management Practices Using Survey Data and Lifecycle Tools. J. Clean. Prod. 2017, 143, 169–179. [Google Scholar] [CrossRef]
  11. Uddin, M.E.; Aguirre-Villegas, H.A.; Larson, R.A.; Wattiaux, M.A. Carbon Footprint of Milk from Holstein and Jersey Cows Fed Low or High Forage Diet with Alfalfa Silage or Corn Silage as the Main Forage Source. J. Clean. Prod. 2021, 298, 126720. [Google Scholar] [CrossRef]
  12. Organic Valley. Carbon Positive Dairy Farming. Available online: https://www.organicvalley.coop/why-organic-valley/sustainability/carbon-positive-dairy-farming/ (accessed on 15 January 2022).
  13. Devine, K. An Environmental and Economic Path toward Net Zero Dairy Farm Emissions. In The Markets Institute at World Wildlife Fund; The Markets Institute at WWF: Washington, DC, USA, 2021; Available online: https://www.worldwildlife.org/publications/an-environmental-and-economic-path-toward-net-zero-dairy-farm-emissions (accessed on 21 January 2022).
  14. Aguirre-Villegas, H.A.; Passos-Fonseca, T.H.; Reinemann, D.J.; Armentano, L.E.; Wattiaux, M.A.; Cabrera, V.E.; Norman, J.M.; Larson, R.A. Green Cheese: Partial Life Cycle Assessment of Greenhouse Gas Emissions and Energy Intensity of Integrated Dairy Production and Bioenergy Systems. J. Dairy Sci. 2015, 98, 1571–1592. [Google Scholar] [CrossRef]
  15. Vida, E.; Tedesco, D.E.A. The Carbon Footprint of Integrated Milk Production and Renewable Energy Systems—A Case Study. Sci. Total Environ. 2017, 609, 1286–1294. [Google Scholar] [CrossRef]
  16. Pelletier, N.; Audsley, E.; Brodt, S.; Garnett, T.; Henriksson, P.; Kendall, A.; Kramer, K.J.; Murphy, D.; Nemecek, T.; Troell, M. Energy Intensity of Agriculture and Food Systems. Annu. Rev. Environ. Resour. 2011, 36, 233–246. [Google Scholar] [CrossRef]
  17. Baldini, C.; Gardoni, D.; Guarino, M. A Critical Review of the Recent Evolution of Life Cycle Assessment Applied to Milk Production. J. Clean. Prod. 2017, 140, 421–435. [Google Scholar] [CrossRef]
  18. Sharpe, K.; Heins, B.; Buchanan, E.; Cotter, M.; Reese, M. Electrical Energy Consumption in Four Commercial Midwest Dairy Barns. In 2019 American Dairy Science Association Annual Meeting; Journal of Dairy Science: Cincinnati, OH, USA, 2019; p. 405. [Google Scholar]
  19. Hills, D.J.; Roberts, D.W. Anaerobic Digestion of Dairy Manure and Field Crop Residues. Agric. Wastes 1981, 3, 179–189. [Google Scholar] [CrossRef]
  20. Parsons, A. On-Farm Biogas Production NRAES-20; Northeast Regional Agricultural Engineering Service (NRAES): Ithaca, NY, USA, 1984. [Google Scholar]
  21. Mata-Alvarez, J.; Dosta, J.; Romero-Güiza, M.S.; Fonoll, X.; Peces, M.; Astals, S. A Critical Review on Anaerobic Co-Digestion Achievements between 2010 and 2013. Renew. Sustain. Energy Rev. 2014, 36, 412–427. [Google Scholar] [CrossRef]
  22. Meegoda, J.N.; Li, B.; Patel, K.; Wang, L.B. A Review of the Processes, Parameters, and Optimization of Anaerobic Digestion. Int. J. Environ. Res. Public Health 2018, 15, 2224. [Google Scholar] [CrossRef] [PubMed] [Green Version]
  23. Nasir, I.M.; Mohd Ghazi, T.I.; Omar, R. Anaerobic Digestion Technology in Livestock Manure Treatment for Biogas Production: A Review. Eng. Life Sci. 2012, 12, 258–269. [Google Scholar] [CrossRef]
  24. Li, Y.; Han, Y.; Zhang, Y.; Luo, W.; Li, G. Anaerobic Digestion of Different Agricultural Wastes: A Techno-Economic Assessment. Bioresour. Technol. 2020, 315, 123836. [Google Scholar] [CrossRef]
  25. U.S. EPA—AgSTAR. Data and Trends. Available online: https://www.epa.gov/agstar/agstar-data-and-trends (accessed on 15 January 2022).
  26. Cho, J.; Park, S.M.; Reum Park, A.; Lee, O.C.; Nam, G.; Ra, I.H. Application of Photovoltaic Systems for Agriculture: A Study on the Relationship between Power Generation and Farming for the Improvement of Photovoltaic Applications in Agriculture. Energies 2020, 13, 4815. [Google Scholar] [CrossRef]
  27. Sharpe, K.T.; Heins, B.J.; Buchanan, E.S.; Reese, M.H. Evaluation of Solar Photovoltaic Systems to Shade Cows in a Pasture-Based Dairy Herd. J. Dairy Sci. 2021, 104, 2794–2806. [Google Scholar] [CrossRef]
  28. National Research Council (NRC). Nutrient Requirements of Dairy Cattle: Seventh Revised Edition; The National Academies Press: Washington, DC, USA, 2001.
  29. Myhre, G.; Shindell, D.; Bréon, F.-M.; Collins, W.; Fuglestvedt, J.; Huang, J.; Koch, D.; Lamarque, J.-F.; Lee, D.; Mendoza, B.; et al. Anthropogenic and Natural Radiative Forcing. In Climate Change 2013: The Physical Science Basis. Contribution of Working Group I to the Fifth Assessment Report of the Intergovernmental Panel on Climate Change; Stocker, T.F., Qin, D., Plattner, G.-K., Tignor, M.M., Allen, S.K., Boschung, J., Nauels, A., Xia, Y., Bex, V., Midgley, P.M., Eds.; Cambridge University Press: Cambridge, UK; New York, NY, USA, 2013. [Google Scholar]
  30. The International Dairy Federation (IDF). A Common Carbon Footprint Approach for the Dairy Sector: The IDF Guide to Standard Life Cycle Assessment Methodology; International Dairy Federation: Schaerbeek, Belgium, 2015; Volume 48. [Google Scholar] [CrossRef]
  31. American Society of Agricultural and Biological Engineers (ASABE). Manure Production and Characteristics. ASAE D384.2 MAR2005; ASABE: St. Joseph, MI, USA, 2005. [Google Scholar]
  32. Aguirre-Villegas, H.A.; Larson, R.A.; Sharara, M.A. Anaerobic Digestion, Solid-Liquid Separation, and Drying of Dairy Manure: Measuring Constituents and Modeling Emission. Sci. Total Environ. 2019, 696, 134059. [Google Scholar] [CrossRef]
  33. Aguirre-Villegas, H.A.; Larson, R.A.; Reinemann, D.J. From Waste-to-Worth: Energy, Emissions, and Nutrient Implications of Manure Processing Pathways. Biofuels Bioprod. Biorefin. 2014, 8, 770–793. [Google Scholar] [CrossRef]
  34. U.S. Environmental Protection Agency. Catalog of CHP Technologies; U.S. Environmental Protection Agency: Washington, DC, USA, 2015.
  35. Hashimoto, A.G.; Varel, V.H.; Chen, Y.R. Factors Affecting Methane Yield and Production Rate. In ASAE Paper No. 79-4583; ASAE: St. Joseph, MI, USA, 1979. [Google Scholar]
  36. Jalalzadeh-Azar, A.; Saur, G.; Lopez, A. Biogas Resources Characterization. In 2010 Hydrogen Program Annual Merit Review; National Renewable Energy Laboratory (NREL): Golden, CO, USA, 2010. [Google Scholar]
  37. Rotz, C.A.; Corson, M.S.; Chianese, D.S.; Hafner, S.D.; Jarvis, R.; Coiner, C.U. The Integrated Farm System Model—Reference Manual—Version 4.4, p. 250; United States Department of Agriculture (USDA): Happy Valley, PA, USA, 2018.
  38. Veltman, K.; Rotz, C.A.; Chase, L.; Cooper, J.; Ingraham, P.; Izaurralde, R.C.; Jones, C.D.; Gaillard, R.; Larson, R.A.; Ruark, M.; et al. A Quantitative Assessment of Beneficial Management Practices to Reduce Carbon and Reactive Nitrogen Footprints and Phosphorus Losses on Dairy Farms in the US Great Lakes Region. Agric. Syst. 2018, 166, 10–25. [Google Scholar] [CrossRef]
  39. Sphera Solutions GmbH. GaBi 5 Software-System and Databases for Life Cycle Engineering; Sphera Solutions GmbH: Leinfelden-Echterdingen, Germany, 2022. [Google Scholar]
  40. Lazarus, W.F. Economics of Anaerobic Digesters for Processing Animal Manure. Available online: https://lpelc.org/economics-of-anaerobic-digesters-for-processing-animal-manure/ (accessed on 7 April 2021).
  41. Faulhaber, C.R.; Raman, D.R.; Burns, R. An Engineering-Economic Model for Analyzing Dairy Plug-Flow Anaerobic Digesters: Cost Structures and Policy Implications. Trans. ASABE 2012, 55, 201–209. [Google Scholar] [CrossRef] [Green Version]
  42. Fusi, A.; Bacenetti, J.; Fiala, M.; Azapagic, A. Life Cycle Environmental Impacts of Electricity from Biogas Produced by Anaerobic Digestion. Front. Bioeng. Biotechnol. 2016, 4, 1–17. [Google Scholar] [CrossRef] [PubMed] [Green Version]
  43. Fitzgerald, J.W. Wisconsin Utility Wants to Tax the Sun 24%. PV Magazine. 2019. Available online: https://pv-magazine-usa.com/2019/05/06/wisconsin-utility-wants-to-tax-the-sun-24/ (accessed on 6 February 2022).
  44. Sendy, A. How Long Do Solar Panels Actually Last? Available online: https://www.solarreviews.com/blog/how-long-do-solar-panels-last (accessed on 30 August 2021).
  45. Ong, S.; Campbell, C.; Denholm, P.; Margolis, R.; Heath, G. Land-Use Requirements for Solar Power Plants in the United States Land-Use Requirements for Solar Power Plants in the United States; National Renewable Laboratory: Denver, CO, USA, 2013. [Google Scholar]
  46. Feldman, D.; Ramasamy, V.; Fu, R.; Ramdas, A.; Desai, J.; Margolis, R.U.S. Solar Photovoltaic System and Energy Storage Cost Benchmark: Q1 2020; National Renewable Energy Laboratory (NREL): Golden, CO, USA, 2021. Available online: https://www.nrel.gov/docs/fy21osti/77324.pdf (accessed on 21 January 2022).
  47. Rotz, C.A.; Stout, R.; Leytem, A.; Feyereisen, G.; Waldrip, H.; Thoma, G.; Holly, M.; Bjorneberg, D.; Baker, J.; Vadas, P.; et al. Environmental Assessment of United States Dairy Farms. J. Clean. Prod. 2021, 315, 128153. [Google Scholar] [CrossRef]
  48. U.S. Department of Agriculture Economic Research Service (USDA-ERS). Milk Cost of Production Estimates. Available online: https://www.ers.usda.gov/data-products/milk-cost-of-production-estimates/ (accessed on 6 February 2022).
  49. Tergast, H. Size Matters—Production Costs on US Dairy Farms. Available online: http://www.agribenchmark.org/agri-benchmark/did-you-know/einzelansicht/artikel//size-matters.html (accessed on 6 February 2022).
  50. We Energies. 2021 Customer Generation Rates. Available online: https://www.we-energies.com/services/pdf/customer_generation_rates.pdf (accessed on 6 February 2022).
  51. Regan, K.B.; Andersen, D.S. What Is It Worth? The Economic Value of Manure Testing. Trans. ASABE 2014, 57, 1845–1852. [Google Scholar] [CrossRef] [Green Version]
  52. Laboski, C.A.M.; Peters, J.B. Nutrient Application Guidelines for Field, Vegetable, and Fruit Crops in WI (A2890); University of Wisconsin-Extension: Madison, WI, USA, 2012. [Google Scholar]
  53. Knapp, J.R.; Laur, G.L.; Vadas, P.A.; Weiss, W.P.; Tricarico, J.M. Invited Review: Enteric Methane in Dairy Cattle Production: Quantifying the Opportunities and Impact of Reducing Emissions. J. Dairy Sci. 2014, 97, 3231–3261. [Google Scholar] [CrossRef] [Green Version]
Figure 1. System boundaries of the study (solid lines). Dashed lines define the steps included at the small and large base-case dairy farms, where anaerobic digestion (AD) and solar PV systems were posteriorly added to evaluate the effects on environmental impacts.
Energies 15 01975 g001
Figure 2. Diet composition of the small farm (150 Holstein lactating cows) for lactating and nonlactating cows during the grazing and non-grazing seasons.
Energies 15 01975 g002
Figure 3. Net Energy Intensity (NEI) from the base-case large and small dairy farms (no renewable energy production), the same farms with AD systems (including solid-liquid separation), and the same farms with solar PV systems producing the same electricity than the corresponding AD system.
Energies 15 01975 g003
Figure 4. GHG emissions from the base-case large and small dairy farms (no renewable energy production), the same farms with AD systems (including solid-liquid separation), and the same farms with solar PV systems producing the same electricity than the corresponding AD system.
Energies 15 01975 g004
Figure 5. Capital, operation, and maintenance (O&M), and total annualized costs per unit of milk produced (kg FPCM) of installing an AD or solar PV systems in the small and large base-case farms. Costs consider sizing the AD and PV systems to achieve GHG neutrality in farms without any renewable energy production.
Energies 15 01975 g005
Table 1. Diet composition of the large farm (1000 Holstein lactating cows) for lactating and nonlactating cows grouped into young heifers (1–10 months), growing heifers (11–21 months), and old heifers (>21 months) and dry cows [14].
FeedLactating CowsYoung HeifersGrowing HeifersOld Heifers and Dry Cows
kg of DMI/Animal/Day
Alfalfa silage8.02.016.553.99
Corn silage5.01.775.363.26
Cottonseed2.0---
Corn grain6.60.46--
Soybean meal *0.80.81--
Total22.35.0511.917.25
* Yield for soybeans.
Table 2. Variables considered to estimate energy production from anaerobic digestion.
VariableValueReference
Hydraulic retention time28 days[33]
Generator efficiencyElectric: 35%
Thermal: 50%
[34]
Energy consumed by the digester (of produced energy)Electricity: 17%
Thermal: 20%
[33]
Biogas composition65% CH4
35% CO2
[34]
CH4 production CH 4 = B o     S o HRT     1 K HRT     μ m 1   +   K
CH4 = Methane production rate (volume of gas produced per volume of digester per day, L/L/day); Bo = Ultimate methane yield per gram of volatile solids added (L/g/VS); HRT = Hydraulic retention time (days); So = Influent volatile solids concentration (g/L); µm = Bacterial growth rate (per day, µm = 0.013 × T − 0.129); T = Temperature of the digester (°C); K = kinetic parameter [dimensionless, K = 0.8 + 0.0016 × exp(0.06 × So)]
[35]
Lower heating value of CH436 MJ/m3[36]
VS destruction30%[37]
Increase in ammoniacal nitrogen after digestion15%[32]
CH4 leaks from digester1.0%[38]
Table 3. Manure, land, and costs required to install an AD system and a solar PV system to produce electricity at both base-case farms.
Resources UseBase-Case LargeBase-Case Small
ADSolar PVADSolar PV
Manure (ton/day)93NA14NA
Area (HA)NA34NA3
Capital costs (US$ total)1,734,3284,116,216498,322494,291
O&M (US$/year)98,12050,66756,7005222
Total costs (US$/year)184,836215,31681,61624,993
Table 4. Additional (only related to AD and PV capacity expansion) costs, area, and manure for the AD and solar PV systems needed to achieve GHG neutrality in the base-case farms.
Additional Resources Use for GHG NeutralityBase-Case LargeBase-Case Small
ADSolar PVADSolar PV
Manure (ton/day)282NA47NA
Area (HA)NA125NA19
Capital costs (US$ total)3,058,96111,747,8081,044,6932,528,318
O&M (US$/year)246,609166,74075,00926,709
Total costs (US$/year)399,557636,652127,244127,842
Publisher’s Note: MDPI stays neutral with regard to jurisdictional claims in published maps and institutional affiliations.

