Article

Fractional Composition Analysis for Upgrading of Fast Pyrolysis Bio-Oil Produced from Sawdust

1
Research Institute of Future Technology, Korea Petroleum Quality & Distribution Authority, Cheongju 28115, Korea
2
Department of Environmental Engineering, Korea University, Sejong 30019, Korea
3
Daekyung ESCO, Incheon 21984, Korea
*
Authors to whom correspondence should be addressed.
Energies 2022, 15(6), 2054; https://doi.org/10.3390/en15062054
Submission received: 18 February 2022 / Revised: 8 March 2022 / Accepted: 10 March 2022 / Published: 11 March 2022

Abstract

:
We can prevent climate change by reducing greenhouse gas (GHG) emissions caused by fossil fuel usage through introducing alternative fuels such as bio-oil. The fast pyrolysis process used for wood materials has recently gained substantial attention as an approach to produce bio-oil worldwide and in Korea as well. Bio-oil from fast pyrolysis contains highly oxygenated compounds and phenolics, thereby requiring upgrading processes, such as deoxygenation and condensation, for high-end use. To determine an efficient upgrading method for fast pyrolysis bio-oil (FPBO), one needs to elucidate its composition and classify it into chemical groups. We analyzed the composition of fractionized FPBO toward high-end use. FPBO was separated into two layers by adding distilled water: (a) the water-soluble phase, and (b) the oil phase, whereas liquid-liquid extraction and multi-step separation were applied for fractionization, respectively. The fractions were obtained, and their chemical groups were analyzed by gas chromatography time-of-flight mass spectrometry (GC×GC-TOF/MS). The water phase was separated into two fractions and classified into the main chemical groups of phenolics (9%) and heterocyclics (31%). The oil phase, which was separated into four fractions, was classified into the main chemical groups of phenolics (32%) and heterocyclics (23%). Our findings can help to upgrade products for high-end use.

1. Introduction

Many countries around the world are currently actively implementing long-term plans, including carbon neutrality policies, until 2050 to fight climate change caused by greenhouse gas (GHG) emissions [1]. Biofuels are characterized by lower GHG emissions and cause less air pollution, such as NOx, than fossil fuels. Given the threat of global climate change, biofuels are currently emerging as an alternative energy source [2]. Furthermore, the main raw materials, such as corn, wood, and algae, can all absorb carbon during biofuel production. Therefore, biofuels are suitable as a solution toward carbon neutrality. Meanwhile, corn and palm oil, which account for most of the bio-oil production, exacerbate environmental pollution during cultivation [3]. Therefore, it is necessary to diversify raw materials by making biofuels using low-cost materials, such as waste wood [4]. In particular, biofuel consumption will be intensified because it is challenging to replace large combustion-engine fuels, such as marine and aviation fuels, with alternative fuels. For marine fuel, the International Maritime Organization regulations enforce the reductions of pollutant emissions from seas by 50% by 2050. Hence, ammonia, natural gas ships, and biofuels that can be used for scrubbers are also being considered as advantageous environmental solutions [5]. The International Air Transport Association policy is promoting the use of sustainable fuel made from low-carbon stock biomass to use as aviation fuel. They have established the goal for reducing carbon dioxide emissions by 50% by 2050, relative to 2005 levels [6].
Overall, it is necessary to produce wood-biomass-derived biofuels, as well as existing biofuels derived from agricultural and algal biomass [7]. Nowadays, there are numerous physicochemical processes for converting wood biomass to biofuel, and the pyrolysis process, which is a thermochemical conversion method, is a widely used pretreatment for biofuels [8]. Lignocellulosic biomass consists of 35–50% cellulose, 20–35% hemicellulose, and 10–25% lignin, along with protein, fiber, and glucose. The ratios of these compositions differ for each wood species [9]. For instance, hardwood and softwood contain more cellulose than other components. However, straw and grasses contain large amounts of hemicellulose. Cellulose chains have parallel alignment and crystallin structure, coupled with the van der Waals forces and hydrogen bonds, while hemicellulose chains are polymers that have intertwined short chains, and lignin contains polymers of phenolic compounds [10].
Given their structural characteristics (they are commonly composed of complex and molecular structures), they must be disrupted via pretreatment processes, such as pyrolysis, which can easily convert them. Initially, biomass was converted to fuel by fermentation or hydrolysis to produce ethanol and methanol. Although these pretreatment processes are effective for celluloses or sugars, their use for lignin and hemicelluloses is currently limited because of high energy consumption and production of inhibitory compounds such as phenolics and furans [11]. To convert to fuel by utilizing lignin and hemicelluloses, a pyrolysis pretreatment that can be done for cracking polymer components is utilized as well.
Pyrolysis is classified into slow, fast, and flash types, which are distinguished by the reaction time and temperature in the absence of oxygen [12]. In particular, fast pyrolysis can maximize the liquid yield at 450–550 °C under anaerobic conditions for 1–5 s, which is a short reaction time. Subsequently, the products are separated from the cyclone process and cooling condensation [13]. The pyrolysis process conditions affect the product yields, including volatile gas, char, and oil. The rate of production depends on biomass mass, activation energy, and temperature. The activation energy is associated with the type of biomass. Of the reactors used for pyrolysis, such as rotary, rotating cone, and fluidized bed reactors, fluidized bed reactors were used in this study to produce fast pyrolysis bio-oil (FPBO) [14]. In particular, FPBO produced by this type of reactor consists of 10% char, 15% gas, and 75% oil [15].
FPBO is produced with low-quality fuel because of its high-water content, acid number, viscosity, and low net calorific value. Therefore, an upgrading process is essential for the use of bio-oil as an advanced fuel or chemical product. In this context, upgrading processes such as hydrodeoxygenation and decarboxylation are required to remove the oxygen content in FPBO. Moreover, processes such as isomerization and hydrocracking are necessary to adjust the carbon number to that of general petroleum fuel (gasoline carbon number 5–12, jet fuel carbon number 8–16, diesel carbon number 14–23). For these processes, bio-oil compound information is needed to select the optimal catalysts. In this way, one can reduce coking and catalyst deactivation, which disrupts the upgrading process [16].
FPBO is easily fractionated into water and oil phases, which can be the solubilizing effect of other polar hydrophilic compounds because of increasing total water content. The water phase mainly consists of low molecular and high reactivity compounds, which were used as a raw material to produce hydrocarbons, alcohols, and olefins [17]. The study of the oil phase is limited because of its complexity, but many aromatics, phenols, and guaiacols contained therein can also be used through extraction. Therefore, multiple steps of liquid-liquid extraction are a potential method for extracting such FPBO [18]. Most existing analytical studies have focused on the water phase of FPBO [19,20], which contains numerous low-molecular compositions such as ketones and acids that are easily available for upgrading processes. However, it is still challenging to directly upgrade the oil phase because of its many complex and unusable compositions [21]. Due to this, it is important to accurately fractionate them and to obtain the accurate information.
In general, gas chromatography-mass spectrometry (GC-MS) analysis is used to obtain composition information, but it is still difficult to isolate distinct chromatographic peaks for compounds with complex structures because of low resolution. Therefore, gas chromatography time-of-flight mass spectrometry (GC×GC TOF/MS) with high resolution is sometimes utilized to minimize the overlapping of chromatographic peaks [22].
These advantages of GC×GC TOF/MS enable the analysis of the chemical compositions of both the water phase and the oil phase of FPBO. Note that it is more challenging to analyze the latter phase than the water phase for the upgrading process. However, GC×GC TOF/MS-based composition analysis has not yet been applied to FPBO for a wide spectrum of water and oil phases. One can introduce a comprehensive approach to composition analysis of FPBO, thereby extending the options of the FPBO upgrading process, by identifying useful chemical compositions in both the water and oil phases.
This study aims to clarify the composition of FPBO to efficiently upgrade them to advanced fuels. To this end, complex compositions of both water-soluble and water-insoluble phases of FPBO to liquid-liquid extraction were comprehensively analyzed using GC×GC TOF MS, which can do a more detailed analysis than GC-MS used for other previous studies.

2. Materials and Methods

2.1. Materials and Reagents

In this study, we used FPBO made from sawdust in a plant-scale (20 tons/day) circulating fluidized bed reactor in Korea [14]. This process is suitable for large-scale plants because it features a high mass transfer rate, and high heat transfer rate from gas to solid, while also being easy to control. The FPBO was obtained from a circulating fluidized bed reactor operating at 450 °C with the feeding rate of 100 kg/h (sawdust with an average particle size of 0.7 mm). Subsequently, the FPBO underwent a recovery process consisting of two cooling chambers and an electric precipitator. We analyzed the sample before fractionizing the bio-oil by using EN 16900 (fast pyrolysis bio-oils for industrial boilers) [23]. It measured the net calorific value on a wet basis, water content, pH, density at 15 °C, pour point, nitrogen content, kinematic viscosity at 40 °C, sulfur content, solid content, ash content, heavy metals (Na, K, Ca, Mg), and elemental ratio (carbon:hydrogen:oxygen). The solvents used in liquid-liquid extraction were chloroform (CHCl3, guaranteed reagent, Dejeongchem) and petroleum ether (guaranteed reagent, Dejeongchem). The reagents used in the multi-step separation were 1 N NaOH solution (guaranteed reagent, Dejeongchem), 1 N HCl solution (guaranteed reagent, Dejeongchem), and dichloromethane (CH2Cl2, guaranteed reagent, Dejeongchem). As well, acetone (C3H6O, guaranteed reagent, Dejeongchem) and methanol (CH3OH, guaranteed reagent, Dejeongchem) were used as the washing solvents.

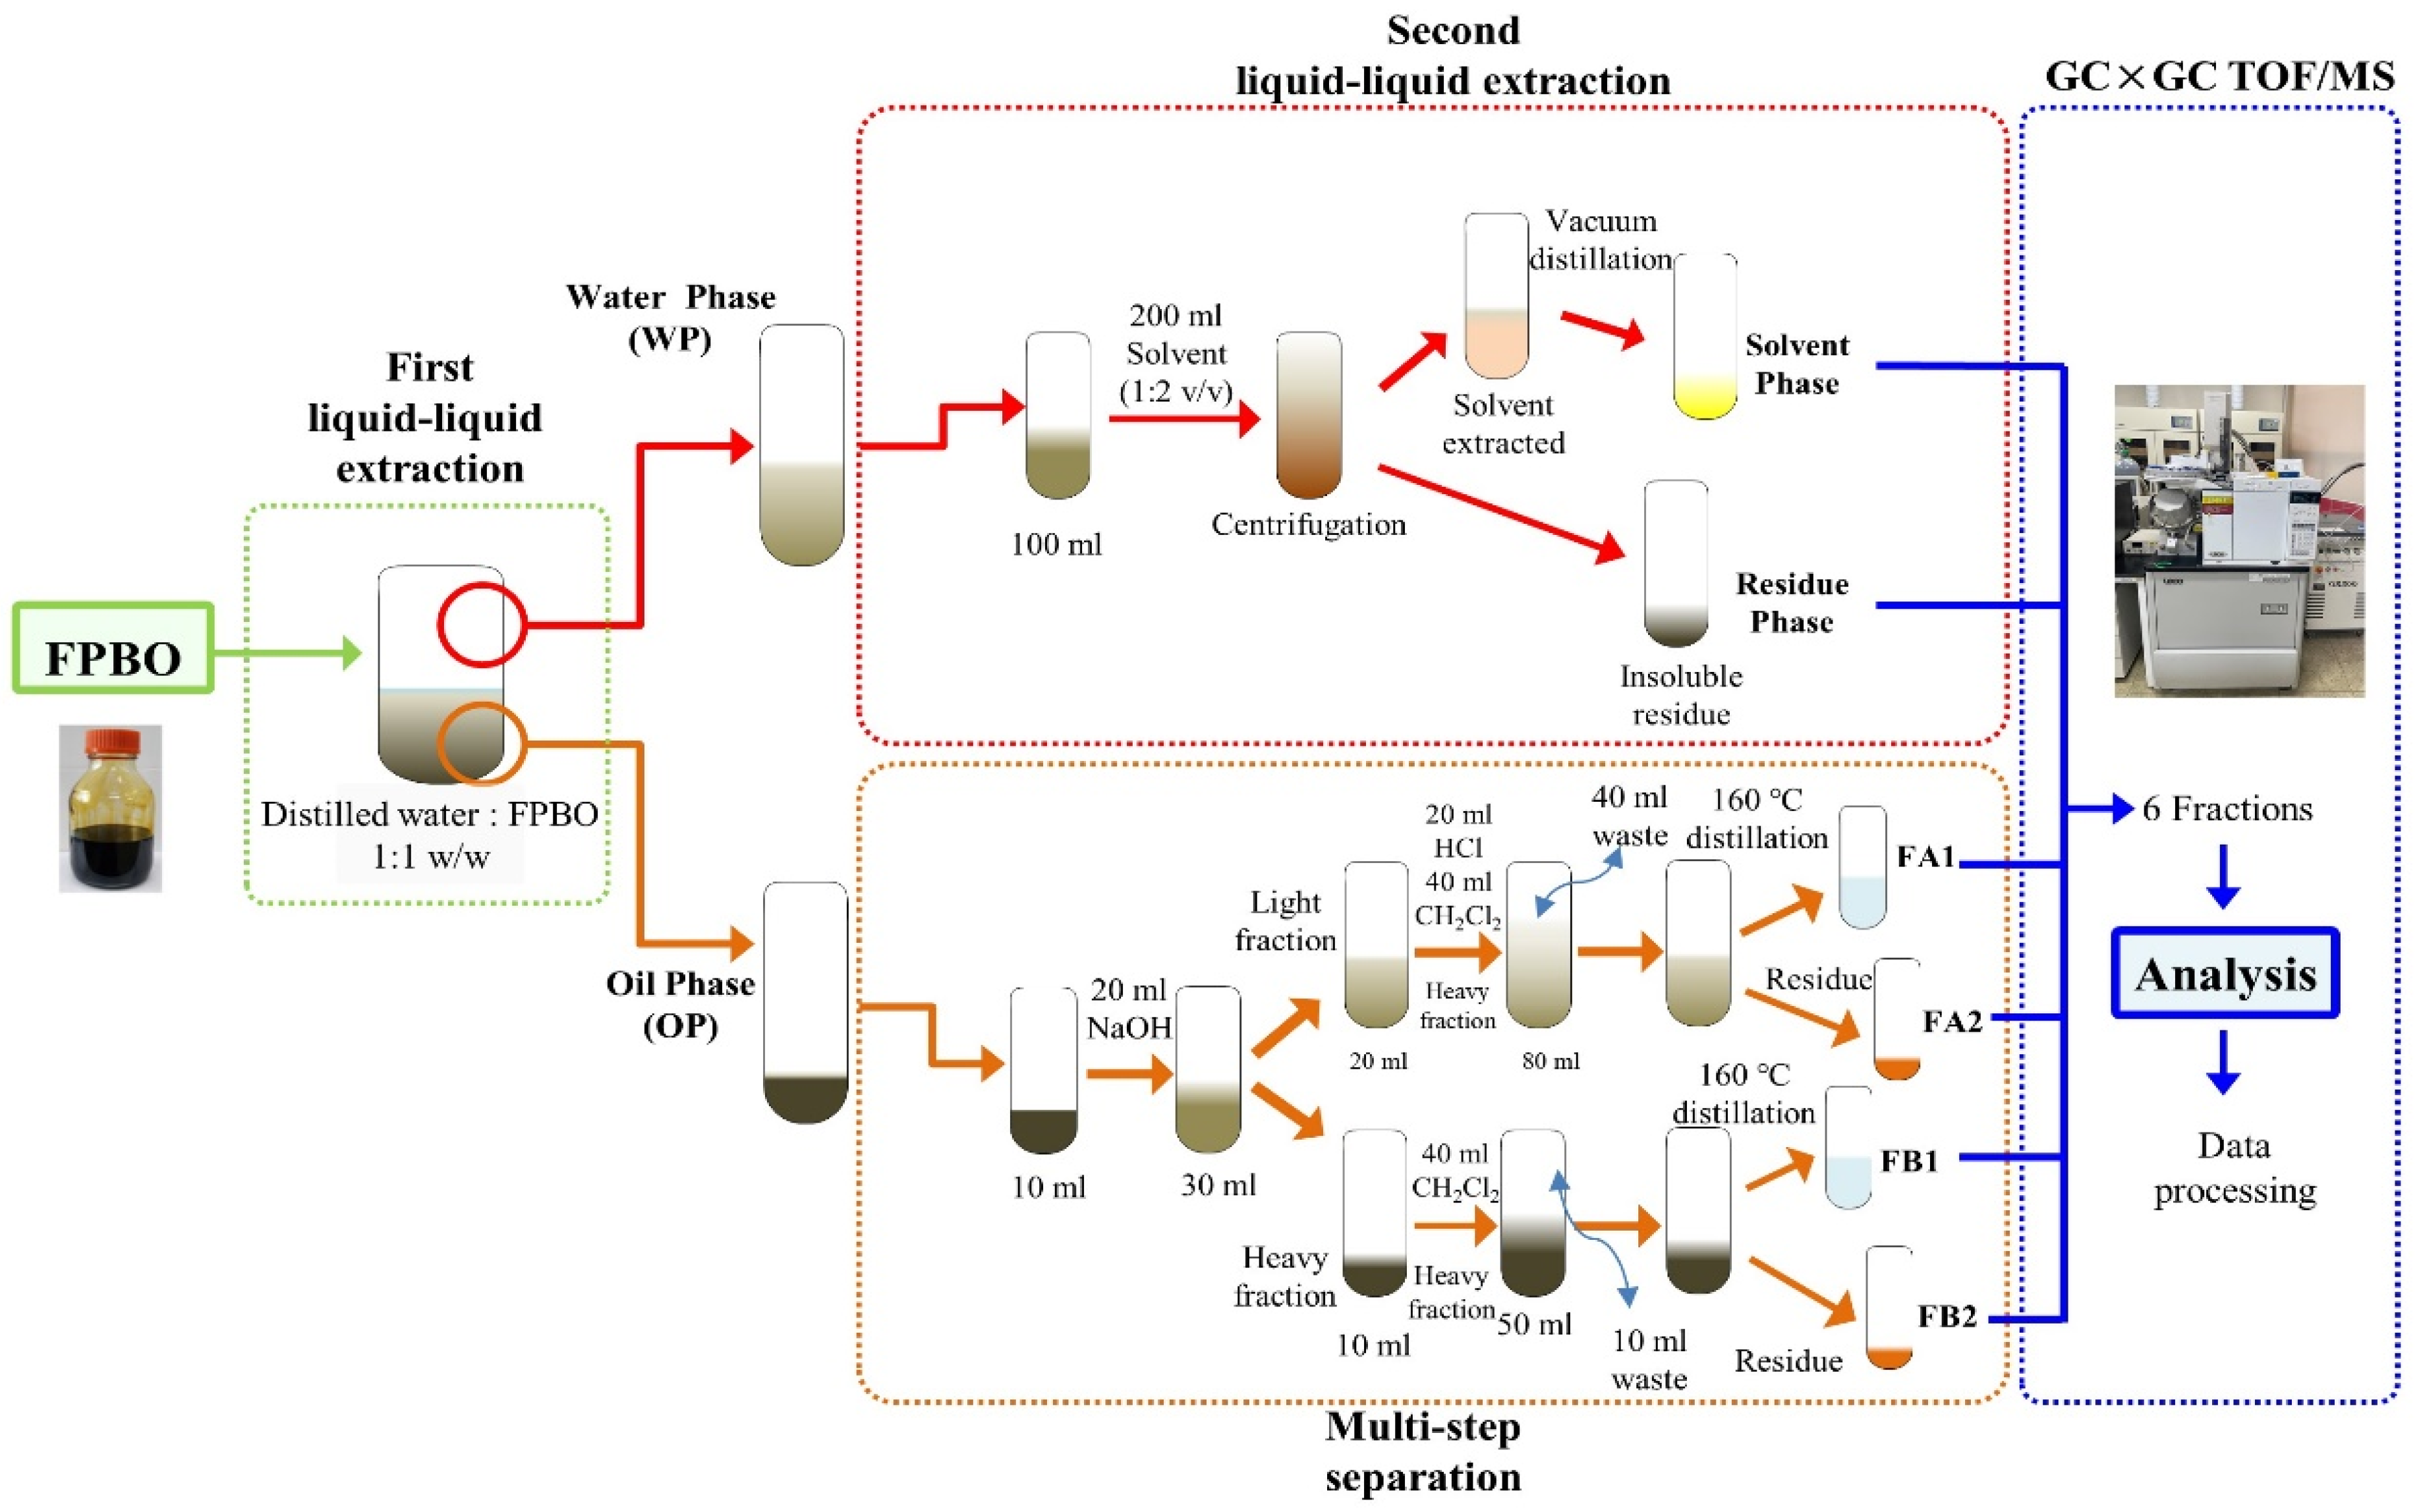
2.2. Liquid-Liquid Extraction

First, FPBO and distilled water were mixed in the same weight ratio. The mixed oil was then placed in a centrifugation tube and stirred for 30 min, and then centrifuged at 1000× g rpm for 10 min to separate the water and oil phases. Next, 100 mL of the water phase were taken from the centrifugation tube and added to 200 mL of solvent (ether or chloroform) in a separatory funnel, stirred for 30 min, and stored for 24 h. Then, the water phase that was insoluble in the solvent, called the residue and solvent phases, was separated using a Venturi tube below the funnel. The solvent was further extracted from the solvent phase by vacuum distillation (at a pressure range of 415–350 Torr and 30 °C for ether and at a pressure of 150 Torr and 35 °C for chloroform) [24].

2.3. Multi-Step Separation

Furthermore, the multi-step separation was conducted for the oil phase from the FPBO. First, 20 mL of 1 mol/L NaOH solution were added to 10 mL oil phase and the mixture was stirred for 30 min. Then, the mixture was separated into ~20 mL of the light fraction and ~10 mL of the heavy fraction by centrifugation at 1000× g rpm for 10 min. Next, 20 mL of 1 mol/L HCl and 40 mL of CH2Cl2 were added to the light fraction for neutralization. The sample was then separated into two layers after a few minutes, and the upper layer was removed. The remaining lower layer underwent atmospheric distillation at 160 °C to remove CH2Cl2. The distillation sample is denoted as FA1, and the residue sample is denoted as FA2. Subsequently, 20 mL of CH2Cl2 were added to the heavy fraction. Likewise, the sample was naturally separated into two layers after a few minutes, and the upper layer was removed. The remaining lower layer underwent atmospheric distillation at 160 °C to remove CH2Cl2. The distillation sample is referred to as FB1 and the residue sample is called FB2 [25]. The details of the fractional processes of the samples are shown in Figure 1 and process yields are shown in Table 1

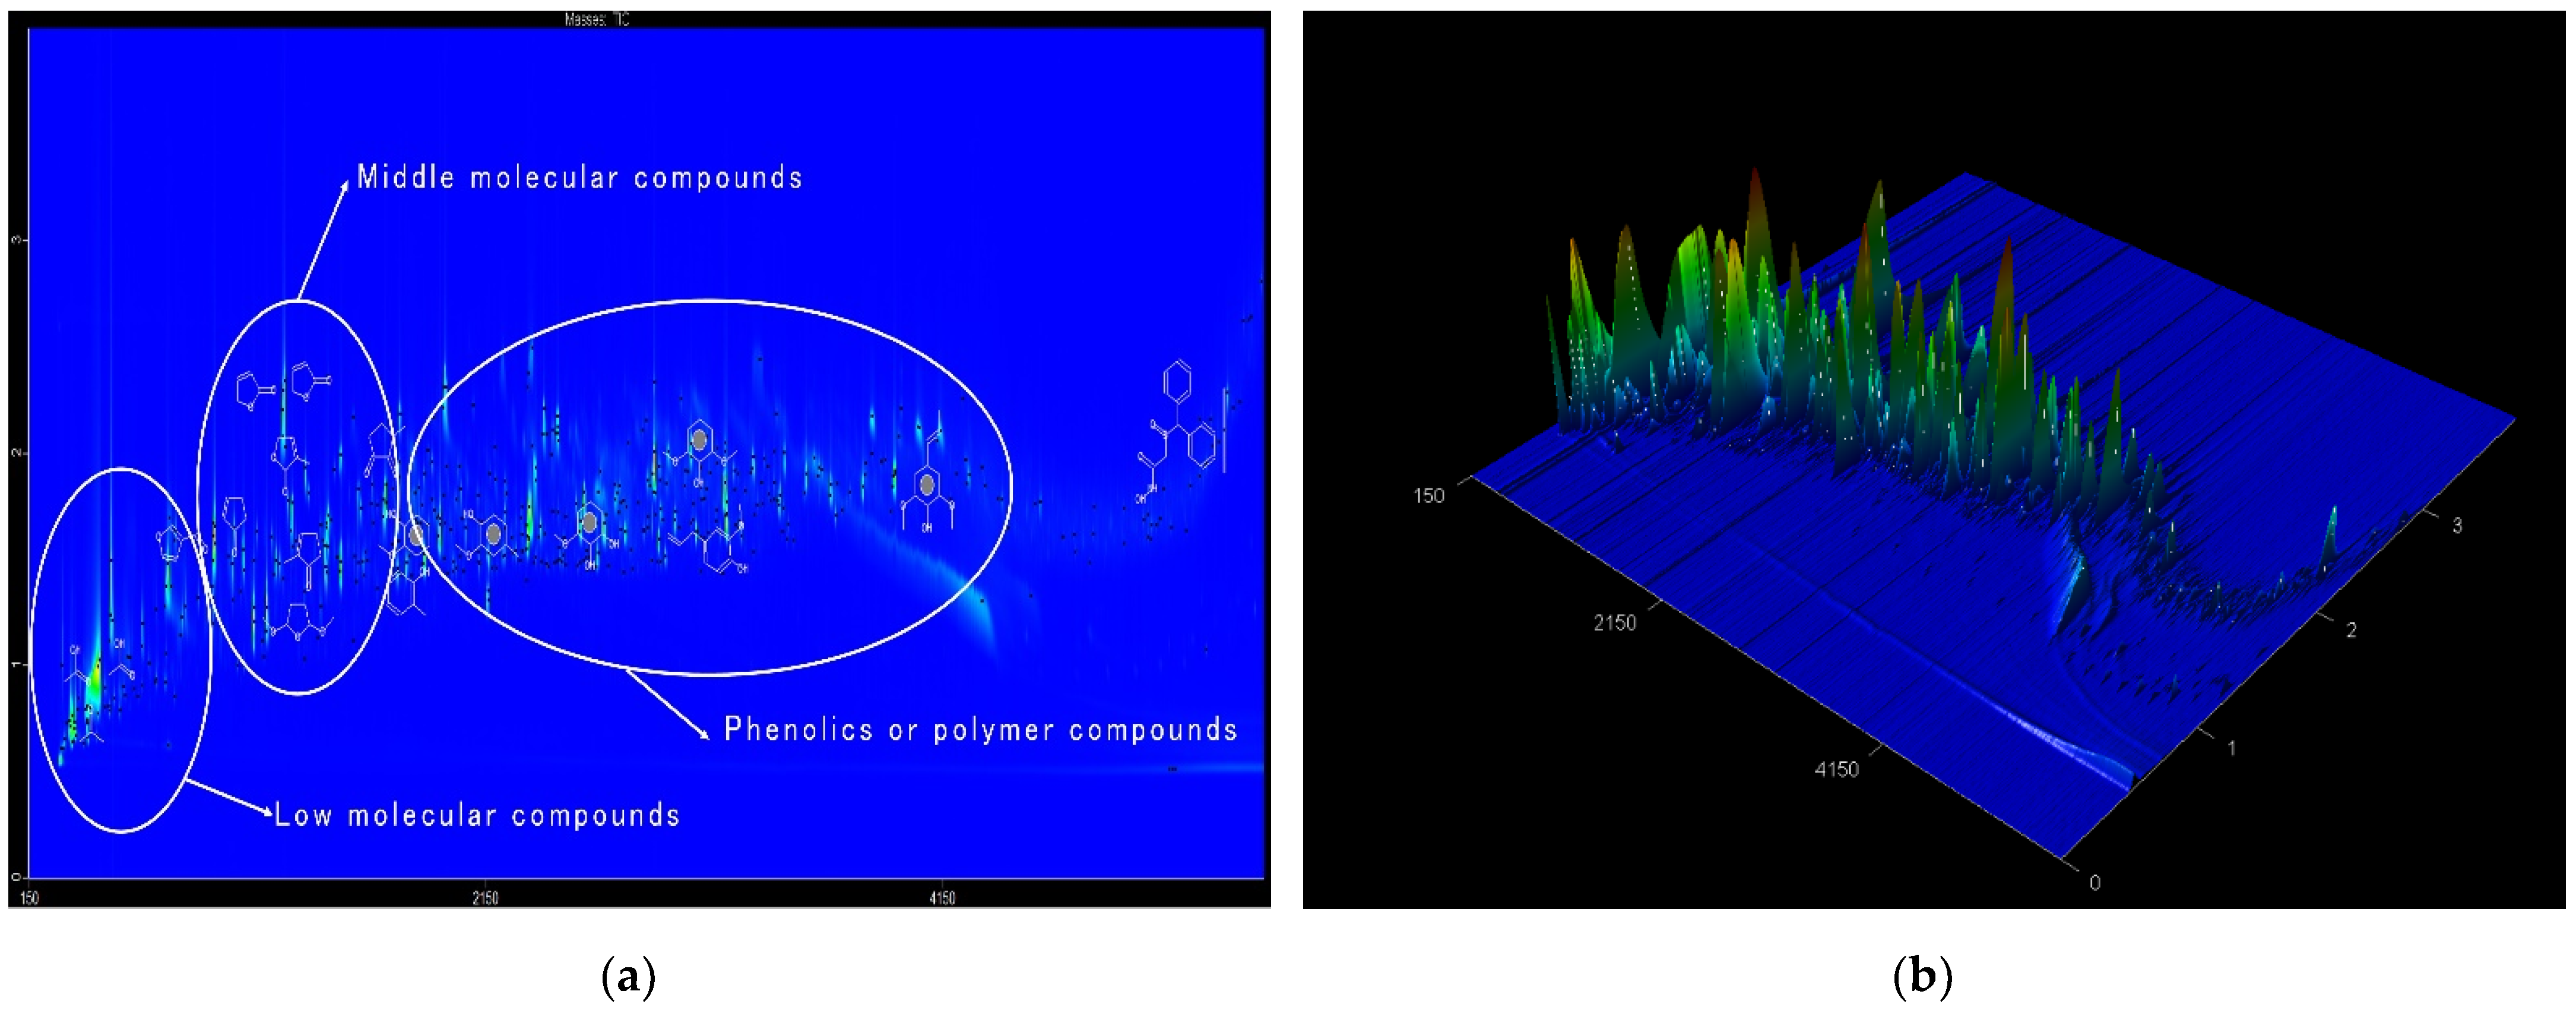
2.4. GC×GC TOF/MS for Composition Analysis

In this study, the composition of fractionated FPBO, which was placed in a 2 mL vial, was determined by GC×GC TOF/MS with a modulator, secondary oven, and mass detector (Pegasus-IV system, LECO Co., Ltd., Saint Joseph, MI, USA) [26]. In general, GC×GC TOF/MS separates the compositions of a sample in the primary column in GC by producing vaporized flow, and then condenses the separated compositions in two steps by using a cryogenic system for a slow-down. At the final step, it separates them again in the secondary column. Interestingly, it is possible to separate compositions that are not separated in the primary column to maintain an efficient resolution and high sensitivity by applying this process [23]. To this end, gas chromatography (7980A, Agilent Co., Ltd., Santa Clara, CA, USA) was used with an HP-5 column (60 m × 0.25 mm inner diameter × 0.25 μm film thickness, maximum temperature 320 °C) in this study. GC×GC TOF/MS was programmed to set the purge flow at 3 mL/min, split ratio 50:1, split flow 200 mL/min, oven temperature from 40 °C to 280 °C, ion source temperature 230 °C, mass range 35–650, and acquisition rate (spectra/second) 200.
The atomic mass and spectrum of compounds measured by GC×GC TOF/MS are matched with the most probability and similarity chemical components in the library. Through the library, 10 chemicals with the closest similarity to 999 are selected, and the compound with the closest probability to 9999 is finally matched. The detection signal of each chemical compound is expressed as an area, through which the composition ratio of FPBO can be calculated. The component ratio for an unknown compound can be calculated by Equation (1):
R x = A x A t × 100 % ,    
where Rx is the area ratio of unknown chemical components (%), Ax is the peak area of unknown chemical components (mV), and At is the sum of peak areas of all matched chemical components (mV).
These matched chemical components are classified into structurally similar chemical groups, which are classified into phenolics, oxygenated heterocyclics, alcohols, carboxylic acids, esters, ethers, ketones, aldehydes, other oxygen groups, and aliphatic groups most commonly found in pyrolysis oil. All of these processes were identified by comparing spectral data from the National Institute of Standards and Technology data library and the Wiley data library to Microsoft Excel and LECO Pegasus 4D workstation software.

3. Results and Discussion

3.1. Properties of FPBO

In this study, we used the FPBO produced from sawdust. Table 2 shows the properties of sample FPBO compared with those of EN 16900 [21], which represent the requirement standard for boiler fuel, as well as comparison with ASTM D975 and ASTM D1655, which represent requirements for advanced fuels such as diesel and aviation fuel [27,28]. Based on the requirement standards, it can be confirmed that the properties of FPBO make it suitable for use as boiler oil. However, its higher water content, lower net calorific value, higher water content, lower kinematic viscosity, and lower pour point make it unsatisfactory for use as transportation fuel. The inferior characteristics are driven by the following phenomenon—20% of low-quality quencher oil is produced as a by-product during the fast pyrolysis process, which is characterized by high water, solid, and ash content [29]. Therefore, it is necessary to upgrade the FPBO for high-end use.

3.2. FPBO Compositions

In this study, FPBO was analyzed and the fractionated water and oil phases were analyzed. In addition, the composition of two fractions for each two solvents in the aqueous phase and four fractions in the oil phase were analyzed. Through GC×GC TOF/MS analysis, FPBO has 499 peaks, the water phase (WP) has 492 peaks, the oil phase (OP) has 497 peaks, the sample extracted with chloroform (LLE CH solvent) has 400 peaks, insoluble residues after the chloroform extraction (LLE CH residue) have 80 peaks, insoluble residue after the chloroform extraction (LLE CH residue) has 400 peaks, insoluble residue after ether extraction (LLE ET residue) has 125 peaks, FA1 has 13 peaks, FA2 has 125 peaks, FB1 has 28 peaks, and FB2 has 184 peaks that were matched as compounds, and the area ratio was calculated for each peak through Equation (1).
When FPBO was analyzed by using GC×GC TOF/MS, 499 peaks, signifying different compounds, were identified. Note that GC×GC TOF/MS can be used for the clear distinction of peaks, compared with GC-MS. Namely, the peaks (z-axis) that are not discernible at a retention time (x-axis) are stretched on the additional TOF axis (y-axis) for clearer identification (see a chromatogram in Figure 2 for details).
As seen from the chromatogram, low-molecular-weight compounds such as formic acid, methyl ester, and ethanol are in the front of the chromatogram, middle molecular compounds such as 3-furaldehyde are in the middle of the chromatogram, and phenolic compounds or polymer compounds, such as phenol and carinol, derived from the large aromatic polymer of lignin and glucose contained in cellulose, are at the end of the chromatogram.
The main compounds in FPBO are listed in Table 3. Specifically, ~14% is acetic acid, which adversely affects the catalytic reforming, and about 13% is levoglucosan arising from the pyrolysis of carbohydrates such as starch and cellulose [30], and the remaining compounds are all within 2%.
Although the analysis of FPBO by using GC×GC TOF/MS is useful, it could not provide a complete description of the compositional distribution because of the undiscernible clusters of peaks. Therefore, a more detailed analysis is necessary through the fractionization of FPBO first to the water and oil phases.
Fundamentally, FPBO dissolved in water, called the water phase, and undissolved FPBO in water, called the oil phase, were separated from each other by liquid-liquid extraction. Figure 3 shows that FPBO was clearly fractionated into a water phase and an oil phase through liquid-liquid separation. The components with a light fraction (carbon number < 6) were fractionated in the water phase. In particular, it contained oxygen group compounds, sugars, and phenols, which can be applied to produce high-end fuels through deoxidation. In the oil phase, numerous components were fractionated into a heavy fraction (carbon number > 12). The GC×GC TOF/MS analysis revealed 492 peaks in the water phase and 497 peaks in the oil phase, thereby confirming our predictions that more precise compound analysis would be achieved.
Furthermore, hundreds of compounds were further classified into chemical groups, such as phenolics, oxygenated heterocyclics, alcohols, carboxylic acids, esters, ethers, ketones, aldehydes, other oxygen groups, and aliphatic groups. This classification indicated that the chemical composition of FPBO was composed 32% of phenolics, 33% of oxygenated heterocyclics, 20% of carboxylic acids, 6% of ketones, 3% of aldehydes with which celluloses or sugars can make coke [31], and within 1% of esters and alcohols, which are chemical groups that are easily upgradable [32].
Figure 4 shows the results from the composition analysis of the water and oil phases of the FPBO, expressed as chemical group percentages. The chemical compositions of the WP were found to be < 10% of phenolics, 32% of oxygenated heterocyclics, and ~17% of carboxylic acids. As for a single compound, 12% of levoglucosan, 9% of acetic acid, 8% of guanidine, which were used as a fuel indicator for biomass, and 5% of 2-propanone were extracted. At the same time, OP exhibited a water content of ~24%, which is ~5% lower, compared with FPBO and ~58% of organic materials. The main components of OP were found to be 39% phenolics, such as creosol, 23% of oxygenated heterocyclics, such as furan-3-carboxaldehyde, 9% of carboxylic acids, such as acetic acid, 12% of ketones, such as 2-propanone, 1-hydroxy-, and 8% of other compositions.
The GC×GC TOF/MS analysis revealed that phenolic content was remarkably higher in the oil phase than in the water phase. Both layers featured the most major compounds, which required further fractionation for more desirable separation of useful compositions to upgrade for high-end use [33]. On this basis, the water-phase FPBO was further fractionated into two fractions by liquid-liquid extraction by using two solvents, and the oil-phase FPBO was fractionated into four fractions by multi-step separation.

3.3. Compositions from Liquid-Liquid Extraction of WP

Furthermore, liquid-liquid extraction (LLE) was performed by using two solvents, chloroform and ether, to fractionate WP. Note that chloroform extraction can be used to effectively extract aromatics and phenolics from cellulose and sugars. Furthermore, ether extraction can effectively reduce coke formation and catalyst deactivation [34]. The two solvents are known to have the most efficient yields at a solvent-to-liquid ratio of 2:1, and although the yields of extraction are generally similar, their compositions can differ [25].
The compositions of the chemical groups in the WP and liquid-liquid extraction fractions are shown in Figure 5.
Our findings are summarized in this section. First, LLE CH solvent was estimated to contain 31% of phenolics, which is difficult to upgrade, and 34% of oxygenated heterocyclics such as 2(5H)-furanone and furfural. LLE CH residues were found to be 49% of carboxylic acids, such as acetic acid, which can be converted to alcohol through esterification. Second, LLE ET solvent was shown to contain 33% of phenolics, thus, higher than the one in LLE CH solvent, and 5% of aldehydes such as 1,2-benzendiol and methylglyoxal. LLE ET residues were estimated to be constituted by 38% of sugar and guanidine, which are wood-derived compounds [35]. Notably, liquid-liquid extraction with chloroform was proven to be effective in extracting oxygenated heterocyclic compounds and phenolics remaining in WP. However, most carboxylic acids remained in the residues after the chloroform extraction.

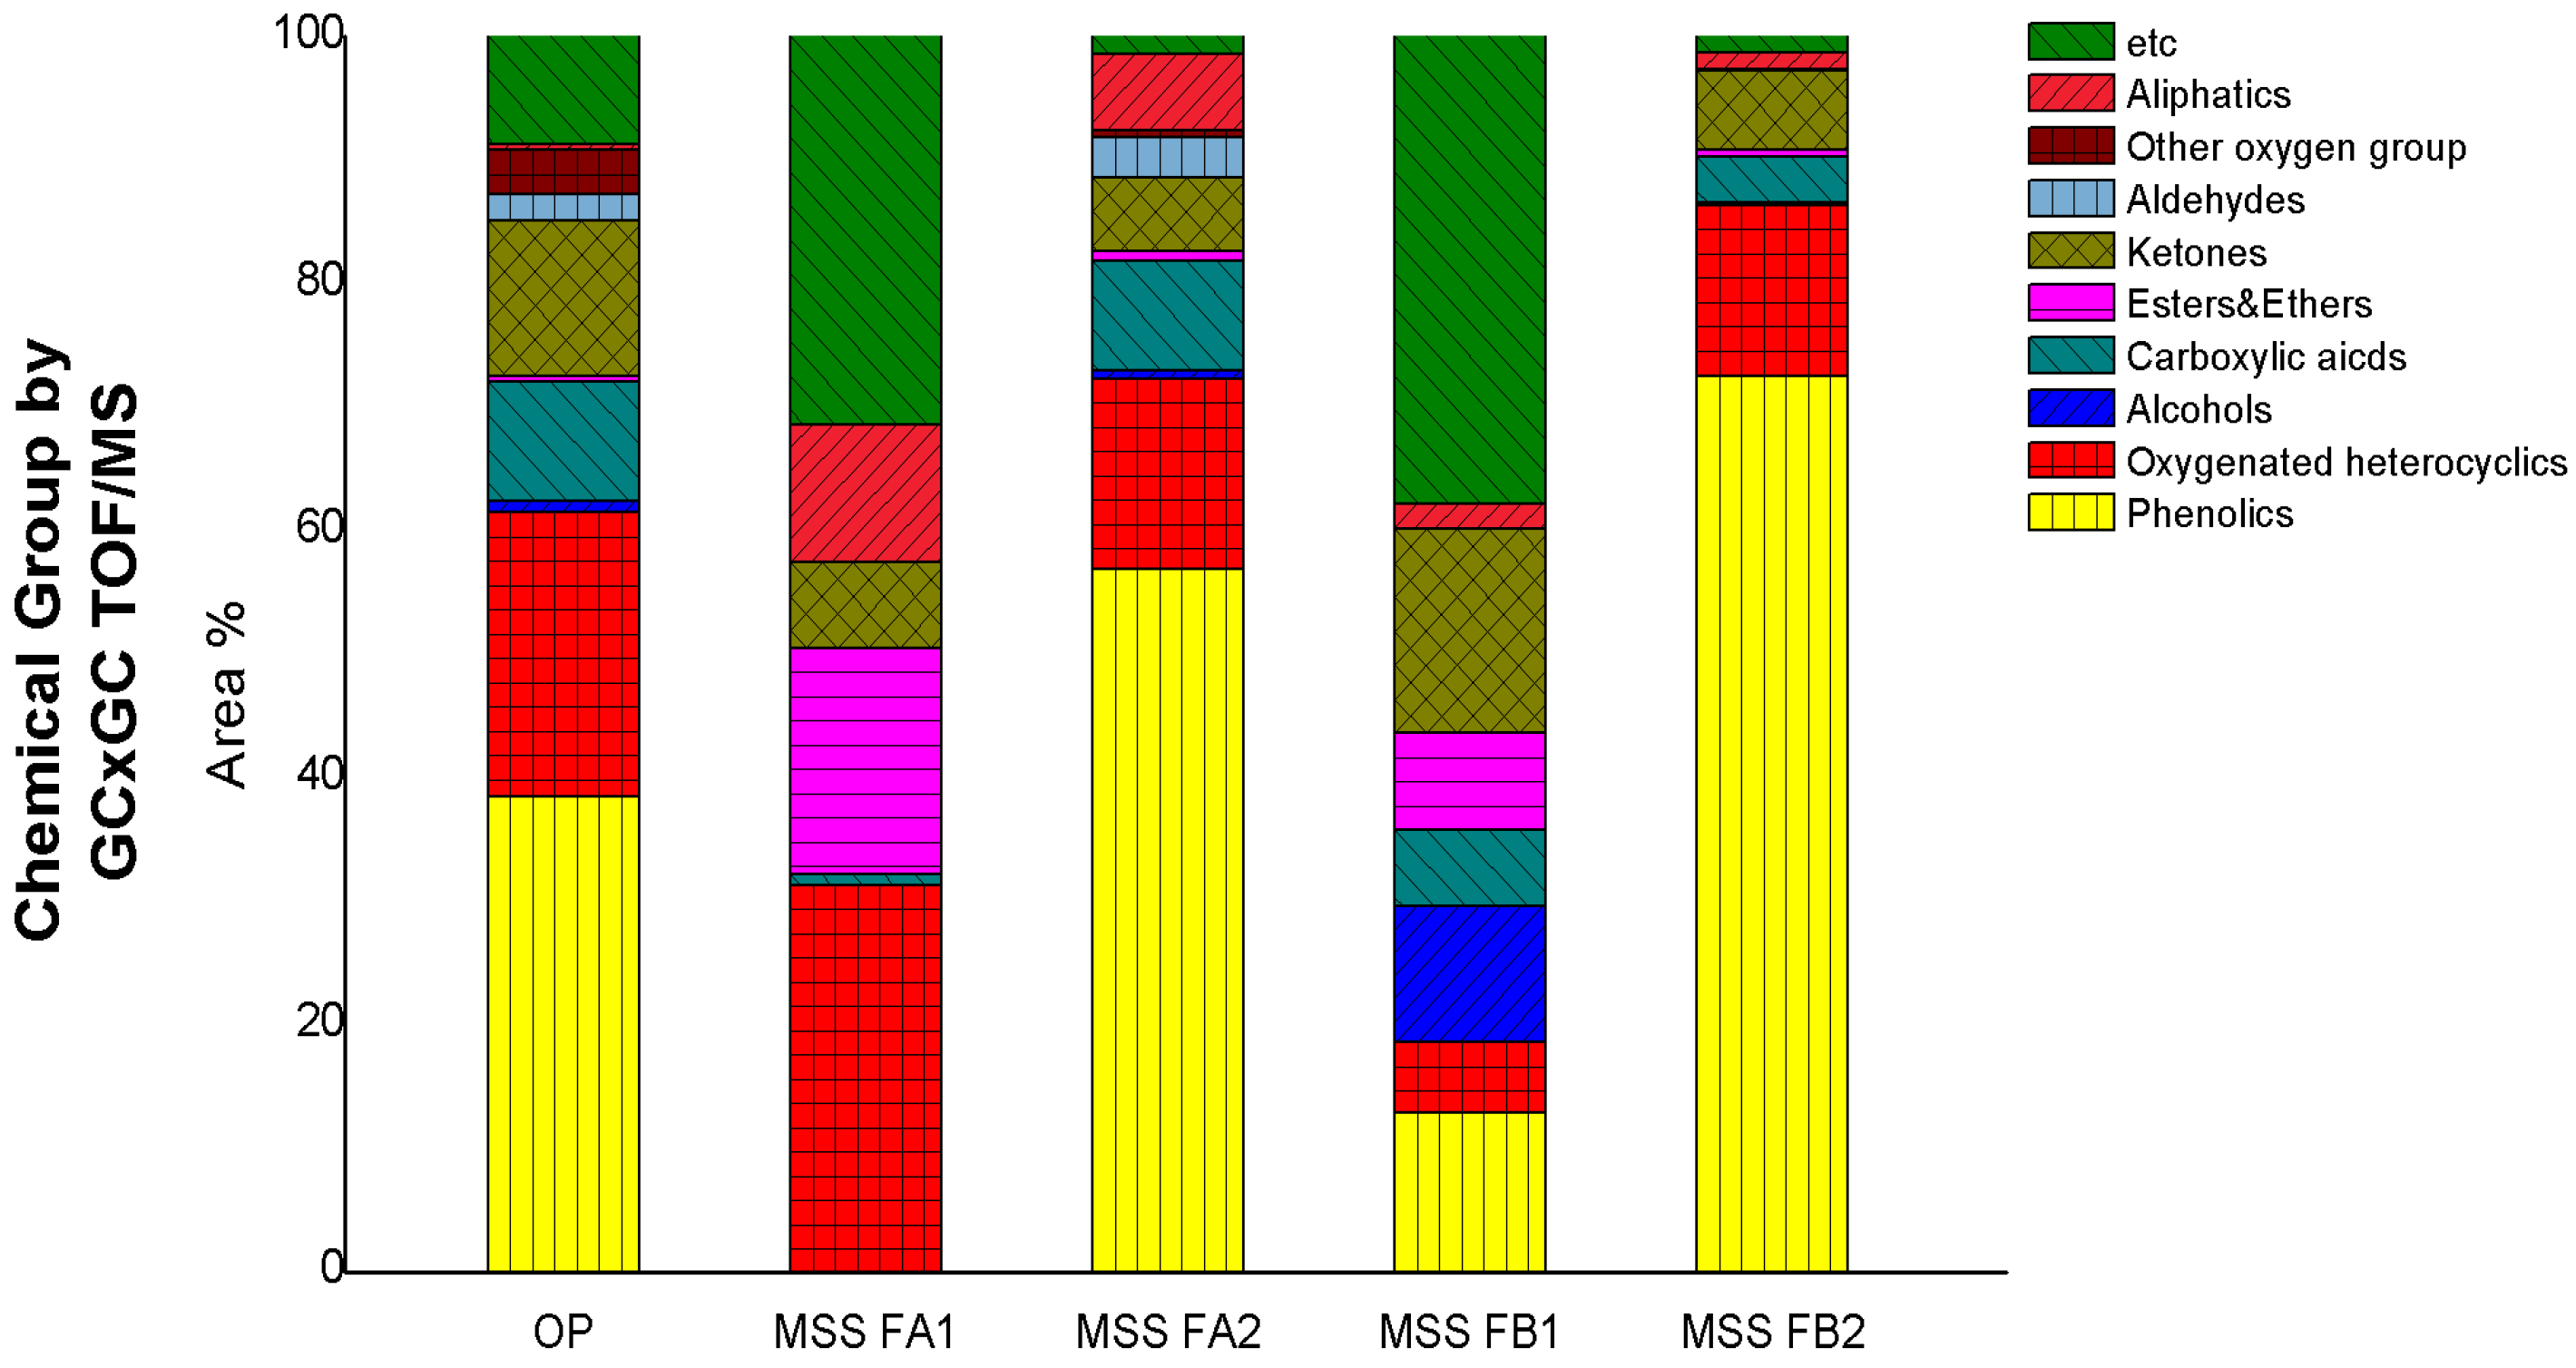
3.4. Compositions from Multi-Step Separation of OP

OP has more phenolic compounds than WP and is effectively fractionated by multi-step separation (MSS) by adjusting the pH at different steps. The OP fraction was divided into four fractions by multi-step separation, as shown in Figure 1. The compositions of the chemical groups in the OP and multi-step separation fractions are illustrated in Figure 6.
We also found that FA1 from the light fraction of OP was composed 31% of heterocyclics, such as hydroxy-decalactone, and 10% of ethers and esters, such as methyl formate, ethane, and 1,1-oxybis. Moreover, 31% of other components, such as sulfur or nitrogen compounds, were extracted from FA1, while no phenolic compounds were extracted from FA1. The FA2 from the light fraction of OP was estimated to be 55% phenolics such as creosol, syringyl acetone, and phenol, 4-propyl-, 9% carboxylic acids such as acetic acid, and 15% heterocyclics such as 1,2-cyclopentanedionem, 3-methyl. The FB1 from the heavy fraction of OP was found to be 10% phenolics, and 38% other components such as sulfur or nitrogen compounds, 11% alcohol such as mehan-d3-ol, and 15% ketones such as 2,3 butanedione. We further found that the FB2 contained up to 62% of phenolics and 8% of heterocyclics such as furanal. This analysis indicates that four fractions separated from OP by multi-step separation consisted of different chemical groups. In particular, OP was found to be enriched in phenolics and was further concentrated into multiple fractions (FA2 and FB2) via multi-step separation. Notably, such concentrated phenolics can then be converted to low molecules by cracking or to aromatics by deoxygenation to upgrade the high-end fuel. Other chemical groups can also undergo a composition-specific upgrading process for similar purposes.

4. Conclusions

Sawdust-derived FPBO was separated into various oxygen compounds, such as phenolics, ketones, carboxylic acids, and heterocyclic compounds, by GC×GC TOF/MS in this study. To utilize FPBO, upgrading processes such as hydrodeoxygenation, aldol condensation, and ketonization are required. The upgrading process fundamentally depends on the target chemical composition of pyrolysis oil. For instance, alcohols or esters can be easily upgraded, while phenolics require a more complicated approach. Specifically, through these processes, pyrolysis oil can be converted into aliphatic hydrocarbons, such as paraffins, olefins, and naphthenes, which are advanced fuel elements.
Our analysis enabled us to classify the chemical components of FPBO and its six fractions. In the water phase, which was fractionated into two fractions, most of the heterocyclics were extracted into the solvent fraction, while most of the acetic acid remained in the residue fraction, which often reduces the efficiency of the catalyst. To separate carboxylic acids such as acetic acid, the chloroform solvent is more efficient than ether solvent, and heterocyclic oxygen compounds are also more clearly separated.
In the oil phase, esters and ethers were fractionated into FA1, and alcohols and esters were fractionated into FB1. Phenolics such as benzene and phenol were fractionated into both FA2 and FB2. In addition, a high ratio of heterocyclic compounds is fractionated in FA1, which is advantageous for the highest tendency toward polymerization. Therefore, it is judged that FA2 and FB2 can produce suitable aromatics because of high phenolic compositions. In comparison with the study results of Junyu et al., the extraction of ketones from FA1 and ester extraction from FA2 were different, but the extraction of the number of phenols from FB2 was consistent.
Overall, the blending of suitable compounds for creating efficient fuel is important for the upgradation of wood-derived FPBO to transportation fuel. Moreover, fractional compound analysis can play a pivotal role in identifying useful compositions that can be utilized in the efficient upgrading process for high-end fuels.

Author Contributions

Conceptualization, H.J.; data curation, formal analysis, investigation, J.-Y.P., J.W.L. and C.-H.O.; methodology, H.J. and J.-Y.P., supervision J.-K.K. and J.Y.; validation, J.-K.K. and J.Y.; writing—original draft, H.J.; writing—review and editing, J.-K.K. and J.Y. All authors have read and agreed to the published version of the manuscript.

Funding

This research was funded by the Climate Change Response Technology Development Program of the Ministry of Science and ICT in the Republic of Korea under grant 2020M1A2A2079804.

Institutional Review Board Statement

Not applicable.

Informed Consent Statement

Not applicable.

Data Availability Statement

Not applicable.

Acknowledgments

This work was supported by a National Research Foundation of Korea (NRF) grant funded by the Ministry of Science and ICT (2020M1A2A2079804) through the Climate Change Response Technology Development Program.

Conflicts of Interest

The authors declare no conflict of interest.

References

  1. Laura, C.; Timur, G. Net Zero by 2050: A Roadmap for the Global Energy Sector; International Energy Agency: Paris, France, 2021. [Google Scholar]
  2. Bridges, A.; Felder, F.A.; McKelvey, K.; Niyogi, I. Uncertainty in energy planning: Estimating the health impacts of air pollution from fossil fuel electricity generation. Energy Res. Soc. Sci. 2015, 6, 74–77. [Google Scholar] [CrossRef]
  3. Demirbas, A. Future Fuels for Internal Combustion Engines. Energ. Source Part A 2010, 32, 1273–1281. [Google Scholar] [CrossRef]
  4. Jenkins, R.W.; Sutton, A.D.; Robichaud, D.J. Pyrolysis of Biomass for Aviation Fuel. In Biofuels for Aviation–Feedstocks, Technology and Implementation; Academic Press: Cambridge, MA, USA, 2016; Chapter 8; pp. 191–215. [Google Scholar]
  5. Bilgili, L. Comparative assessment of alternative marine fuels in life cycle perspective. Renew. Sust. Energy Rev. 2021, 144, 110985. [Google Scholar] [CrossRef]
  6. Annex 16: Environmental Protection, Volume IV–Carbon Offsetting and Reduction Scheme for International Aviation; International Civil Aviation Organization: Montreal, QC, Canada, 2020.
  7. Deshavath, N.N.; Veeranki, V.D.; Goud, V.V. Lignocellulosic Feedstocks for the Production of Bioethanol: Availability, Structure, and Composition. In Sustainable Bioenergy; Elsevier: Amsterdam, The Netherlands, 2019; pp. 1–19. [Google Scholar]
  8. Wang, H.; Yang, B.; Zhang, Q.; Zhu, W. Catalytic routes for the conversion of lignocellulosic biomass to aviation fuel range hydrocarbons. Renew. Sust. Energy Rev. 2020, 120, 109612. [Google Scholar] [CrossRef]
  9. Sarkar, S.; Ghosh, K.; Bannerjee, S.; Aikat, K. Bioethanol production from agricultural wastes: An overview. Renew. Energy 2012, 37, 19–27. [Google Scholar] [CrossRef]
  10. Dri, L.L.; Hector, G.; Moon, R.J.; Zavattieri, P.D. Anisotropy of the elastic properties of crystalline cellulose I β from first principles density functional theory with Van der Waals Interactions. Cellulose 2013, 20, 2703–2718. [Google Scholar] [CrossRef]
  11. Dong, C.; Zhang, Z.; Lu, Q.; Yang, Y. Characteristics and mechanism study of analytical fast pyrolysis of poplar wood. Energy Convers. Manag. 2012, 57, 49–59. [Google Scholar] [CrossRef]
  12. Basu, P. Tar production and Destruction. In Biomass Gasification and Pyrolysis: Practical Design and Theory; Academic Press: Cambridge, MA, USA, 2010; Chapter 4; pp. 117–166. [Google Scholar]
  13. Demirbas, A.; Arin, G. An overview of biomass pyrolysis. Energy Source 2002, 24, 471–482. [Google Scholar] [CrossRef]
  14. Park, J.Y.; Kim, J.K.; Oh, C.H.; Park, J.W.; Kwon, E.E. Production of bio-oil from fast pyrolysis of biomass using a pilot-scale circulating fluidized bed reactor and its characterization. J. Environ. Manag. 2019, 234, 138–144. [Google Scholar] [CrossRef]
  15. Papari, S.; Hawboldt, K. A review on condensing system for biomass pyrolysis process. Fuel Process. Technol. 2018, 180, 1–13. [Google Scholar] [CrossRef]
  16. Kim, I.; Dwiatmoko, A.A.; Choi, J.W.; Suh, D.J.; Jae, J.; Ha, J.M.; Kim, J.K. Upgrading of sawdust pyrolysis oil to hydrocarbon fuels using tungstate-zirconia-supported Ru catalysts with less formation of cokes. J. Ind. Eng. Chem. 2017, 56, 74–81. [Google Scholar] [CrossRef]
  17. Vitasari, C.R.; Meindersma, G.W.; De Haan, A.B. Glycolaldehyde co-extraction during the reactive extraction of acetic acid with tri-n-octylamine/2-ethyl-1-hexanol from a wood-based pyrolysis oil-derived aqueous phase. Sep. Purif. Technol. 2012, 95, 39–43. [Google Scholar] [CrossRef]
  18. Vitasari, C.R.; Meindersma, G.W.; De Haan, A.B. Water extraction of pyrolysis oil: The first step for the recovery of renewable chemicals. Bioresour. Technol. 2011, 102, 7204–7210. [Google Scholar] [CrossRef]
  19. Bridgwater, A.V. Review of fast pyrolysis of biomass and product upgrading. Biomass Bioenerg. 2012, 38, 68–94. [Google Scholar] [CrossRef]
  20. Ribeiro, L.A.B.; Martins, R.C.; Mesa-Pérez, J.M.; Bizzo, W.A. Study of bio-oil properties and ageing through fractionation and ternary mixtures with the heavy fraction as the main component. Energy 2019, 169, 344–355. [Google Scholar] [CrossRef]
  21. Wang, S.; Wang, Y.; Cai, Q.; Wang, X.; Jin, H.; Luo, Z. Multi-step separation of monophenols and pyrolytic lignins from the water-insoluble phase of bio-oil. Sep. Purif. Technol. 2014, 122, 248–255. [Google Scholar] [CrossRef]
  22. Pierce, K.M.; Hope, J.L.; Hoggard, J.C. A principal component analysis based method to discover chemical differences in comprehensive two-dimensional gas chromatography with time-of-flight mass spectrometry (GC × GC-TOFMS) separations of metabolites in plant samples. Talanta 2006, 70, 797–804. [Google Scholar] [CrossRef]
  23. EN 16900:2017; Fast Pyrolysis Bio-oils for Industrial Boilers-Requirement and Test Methods. European Standard: Pilsen, Czech Republic, 2017.
  24. Wei, Y.; Lei, H.; Wang, L.; Zhu, L.; Zhang, X.; Liu, Y.; Chen, S.; Ahring, B. Liquid-liquid extraction of biomass pyrolysis bio-oil. Energy Fuel 2014, 2, 1207–1212. [Google Scholar] [CrossRef]
  25. Tao, J.; Li, C.; Li, J.; Yan, B.; Chen, G.; Cheng, Z.; Li, W.; Lin, F.; Hou, L. Multi-step separation of different chemical groups from the heavy fraction in biomass fast pyrolysis oil. Fuel Process. Technol. 2020, 202, 106366. [Google Scholar] [CrossRef]
  26. Wang, Q.; Cui, D.; Pan, S.; Wang, Z.; Liu, Q.; Liu, B. Compositional characterization of neutral fractions in <300 °C distillates of six shale oils using extrography followed by GC-TOF/MS analysis. Fuel 2018, 224, 610–618. [Google Scholar]
  27. ASTM D975-21; Standard Specification for Diesel Fuel. American Society for Testing and Materials: West Conshohocken, PA, USA, 2021.
  28. ASTM D1655-21b; Standard Specification for Aviation Turbine Fuels. American Society for Testing and Materials: West Conshohocken, PA, USA, 2021.
  29. Boateng, A.A. Condensed-phase pyrolysis oil upgrading. In Pyrolysis of Biomass for Fuels and Chemicals; Academic Press: Cambridge, MA, USA, 2020; Chapter 5; pp. 119–147. [Google Scholar]
  30. Lakshmanan, C.M.; Hoelscher, H.E. Production of levoglucosan by pyrolysis of carbohydrates pyrolysis in hot inert gas stream. Ind. Eng. Chem. Prod. Res. Dev. 1970, 9, 57–59. [Google Scholar]
  31. Furimsky, E. Catalytic hydrodeoxygenation. Appl. Catal. A Gen. 2000, 199, 147–190. [Google Scholar] [CrossRef]
  32. Severa, G.; Kumar, G.; Troung, M.; Young, G.; Cooney, M.J. Simultaneous extraction and separation of phorbol esters and bio-oil form Jatropha biomass using ionic liquid-methanol co-solvents. Sep. Purif. Technol. 2013, 116, 265–270. [Google Scholar] [CrossRef]
  33. Park, L.K.E.; Ren, S.; Yiacoumi, S.; Ye, X.P.; Borole, A.P.; Tsouris, C. Separation of switchgrass bio-oil by water/organic solvent addition and pH adjustment. Energy Fuel. 2016, 33, 2164–2173. [Google Scholar] [CrossRef]
  34. Shafaghat, H.; Jae, J.; Park, Y.K. Effect of the two-stage process comprised of ether extraction and supercritical hydrodeoxygenation on pyrolysis oil upgrading. Chem. Eng. J. 2021, 404, 126531. [Google Scholar] [CrossRef]
  35. Wang, N.; Liu, Y.S.; Liu, Y.; Wang, Q. Properties and mechanisms of different guanidine flame retardant wood pulp paper. J. Anal. Appl. Pyrolysis 2017, 128, 224–231. [Google Scholar] [CrossRef]
Figure 1. Fractionization and analysis processes of FPBO.
Energies 15 02054 g001
Figure 2. GC×GC TOF/MS chromatogram of FPBO: (a) 2-D; (b) 3-D. x = retention time, y = TOF axis, z = peak intensity.
Energies 15 02054 g002
Figure 3. GC×GC TOF MS chromatogram of first fractionation: (a) water phase, and (b) oil phase. x = retention time, y = TOF axis.
Energies 15 02054 g003
Figure 4. Chemical group compositions of FPBO, WP, and OP.
Energies 15 02054 g004
Figure 5. Chemical group compositions of WP and its liquid-liquid extraction fractions.
Energies 15 02054 g005
Figure 6. Chemical group compositions of OP and multi-step separation fractions.
Energies 15 02054 g006
Table 1. Fractionization process yields of FPBO.
ProcessHydrocarbon Contents (w/w %)
FPBO 100.00
Water phase 41.59
Liquid-liquid extraction
chloroform solvent phase
3.32
Liquid-liquid extraction
chloroform residue phase
38.27
Liquid-liquid extraction
ether solvent phase
3.27
Liquid-liquid extraction
ether residue phase
38.32
Oil phase 58.41
Multi-step separation
FA1
13.25
Multi-step separation
FA2
4.10
Multi-step separation
FB1
31.37
Multi-step separation
FB2
9.69
Table 2. Properties of sample FPBO.
PropertyUnitEN 16900
(Boiler)
ASTM D975
(Diesel)
ASTM D975
(Diesel)
FPBO
Net calorific valueMJ/KgMin 14.0-Min 42.817.4
Water contentm/m %Max 30Max 0.05Max 0.00629.5
pH Min 2.0--2.72
Density, 15 °CKg/m3Max 1 300820 to 860775–8401177
Pour point°CMax -9−35 to −15-−25.0
Nitrogen content(m/m %)Report--0.113
Kinematic viscosity 40 °Cmm2/sMax 502.0 to 4.5Max 8 (−20 °C)18.07
Sulfur content m/m %Max 0.05Max 0.0015Max 0.20.43
Solid content m/m %Max 0.5--0.26
Ash content m/m %Max 0.05Max 0.01-0.10
Nam/m %Max 0.02--0.01
K m/m %Max 0.02--0.01
Ca m/m %Max 0.02--0.01
Table 3. Main chemical compounds in FPBO.
No.CompoundsRx (%)
1Acetic Acid14.28
2Levoglucosan13.97
33-furaldehyde1.75
4Phenol1.69
51,2-benzendiol1.64
62-propanone, 1-hydroxy-1.48
7Hydroquinone1.38
85-hydro-methyl dihydrofuran-2-one1.36
92(5H)-furanone1.33
10Pentanoic Acid, 4-oxo-1.17
11Anhydro Sugar1.16
12Syringyl Acetone1.05
131-hydroxy-2-butanone1.03
142(5H)-furanone0.92
15Phenol, 4-propyl-0.81
16Isometric Dihydro-methyl-furanone0.77
171,4:3,6-dianhydro-a-d-glucopyranose0.73
182-hexyldecanoic Acid0.73
19Ethenone,1-(4-hydroxy-3,5-dimethoxyphenyl)-0.71
201,3-di-o-acetyl-a-a-d-ribopyransoe0.69
Publisher’s Note: MDPI stays neutral with regard to jurisdictional claims in published maps and institutional affiliations.

