Article

Battery State of Charge Estimation Based on Composite Multiscale Wavelet Transform

1
Department of Automotive Engineering, Hebei Jiaotong Vocational and Technical College, Shijiazhuang 266100, China
2
School of Information Science and Technology, Shijiazhuang Tiedao University, Shijiazhuang 266100, China
*
Author to whom correspondence should be addressed.
Energies 2022, 15(6), 2064; https://doi.org/10.3390/en15062064
Submission received: 4 February 2022 / Revised: 5 March 2022 / Accepted: 9 March 2022 / Published: 11 March 2022

Abstract

:
The traditional battery state of charge (SOC) estimation method, which is based on neural networks, directly uses terminal voltage and terminal current as the input data. Although it is convenient to implement, it produces a large estimation error when the current and voltage change drastically. To solve this problem, a new method, which uses a composite multiscale wavelet transform, is proposed to estimate the battery SOC. In the proposed method, a wavelet transform is applied to the input data, and this process obtains the approximate coefficients and detail coefficients of the input data at different scales. A neural network then uses these coefficients as inputs to estimate the SOC. The experimental results show that the proposed method can improve the accuracy of the battery SOC estimation without changing the neural network structure or algorithm.

1. Introduction

The battery is the core component in an electric vehicle. A battery management system (BMS) can comprehensively manage battery characteristics, including charge and discharge patterns, temperature, the state of charge (SOC), battery equalization, and other functions. The estimation of the SOC is used to calculate the remaining battery capacity. An accurate estimation of the SOC is an important basis for the evaluation of other parameters and is vital for the safe and efficient use of batteries.
At present, the most commonly used battery SOC estimation methods are the ampere-hour method [1,2], open-circuit voltage method [3,4,5], internal resistance method [6], kalman filter method [7,8,9,10], and some data-driven methods, such as the Gaussian process regression method [11,12] and the support vector machine method [13]. The ampere-hour method is easy to implement, but errors can easily accumulate. The open-circuit voltage method is highly accurate, but in order to obtain an accurate open-circuit voltage, the battery needs to be in a static state. Because it is difficult to obtain the open-circuit voltage while the battery is in the working state, this method’s applications are limited. The internal resistance method is very sensitive to external conditions such as current, voltage, and temperature, and it also produces large errors. The Kalman filter method can be combined with the traditional ampere-hour method, and its accuracy is high, but its performance depends on the accuracy of the particular battery model being used. The gaussian process regression method can quantify the estimation uncertainties, which enables a reliability assessment of the SOC estimation, but it relies on historical input data.
Because of the strong nonlinear processing ability of neural networks, many researchers have attempted to estimate the battery SOC using such networks. For example, Chen et al. employed a recurrent neural network to estimate the battery SOC [14], and Tian et al. utilized a deep neural network to identify the open-circuit voltage of the battery and estimate the SOC [15]. In addition, Zhang et al. used a radial basis function (RBF) neural network for battery SOC estimation [16]. Furthermore, Guo et al. studied the effects of the key parameters of neural network functions on the battery SOC estimation results [17]. Zhao et al. used the ant colony optimization algorithm to optimize the neural network to improve the estimation accuracy [18]. Feng et al. divided hidden layers into separate modules and employed a neural network to estimate the battery SOC [19]. Patel et al. investigated the impact of different battery working conditions and models on the accuracy of SOC estimation [20,21]. Finally, Wang et al. used a sliding window model for data processing and applied a neural network for battery SOC estimation [22].
In these studies, feedforward neural networks or neural networks with similar structures were used to estimate the battery SOC. By improving the structure and parameters of the neural network, a high estimation accuracy was achievable. However, the conclusions were primarily based on the constant current discharge data, which is not always an accurate representation of the actual discharge conditions. When using the drastically changing discharge data or the actual condition data, the estimation error of the feedforward neural network increases sharply. This is due to the fact that when the current changes drastically, the voltage cannot change synchronously with the current, generating a hysteresis. Consequently, when using only the current and voltage for the input of the neural network to estimate the battery SOC, there is a non-one-to-one mapping, which leads to an increase in the estimation error. This error cannot be mitigated by modifying the structure or parameters of the neural network. Moreover, some researchers began to use some kinds of time series neural networks to estimate battery SOC. However, the time series neural networks will have an over-fit phenomenon with the increase of the time delay parameter. To solve the above problems, this study proposes a multiscale wavelet transform for the input data, (i.e., terminal voltage and terminal current). The transformed data is used as the input for the neural network to estimate the SOC of the battery.
The main contributions of our work are as follows. First, an improved battery SOC estimation method based on a neural network is proposed. The proposed method pre-processes only the current and voltage without changing the original structure of the neural network. This method can be adapted into existing SOC estimation methods based on neural networks, and therefore it can be universally applied. Second, experiments are conducted to verify that the proposed method can improve the accuracy of the battery SOC estimation. Third, this method can overcome the disadvantages of the time series neural network. Forth, the accuracy of the battery SOC estimation for different transformation scales were tested in order to find the balance between accuracy and computation complexity.
The remainder of this paper is organized as follows. Section 2 provides the experimental platform and test data. Section 3 describes how we designed the experiment and processed the data with the wavelet transform. Section 4 presents the experimental data and analysis; in this section, the disadvantages of time series neural network are discussed as well. Section 5 presents the conclusion and future prospects.

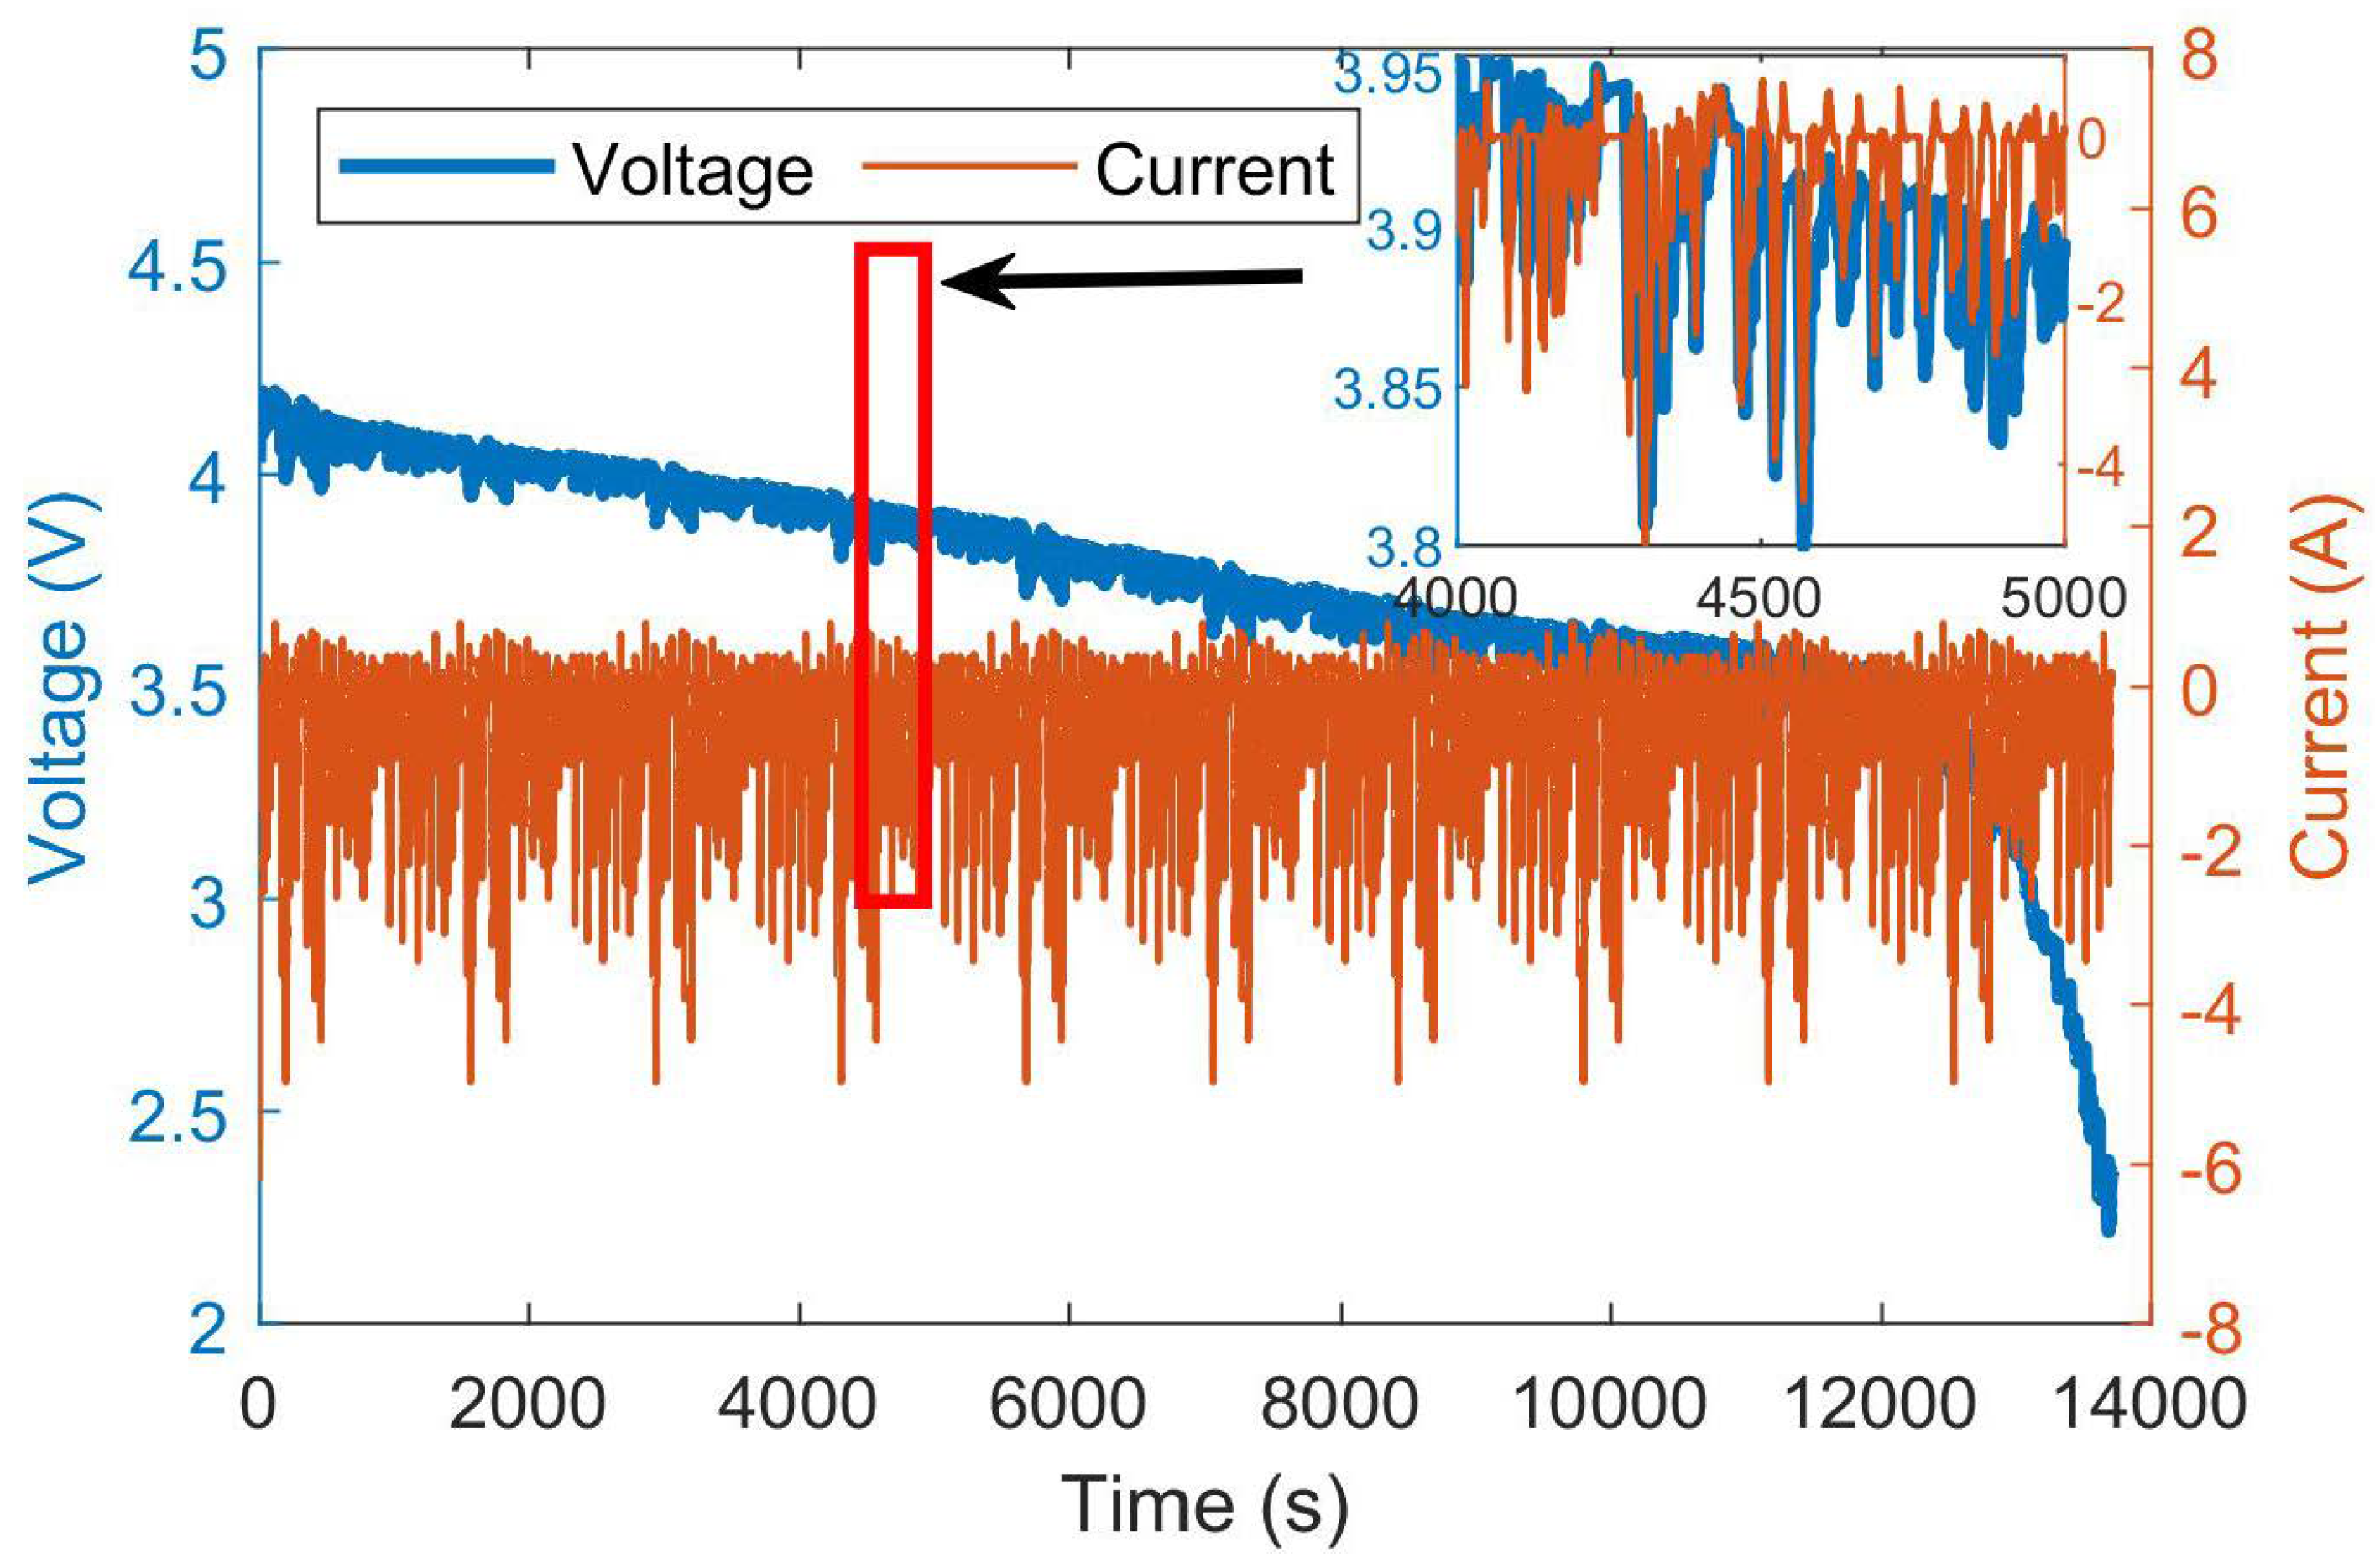
2. Test Bench and Experimental Data

The test bench consisted of the test samples, a thermal chamber, a LANHECT-2001 battery testing system, and a computer, as shown in Figure 1. The magnitude of the current in the battery testing system ranged from 1 mA to 5000 mA, and the voltage magnitude ranged from 2 V to 15 V. The measurement accuracy for the current in the battery testing system was 0.1%RD ± 0.1%FS, and its voltage accuracy was 0.1%RD ± 0.1%FS. The RD means reading value, and the FS means full scale.
The test sample was a Samsung 18650 nickel–cobalt–manganese (NCM) three-element lithium-ion battery. The basic specifications are presented in Table 1.
To test the performance of the proposed algorithm, two discharge profiles were applied in the experiments: the urban dynamometer driving schedule (UDDS) and the dynamic stress test (DST). All experiments were conducted at a constant temperature of 20 °C, and the current, voltage, and corresponding SOC per second were recorded. The UDDS represents city driving conditions. It can be applied to any electric vehicle. In actual vehicles, the maximum current may exceed 300 A, which was difficult to imitate in the laboratory. In addition, in the neural network training and prediction steps, the input data needs to be normalized as 0 to 1. Therefore, the scale of the original current values will hardly affect the estimation results. In this paper, based on ADVISOR, in which the parameters of vehicles have been modified, the actual current values of UDDS were reduced to allow it to discharge all the power of the battery after 10 cycles, as shown in Figure 2. Each cycle of the DST discharge profile consisted of several large charge and discharge processes. The maximum discharge current was 6 A and the maximum charge current was 3 A. There was a long holding time between the discharge cycles, which was repeated until the SOC reached zero, as shown in Figure 3.
The state of health (SOH) of the battery will also affect the accuracy of the SOC estimation. However, according to some research, when the battery is in one life cycle, the change of the battery SOH can be ignored [23,24]. In addition, to avoid the influence of the SOH on the experiment, a new battery was used in each experiment. After five processes, the average value was used as the experiment data.

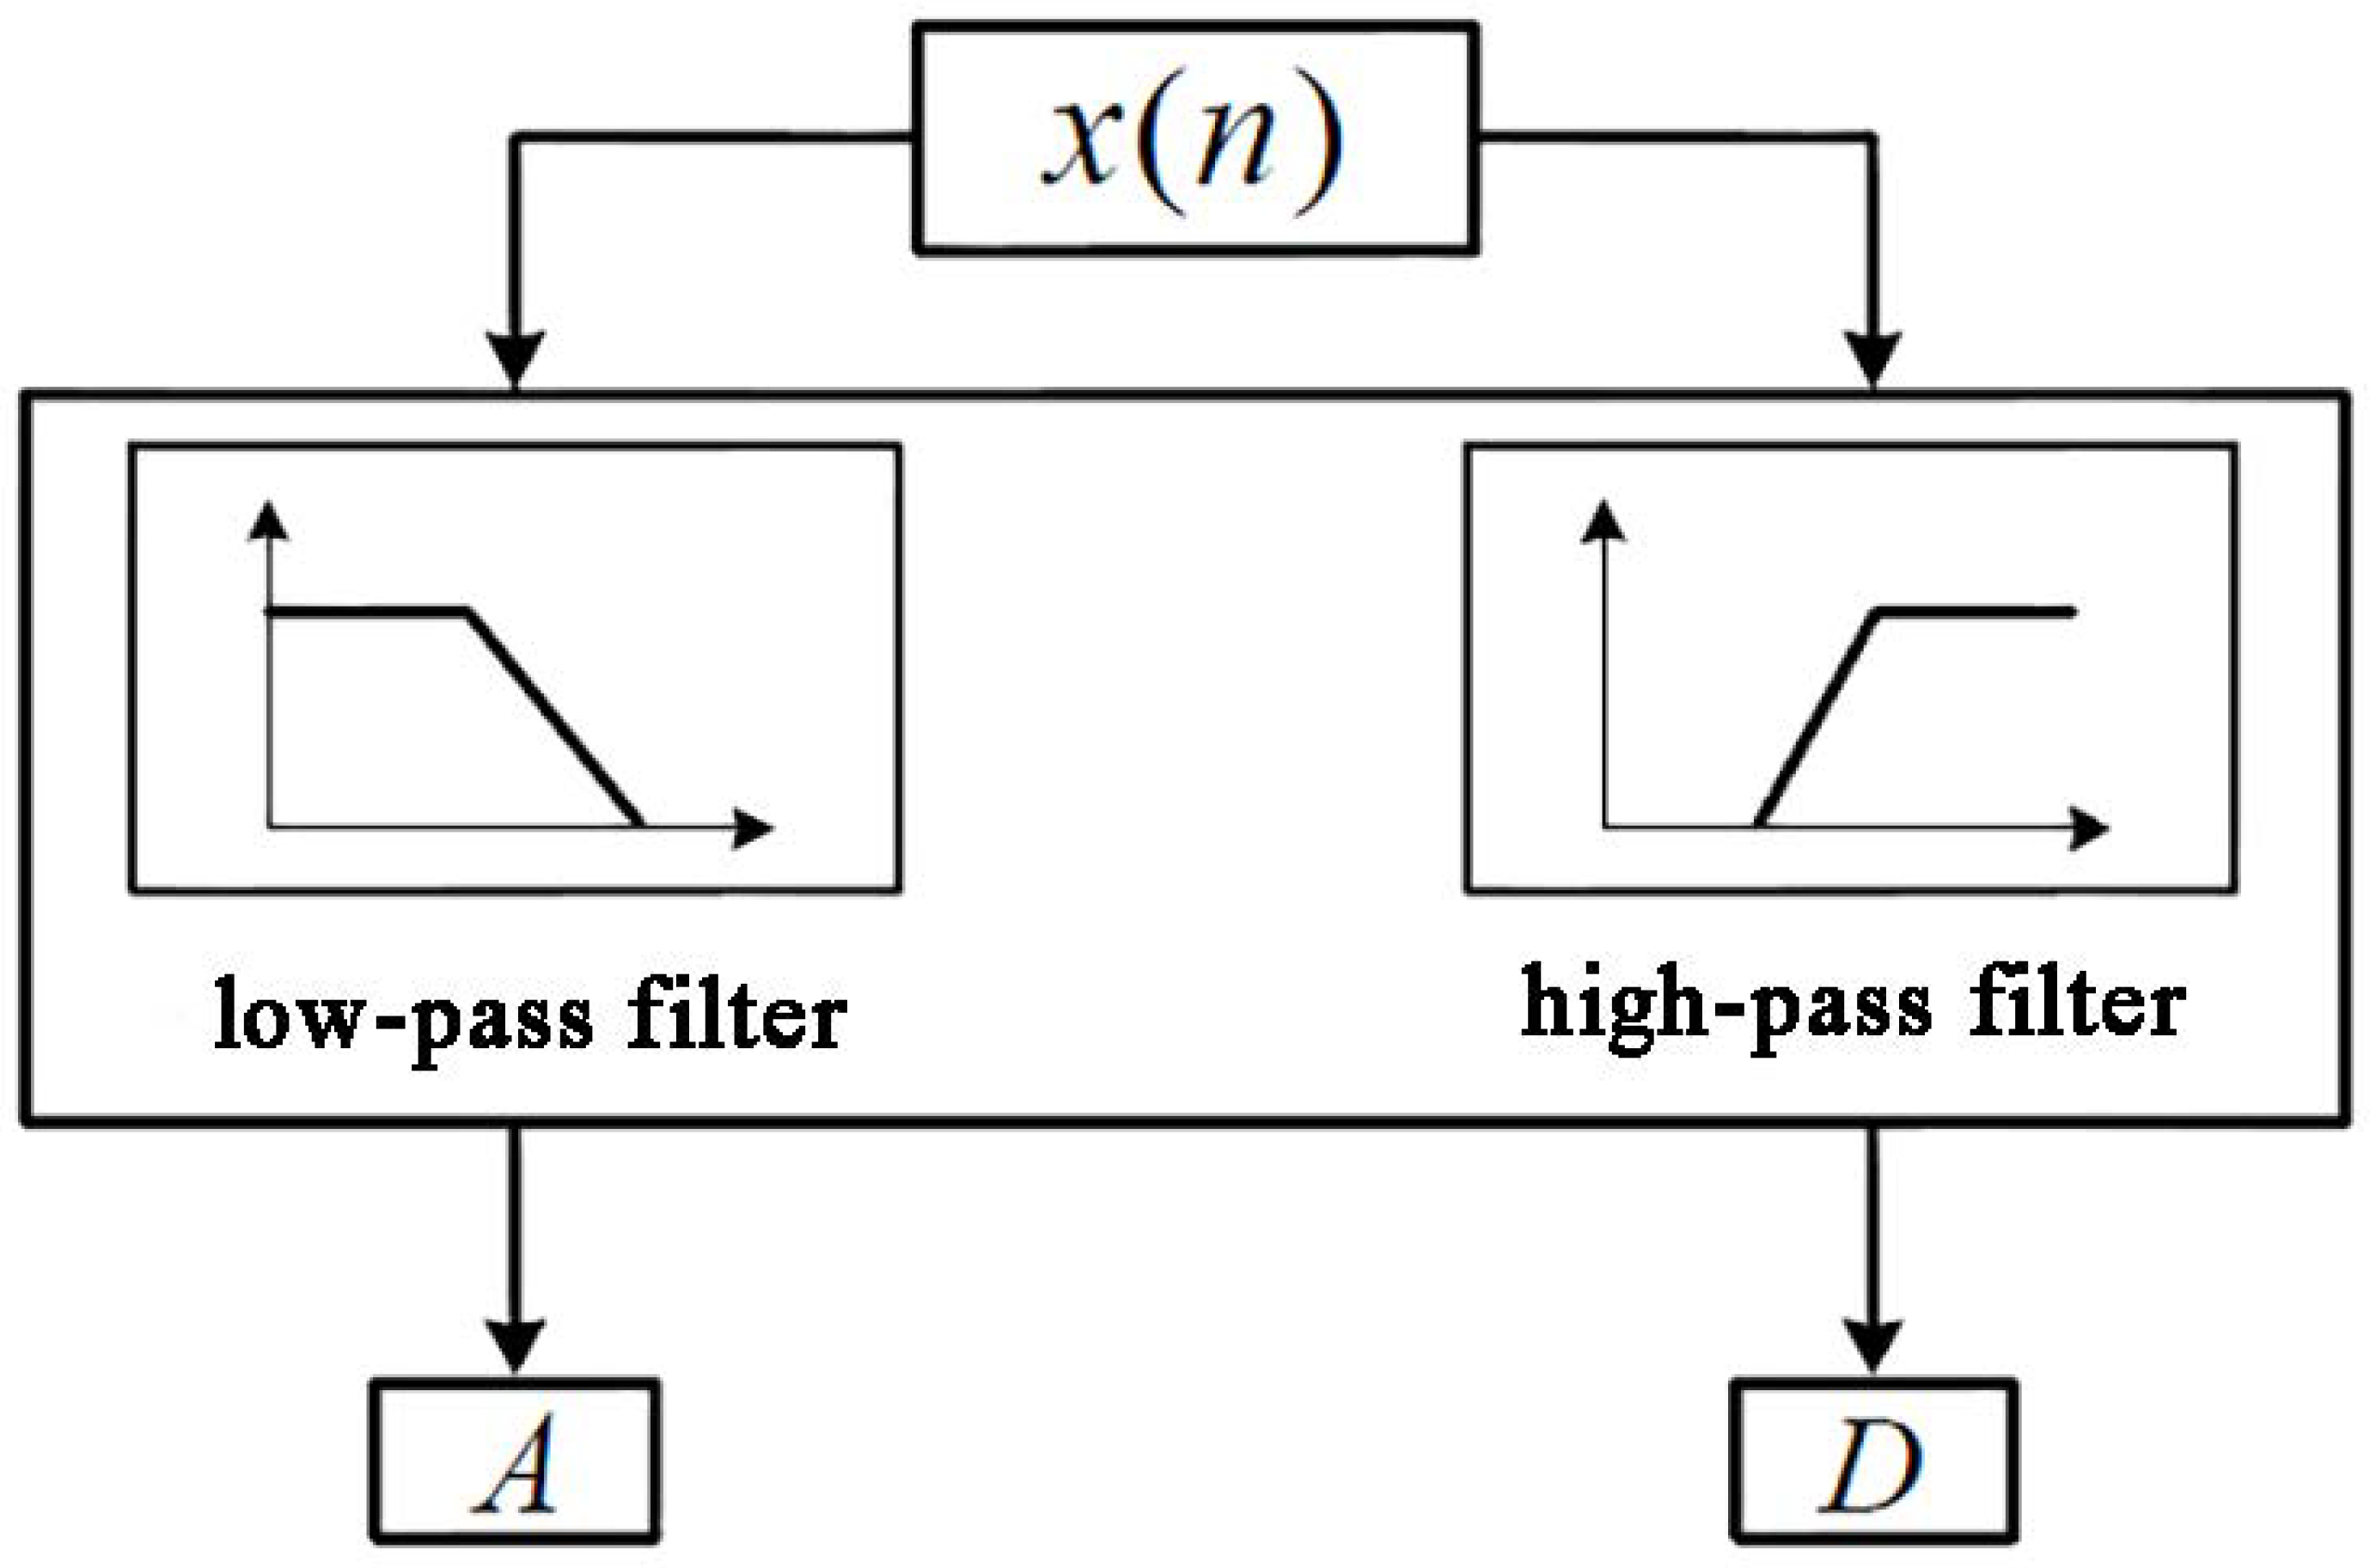
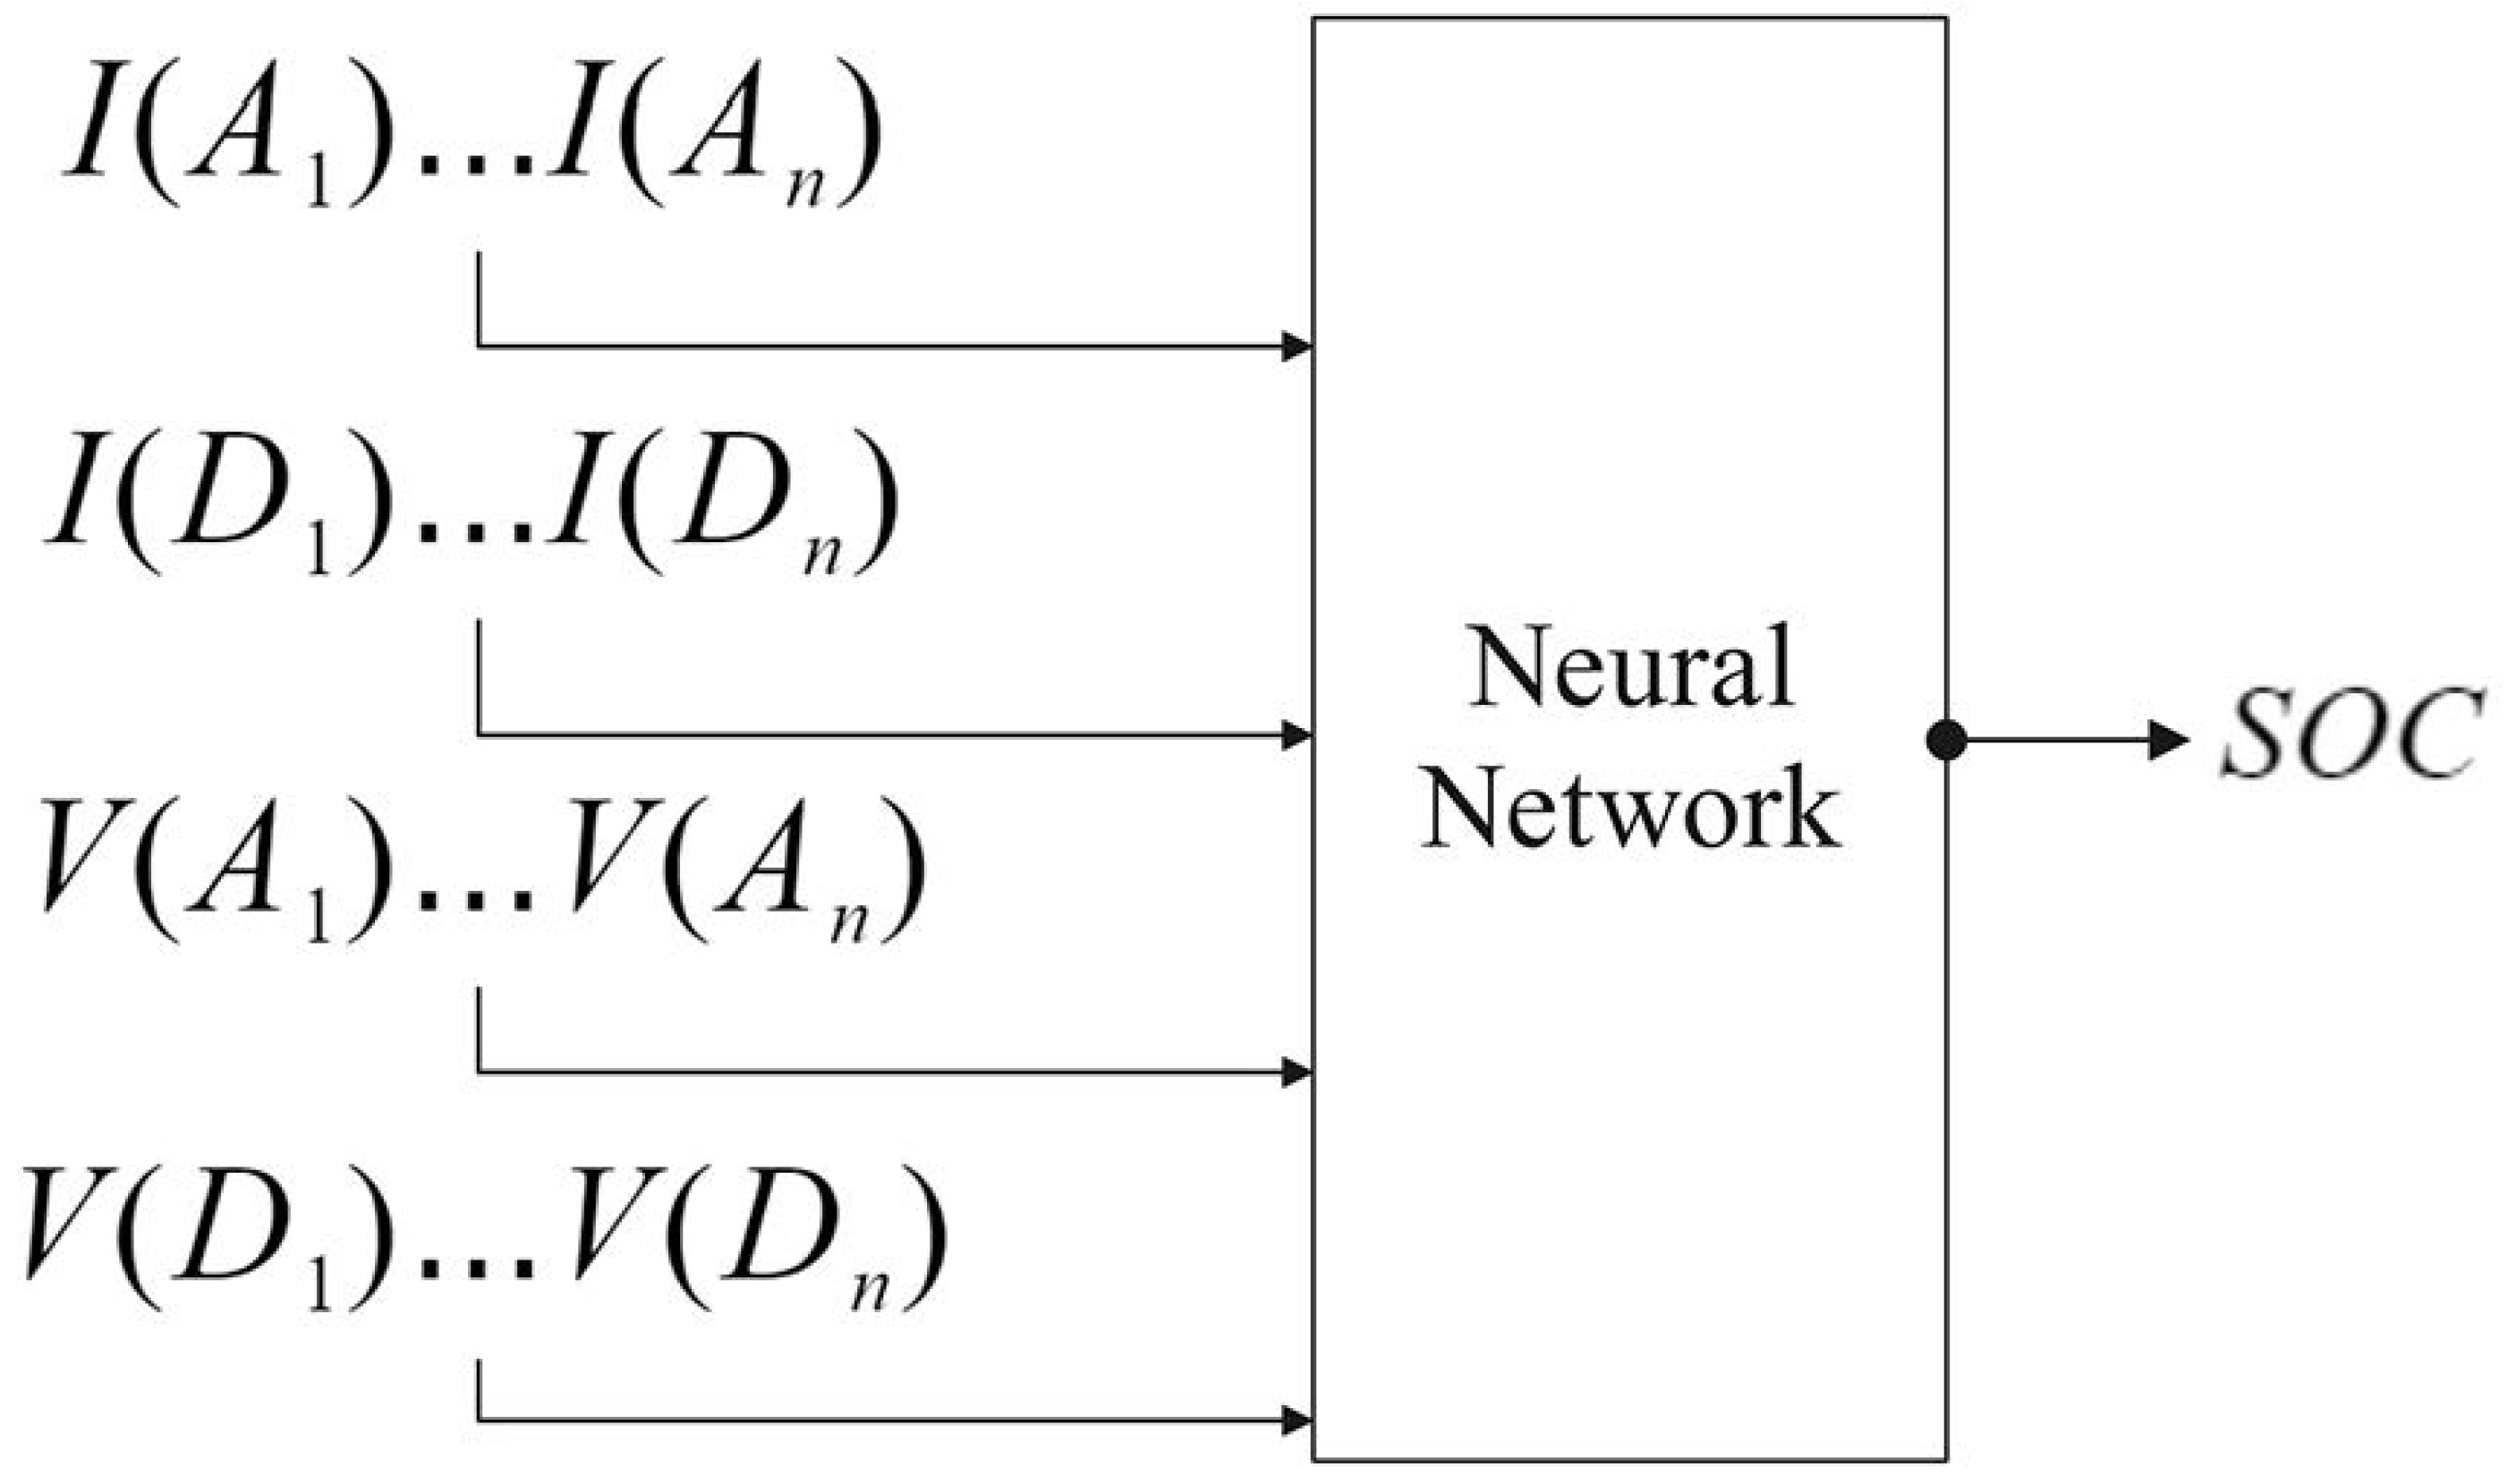
3. Composite Multiscale Wavelet Transform Method

In the traditional method of estimating the battery SOC using neural networks, the neural network accepts the current and voltage as input, and the output of the neural network is the SOC. When the current and voltage change significantly, the neural network produces a large estimation error. To improve the accuracy with which the battery SOC is estimated via neural networks, the composite multiscale wavelet transform was used to process the current and voltage data. The principle of the wavelet transform is as follows. If there is an input signal, its wavelet transform can be written as
D W T ( j , k ) = x ( t ) ψ j , k * ( t ) d t ,
where
ψ j , k ( t ) = a 0 j / 2 ψ ( a 0 j t b 0 k ) ,
is the mother wavelet function, * represents the complex conjugate of the mother wavelet, a 0 and b 0 are constants, and j , k R denote the scale and translation parameters, respectively. Setting a 0 and b 0 to 2 and 1, respectively, ψ j , k ( t ) can be expressed as:
ψ j , k ( t ) = 2 j / 2 ψ ( 2 j t k ) ,
and D W T ( j , k ) can be expressed as
D W T ( j , k ) = 1 2 j x ( t ) ψ j , k ( t k 2 j 2 j ) d t .
By setting different values for the scale parameters and translation parameters, x ( t ) can be decomposed into low-frequency approximation parameters and high-frequency detail parameters in order to perform multi-resolution wavelet analysis. The approximate signal is composed of a scale function ϕ ( t ) and an approximate coefficient a j , k , and the detail signal is composed of a wavelet function ψ ( t ) and a detail coefficient d j , k . Based on these definitions, the J-layer discrete wavelet transform of the signal x ( t ) is given by:
x ( t ) = k = 0 2 N J 1 a J , k 2 J / 2 ϕ ( 2 J t k ) + j = 1 J k = 0 2 N J 1 d j , k 2 j / 2 ψ ( 2 j t k ) ,
where N is the largest layer of decomposition, J is the current layer of decomposition, and J < N . After the signal x ( t ) is decomposed, it can be reconstructed using the inverse discrete wavelet transform. A single-layer decomposition diagram of the wavelet transform is shown in Figure 4, and the multilayer decomposition process is shown in Figure 5.
To simplify the calculation, the Haar wavelet was selected as the mother wavelet [25,26]. The ϕ and ψ values of the Haar wavelet are:
ϕ ( t ) = 1 0 t < 1 0 otherwise ,
and:
ψ ( t ) = 1 / 2 0 t 1 / 2 1 / 2 1 / 2 < t < 1 0 otherwise ,
respectively. The Haar wavelet can be generated using a linear transform, which has a fast calculation speed and is convenient for hardware implementation. The approximate coefficient A n of the n-th layer and n detail coefficients D 1 , D n are obtained by performing an n-level decomposition of the signal. As the scale value of the wavelet transform increases, the length of the transformed data also increases exponentially. When the signal data is decomposed by the third layer of the wavelet transform, at least eight data points are required; when the signal data is decomposed by the fifth layer of the wavelet transform, at least 32 data points are needed. In this case, there are insufficient data for processing in the initial stage, and the SOC data cannot be obtained immediately. Therefore, using only the decomposition of the n-th layer leads to a large delay in the battery SOC estimation. To reduce this delay, a composite multiscale wavelet transform method is proposed. In this method, the wavelet transform of the signal from the first layer to the n-th layer is performed, and the approximate coefficients and detail coefficients obtained by the wavelet transform of each layer are recorded. Thus, the approximate parameters I ( A 1 ) , , I ( A n ) and detail parameters I ( D 1 ) , , I ( D n ) at different scales are obtained, and the voltage is also processed to obtain V ( A 1 ) , V ( A n ) and V ( D 1 ) , , V ( D n ) . These data were used as the input to train the forward neural network and predict the battery SOC, as shown in Figure 6. The parameters of the neural network are listed in Table 2.

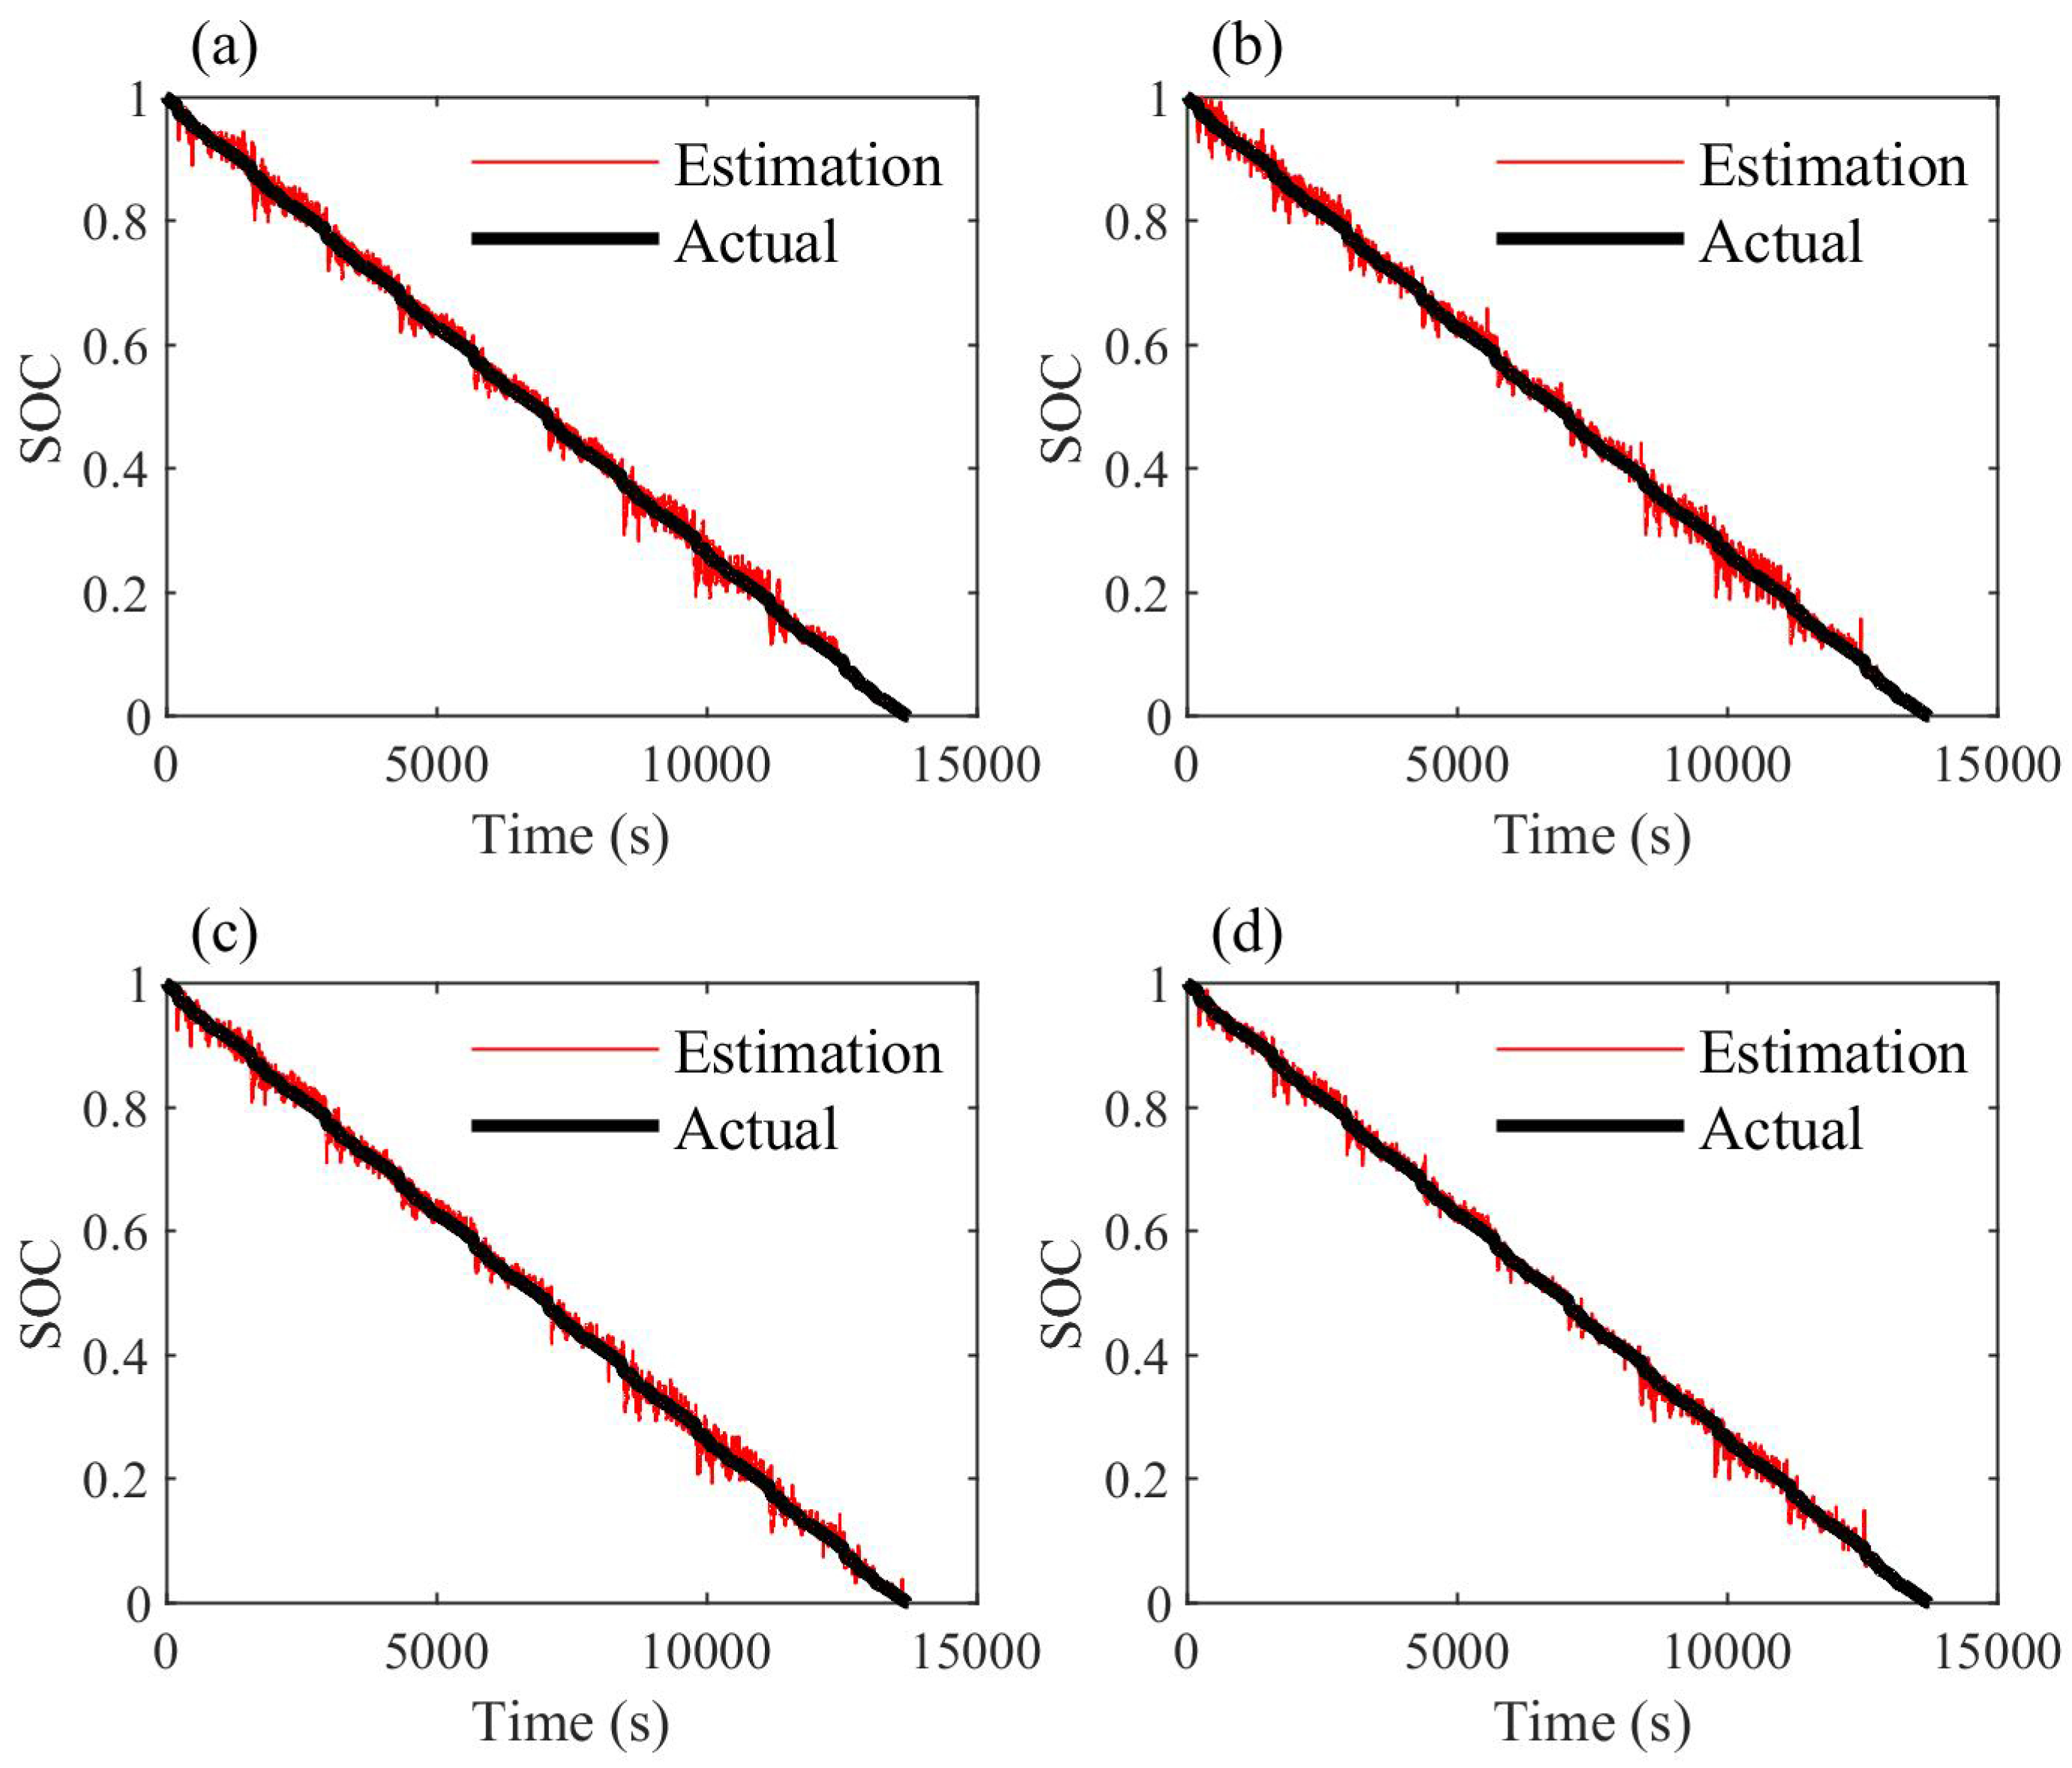
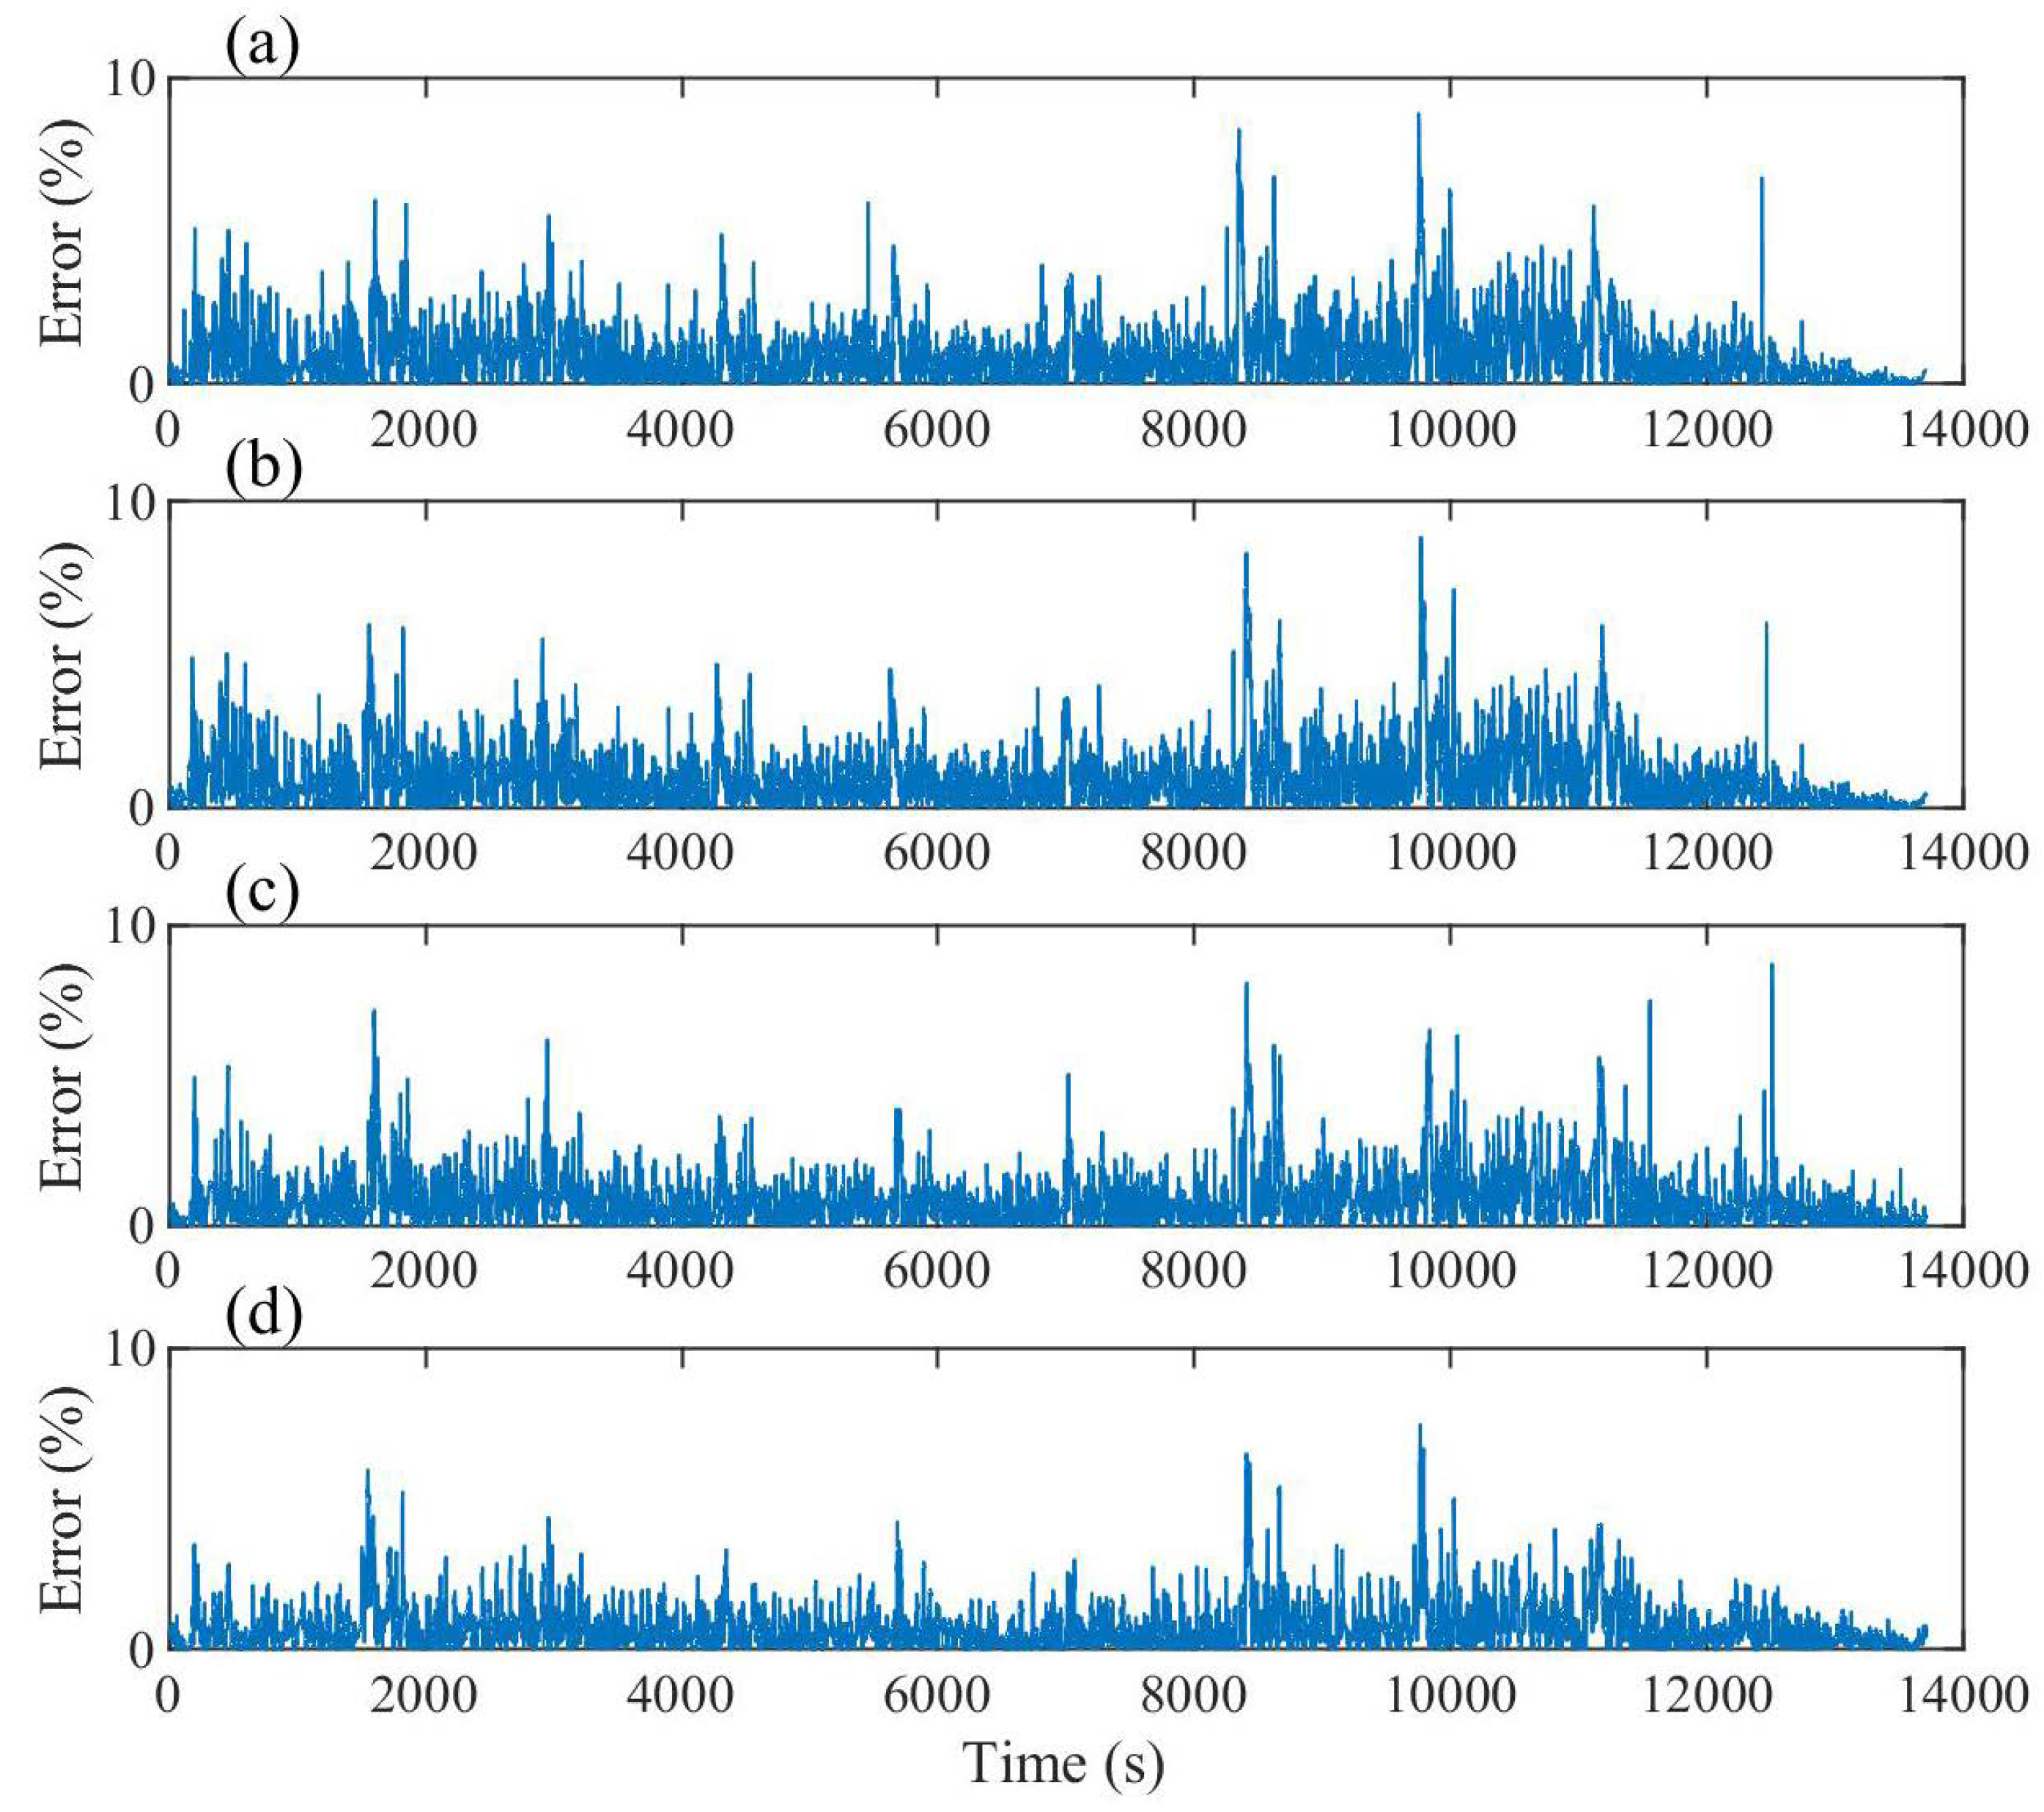
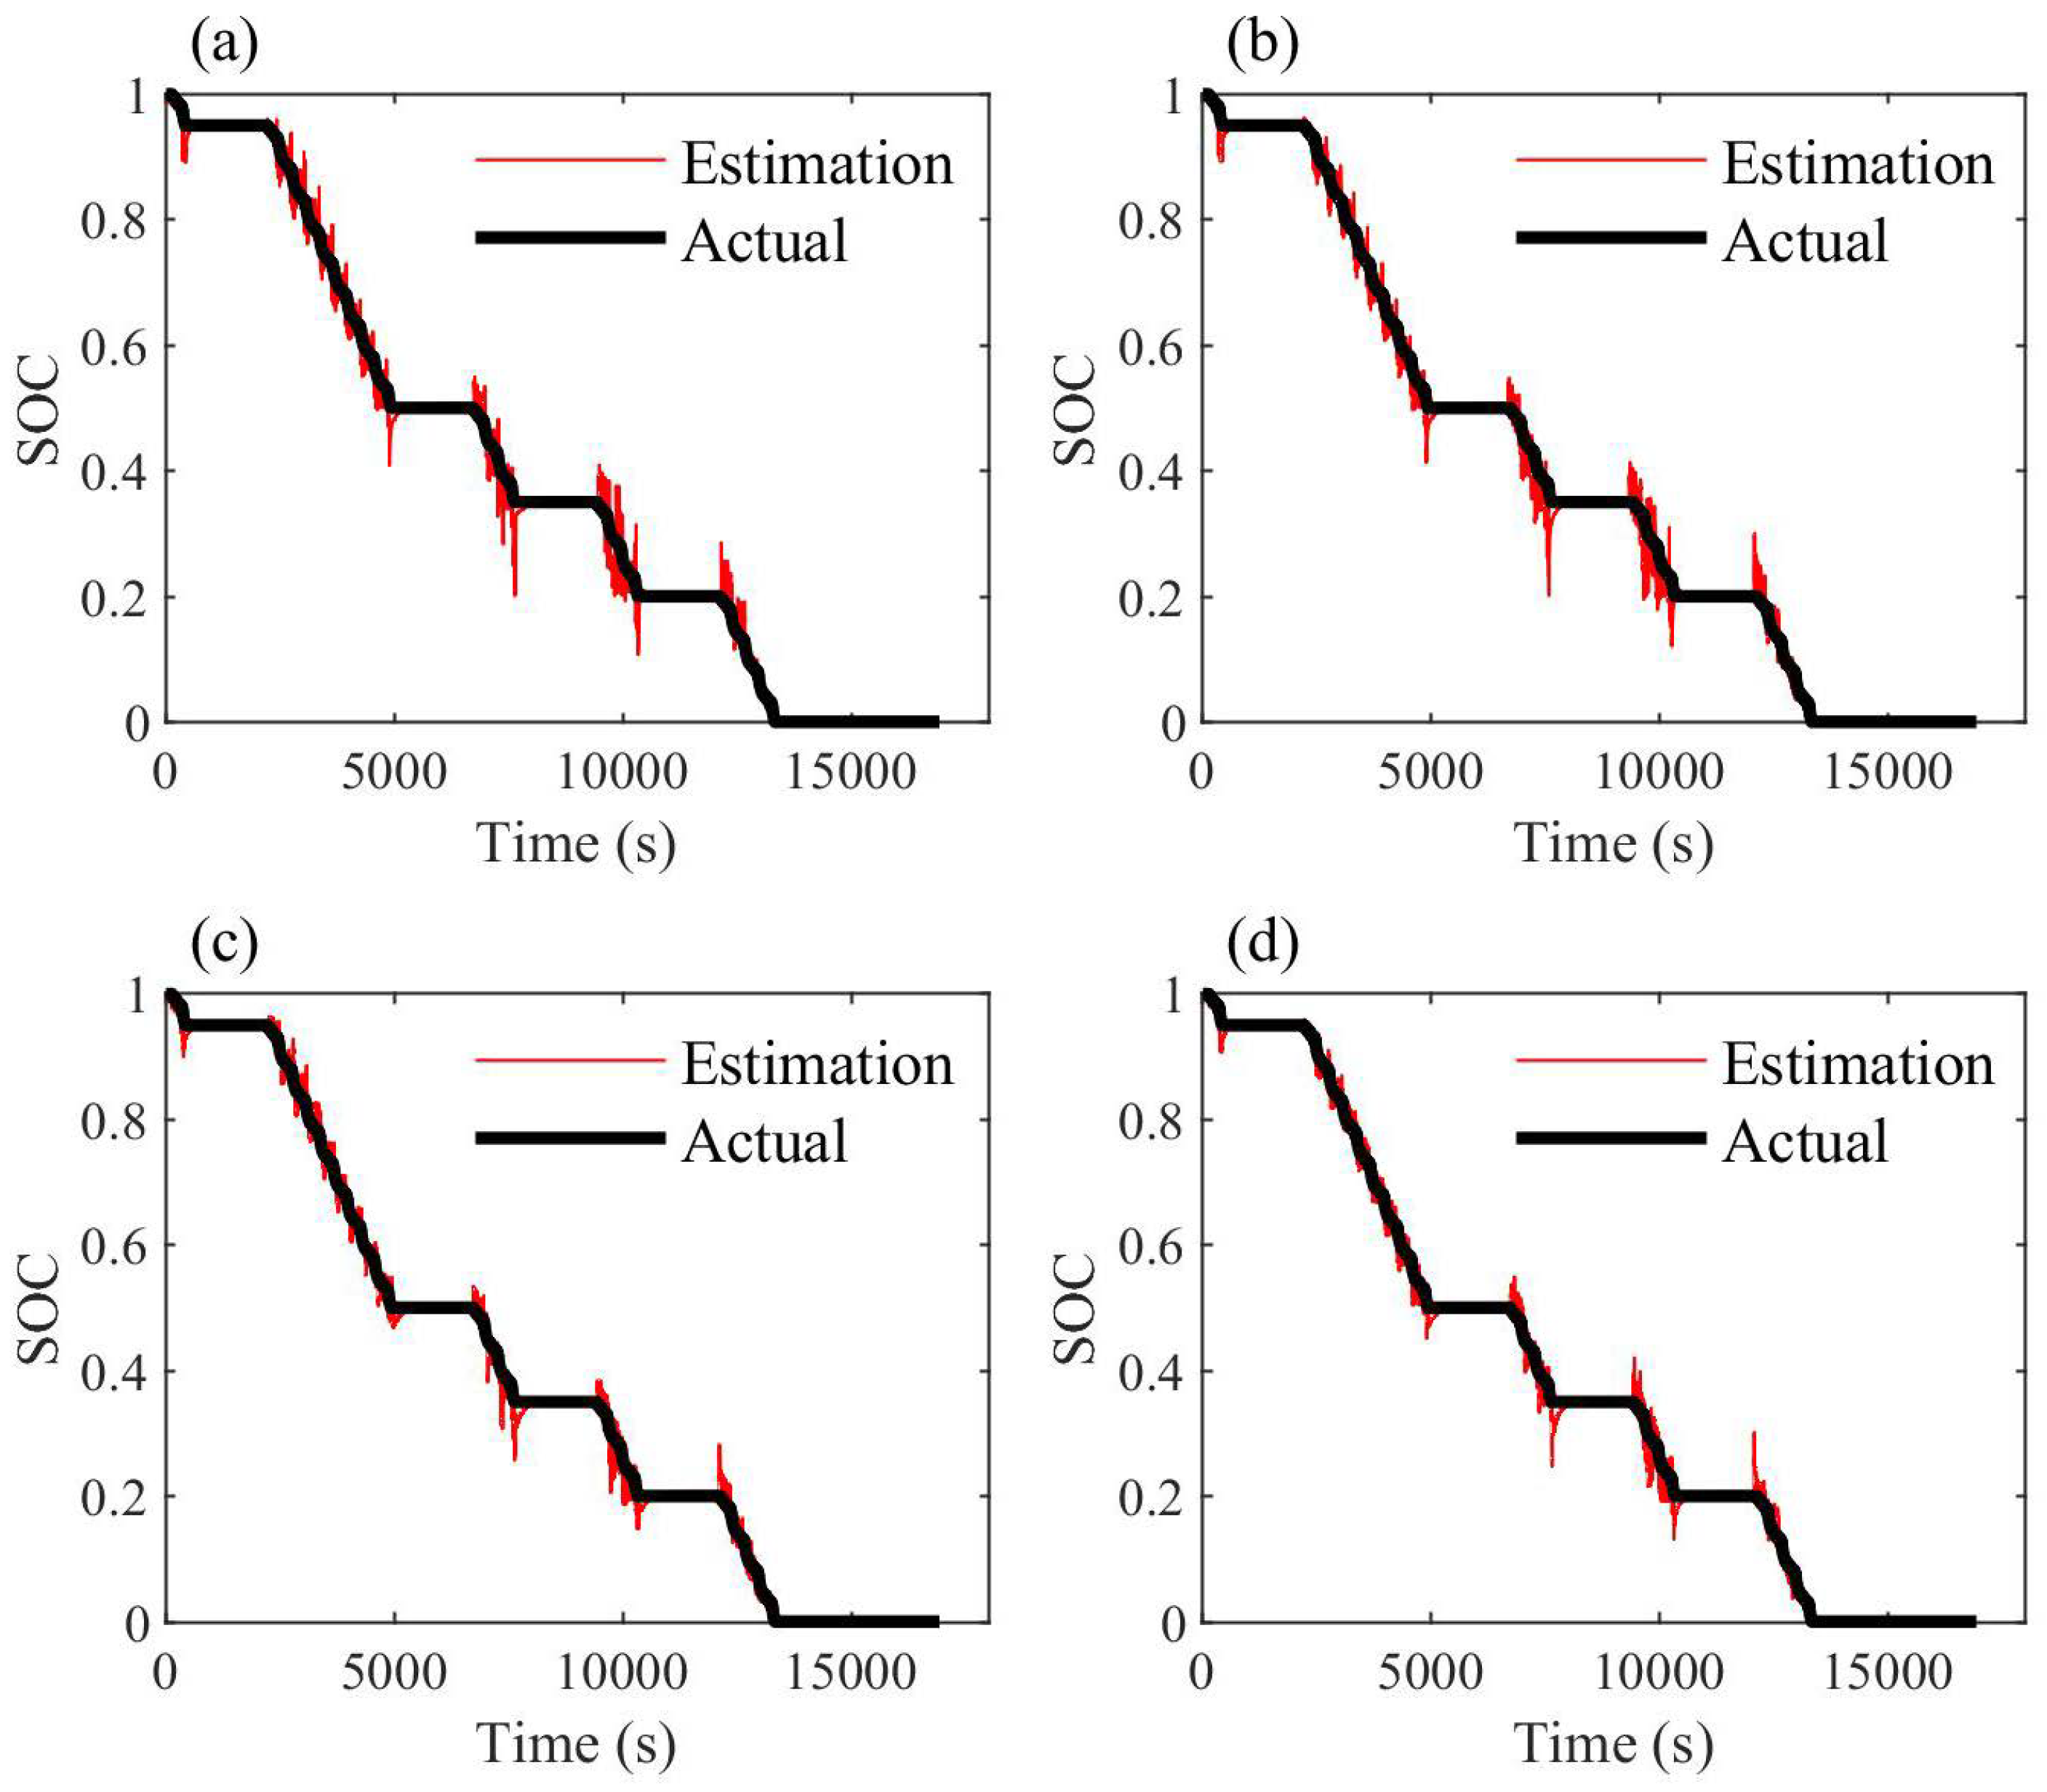
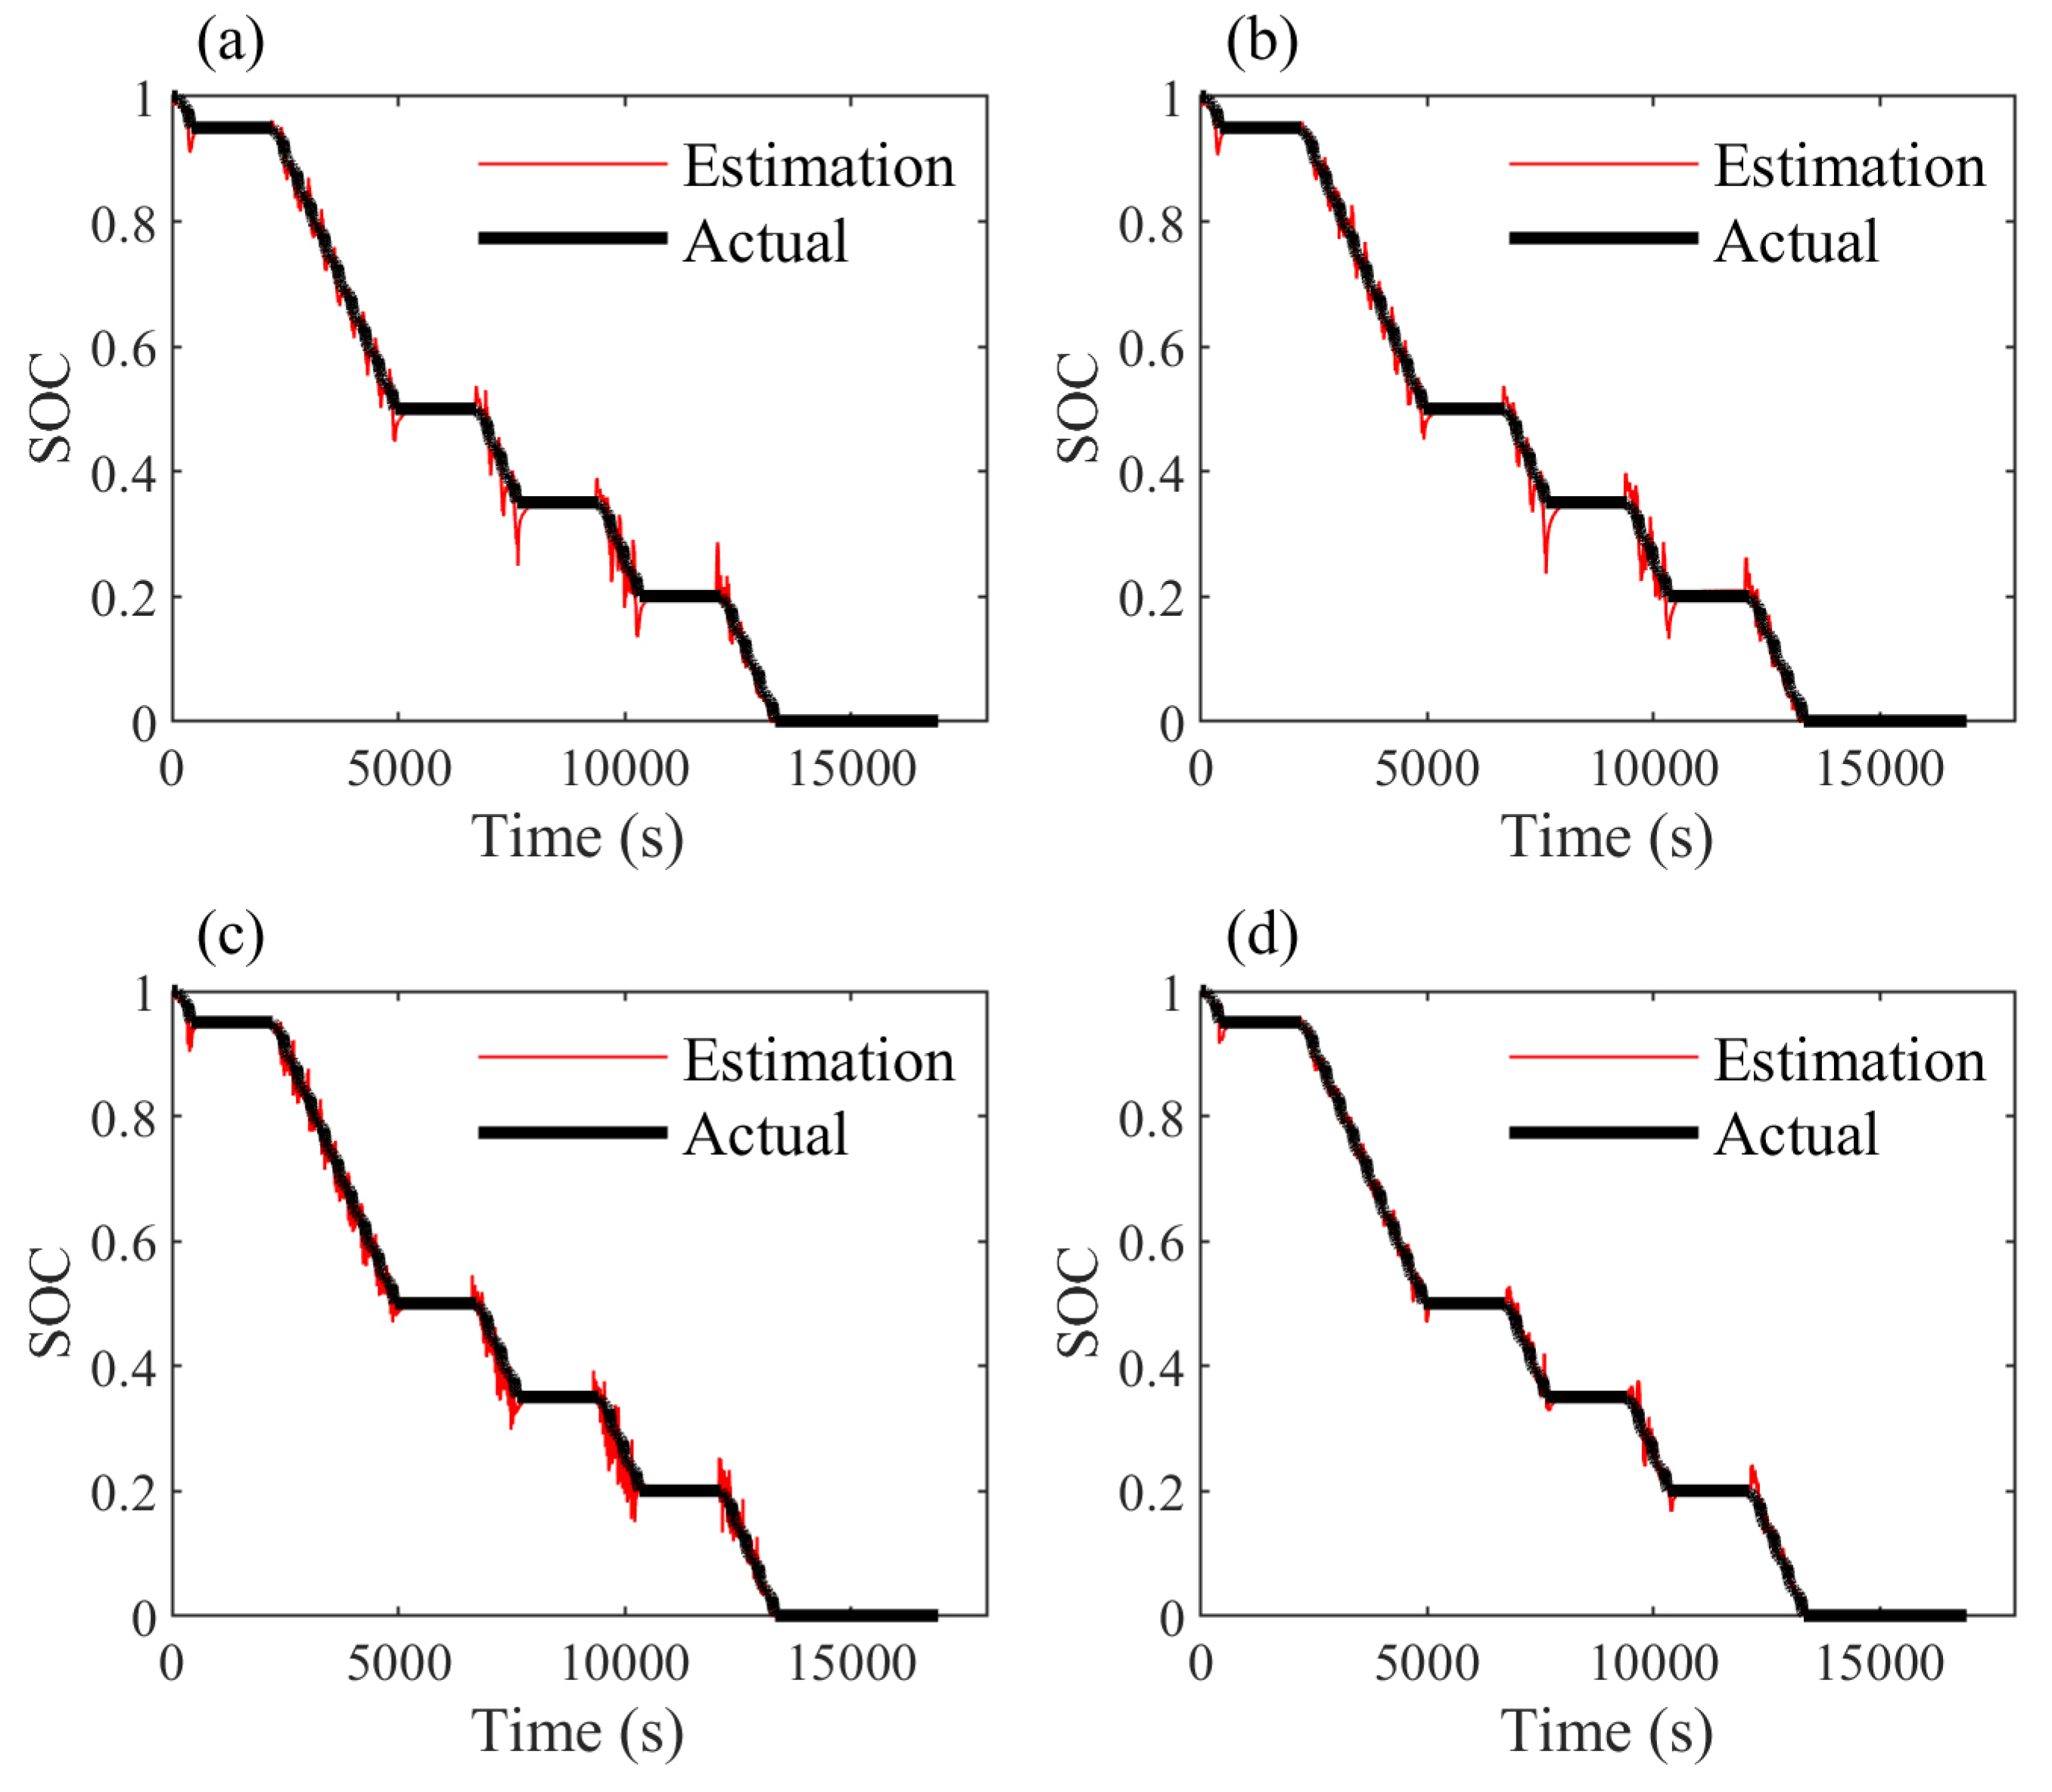
4. Experimental Results and Analysis

To train the neural network and test its prediction accuracy, the entire data sample was divided into a training set and a validation set. Seventy percent of the sample data points were randomly selected from the whole sample as the training set, and the rest were used as the validation set. Both the UDDS and DST discharge profiles were processed in this manner. Next, the current and voltage in the training and validation data sets from the UDDS and DST discharge profiles were processed using the wavelet transform introduced in Section 3. Then they were sent to the neural network for training and prediction. Each set of data and scale values were trained and predicted 100 times, and the neural network with the smallest error was used for comparison. When the composite multiscale wavelet transform method covered different maximum scales, the results of network training and prediction were also different. Therefore, four modes were used for comparison to test the performance of the proposed method. The first mode directly used current and voltage as inputs for the neural network, and the second model used the data processed by the composite multiscale wavelet transform with a maximum transformation scale of 1 as the input for the neural network. The maximum transformation scales used for processing data in the third and fourth modes were 2 and 3, respectively. The SOC estimation results and errors obtained using the UDDS discharge dataset are shown in Figure 7 and Figure 8, respectively. The SOC estimation results and errors obtained using the DST discharge dataset are shown in Figure 9 and Figure 10, respectively. The maximum error and mean squared error (MSE) results of the composite multiscale wavelet transformation are listed in Table 3.
Figure 7, Figure 8, Figure 9 and Figure 10 and Table 3 demonstrate that, as the maximum scale in the composite multiscale wavelet transform method increased, the accuracy of SOC estimation improved. Because this method requires current and historical measurement data, time-series neural networks that use the same principle were used for comparison [27,28,29]. Because the time delay parameters need to be assigned in temporal neural networks, the corresponding time delay parameter d was set as 2, 4, 8, and 16 according to the amount of data required for different levels of scale transformation in the composite multiscale wavelet transform method. When the UDDS and DST discharge data were used for the estimation, the results shown in Figure 11 and Figure 12, respectively, were generated. The corresponding MSE and maximum errors are shown in Table 4. The figures show that when the DST dataset was used, the estimation error of the time-series neural network increased significantly as the time delay parameter increased. This is because when d is set to a large value, the data in the training set causes the time-series neural network to be more suitable for the time-series characteristics of the training set, resulting in over-fitting. When the validation set is used for prediction, the time-series features of the validation set are different to the time-series features of the training set, and the estimation error becomes very large. The method proposed in this study does not lead to this problem.
However, as the scale increased, the length of the input data increased, which resulted in a greater delay in the output of the neural network. Therefore, a better balance between the accuracy and the transformation scale was necessary. Figure 13 and Figure 14 show the comparison between the maximum errors of the SOC estimation of the two discharge profiles using the composite multiscale wavelet transform method at different maximum scales. When the UDDS discharge data were used, the transformation scales of the current and voltage were 5, 6, and 7, and the maximum errors were 4.1 % , 2.1 % , and 1.1 % , respectively. Therefore, we can use 5 as the maximum transformation scale. When the current and voltage are recorded once per second, the SOC begins to output 32 s after the battery begins to be used (the fifth power of 2 is 32). This delay is acceptable for general battery SOC estimation applications. However, if the scale is too large (i.e., a value greater than 6), the output delay of the SOC is too large to be used in practice.

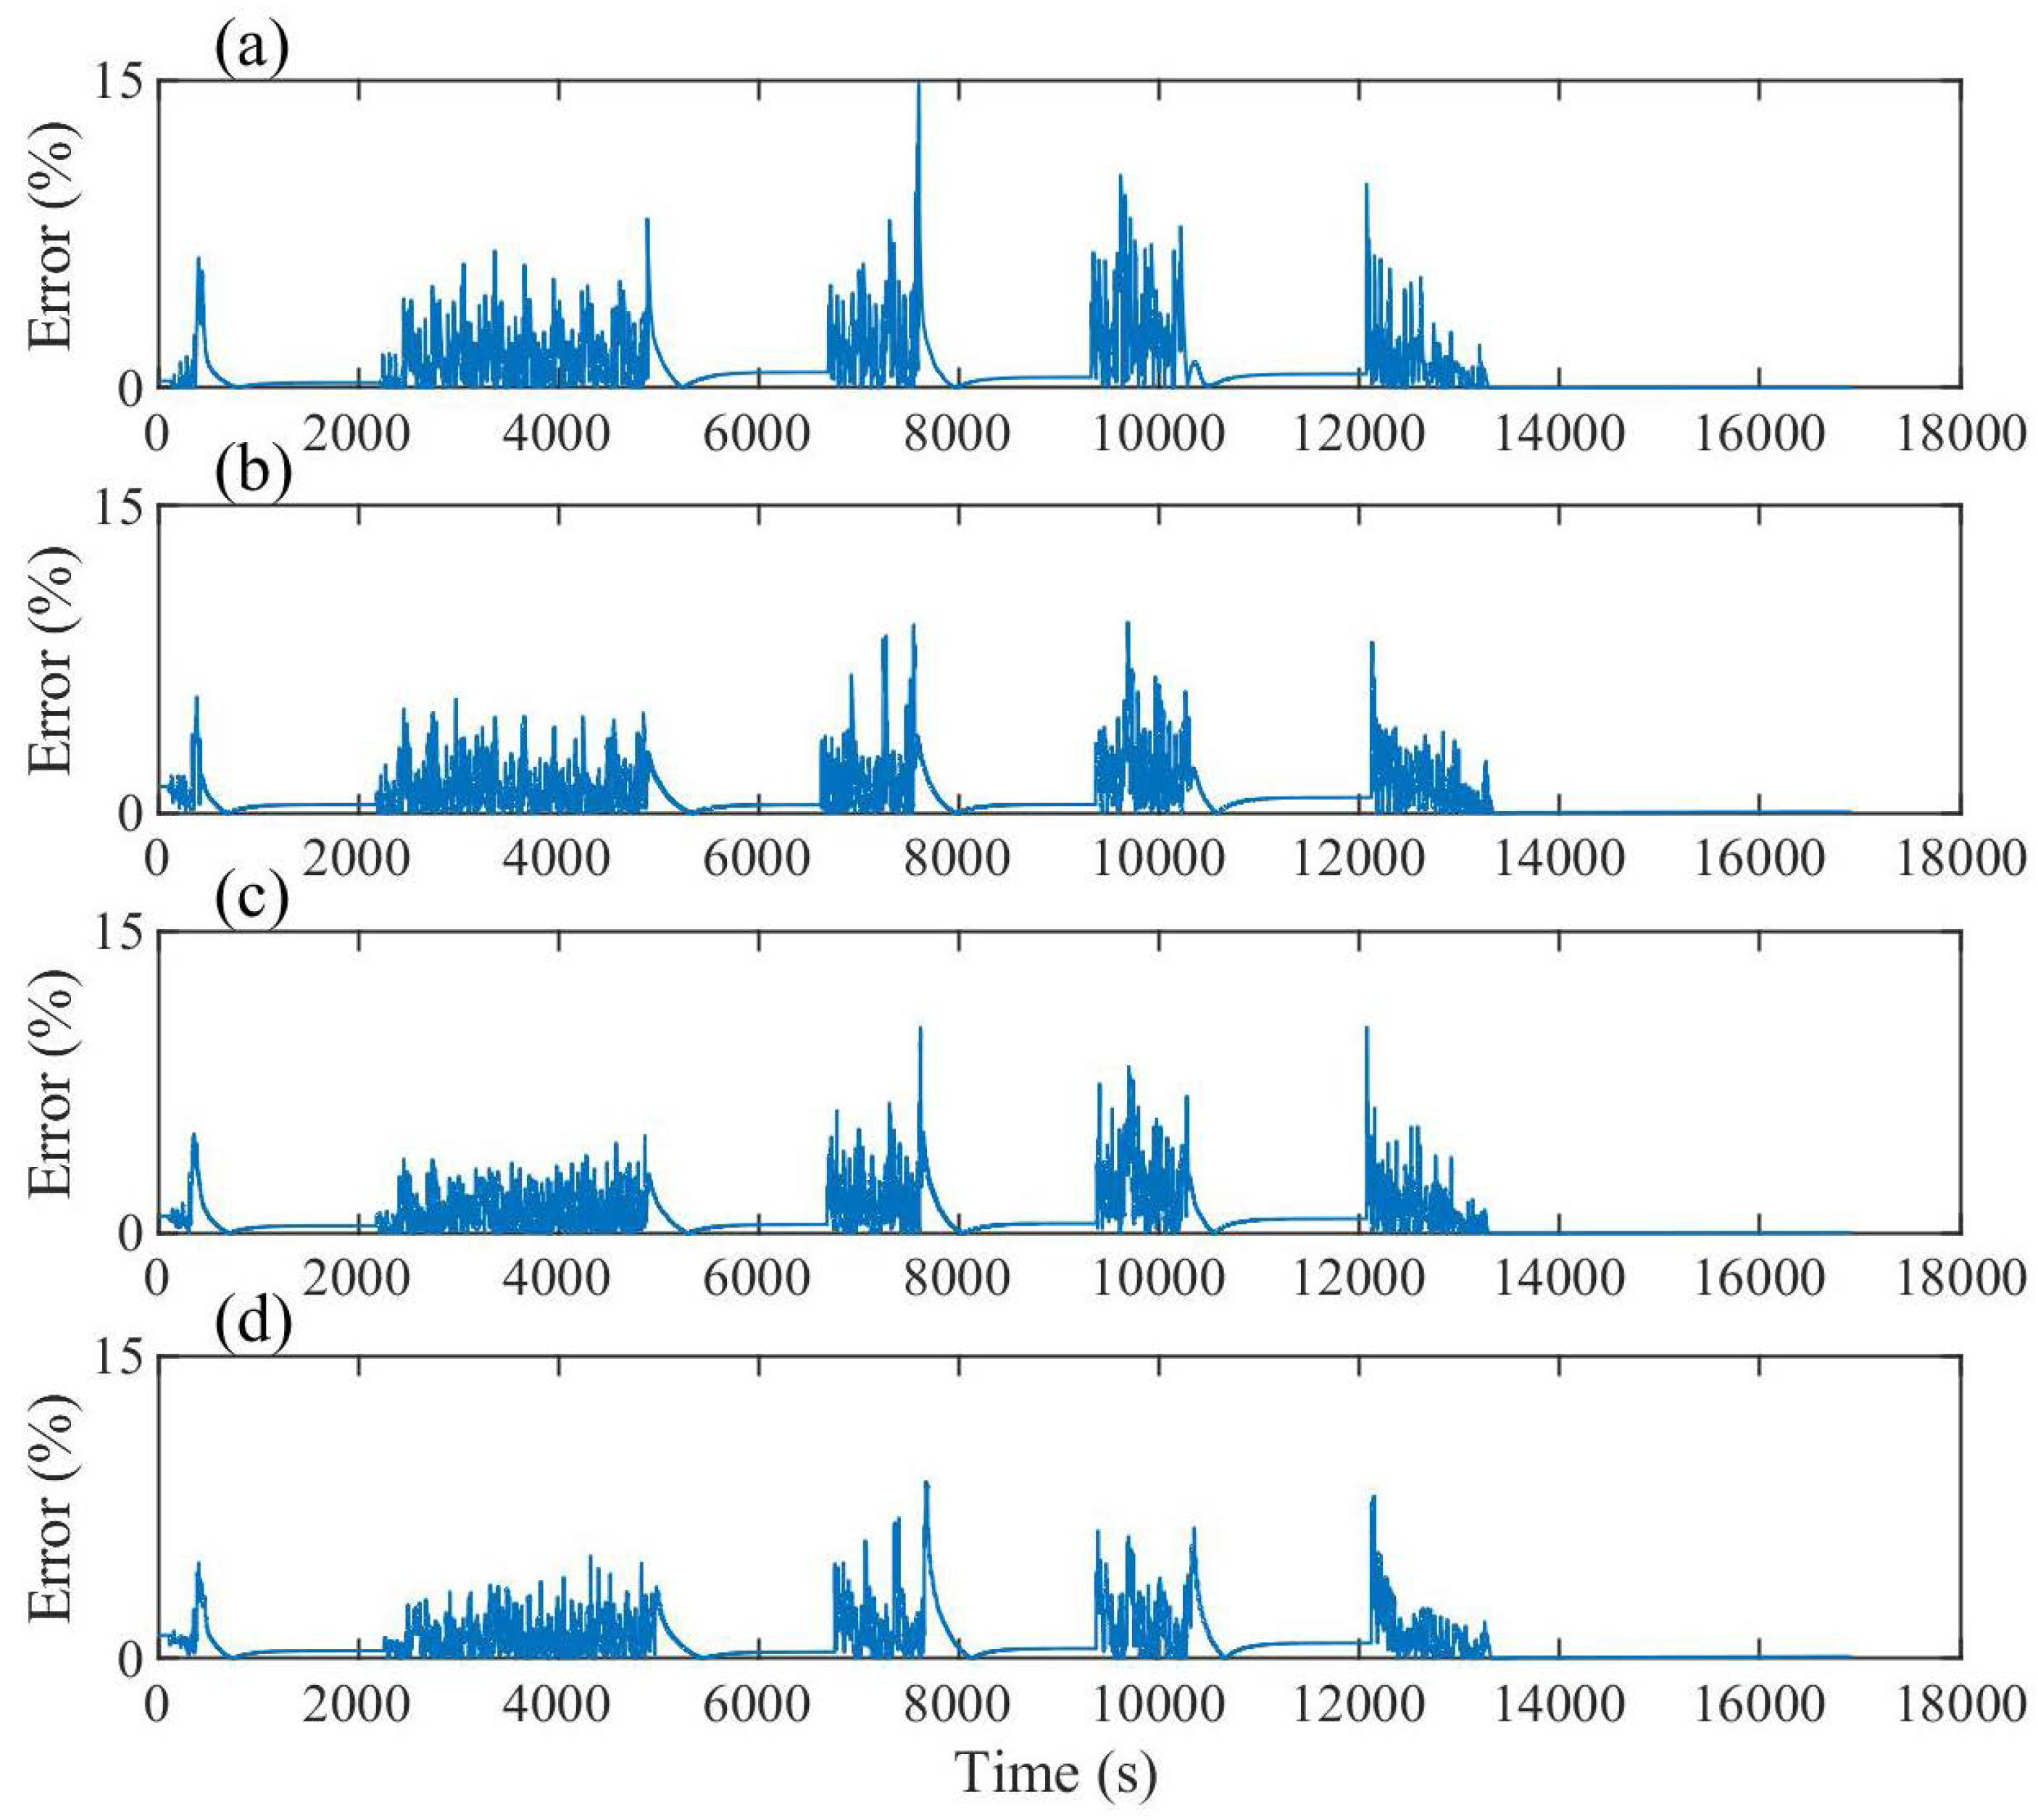
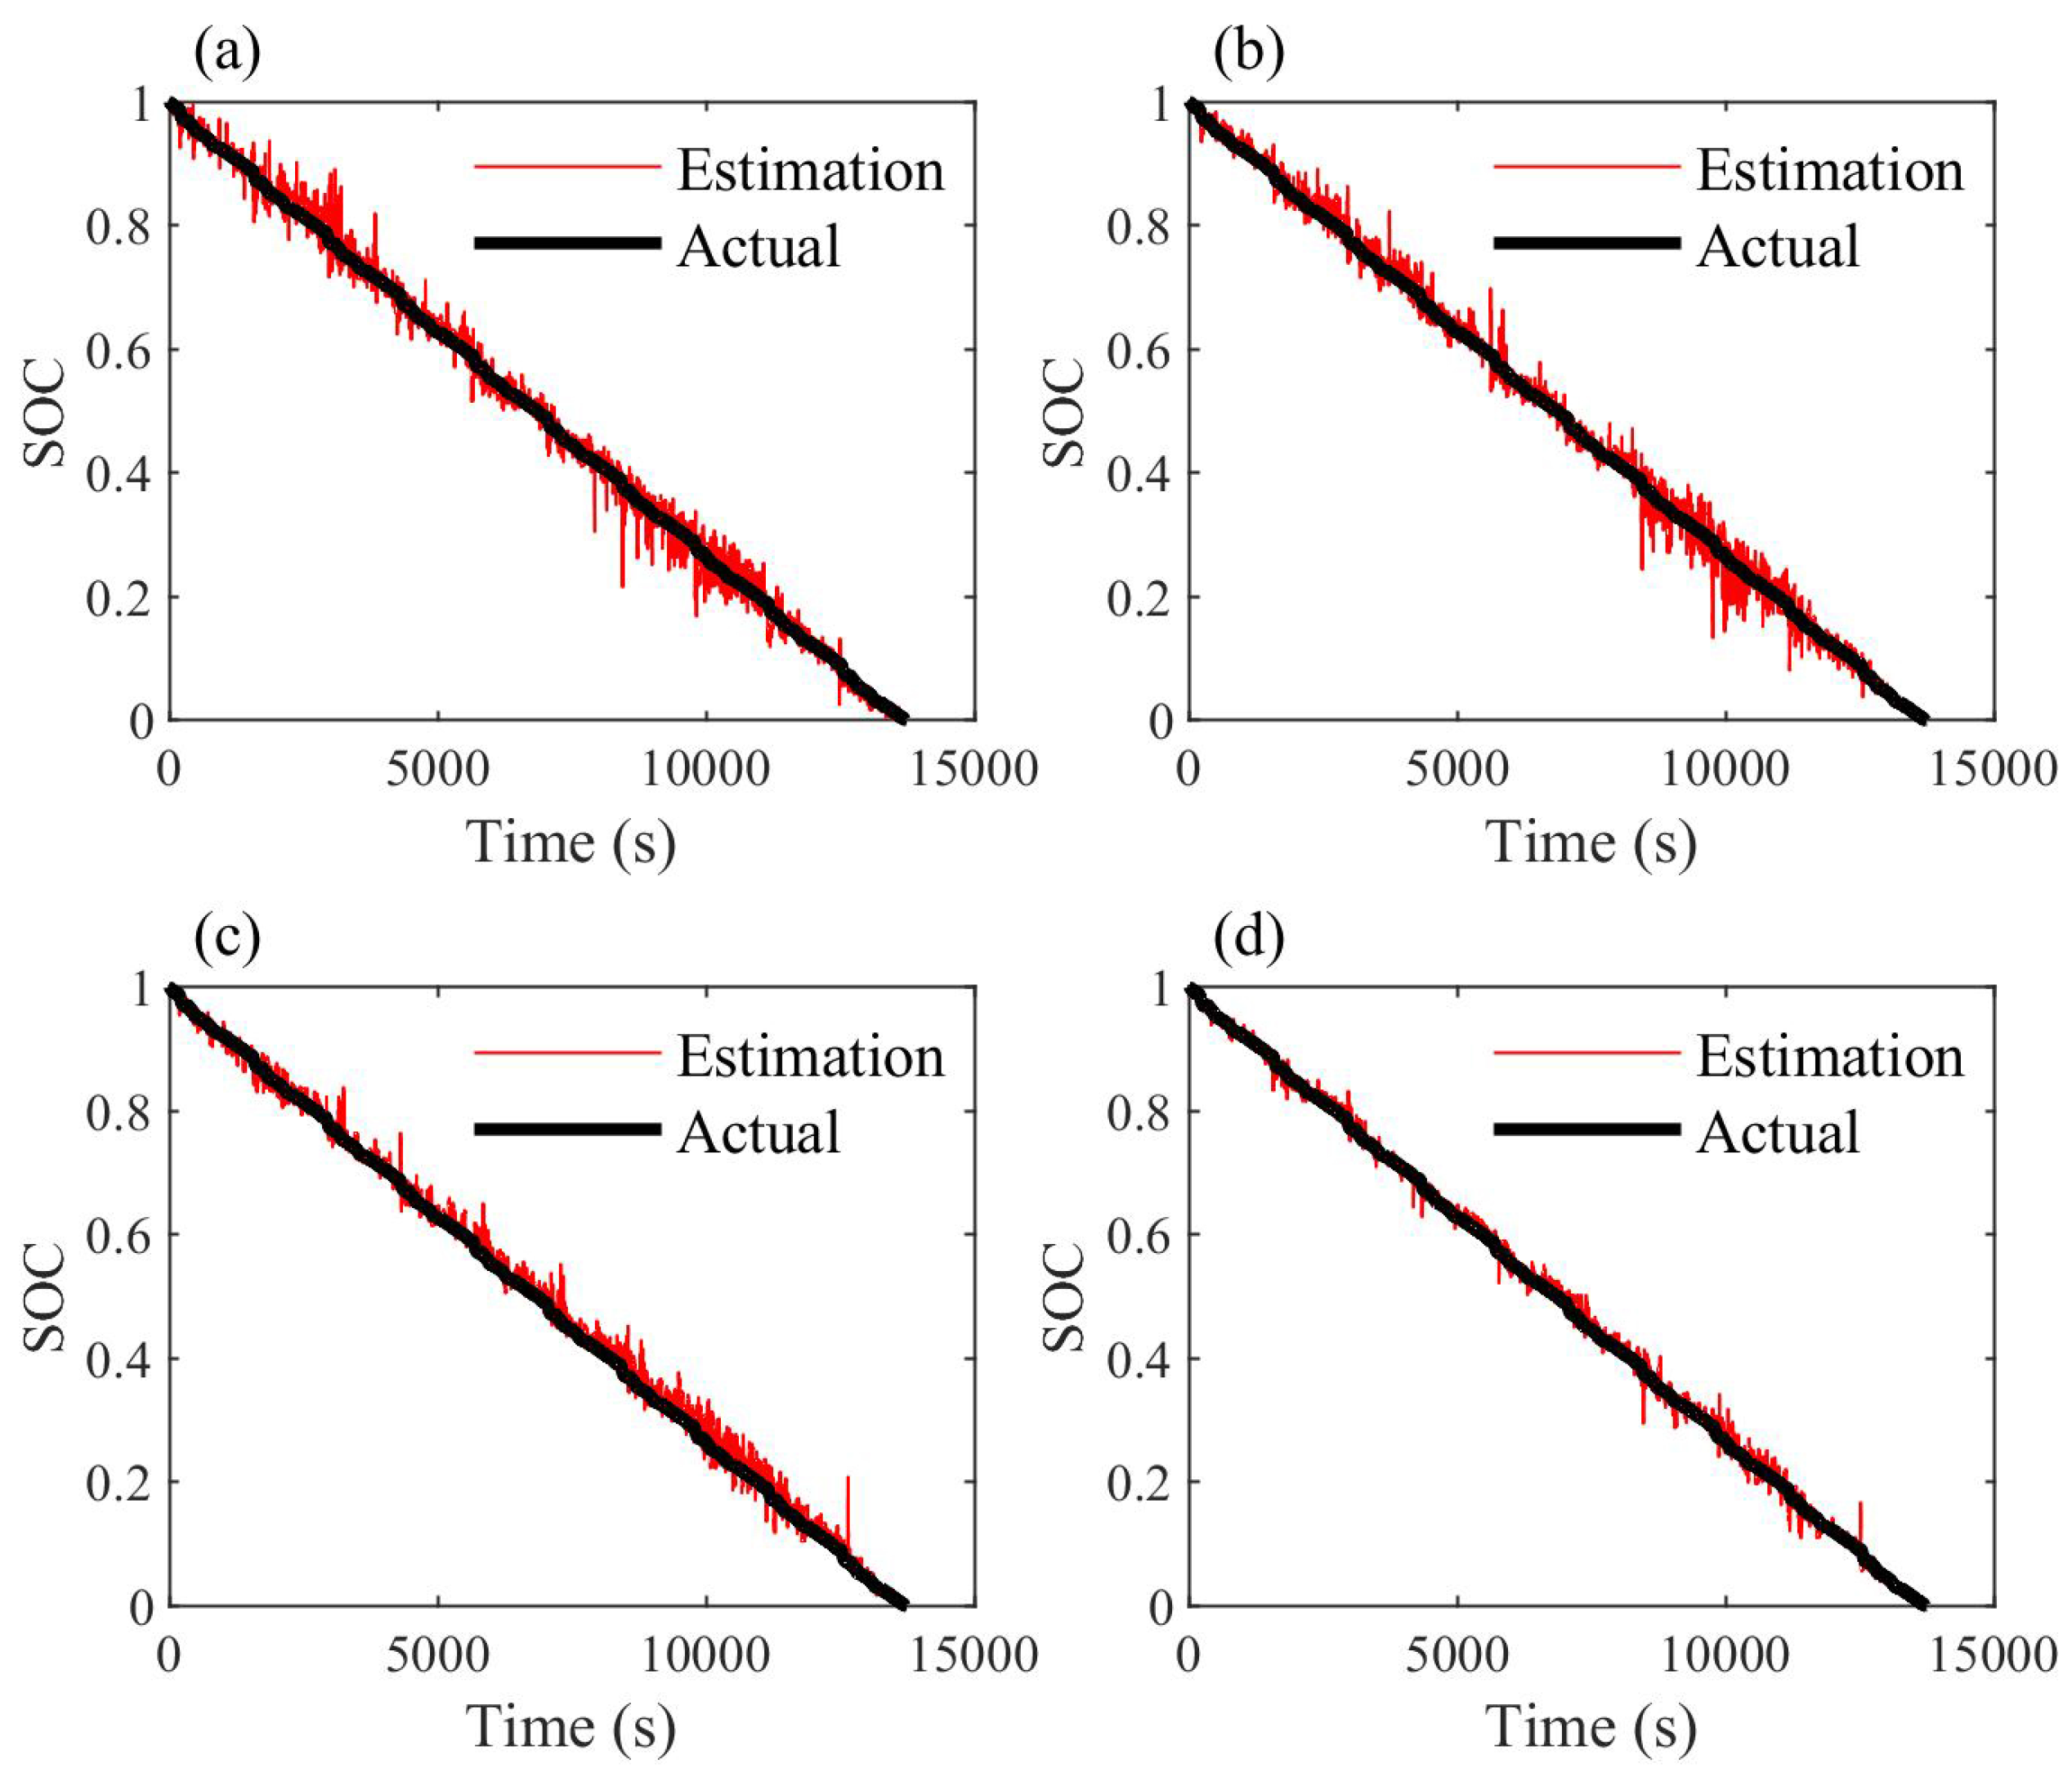
5. Method Validation and Comparison Study

As the method proposed in this study pre-processes the input of the neural network, it is independent of the specific neural network algorithm and structure that is employed. In order to prove the above point, the previously mentioned experiments were repeated. In the new experiments, the RBF neural network was used to replace the back propagation (BP) neural network without changing the other settings. The SOC estimation results are shown in Figure 15 and Figure 16. The maximum error and MSE are listed in Table 5. It can be seen from Figure 15 and Figure 16 and Table 5 that when the BP neural network was replaced with the RBF neural network in the experiment, the SOC prediction accuracy was also improved. In addition, the Figures demonstrate that when the proposed method was used, the estimation error decreased significantly as the transformation scale increased. Therefore, it can be concluded that this method, as a data pre-processing method, can be adapted to various neural networks.
In addition, in order to validate the performance of the proposed method, three other pre-processing methods based on the average values, moving average filter, and finite impulse response were utilized to perform a comparative study [30]. The current and voltage data were processed using the wavelet transform (scale = 5) and the three mentioned pre-processing methods. Since the scale of wavelet transform was set to five, at least 32 samples were required; for comparison, the input data length used by the three pre-processing methods was set to 32, as well. The SOC estimation results are shown in Figure 17 and Figure 18. The maximum error and MSE are listed in Table 6. It can be seen from Figure 17 and Figure 18 and Table 6 that if the above pre-processing methods are applied to the same BP neural network, the SOC prediction accuracies of all neural networks increases. When UDDS profile was used, the maximum error and MSE were 0.86 % and 4.1 % , respectively. The corresponding minimum values of the other methods were 0.91 % and 4.6 % , respectively. When the DST profile was applied for testing, the maximum error and MSE were 0.7 % and 5.5 % , respectively, and the corresponding minimum values of the other methods were 0.92 % and 6.7 % , respectively. In summary, the results significantly indicate that the proposed method has the best prediction accuracy. Moreover, the methods for SOC estimation are usually computationally demanding. The computational time determines whether the method can be implemented in the work condition. The computational time of different methods are shown in Table 7. The training time of the proposed method is larger than the compared methods; however, according to Table 7, the estimation time of the proposed method is less than 0.1 s, which means it can be deployed to an actual SOC estimation scenario.

6. Conclusions

In this study, the terminal current and terminal voltage in a battery were transformed by a wavelet transform, the results of which were used as the input to a neutral network that estimated the SOC. The experimental results for two discharge profiles, UDDS and DST, showed that the proposed method can obtain a higher estimation accuracy for the battery SOC. However, this method still contains problems that require further investigation. First, the larger the scale, the more accurate the estimation results; therefore, the scale should be maximized. However, it is difficult to guarantee the real-time output of the battery SOC estimation at a larger scale. Thus, in subsequent studies, it will be necessary to find an optimal balance between delay and accuracy. In addition, the delay can be decreased by increasing the sampling frequency, but this will result in a greater load on the software and hardware of the battery test bench. Second, because the composite multiscale wavelet transform method proposed in this study pre-processes the input of the neural network, it is independent of the specific neural network algorithm and structure that is employed. In theory, our method can also improve the accuracy of battery SOC estimation when applied to other neural networks. In addition to the feedforward and RBF neural networks used in this study, other types or structures of neural networks should be utilized to verify the proposed algorithm and improve the accuracy of battery SOC estimation further. The SOH of a battery is one of the important parameters affecting the accuracy of SOC estimation. In future work, this parameter will also be used as input for battery SOC estimation. Finally, the Haar wavelet is easy to implement in hardware, and therefore, the method proposed in this study is expected to be implemented on the embedded platform of the ARM processor architecture in subsequent works.

Author Contributions

Conceptualization, J.L.; methodology, Y.C.; software, Y.C.; investigation, Y.C.; data curation, X.Z. and X.W.; writing—original draft preparation, Y.C.; writing—review and editing, J.L. All authors have read and agreed to the published version of the manuscript.

Funding

This research was funded by the RESEARCH PROJECT OF THE HEBEI EDUCATION DEPARTMENT grant number ZD2021334. This research was funded by the NATIONAL NATURAL SCIENCE FOUNDATION OF CHINA grant number 12072203. This research was funded by the KEY RESEARCH AND DEVELOPMENT PROGRAM OF HEBEI PROVINCE grant number 20310101D.

Institutional Review Board Statement

Not applicable.

Informed Consent Statement

Not applicable.

Data Availability Statement

Not applicable.

Acknowledgments

This research was supported by the research project of the Hebei Education Department (grant no. ZD2021334), the National Natural Science Foundation of China (grant no. 12072203) and the Key Research and Development Program of Hebei Province (grant no. 20310101D).

Conflicts of Interest

The authors declare no conflict of interest.

References

  1. Xiong, X.; Wang, S.L.; Fernandez, C.; Yu, C.M.; Zou, C.Y.; Jiang, C. A novel practical state of charge estimation method: An adaptive improved ampere-hour method based on composite correction factor. Int. J. Energy Res. 2020, 44, 11385–11404. [Google Scholar] [CrossRef]
  2. Luo, Y.; Qi, P.; Huang, H.; Wang, J.; Wang, Y.; Li, P. Study on Battery SOC Estimation by Ampere-hour Integral Method with Capacity Correction. Automot. Eng. 2020, 42, 681–687. [Google Scholar] [CrossRef]
  3. Knap, V.; Stroe, D.I. Effects of open-circuit voltage tests and models on state-of-charge estimation for batteries in highly variable temperature environments: Study case nano-satellites. J. Power Sources 2021, 498, 229913. [Google Scholar] [CrossRef]
  4. Gong, D.; Gao, Y.; Kou, Y. Parameter and State of Charge Estimation Simultaneously for Lithium-Ion Battery Based on Improved Open Circuit Voltage Estimation Method. Energy Technol. 2021, 9, 2100235. [Google Scholar] [CrossRef]
  5. Malepati, B.S.; Vijay, D.; Deb, D.; Manjunath, K. Parameter validation to ascertain voltage of Li-ion battery through adaptive control. Adv. Intell. Syst. Comput. 2019, 757, 21–31. [Google Scholar] [CrossRef]
  6. Sun, L.; Li, G.; You, F. Combined internal resistance and state-of-charge estimation of lithium-ion battery based on extended state observer. Renew. Sustain. Energy Rev. 2020, 131, 109994. [Google Scholar] [CrossRef]
  7. Lin, X.; Tang, Y.; Ren, J.; Wei, Y. State of charge estimation with the adaptive unscented Kalman filter based on an accurate equivalent circuit model. J. Energy Storage 2021, 41, 102840. [Google Scholar] [CrossRef]
  8. Fang, Y.; Zhang, Q.; Zhang, H.; Xu, W.; Wang, L.; Shen, X.; Yun, F.; Cui, Y.; Wang, L.; Zhang, X. State-of-charge estimation technique for lithium-ion batteries by means of second-order extended Kalman filter and equivalent circuit model: Great temperature robustness state-of-charge estimation. IET Power Electron. 2021, 14, 1515–1528. [Google Scholar] [CrossRef]
  9. Jiang, C.; Wang, S.; Wu, B.; Fernandez, C.; Xiong, X.; Coffie-Ken, J. A state-of-charge estimation method of the power lithium-ion battery in complex conditions based on adaptive square root extended Kalman filter. Energy 2021, 219, 119603. [Google Scholar] [CrossRef]
  10. Khan, H.F.; Hanif, A.; Ali, M.U.; Zafar, A. A Lagrange multiplier and sigma point Kalman filter based fused methodology for online state of charge estimation of lithium-ion batteries. J. Energy Storage 2021, 41, 102843. [Google Scholar] [CrossRef]
  11. Xiao, F.; Li, C.; Fan, Y.; Yang, G.; Tang, X. State of charge estimation for lithium-ion battery based on Gaussian process regression with deep recurrent kernel. Int. J. Electr. Power Energy Syst. 2021, 124, 106369. [Google Scholar] [CrossRef]
  12. Deng, Z.; Hu, X.; Lin, X.; Che, Y.; Xu, L.; Guo, W. Data-driven state of charge estimation for lithium-ion battery packs based on Gaussian process regression. Energy 2020, 205, 118000. [Google Scholar] [CrossRef]
  13. Dhiman, H.S.; Deb, D.; Muyeen, S.M. Lithium-Ion Battery Prognostics based on Support Vector Regression and Time-Series Analysis. In Proceedings of the 2021 IEEE 4th International Conference on Computing, Power and Communication Technologies, GUCON 2021, Kuala Lumpur, Malaysia, 24–26 September 2021. [Google Scholar] [CrossRef]
  14. Chen, J.; Feng, X.; Jiang, L.; Zhu, Q. State of charge estimation of lithium-ion battery using denoising autoencoder and gated recurrent unit recurrent neural network. Energy 2021, 227, 120451. [Google Scholar] [CrossRef]
  15. Tian, J.; Xiong, R.; Shen, W.; Lu, J. State-of-charge estimation of LiFePO4 batteries in electric vehicles: A deep-learning enabled approach. Appl. Energy 2021, 291, 116812. [Google Scholar] [CrossRef]
  16. Zhang, L.; Zheng, M.; Du, D.; Li, Y.; Fei, M.; Guo, Y.; Li, K. State-of-charge estimation of lithium-ion battery pack based on improved RBF neural networks. Complexity 2020, 2020, 8840240. [Google Scholar] [CrossRef]
  17. Guo, Y.; Yang, Z.; Liu, K.; Zhang, Y.; Feng, W. A compact and optimized neural network approach for battery state-of-charge estimation of energy storage system. Energy 2021, 219, 119529. [Google Scholar] [CrossRef]
  18. Zhao, X.; Xuan, D.; Zhao, K.; Li, Z. Elman neural network using ant colony optimization algorithm for estimating of state of charge of lithium-ion battery. J. Energy Storage 2020, 32, 101789. [Google Scholar] [CrossRef]
  19. Feng, X.; Chen, J.; Zhang, Z.; Miao, S.; Zhu, Q. State-of-charge estimation of lithium-ion battery based on clockwork recurrent neural network. Energy 2021, 236, 121360. [Google Scholar] [CrossRef]
  20. Patel, P.; Shandilya, A.; Deb, D. Optimized hybrid wind power generation with forecasting algorithms and battery life considerations. In Proceedings of the 2017 IEEE Power and Energy Conference at Illinois, PECI 2017, Champaign, IL, USA, 23–24 February 2017. [Google Scholar] [CrossRef]
  21. Patel, P.; Deb, D. Battery state of charge based algorithm for optimal wind farm power management. In Proceedings of the 2017 6th International Conference on Computer Applications in Electrical Engineering-Recent Advances, CERA 2017, Roorkee, India, 5–7 October 2017; pp. 42–46. [Google Scholar] [CrossRef]
  22. Wang, Q.; Gu, H.; Ye, M.; Wei, M.; Xu, X. State of Charge Estimation for Lithium-Ion Battery Based on NARX Recurrent Neural Network and Moving Window Method. IEEE Access 2021, 9, 83364–83375. [Google Scholar] [CrossRef]
  23. Bian, X.; Wei, Z.G.; Li, W.; Pou, J.; Sauer, D.U.; Liu, L. State-of-Health Estimation of Lithium-Ion Batteries by Fusing an Open Circuit Voltage Model and Incremental Capacity Analysis. IEEE Trans. Power Electron. 2022, 37, 2226–2236. [Google Scholar] [CrossRef]
  24. Yu, J.; Mo, B.; Tang, D.; Yang, J.; Wan, J.; Liu, J. Indirect State-of-Health Estimation for Lithium-Ion Batteries under Randomized Use. Energies 2017, 10, 2012. [Google Scholar] [CrossRef] [Green Version]
  25. Da Rosa, M.M.; Seidel, H.B.; Paim, G.; Da Costa, E.A.; Almeida, S.; Bampi, S. An Energy-Efficient Haar Wavelet Transform Architecture for Respiratory Signal Processing. IEEE Trans. Circuits Syst. II Express Briefs 2021, 68, 597–601. [Google Scholar] [CrossRef]
  26. Cao, L.; Li, H.; Zhang, Y.; Zhang, L.; Xu, L. Hierarchical method for cataract grading based on retinal images using improved Haar wavelet. Inf. Fusion 2020, 53, 196–208. [Google Scholar] [CrossRef]
  27. Chaoui, H.; Ibe-Ekeocha, C.C.; Gualous, H. Aging prediction and state of charge estimation of a LiFePO4 battery using input time-delayed neural networks. Electr. Power Syst. Res. 2017, 146, 189–197. [Google Scholar] [CrossRef]
  28. Shao, Y.E.; Lin, S.C. Using a time delay neural network approach to diagnose the out-of-control signals for a multivariate normal process with variance shifts. Mathematics 2019, 7, 959. [Google Scholar] [CrossRef] [Green Version]
  29. Hossain Lipu, M.S.; Hannan, M.A.; Hussain, A.; Ayob, A.; Saad, M.H.; Muttaqi, K.M. State of charge estimation in lithium-ion batteries: A neural network optimization approach. Electronics 2020, 9, 1546. [Google Scholar] [CrossRef]
  30. Hossain Lipu, M.S.; Hannan, M.A.; Hussain, A.; Ayob, A.; Saad, M.H.; Karim, T.F.; How, D.N. Data-driven state of charge estimation of lithium-ion batteries: Algorithms, implementation factors, limitations and future trends. J. Clean. Prod. 2020, 277, 124110. [Google Scholar] [CrossRef]
Figure 1. Battery test bench: (a) monitor computer, (b) battery test apparatus, and (c) temperature chamber.
Energies 15 02064 g001
Figure 2. Current and voltage of the UDDS profile.
Energies 15 02064 g002
Figure 3. Current and voltage of the DST profile.
Energies 15 02064 g003
Figure 4. Diagram of the wavelet filtering pro-cessing module.
Energies 15 02064 g004
Figure 5. Diagram of the multiscale wavelet transform decomposition process.
Energies 15 02064 g005
Figure 6. SOC estimation method.
Energies 15 02064 g006
Figure 7. SOC estimation results for the UDDS profile in the four modes: (a) first mode, (b) second mode, (c) third mode, and (d) fourth mode.
Energies 15 02064 g007
Figure 8. SOC estimation error of the UDDS profile in the four modes: (a) first mode, (b) second mode, (c) third mode, and (d) fourth mode.
Energies 15 02064 g008
Figure 9. SOC estimation results for the DST profile in the four modes: (a) first mode, (b) second mode, (c) third mode, and (d) fourth mode.
Energies 15 02064 g009
Figure 10. SOC estimation error of the DST profile in the four modes: (a) first mode, (b) second mode, (c) third mode, and (d) fourth mode.
Energies 15 02064 g010
Figure 11. SOC estimation results for the UDDS profile generated by using a time-series neural network with different time delay parameters: (a) d = 2, (b) d = 4, (c) d = 8, and (d) d = 16.
Energies 15 02064 g011
Figure 12. SOC estimation results for the DST profile generated by using a time-series neural network with different time delay parameters: (a) d = 2, (b) d = 4, (c) d = 8, and (d) d = 16.
Energies 15 02064 g012
Figure 13. Maximum estimation error for different transformation scales (UDDS).
Energies 15 02064 g013
Figure 14. Maximum estimation error for different transformation scales (DST).
Energies 15 02064 g014
Figure 15. SOC estimation results correct. for the UDDS profile in the four modes (using RBF): (a) first mode, (b) second mode, (c) third mode, and (d) fourth mode.
Energies 15 02064 g015
Figure 16. SOC estimation results for the DST profile in the four modes (using RBF): (a) first mode, (b) second mode, (c) third mode, and (d) fourth mode.
Energies 15 02064 g016
Figure 17. SOC estimation results for the UDDS profile with different pre-process methods: (a) average values, (b) moving average filter, (c) finite impulse response, and (d) wavelet transform.
Energies 15 02064 g017
Figure 18. SOC estimation results for the DST profile with different pre-process methods: (a) average values, (b) moving average filter, (c) finite impulse response, and (d) wavelet transform.
Energies 15 02064 g018
Table 1. Basic specifications of the Samsung 18650 battery.
Nominal VoltageNominal CapacityWorking VoltageMaximum Current
3.6 V1.5 Ah2.5–4.2 V15 A (20 C)
Table 2. Training parameters of the neural network.
ParameterValue
Input node numberApproximate parameters and detail parameters after wavelet transform
Hidden node number32
Output node number1(SOC)
Termination conditionMSE = 10 6
Activation functionLog-Sigmoid
Training algorithmLevenberg–Marquardt Algorithm
Termination generation2000
Table 3. Training parameters of the neural network.
Neutral Network Mode UDDS DST
MSEMaximumMSEMaximum
First mode1.888.85%2.3614.90%
Second mode1.718.80%2.369.30%
Third mode1.58.70%1.5410.20%
Fourth mode1.157.50%1.388.70%
Table 4. Maximum error and MSE of the two profiles generated by using a time-series neural network with different time delay parameters.
ProfilesTimed DelayMSEMaximum
UDDS22.7116.56%
43.1214.30%
82.6712.20%
161.269.20%
DST21.925.96%
43.740.09%
86.1539.34%
165.1346.96%
Table 5. Training parameters of the neural network.
RBF Neutral Network ModeUDDSDST
MSEMaximumMSEMaximum
First mode2.039.60%2.8415.20%
Second mode1.968.41%2.089.00%
Third mode2.437.85%1.028.70%
Fourth mode2.256.19%1.568.00%
Table 6. Maximum error and MSE of two profiles with different pre-processing methods.
Pre-Processing MethodUDDSDST
MSEMaximumMSEMaximum
Average value0.914.60%1.7810.00%
Moving average filter0.985.80%2.111.30%
Finite impulse response0.976.30%0.926.70%
Wavelet transform0.864.10%0.75.50%
Table 7. Computational time of different pre-processing methods.
Pre-Processing MethodUDDSDST
Training
Time (s)
Estimation
Time (s)
Training
Time (s)
Estimation
Time (s)
Average value14.930.04514.760.047
Moving average filter12.210.04714.620.054
Finite impulse response23.620.06228.820.071
Wavelet transform22.830.06027.750.093
Publisher’s Note: MDPI stays neutral with regard to jurisdictional claims in published maps and institutional affiliations.

