Article

Moisture Transfer Characteristics and Kinetics Determination for Insulated Paperboard in Hot-Pressing Process

Department of Mechanical and Electrical Engineering, Shaanxi University of Science and Technology, Xi’an 710021, China
*
Author to whom correspondence should be addressed.
Energies 2022, 15(6), 2069; https://doi.org/10.3390/en15062069
Submission received: 7 February 2022 / Revised: 5 March 2022 / Accepted: 7 March 2022 / Published: 11 March 2022
(This article belongs to the Special Issue Fundamentals and Applications of Multiphase Flow and Heat Transfer)

Abstract

:
The transport characteristics and kinetics of moisture in hot-pressing are crucial to controlling the insulated paperboard drying process. The effects of operating temperature (110, 120, and 130 °C) on moisture transfer characteristics of an insulated paperboard were investigated. The results showed that the hot-pressing process consists of four successive stages, i.e., the warm-up stage, the boiling-point temperature stabilization stage, the temperature slowly rising stage, and the constant temperature stage. It was observed that a higher temperature mainly affected the medium and later stages of the hot-pressing process. When the operating temperature increased from 110 to 130 °C, the maximum value of the drying rate increased by 16.04%, and the drying time decreased by 62.50% consequently. Furthermore, a new mathematical model used to describe the moisture transfer kinetics for the insulated paperboard hot-pressing was developed in this paper. The results from the proposed new model were evaluated with another eight commonly used models. It showed better predictions and satisfactorily described the moisture transfer kinetics of the insulated paperboard compared with other models under the investigated hot-pressing conditions. The values of R2, χ2, and root mean square error (RMSE) of the new model varied from 0.99961 to 0.99999, 0.00001 to 0.00005, and 0.00120 to 0.00599, respectively.

1. Introduction

Electrically insulated papers or paperboards are made from cotton, linen, and kraft pulp or a mixture of these pulps [1,2]. Cellulose is the essential component of paper and pressboard [3]. The chief disadvantage of cellulosic material for electrical use is that it is hygroscopic and needs to be processed and maintained dry. The dry-out is worth the effort because dry cellulosic insulation has excellent dielectric properties. In the papermaking process, the web of wet fiber mats is dried mechanically and thermally between hot heated plates [4]. With the combined action of heat conduction and mechanical pressure, hot-press drying can not only effectively enhance the drying efficiency but also improve the physical properties of the insulated paperboard dramatically.
The insulated paperboard is commonly used in electric motors, power meters and transformers, and related fields [5]. Due to the high availability combined with a low price, excellent insulation performance in the dry state, and satisfying mechanical properties at elevated temperatures in comparison to synthetic materials [6], worldwide, several million tons of pulp is processed into insulating materials for the electrical power industry [7], making it a continuously important business field for the pulp and paper industry.
The hot-press drying process of the insulated paperboard involves simultaneous and multiphase coupled heat and mass transfer phenomena. Many researchers have introduced the hot-press drying process and its characteristics in the literature. Ribeiro et al. [8] developed a heat and mass transfer model of the hot-pressing process in paper production to understand the transport phenomena involved in drying. Wu et al. [6] used hot-press drying to improve the properties of poplar wood and found the drying rate was faster, and the properties of timber were also clearly enhanced. Hou et al. [9] investigated the effect of heating temperature on the temperature and pressure inside poplar lumber. They found that the maximum values of temperature and pressure could be enhanced by 14.5% and 26.2%, respectively, when the heating temperature increased from 120 to 140 ℃, Tang et al. [10] put forward a numerical model for heat and mass transfer of wood hot-press drying. Han et al. [11] concluded that the final moisture content of 10 veneers still had a significant difference, while the range had reduced from 10.62% to 3.56% when investigating different eucalyptus veneers hot-pressing. Ribeiro et al. [12] studied the effect of different hot-pressing temperatures on the particleboard properties and found that excessive temperature causes changes in the mechanical properties of the panel, thereby reducing product quality.
Although hot-pressing is one of the most complex drying processes, the establishment of mathematical models can help to understand it. Thin-layer drying models are usually employed to describe the moisture transfer kinetics for various material drying. They express the change of moisture content over time during the drying process of materials. For example, Kong et al. [13] investigated the drying characteristics for pulp sheets at different hot air temperatures and found that the modified three-term model could simulate the pulp sheet drying process under the conditions studied. Zhao et al. [14] studied the influence of the hydrothermal pretreatment on the paper sludge drying performance and found that the diffusion approximation model was the best one to reproduce the experimental data.
In this work, the effect of different operating temperatures on the hot-press drying behavior was investigated to determine the moisture transfer characteristics of the insulated paperboard. Meanwhile, eight thin-layer drying models were applied in the literature generally, and a new proposed model was used to fit the experimental drying data and evaluate a suitable model to describe moisture transfer kinetics for the insulated paperboard in the hot-pressing process.

2. Materials and Methods

2.1. Materials Preparation

The wet paperboard materials, also named sample in the following, used in the hot-pressing experiment were kindly supplied by the forming section of a paper factory in Hunan, China. It was made from unbleached sulfate softwood pulp (manufactured by a Canadian pulp mill), and the raw thickness was about 10 mm for each sample. The average raw dry basis (d.b.) moisture content was determined using the oven-dry method and ranged from 2.70 g to 2.75 g water/g dry matter of the laboratory. Before the experiment, the single wet paperboard was cut with dimensions of 250 mm × 250 mm (length × width) and then placed in a sealed bag for 24 h to uniform the moisture distribution and prevent water loss. As a common pretreatment approach, the cold-pressing treatment was used to remove the amount of free water from the samples only using mechanical pressure without heating, and it finished until free water overflow was not observed from the sample surface. After several experimental measurements, the wet paperboard was pressed to the average moisture content of 1.22 g/g (d.b.) and the average thickness of 5.18 mm, as the initial state of samples was used for further hot-pressing experiments.

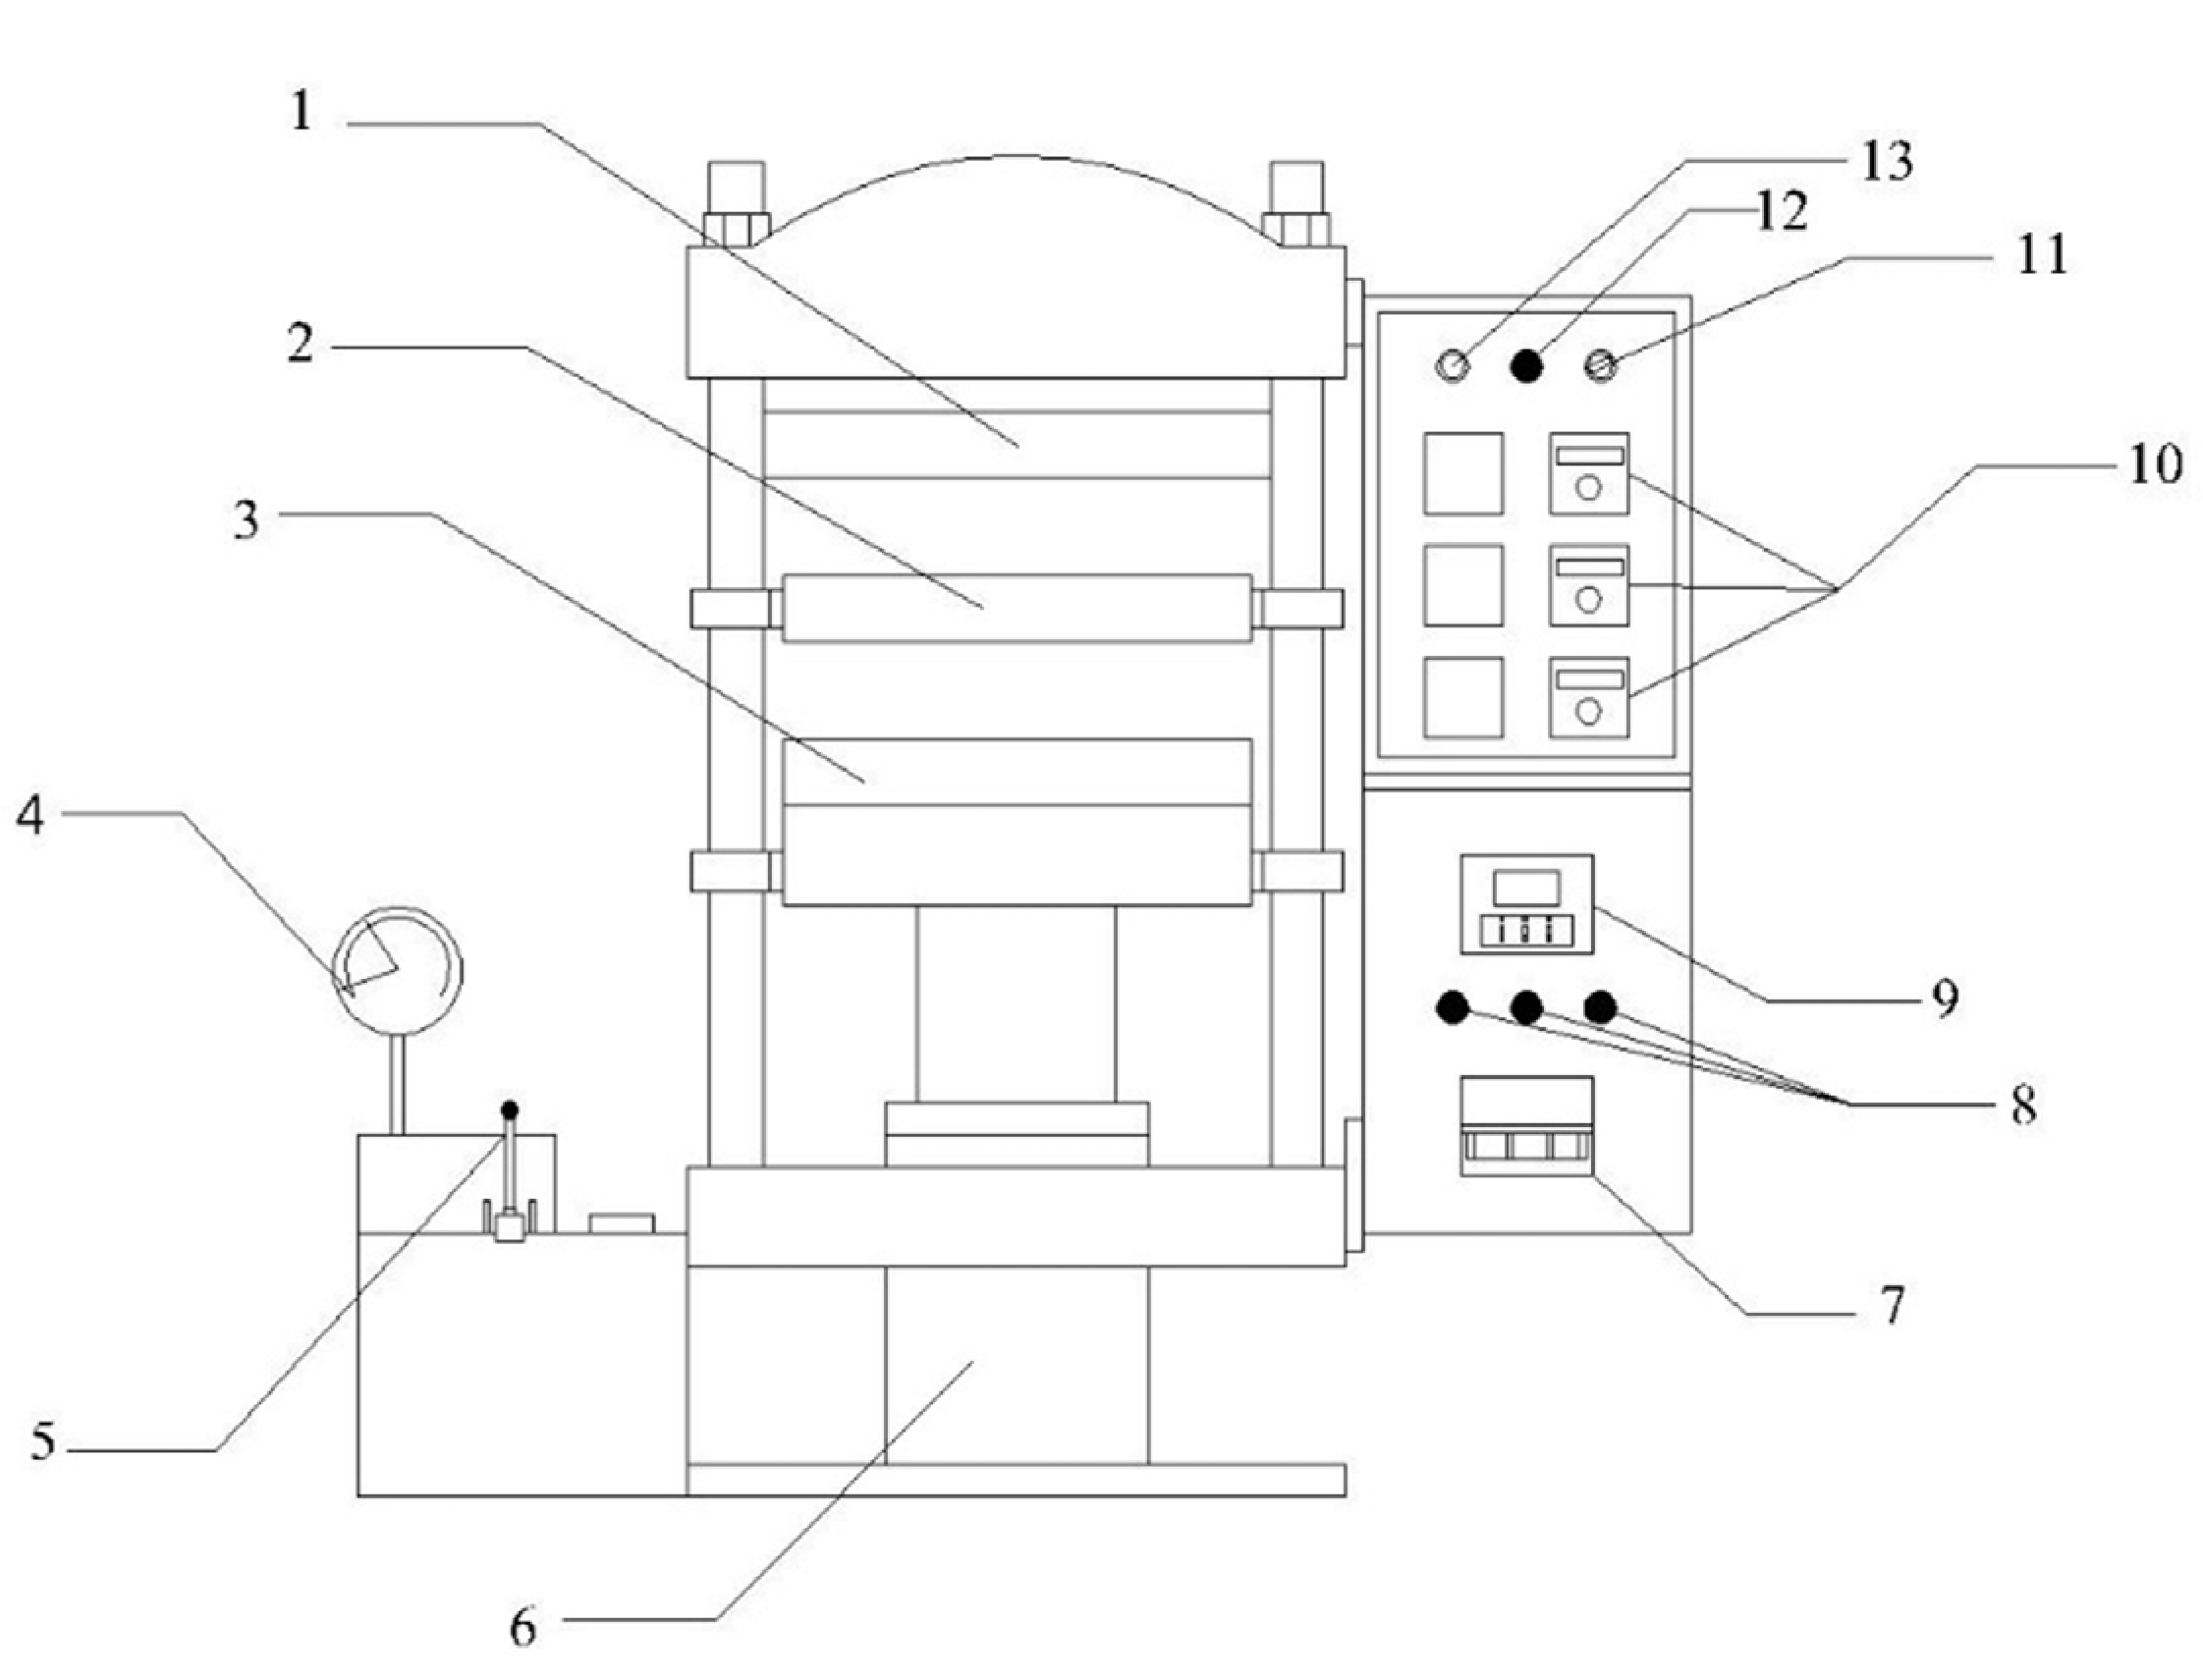
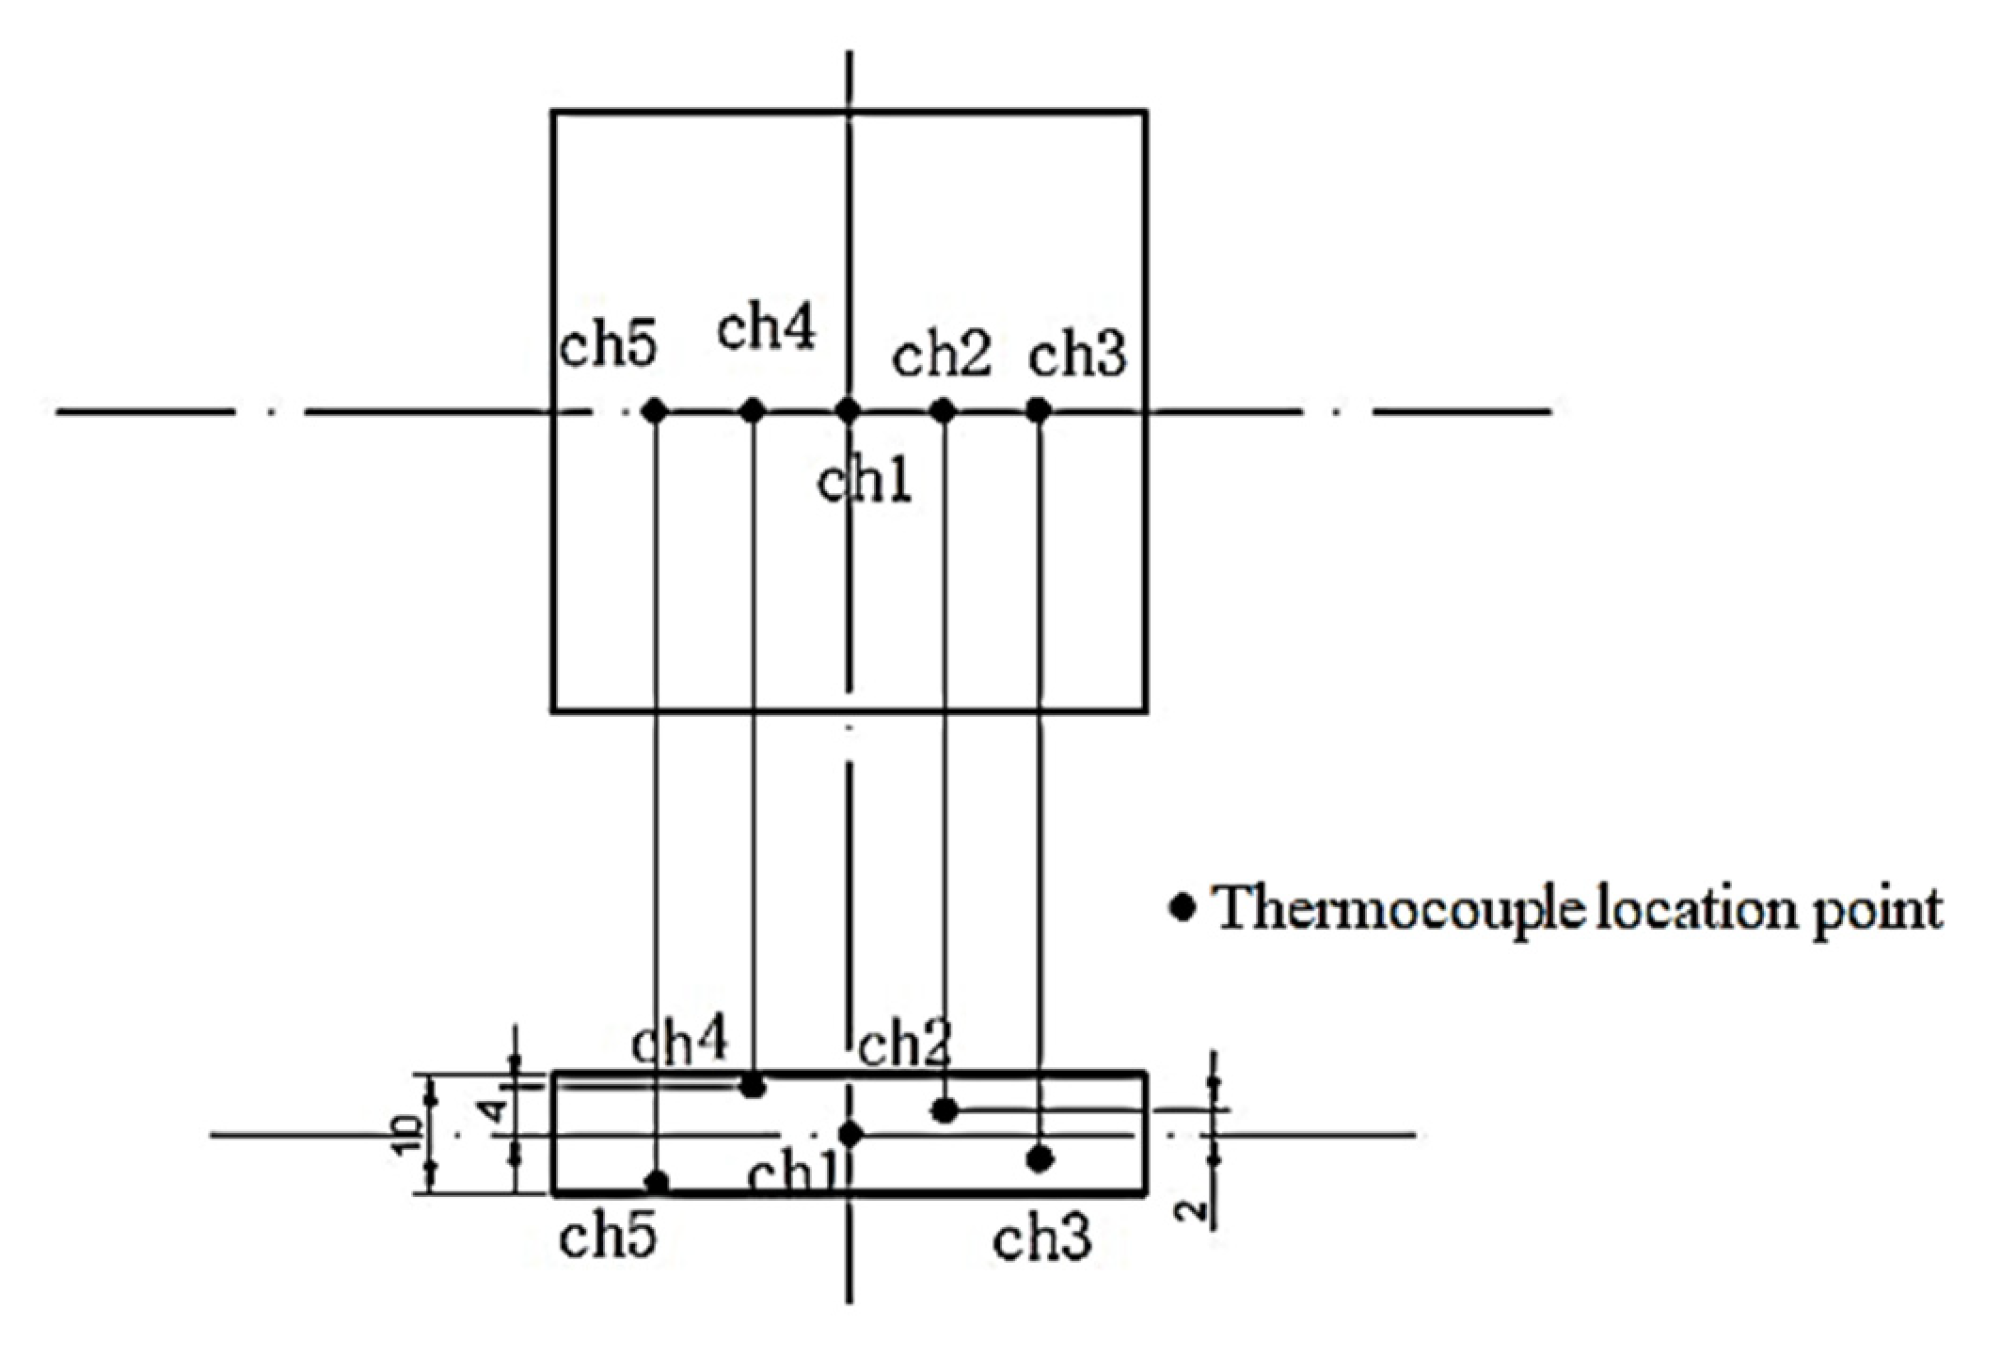
2.2. Experimental Equipment and Methods

The hot-press drying experiments were carried out in hot-pressing equipment shown in Figure 1. The hot-presser (XLB-D 400 × 400 × 2/0.50 MN, Qingdao Xincheng Yiming Rubber Machinery Co., Ltd., Qingdao, China) has two layers, which can press two paperboards simultaneously. The upper paperboard was put between the upper-layer and middle-layer hot plate used to measure the weight and dimension change in the drying process at a regular interval of 5 min. The measurements were used an electronic balance (Shanghai Liangping Instrument Co., Ltd., Shanghai, China) with an accuracy of 0.01 g and a vernier caliper with an accuracy of 0.1 mm. Each sampling process of weight and dimension measurement lasted about 1 min. Meanwhile, the lower paperboard was put between the middle-layer and the lower-layer hot plate used for monitoring the internal temperature online using the multi-channel temperature tester (AT4610, Changzhou Anbai Instrument Co., Ltd., Changzhou, China). Five T-type thermocouples were arranged within the lower paperboard in series along the thickness direction of the sample. The distribution of thermocouples is shown in Figure 2. In order to ensure the accuracy of temperature measurement, five thermocouples should be in the center of the insulated paperboard and distributed symmetrically in the horizontal direction. The average temperature of the five measuring points was taken as the final measured temperature.
The drying procedure was continued until the difference between the three successive weightings was less than 1 g. In this study, the moisture content of samples was determined by drying in the electric drying oven (101-1A, Hunan Electric Furnace Oven Factory) at 105 °C above 24h until a constant weight was obtained. The drying pressure was kept at a constant value of 3.5 MPa for all drying experiments. Replicated experiments at the operating temperatures of 110, 120, and 130 °C respectively were then carried out to determine the moisture transfer characteristics and kinetics of insulated paperboard in the hot-pressing process.

2.3. Moisture Transfer Characteristics Calculation

The moisture content (M) of insulated paperboard can be defined as follows [14]:
M = m t m o m o ,
where mt and mo are instant mass (g) and final dried mass (g) of the sample respectively.
The amount of water evaporated per unit time was expressed by the change of the sample weight between adjacent time intervals, also named drying rate (R) herein. It was calculated according to Equation (2) [15].
R = m t m t + Δ t Δ t ,
where mt+Δt is the mass (g) of the sample at time tt (g), is the time interval (min) between two adjacent measurements.
The size change of the insulated paperboard along the thickness direction was quantified by size retention rate (β), which can be calculated with Equation (3) [16].
β = L t L i × 100 % ,
where Li and Lt are the thickness (mm) of the sample at the initial and instantaneous time respectively.
The relative porosity of the insulated paperboard (φ) was calculated with Equation (4) [17].
φ = 1 ρ t ρ o × 100 % ,
where ρt and ρo are the density (kg/m3) of instantaneous wet sample and final dried sample, respectively.

3. Results and Discussions

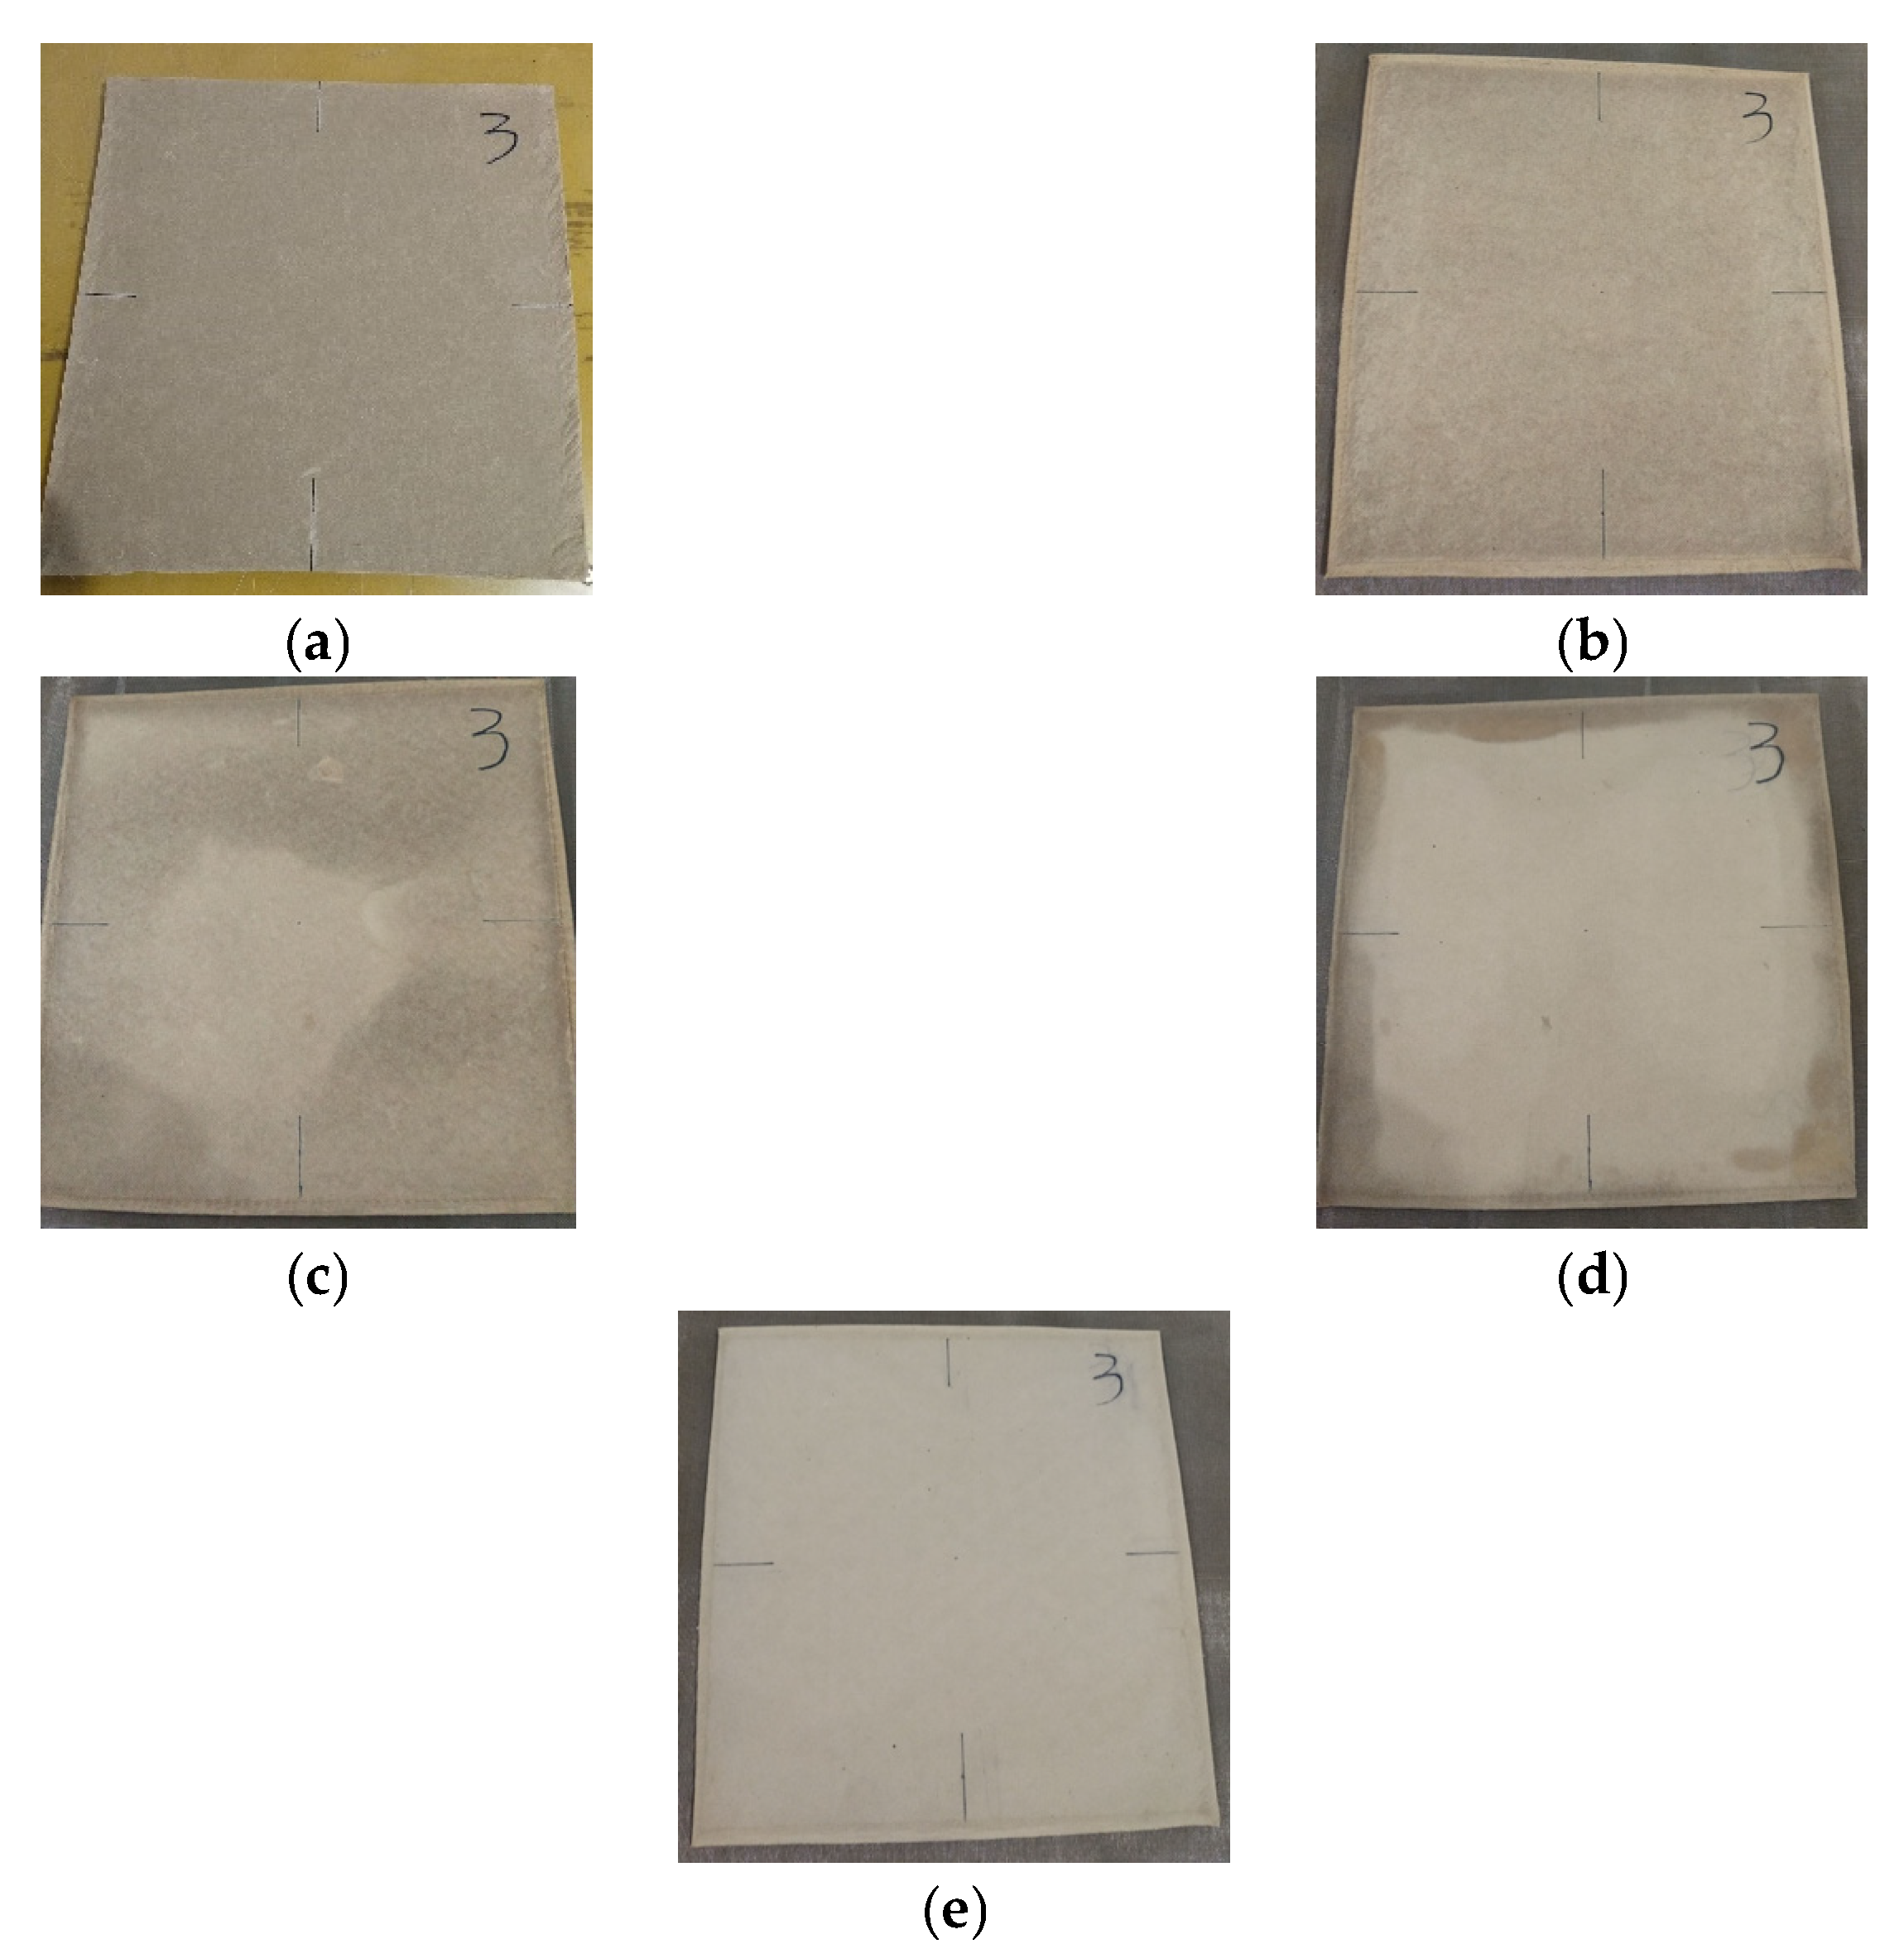
3.1. The Morphological Changes of the Insulated Paperboard

The morphological changes of the insulated paperboard in the hot-pressing process were presented in Figure 3. From these results, we can see the dimensions changes and the obvious moisture distribution on the surface of the hot-pressed paperboard.
As the transport of moisture from the paperboard, the morphological changes of the insulated paperboard can be seen from figures. Figure 3a is the raw state of the insulated paperboard that has uniform moisture distribution as represented with the same color across the entire surface. After being cold-pressed with the mechanical press, which we called the initial state, as shown in Figure 3b, the surface of the wet paperboard becomes smoother than the raw state. The dimensions of the length, width, and thickness of the paperboard are all changed in the cold-pressing process. Both length and width became large slightly while the thickness decreased clearly. Meanwhile, the pressure drives the internal moisture to migrate within the insulated paperboard, causing the surface to present different colors. Compared to the location close to the edges, the color in the center is a little lighter, which means that moisture diffuses outward from the center to the edges. Then, for hot-pressing, Figure 3c,d give the appearance of the insulated paperboard after 5 and 10 min of the hot-pressing process, respectively. We can see the moisture distribution on the surface of the insulated paperboard has changed distinctly as the color indicated in these figures. The darker the color presented on the board means higher moisture content. From Figure 3c,d, we see that the light color area gradually expands from the center to the edges, or the dark color areas shrink as the drying time is processed. This is attributed to accelerated moisture mitigation within the paperboard under the combined effect of temperature and pressure. When the internal moisture of the wet paperboard is removed, the internal fibers are tightly crossed with fewer pores that filled with water earlier. After the hot-pressing process is finished, as Figure 3e shows, there was no longer any obvious moisture distribution; namely, the color across the surface will look no different anymore. Compared with other dimensions, the thickness of the paperboard changes greatly, from the raw 10 mm to the final 2 mm.

3.2. Moisture Transfer Characteristics of the Insulated Paperboard

The moisture transfer characteristics can be seen from the curves representing the variation of the moisture content and the drying rate as drying time. These curves were obtained by measuring the weight evolution of the sample until reaching the final equilibrium moisture content.
The variation of temperature with time at different layers under 130 °C is presented in Figure 4. All the operations during the drying process can be reflected by the temperature curve. For instance, the evident fluctuations of temperature represent the sampling operation in the drying process. The temperature was sharply decreased in a short time with the opening of hot plates. When the hot plates closed, the heat was absorbed by the surface of the sample and transferred simultaneously to the center layer by conduction. Therefore, the distribution of temperature between different layers was clearly different. Along with the thickness, the temperature decreased from the surface to the center.
Figure 5, Figure 6 and Figure 7 shows the moisture transfer characteristics of the insulated paperboard at various temperatures. As the curve of 120 ℃ (red line with quadrangular symbol) is presented in Figure 5, four distinguished drying stages can be observed. The temperature increased to 100 °C from 0 to 14 min. At this stage, the conducted heat is mainly used for heating the wet paperboard, also known as the warm-up stage. After the temperature reaches 100 °C, from 14 to 18 min, it is the second stage, also known as the boiling-point temperature stabilization stage, since the temperature keeps almost constant during this time. Most free water contained in the paperboard was evaporated continuously in this stage. The moisture drops more dramatically than in the first stage, as presented in Figure 6, and it can also be seen from Figure 7 that the drying rate increased to its peak at this stage. The third stage happened from 18 to 25 min; we called it the temperature slowly rising stage [18]. In this stage, the free water content of the insulated paperboard is less. The moisture is diffused outward by the influence of temperature, the insulated paperboard gradually approaches the equilibrium moisture content, and the drying rate decreases rapidly. After 25 min, it is the fourth stage, named the constant temperature stage. The temperature is gradually maintained at the set range of 118 ± (1~2) °C; the water content changes very slowly.
The drying behavior of the samples exhibited the characteristic moisture desorption behavior. In the progression of the drying process, the moisture content was observed to decrease non-linearly with respective to drying time for all the samples from the curves shown in Figure 6. A high rate of moisture removal was observed in the second stage, followed by slower moisture removal in the later stages, and there was no constant rate in the drying period in the entire drying process. This characteristic behavior can be attributed to the various states in which water is present in the insulated paperboard. Generally, during the falling rate period, the rate of water movement from the interior to the surface falls below the rate at which water evaporates to the surrounding air; therefore, the sample surface dried out. This also implies that moisture diffusivity in the samples was predominantly through diffusion mechanism.

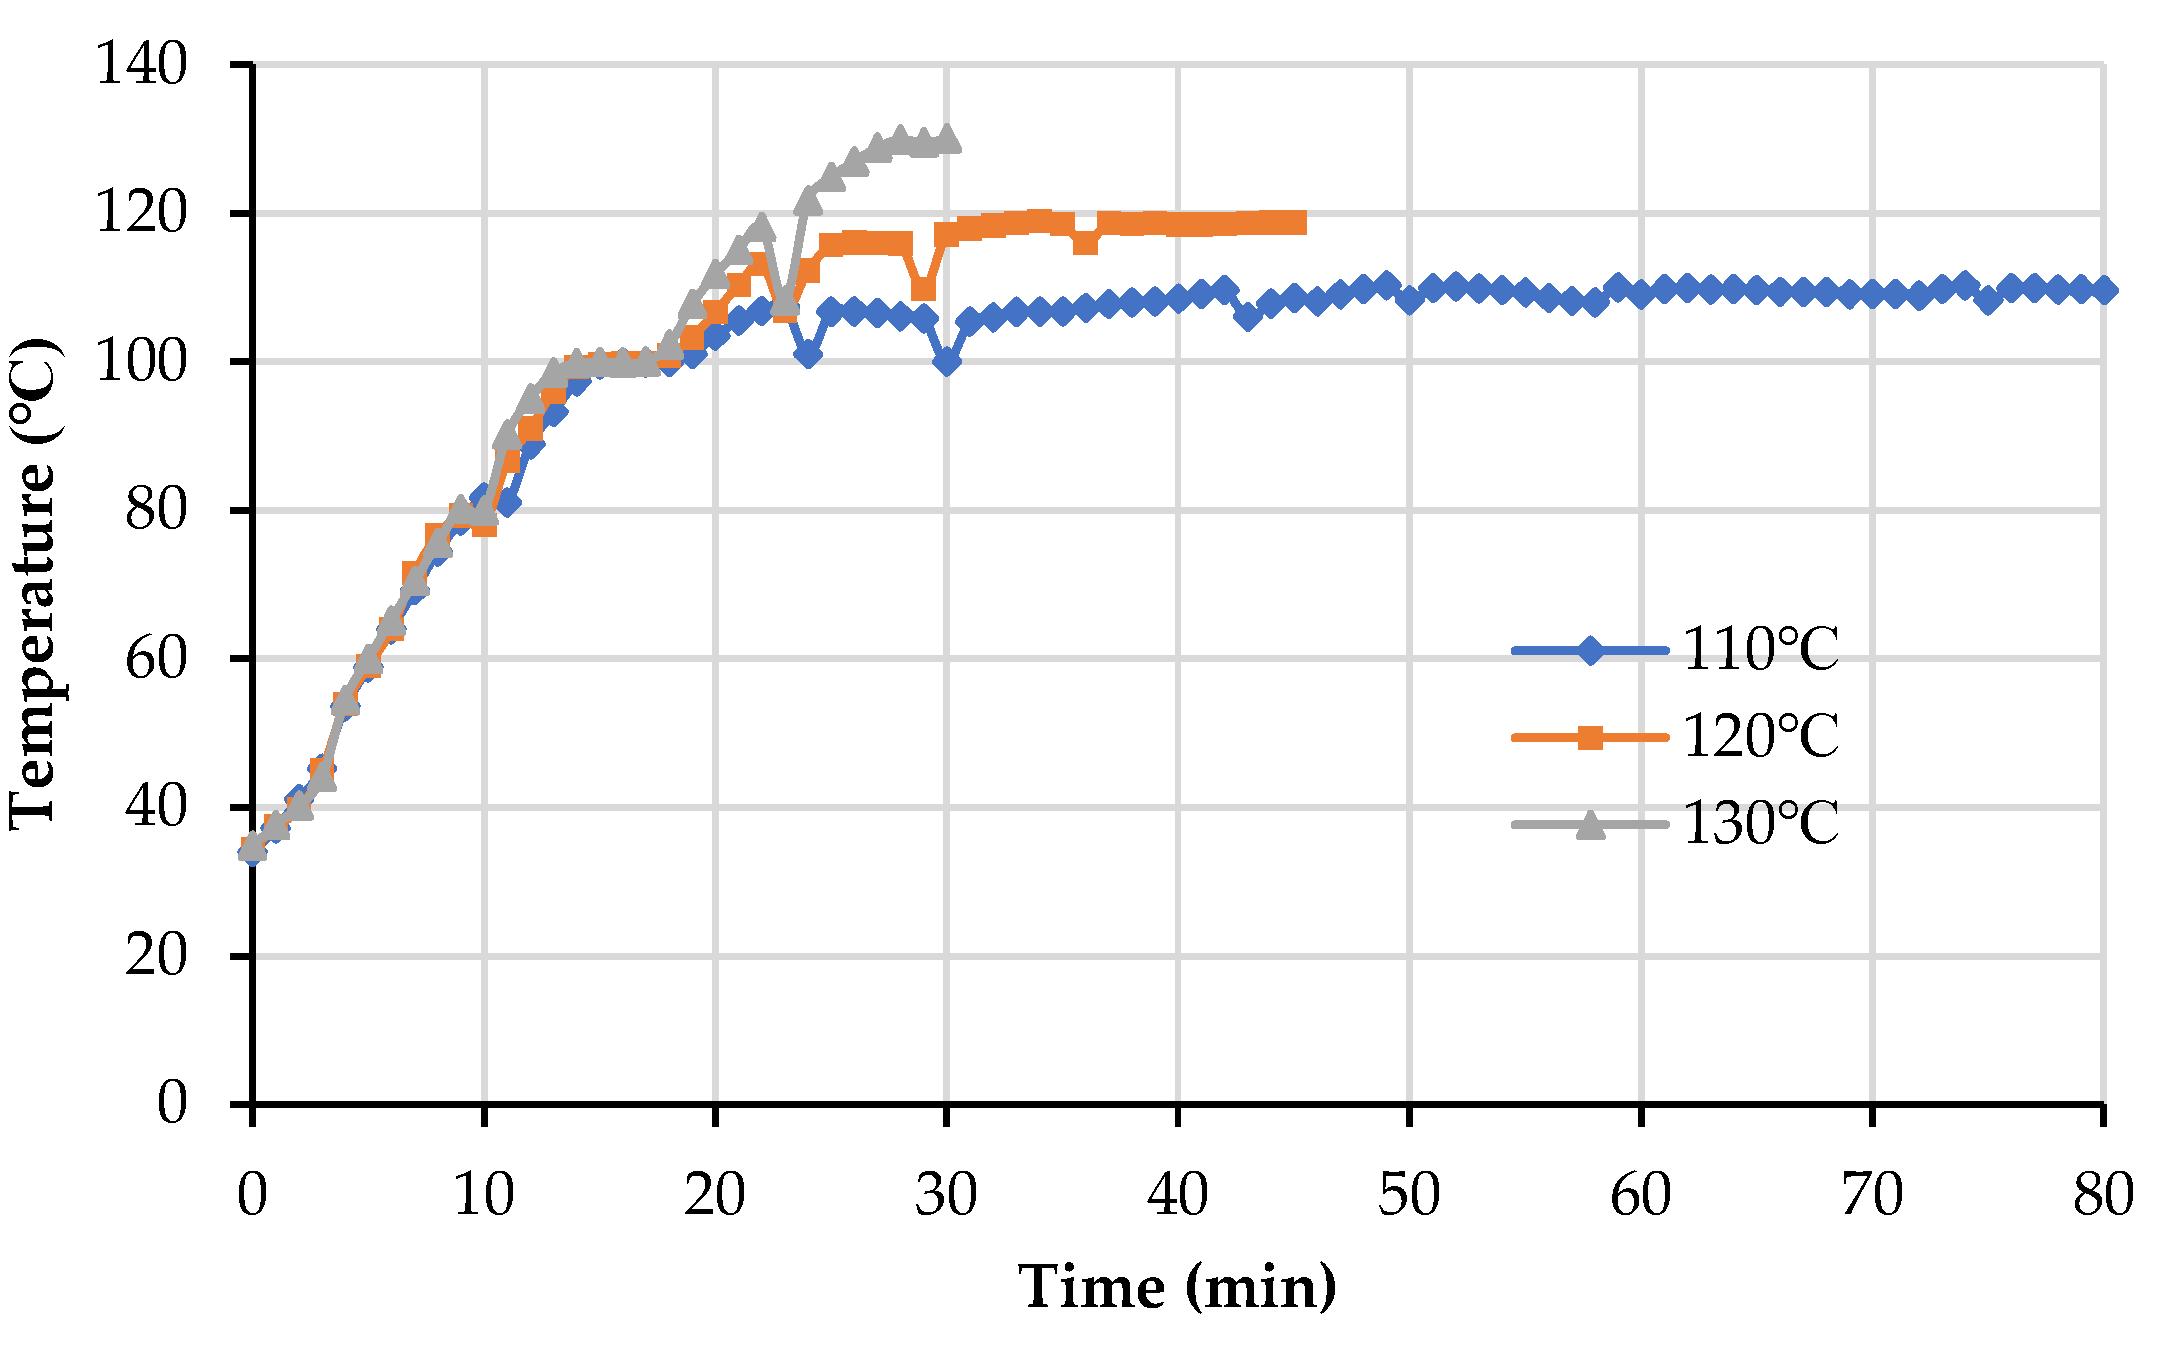
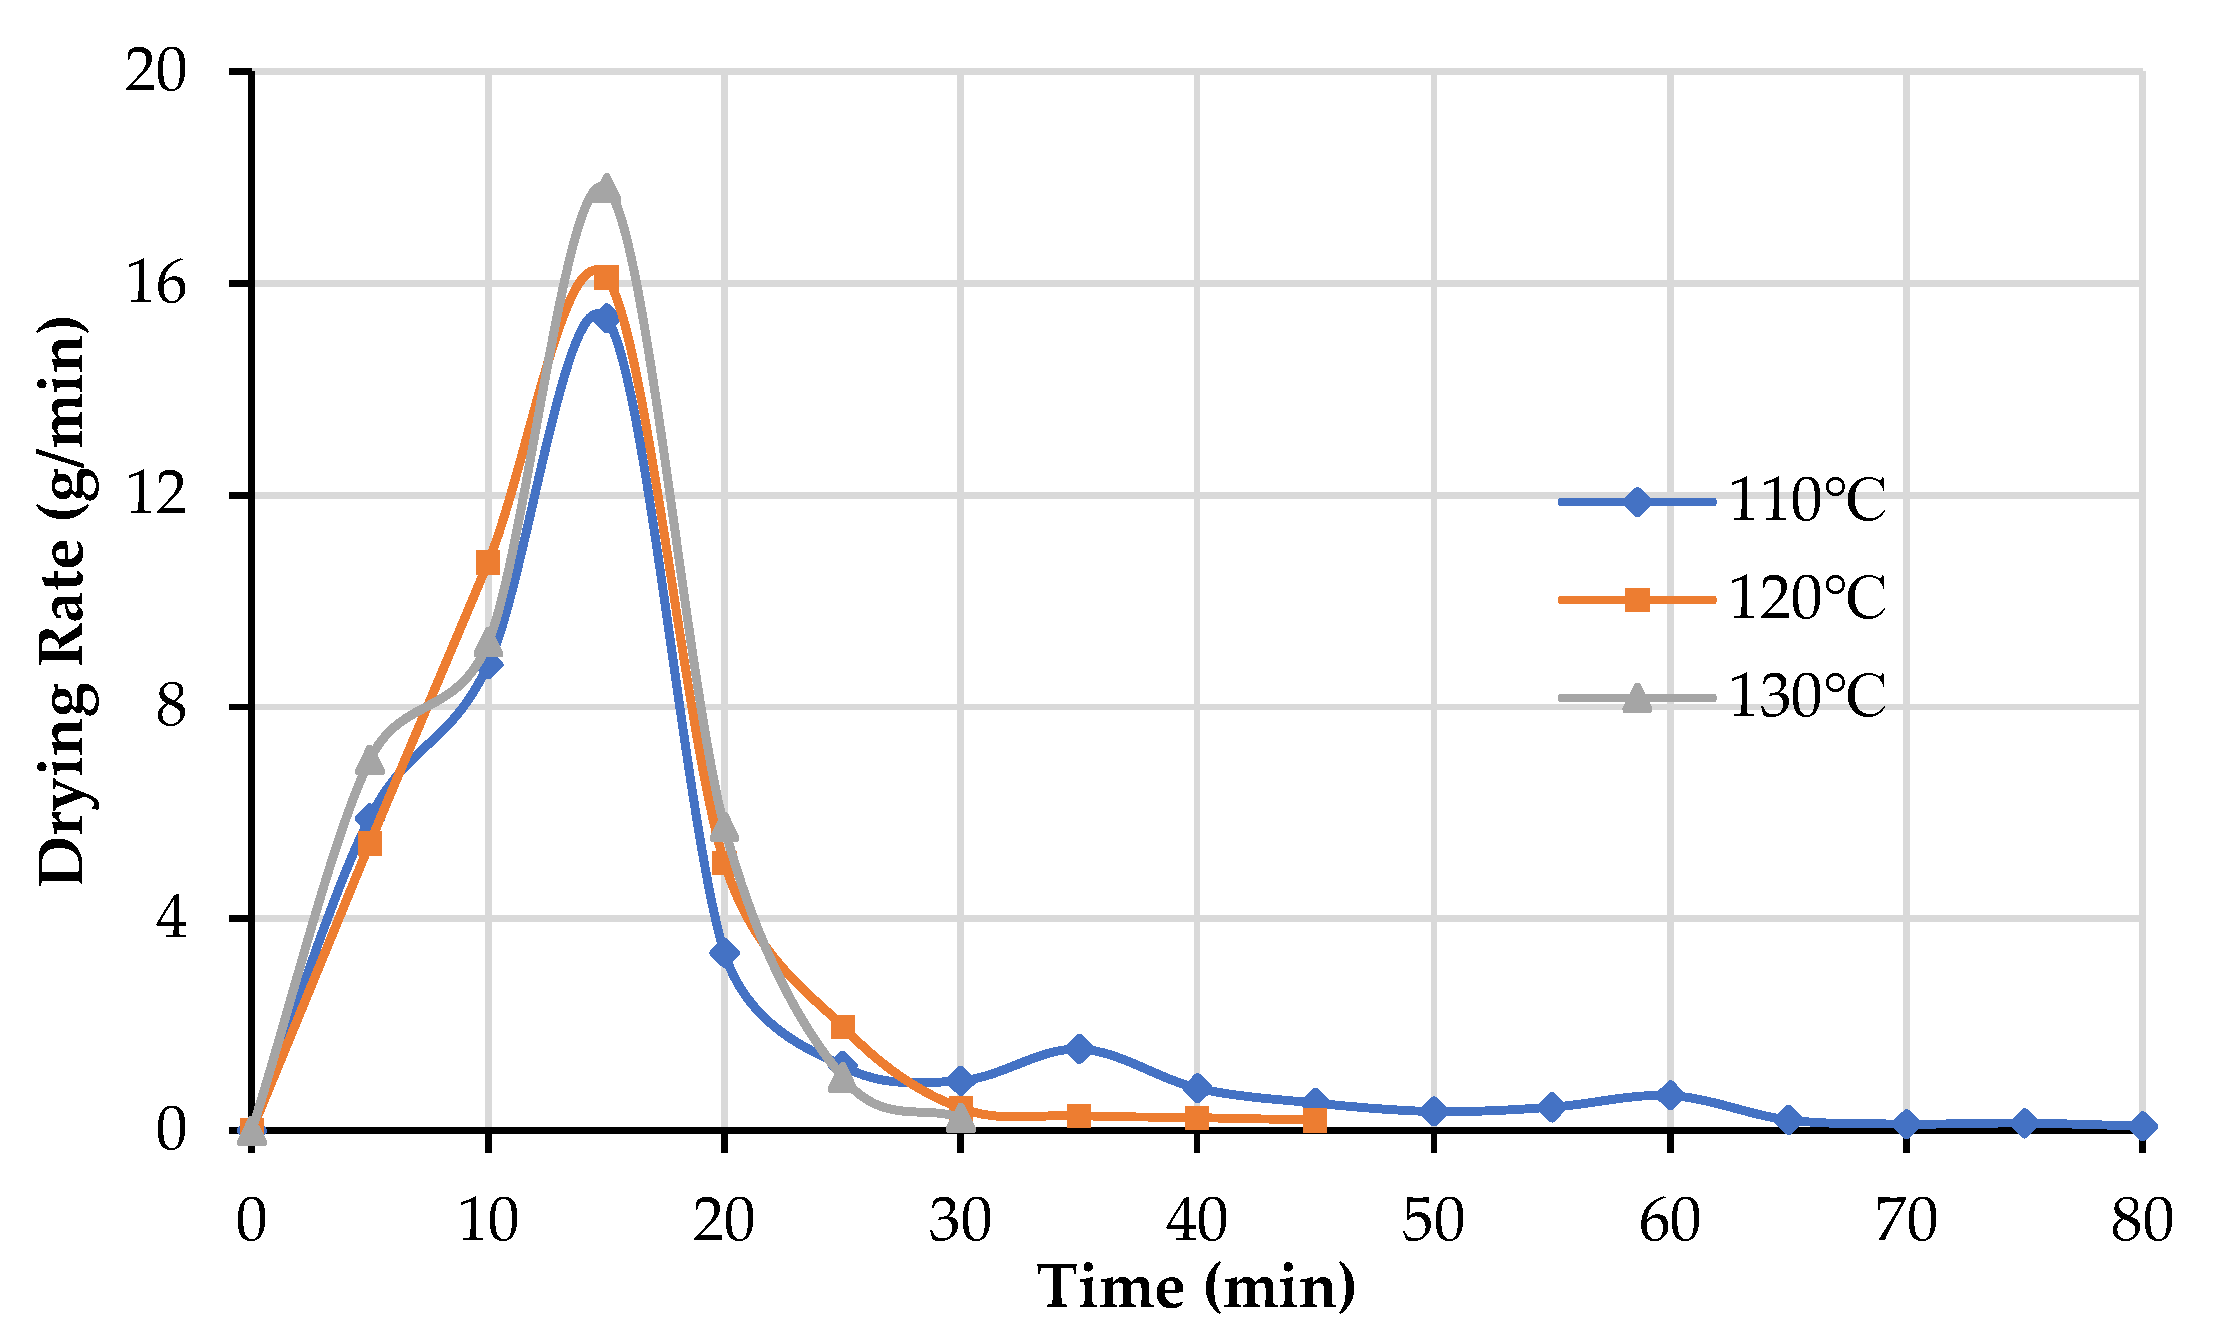
3.3. Effects of Temperature on Moisture Transfer Characteristics

Under the same other conditions, more heat can be transferred within the wet insulated paperboard for promoting water removal when a higher temperature is employed. As presented in Figure 5, the time for the warm-up stage is shortened slightly when the operating temperature raised to 130 °C from 110 °C. Moreover, there was almost no difference in moisture behavior at different operating temperatures for the first stage from Figure 6 and Figure 7, especially during 0~10 min. However, the higher temperatures clearly rendered the slopes steeper on the third stage, as shown in Figure 5. We can also see the same phenomenon from Figure 6 and Figure 7. It indicated that high temperature mainly affects the medium and later stages (after 10 min) in the drying process. Raising the operating temperature could contribute to improving the drying rate and reduce the drying time consequently. In order to reduce energy consumption, the lower temperature (e.g., 100 °C) should be applied in the early stage (0~10 min) to preheat the samples. When the samples’ temperature approached boiling point (100 °C), a higher temperature (e.g., 130 °C) is supposed to be employed to improve the moisture transfer rate. It is recommended to operate under different stages for the whole drying process while not keeping the same temperature constantly. The larger drying rate will be obtained for the higher temperature, and its maximum value was increased from 15.34 to 17.80 g/min, i.e., enhanced by 16.04% when the operating temperature increased from 110 to 130 °C. The drying times were 30, 45, and 80 min at 130, 120, and 110 °C, respectively.

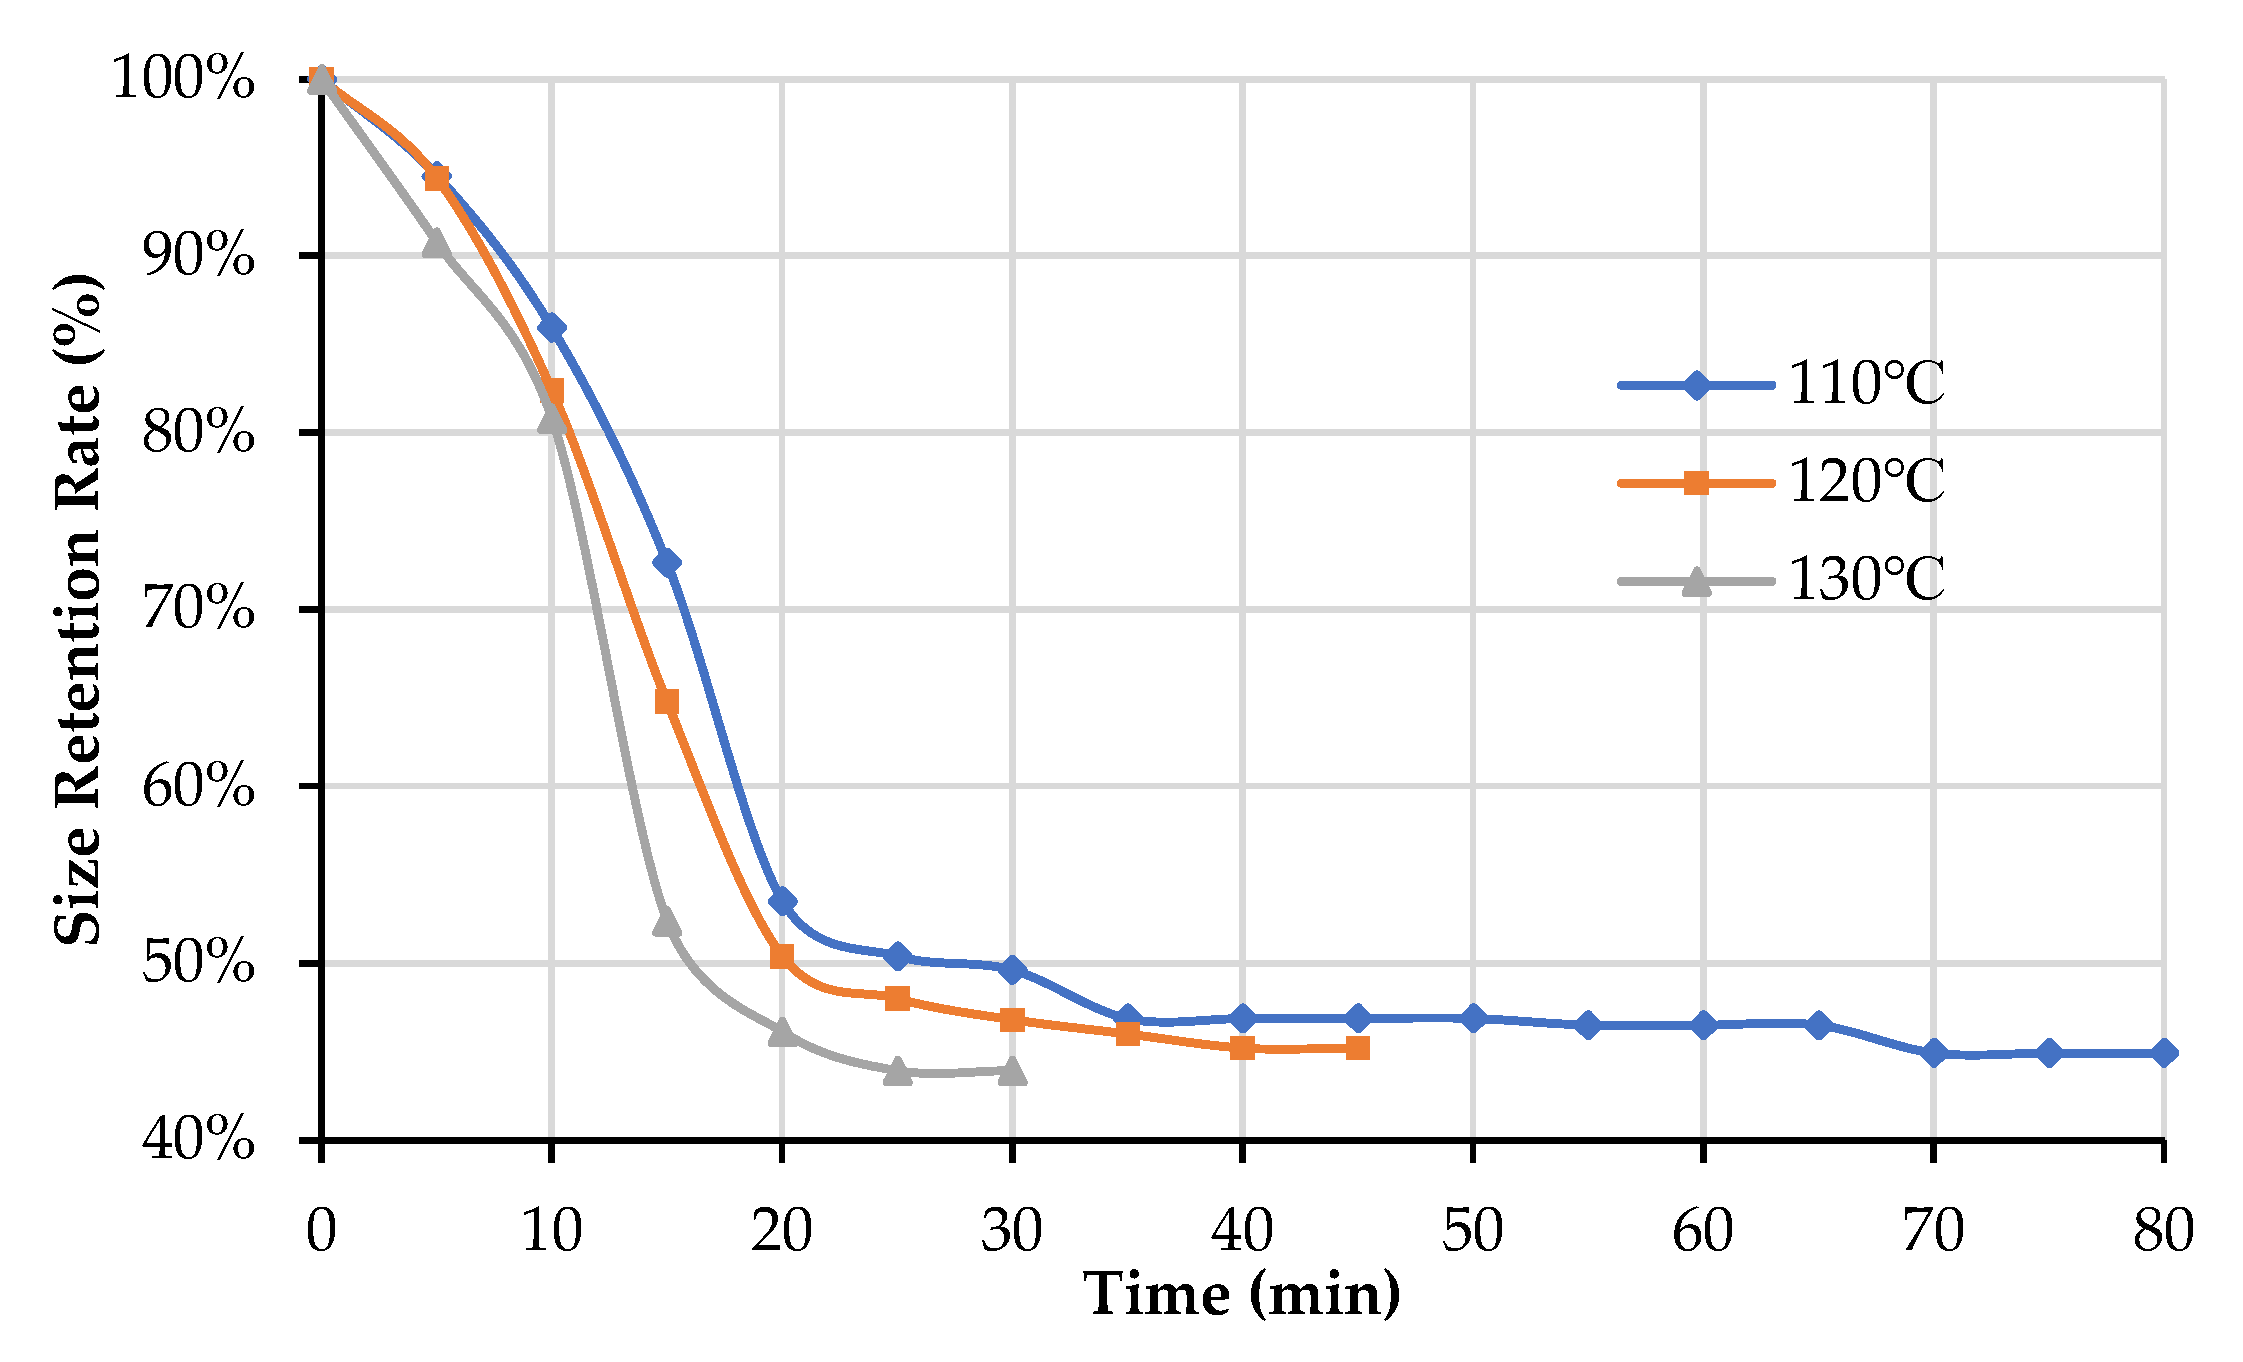
3.4. Effects of Temperature on Size Retention Rate and Relative Porosity

During the experiment, the thickness of the paperboard clearly decreased, which was an important parameter reflecting the quality of the product after drying. Figure 8 and Figure 9 show the changes of size retention rate and relative porosity of the insulated paperboard under different operating temperatures. By comparing these curves, we can see that there are three stages, namely, a rapid decline stage, a slow decline stage, and a stable stage.
It can also be seen from Figure 8 and Figure 9 that when the operating temperature is 110 °C, the insulated paperboard size retention rate after drying is 44.92%, and the relative porosity is 4.57%; when the operating temperature is 120 °C, the final size retention rate is 45.20%, and the final relative porosity is 4.53%; when the operating temperature is 130 °C, the final size retention rate is 43.91%, and the final relative porosity is 4.75%. It is concluded that the higher temperature could contribute to relative porosity and the size retention rate decreases, shortening the drying time by 62.50% (from 80 to 30 min) when the operating temperature increased from 110 °C to 130 °C.

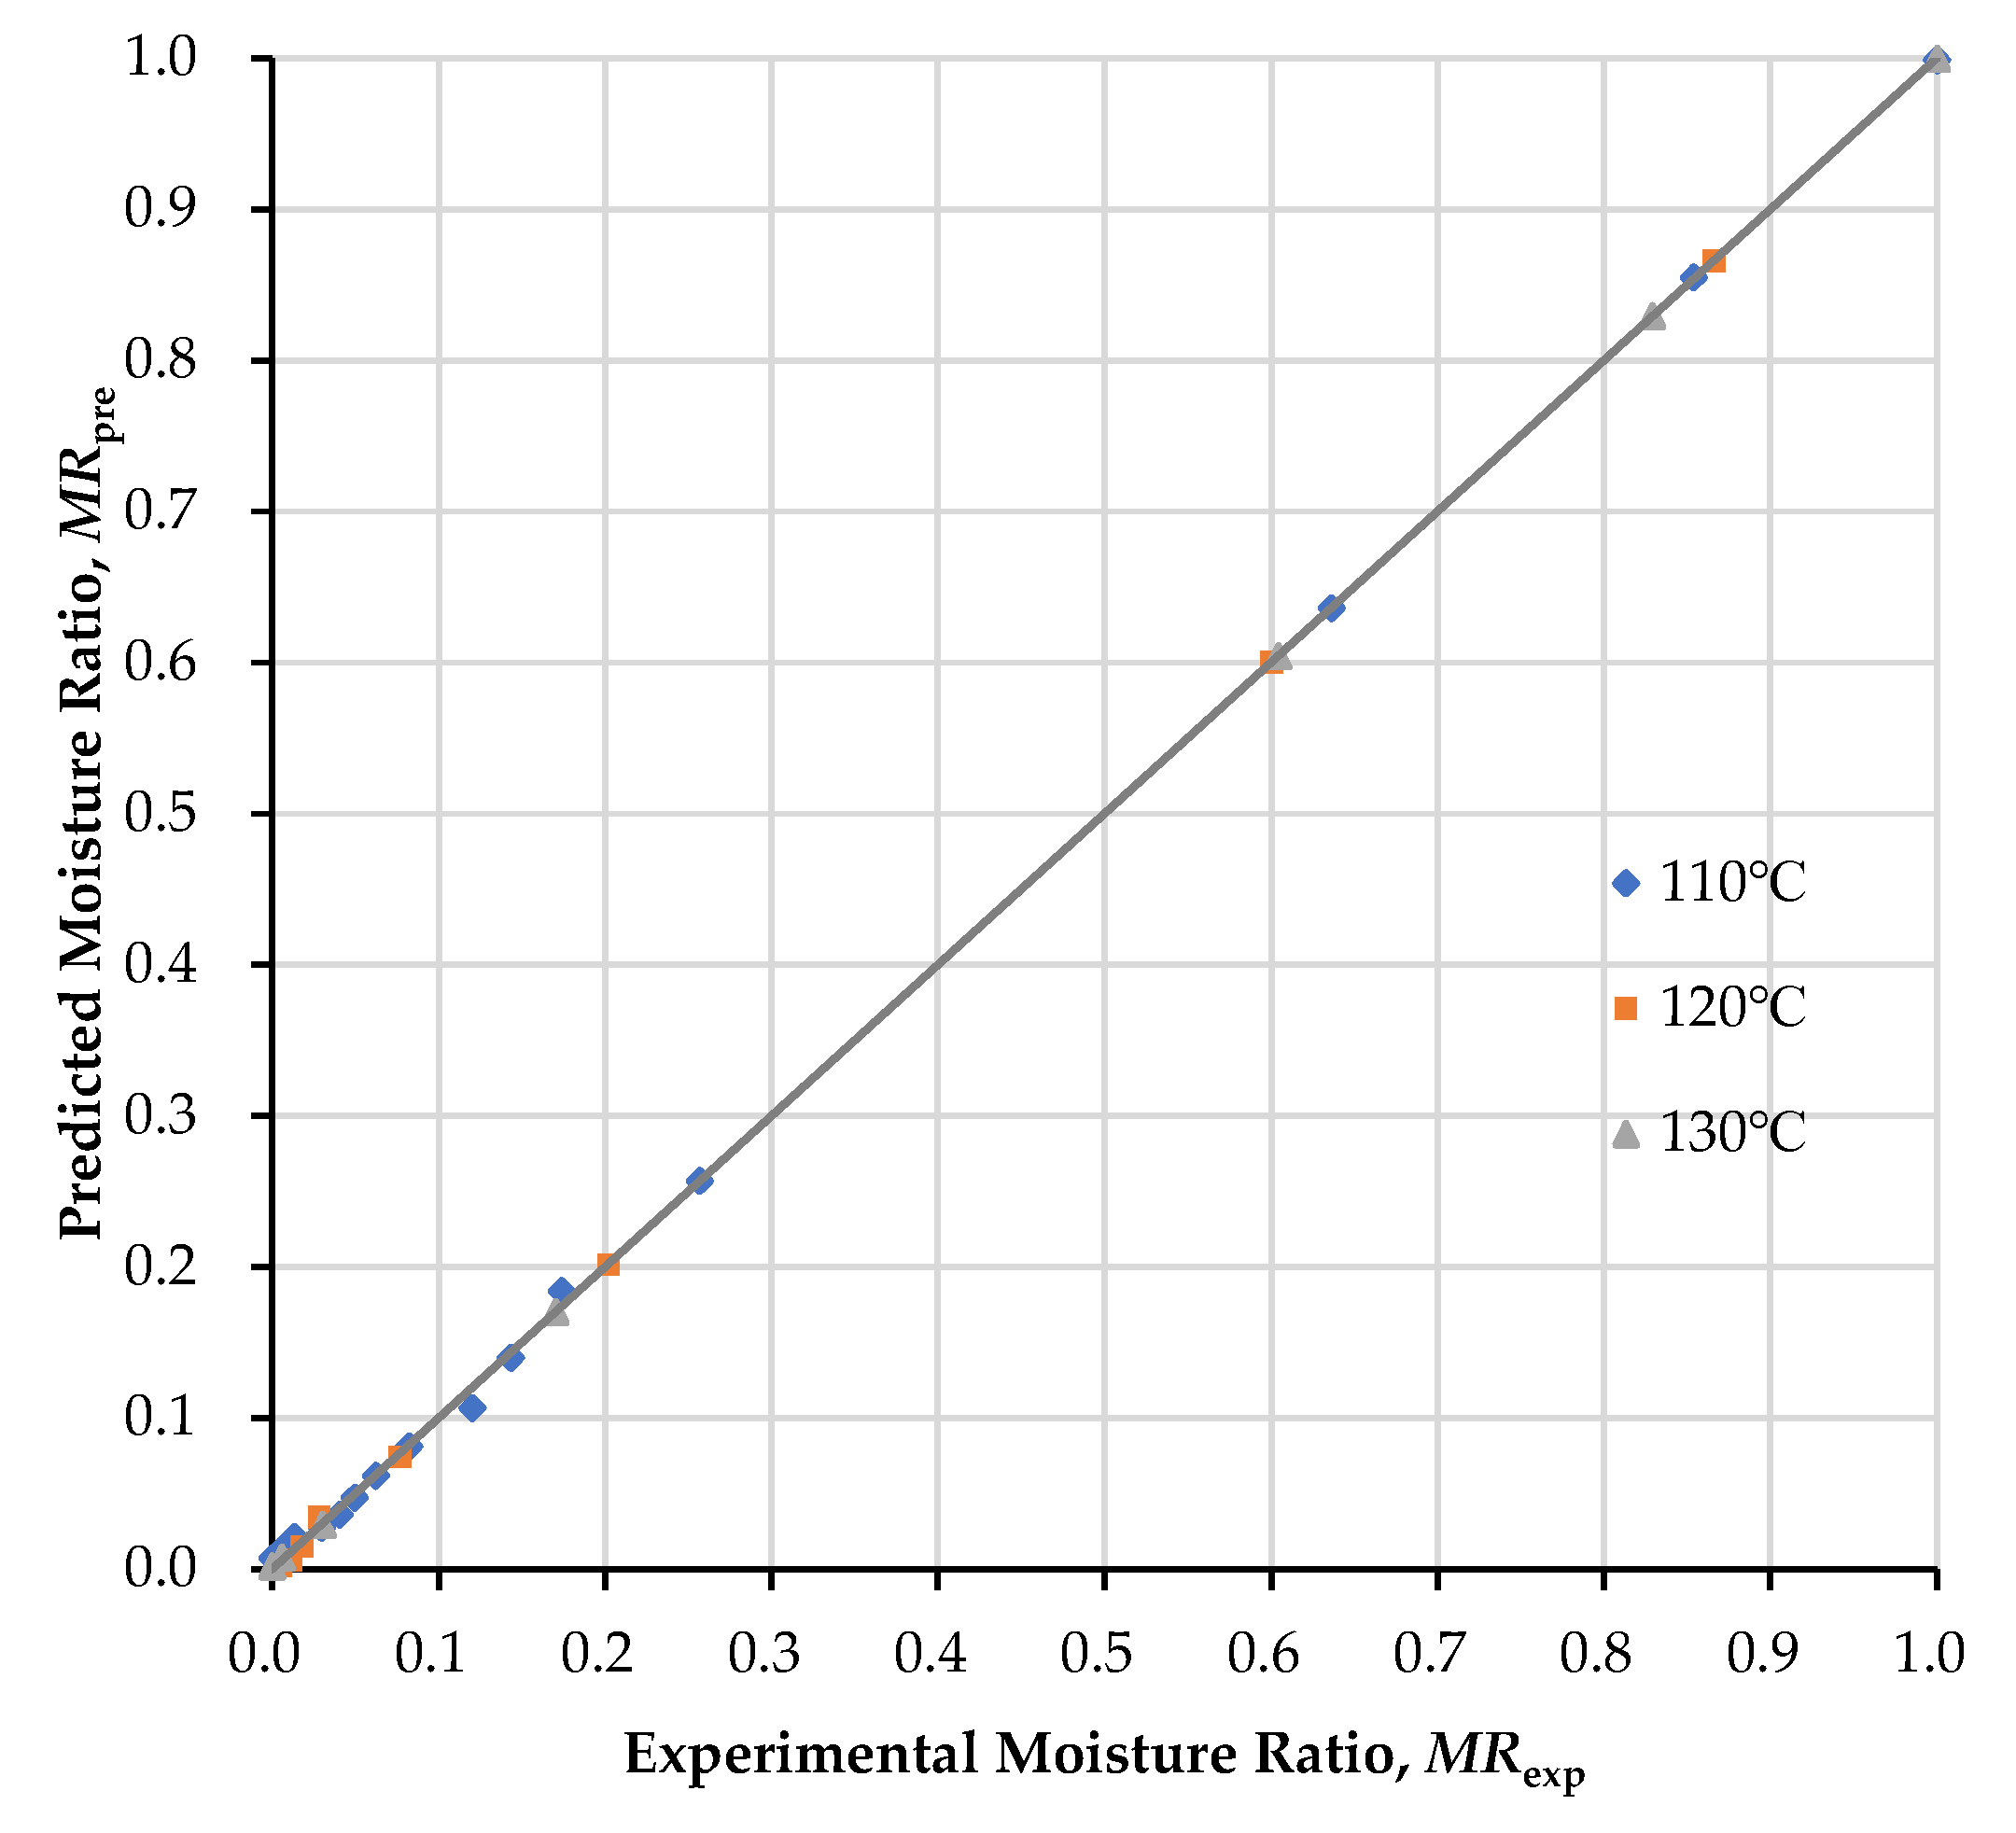
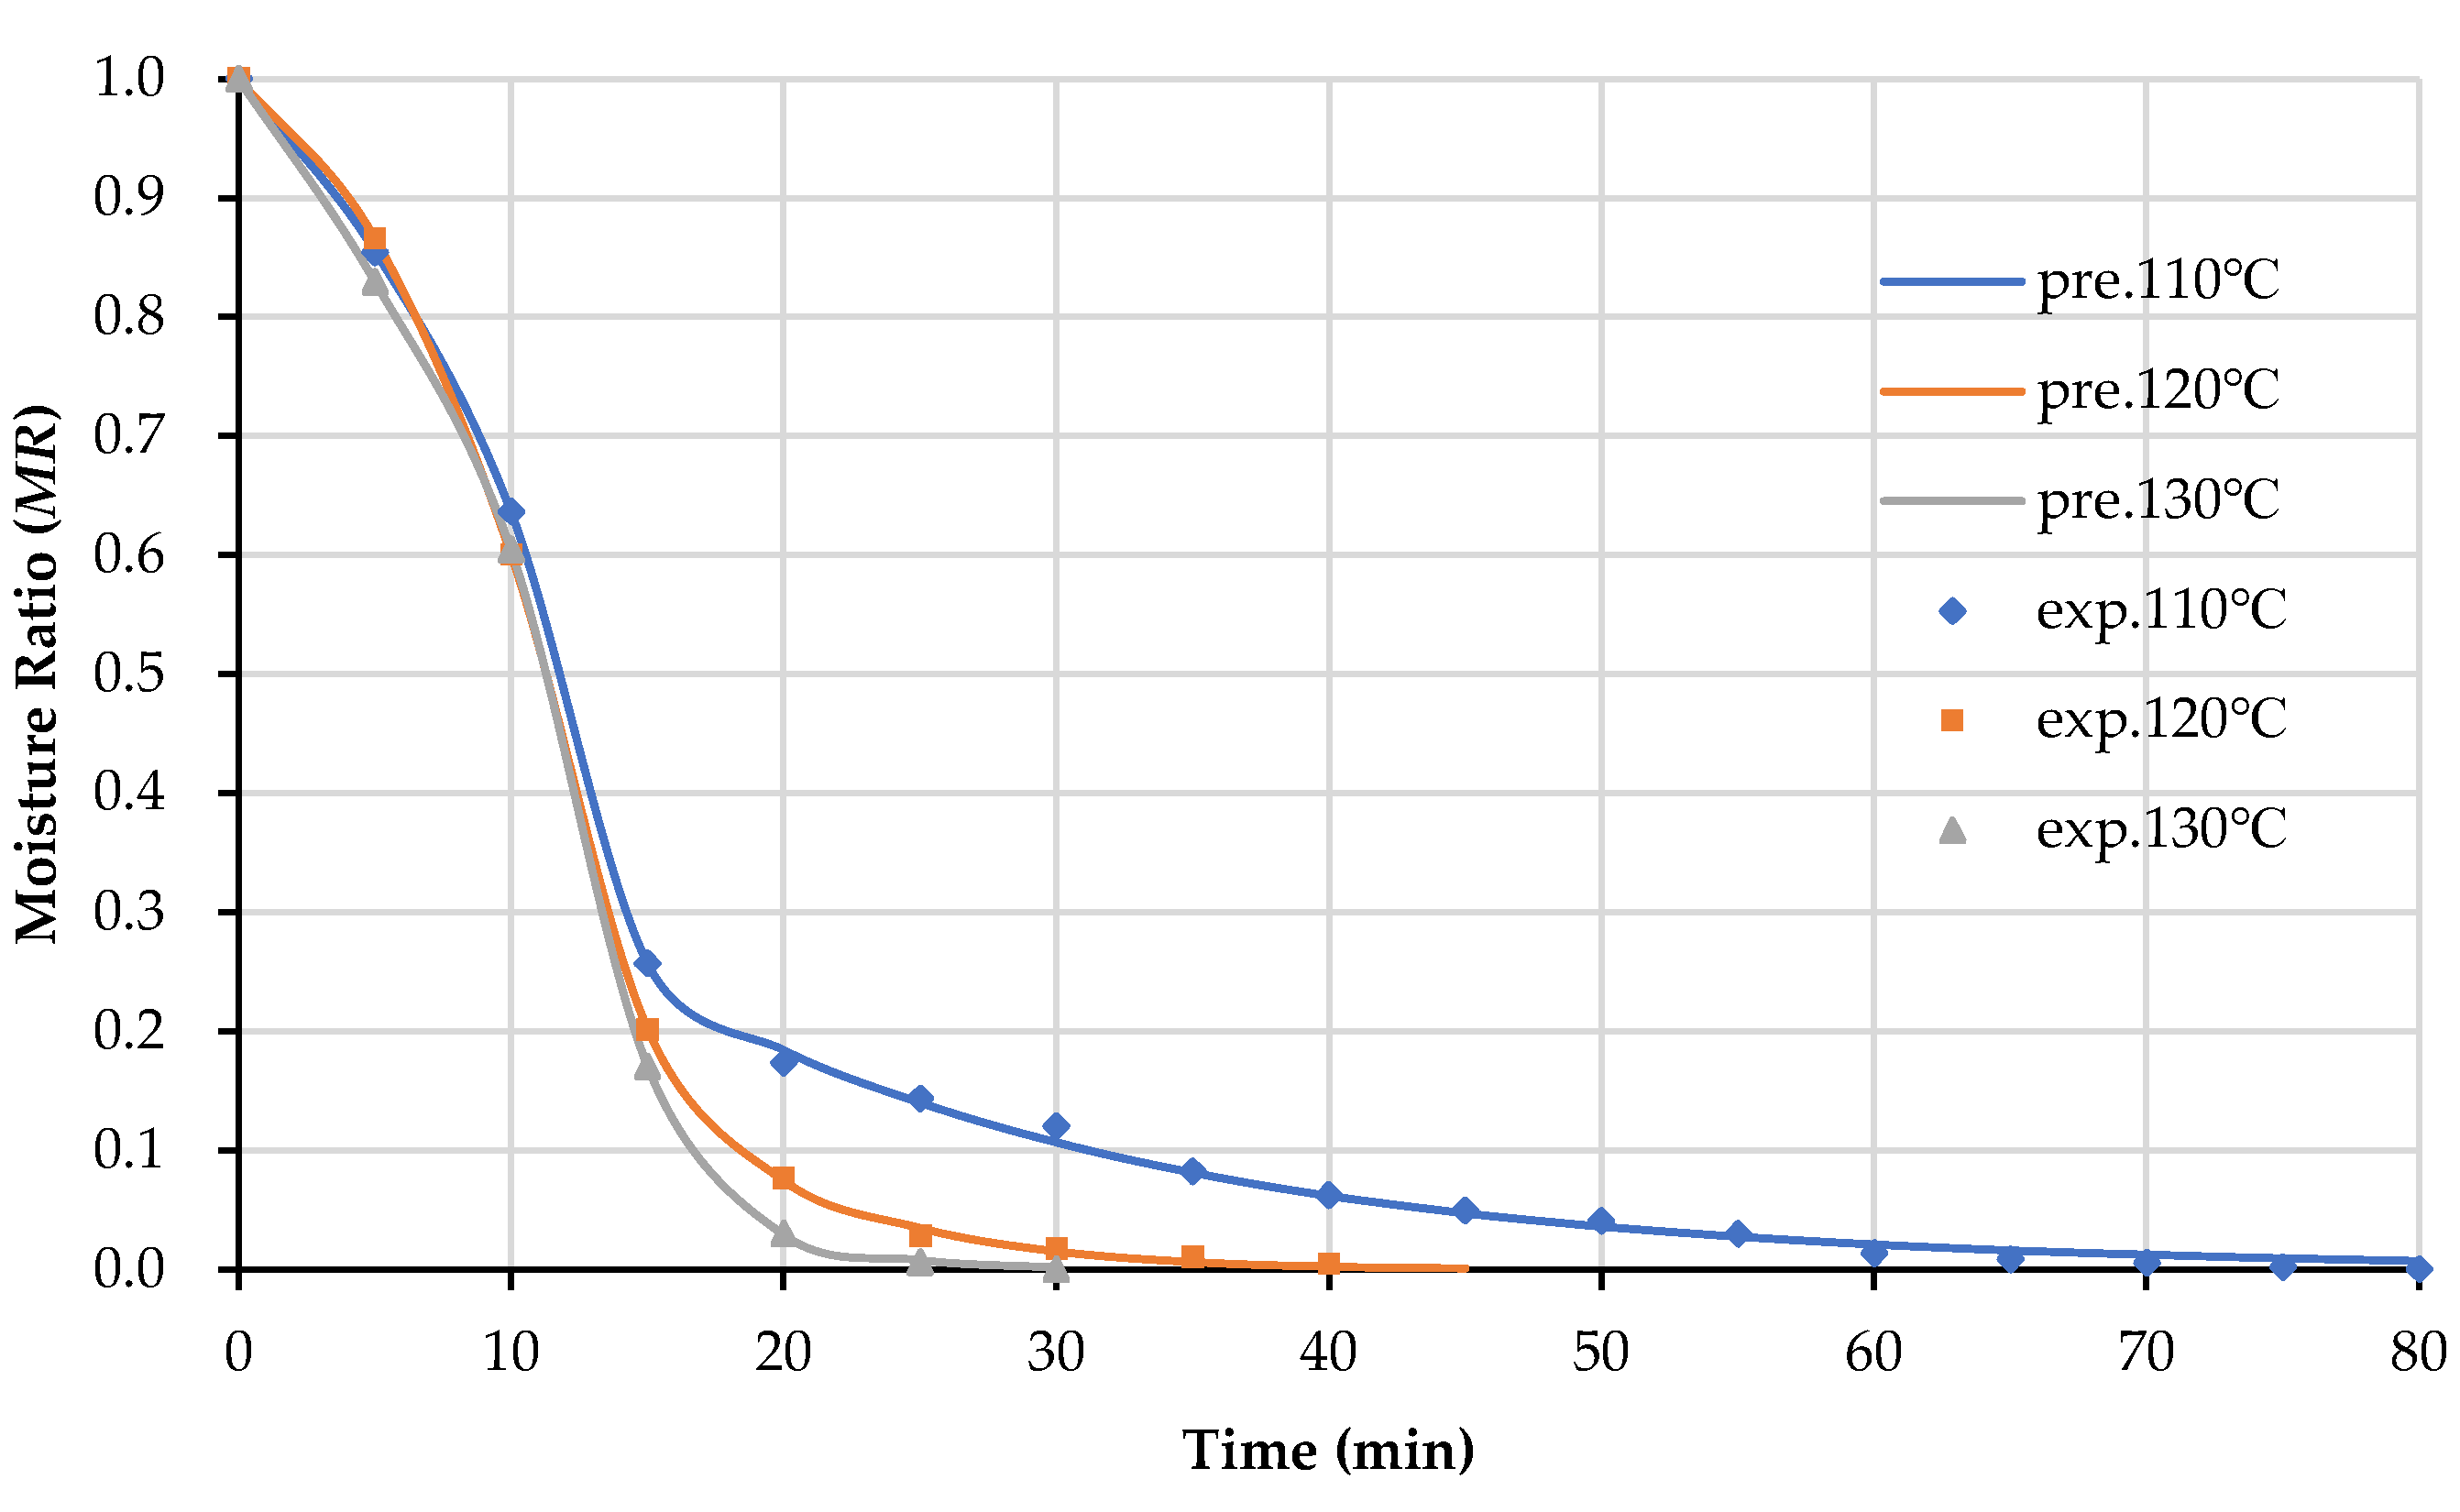
3.5. Moisture Transfer Kinetics Determination

In order to efficiently ascertain the drying kinetics of insulated paperboard, there is a need to fit the drying behavior with different mathematical models. In this study, nine thin-layer drying models, including a new proposed model, are presented to describe the hot-pressing drying kinetics. This new model was developed as a modification of the Hii et al. model [19] by replacing the exponent coefficient “n” of the second term with a new variable “m”. The experimental moisture contents were converted to a more functional moisture ratio (MR), which was calculated using Equation (5) [20].
M R = M t M e M i M e ,
where Mi, Mt, and Me are the initial moisture content, instant moisture content, and equilibrium moisture content of the sample, respectively.
Thereafter the curves obtained from plotting the moisture ratios against drying time were fitted with nine mathematical models listed in Table 1. The non-linear regression analysis was performed using the statistical method to fit the hot-press drying experimental data.
The outcome of the statistical analyses applied to the curve fits to determine the adequacy, reliability, and consistency of the models are outlined in Table 2. The coefficient of determination (R2), root mean square error (RMSE), and reduced chi-square (χ2) were used as primary criteria to evaluate the fit quality of model predictions to experimental values according to Equations (6)–(8) [28]. The higher the R2 values and lower the RMSE and χ2 values, the better the goodness of fit.
R 2 = 1 1 N M R exp , i M R pre , i 2 1 N M R exp , i ¯ M R pre , i 2 ,
R M S E = 1 N i = 1 N M R exp , i M R pre , i 2 1 / 2 ,
χ 2 = i = 1 N M R exp , i M R pre , i 2 N n ,
where MRexp,i and MRpre,i are experimental and predicted dimensionless moisture ratios, respectively; N is the number of observations, and n stands for the number of constants.
In all operating temperatures, the R2, χ2, and RMSE values of the evaluated mathematical models were in the range of 0.89347–0.99999, 0.00001–0.02067, and 0.00120–0.12863, respectively. Among the tested models, the new model proposed by this study correlated best with experimentally detected moisture ratio drying curves as its R2 (0.99961–0.99999) was the highest while its χ2 (0.00001–0.00005) and RMSE (0.00120–0.00599) values were the lowest. It indicated that the new model was the best-fitted model to describe the drying behavior of the insulated paperboard. Figure 10 shows the excellent agreement between experimental and predicted MR values at different operating temperatures as the data points mainly scatter near the 45° straight line.
The model coefficients of the new model obtained after these regressions are given in Table 3 under the given experimental conditions, and then the new model curve fit for insulated paperboard drying characteristics is as shown in Figure 11. Indeed, the new model adequately describes and greatly predicts the moisture transfer kinetics of the paperboard in the hot-pressing process.

4. Conclusions

The changes of the moisture content, drying rate, temperature, as well as dimension of the insulated paperboard with drying time were used to analyze the moisture transfer characteristics in the hot-pressing process in this work. The hot-pressing process of the insulated paperboard can be divided into four stages, i.e., the warm-up stage, the boiling-point temperature stabilization stage, the temperature slowly rising stage, and the constant temperature stage, as presented in the temperature variation curves. We found that the peak of the drying rate was achieved in the boiling-point temperature stabilization stage. In addition, a higher temperature was beneficial to increase drying rate and shorten drying time consequently. As the operating temperature raised to 130 ℃ from 110 ℃, the maximum value of the drying rate was increased by 16.04%, and the drying time was decreased by 62.50%. Moreover, no significant difference was found in the early drying stage of the insulated paperboard when hot-pressed under different operating temperatures. It was recommended that the two-step heating procedure could be used in insulated paperboard drying to reduce energy consumption. Furthermore, eight commonly used thin-layer drying models and a proposed new model were employed to evaluate the moisture transfer kinetics of the insulated paperboard in the hot-pressing process. It was found that the new proposed model was able to present the highest R2 values (0.99961-0.99999), the lowest χ2 (0.00001-0.00005), and RMSE (0.00120-0.00599) values in all three operating temperatures as compared to other models. Therefore, it can be concluded that the new model could be an effective tool for modeling the moisture transfer kinetics of the insulated paperboard during the hot-pressing process.

Author Contributions

Conceptualization, L.K. and J.Z.; methodology, L.K.; formal analysis, J.L.; investigation, J.Z.; writing—original draft preparation, J.Z.; writing—review and editing, L.K. and Y.Y.; visualization, J.L. and Y.Y.; supervision, L.K. All authors have read and agreed to the published version of the manuscript.

Funding

This research was funded by the National Natural Science Foundation of China (Grant No. 21808135) and the National Key Research and Development Plan Program of China (Grant No. 2017YFB0308204).

Institutional Review Board Statement

Not applicable.

Informed Consent Statement

Not applicable.

Data Availability Statement

Not applicable.

Acknowledgments

The authors are grateful to the Hunan Guangxin Technology Co. Ltd. for providing the materials used for experiments.

Conflicts of Interest

The authors declare no conflict of interest.

References

  1. El-Saied, H.; El-Meligy, M.G.; Mohamed, S.H.; El-Mongy, S.A. Electrical insulated paper from cotton linter. Carbohydr. Polym. 2021, 90, 147–151. [Google Scholar] [CrossRef] [PubMed]
  2. Fahmy, T.Y.A.; Mobarak, F.; El-Meligy, M.G. Introducing undeinked old newsprint as a new resource of electrical purposes paper. Wood Sci. Technol. 2008, 42, 691–698. [Google Scholar] [CrossRef]
  3. Schaible, M. Electrical insulating papers-An overview. IEEE Electr. Insul. Mag. 1987, 3, 8–12. [Google Scholar] [CrossRef]
  4. Prevost, T.A.; Oommen, T.V. Cellulose insulation in oil-filled power transformers: Part I-history and development. IEEE Electr. Insul. Mag. 2006, 22, 28–35. [Google Scholar] [CrossRef]
  5. Fernández, I.; Delgado, F.; Ortiz, F.; Ortiz, A.; Fernández, C.; Renedo, C.J.; Santisteban, A. Thermal degradation assessment of Kraft paper in power transformers insulated with natural esters. Appl. Therm. Eng. 2016, 104, 129–138. [Google Scholar] [CrossRef] [Green Version]
  6. Wu, G.F.; Jiang, Y.F.; Ping, Q.; Lang, Q.; Pu, J. Effect of chemical modification and hot-press drying on poplar wood. Bioresources 2010, 5, 2581–2590. [Google Scholar]
  7. Emsley, A.M.; Stevens, G.C. Kinetics and mechanisms of the low-temperature degradation of cellulose. Cellulose 1994, 1, 26–56. [Google Scholar] [CrossRef]
  8. Ribeiro, H.A.; Costa, C. Modeling and simulation of the hot-pressing process in paper production: A heat- and mass-transfer analysis. Ind. Eng. Chem. Res. 2007, 46, 8205–8219. [Google Scholar] [CrossRef]
  9. Hou, J.; Yi, S.; Zhou, Y.; Pan, B. Moisture state variety in poplar lumber with moisture content above fibre saturation point during hot-press drying. J. Wood Sci. 2018, 64, 730–737. [Google Scholar] [CrossRef] [Green Version]
  10. Tang, Y.; Pearson, R.G.; Hart, C.A.; Simpson, W.T. A numerical model for heat transfer and moisture evaporation processes in hot-press drying-an integral approach. Wood Fiber Sci. 1994, 26, 78–90. [Google Scholar]
  11. Han, C.J.; Xu, J.M.; Jiang, J.L.; Jiang, J.H.; Lv, J.X. Moisture content distribution of multiple eucalyptus veneers during hot-press-drying. Wood Res. 2014, 59, 351–358. [Google Scholar]
  12. Ribeiro, D.P.; Vilela, A.P.; Silva, D.W.; Napoli, A.; Mendes, R.F. Effect of Heat Treatment on the Properties of Sugarcane Bagasse Medium Density Particleboard (MDP) Panels. Waste Biomass Valorization 2019, 11, 6429–6441. [Google Scholar] [CrossRef]
  13. Kong, L.; Yang, X.; Hou, Z.; Dong, J. Mathematical modeling of drying kinetics for pulp sheet based on Fick’s second law of diffusion. J. Korea Tech. Assoc. Pulp Pap. Ind. 2020, 52, 23–31. [Google Scholar] [CrossRef]
  14. Zhao, P.; Ge, S.; Ma, D.; Areeprasert, C.; Yoshikawa, K. Effect of hydrothermal pretreatment on convective drying characteristics of paper sludge. ACS Sustain. Chem. Eng. 2014, 2, 665–671. [Google Scholar] [CrossRef]
  15. Doymaz, İ. Evaluation of some thin-layer drying models of persimmon slices (Diospyros kaki L.). Energy Convers. Manag. 2012, 56, 199–205. [Google Scholar] [CrossRef]
  16. Han, C. Heat and Mass Transfer of Multiple Veneers Hot-Press Drying and Its Process Optimization. Ph.D. Thesis, Chinese Academy of Forestry, Beijing, China, 27 June 2014. (In Chinese). [Google Scholar]
  17. Liu, Y. Study on Heat-Conduction of Fiberboard and Plywood in the Hot-Pressing Process. Ph.D. Thesis, Nanjing Forestry University, Nanjing, China, 18 June 2013. (In Chinese). [Google Scholar]
  18. Wang, H.; Lu, T.; Jiang, P. Experimental investigation on carrot drying characteristics by hot air. J. Therm. Sci. Technol. 2015, 14, 456–461. [Google Scholar]
  19. Hii, C.L.; Law, C.L.; Cloke, M. Modeling using a new thin layer drying model and product quality of cocoa. J. Food Eng. 2009, 90, 191–198. [Google Scholar] [CrossRef]
  20. Gómez-de la Cruz, F.J.; Casanova-Peláez, P.J.; López-García, R.; Cruz-Peragón, F. Review of the drying kinetics of olive oil mill wastes: Biomass recovery. Bioresources 2015, 10, 5777–5802. [Google Scholar] [CrossRef] [Green Version]
  21. Henderson, S.M.; Pabis, S. Grain drying theory: I. Temperature effect on drying coefficient. J. Agric. Eng. Res. 1961, 6, 169–174. [Google Scholar]
  22. Henderson, S.M. Progress in developing the thin layer drying equation. Trans. Am. Soc. Agric. Eng. 1974, 17, 1167–1172. [Google Scholar] [CrossRef]
  23. Lewis, W.K. The rate of drying of solid materials. J. Ind. Eng. Chem. 1921, 13, 427–432. [Google Scholar] [CrossRef]
  24. Page, G.E. Factors Influencing the Maximum Rate of Air Drying Shelled Corn in Thin-Layers. Master’s Thesis, Purdue University, West Lafayette, IN, USA, 1949. [Google Scholar]
  25. Omolola, A.O.; Kapila, P.F.; Silungwe, H.M. Mathematical modeling of drying characteristics of Jew’s mallow (Corchorus olitorius) leaves. Inf. Processing Agric. 2019, 6, 109–115. [Google Scholar] [CrossRef]
  26. Midilli, A.; Kucuk, H.; Yapar, Z. A new model for single-layer drying. Dry. Technol. 2002, 20, 1503–1513. [Google Scholar] [CrossRef]
  27. Ertekin, C.; Firat, M.Z. A comprehensive review of thin-layer drying models used in agricultural products. Crit. Rev. Food Sci. Nutr. 2015, 57, 701–717. [Google Scholar] [CrossRef]
  28. Cai, Z.L.; Ma, X.Q.; Qing, X.; Yu, S. Drying kinetics and characteristics of sewage sludge/rice straw mixture. Dry. Technol. 2015, 33, 1500–1509. [Google Scholar] [CrossRef]
Figure 1. Schematic diagram of the hot-pressing experimental equipment: 1-Upper-layer hot plate; 2-Middle-layer hot plate; 3-Lower-layer hot plate; 4-Pressure setting and display instrument; 5-Pressure relief handle; 6-Hydraulic cylinder; 7-Main switch; 8-Indicator light; 9-Timer; 10-Temperature setting meter for each layer; 11-Heating switch; 12- Indicator light; 13-Pressure switch.
Energies 15 02069 g001
Figure 2. Thermocouples distribution in the insulated paperboard.
Energies 15 02069 g002
Figure 3. Morphological changes of the insulated paperboard in hot-press drying process: (a) Raw state; (b) Initial state; (c) Dried 5 min; (d) Dried 10 min; (e) Dried state.
Energies 15 02069 g003
Figure 4. The temperature variation curve of the insulated paperboard in hot-pressing.
Energies 15 02069 g004
Figure 5. The average temperature of the insulated paperboard.
Energies 15 02069 g005
Figure 6. The moisture content of the insulated paperboard.
Energies 15 02069 g006
Figure 7. The drying rate of the insulated paperboard.
Energies 15 02069 g007
Figure 8. The size retention rate of the insulated paperboard.
Energies 15 02069 g008
Figure 9. Relative porosity of the insulated paperboard.
Energies 15 02069 g009
Figure 10. Verification of experimental and predicted moisture ratio values from the new model.
Energies 15 02069 g010
Figure 11. Comparison of experimental and predicted moisture ratio with the new model.
Energies 15 02069 g011
Table 1. Thin-layer drying models used for kinetics determination.
Model NameModel EquationReference
Henderson and Pabis modelMR = aexp(−kt)[21]
Two-term modelMR = aexp(−k1t) + bexp(−k2t)[22]
Lewis modelMR = exp(−kt)[23]
Page modelMR = exp(−ktn)[24]
Logarithmic modelMR =aexp(−kt) + b[25]
Midilli modelMR = aexp(−ktn) + bt[26]
Weibull distributionMR = exp(−(t/a)n)[27]
Hii et al. modelMR = aexp(−ktn) + bexp(−gtn)[19]
New modelMR = aexp(−ktn) + bexp(−gtm)This article
Table 2. Statistical results of the nice thin-layer drying models at various temperatures.
Model NameDrying Temp. (℃)R2χ2RMSE
Henderson and Pabis model1100.968880.003260.05361
1200.933140.011450.09572
1300.904960.020670.12150
Two-term model1100.969770.003650.05284
1200.951800.011010.08128
1300.949170.018420.08886
Lewis model1100.963940.003540.05771
1200.922090.011860.10333
1300.893470.019300.12863
Page model1100.979590.002140.04341
1200.997100.000500.01995
1300.992320.001670.03454
Logarithmic model1100.968970.003480.05353
1200.947240.010330.08503
1300.947210.014350.09055
Midilli model1100.982800.002080.03985
1200.997520.000570.01844
1300.993630.002310.03144
Weibull distribution1100.979590.002140.04341
1200.997100.000500.01995
1300.992320.001670.03454
Hii et al. model1100.996440.000470.01813
1200.998050.000530.01634
1300.993620.003470.03146
New model1100.999610.000050.00599
1200.999940.000020.00283
1300.999990.000010.00120
Table 3. Values of the coefficients for the new model.
Drying Temp. (°C)MR =aexp(−ktn) + bexp(−gtm)
aknbgm
1100.433400.000005.874930.565620.059540.97990
1200.452330.000004.863470.547720.026461.44339
1300.612530.024391.610960.387380.0000010.27563
Publisher’s Note: MDPI stays neutral with regard to jurisdictional claims in published maps and institutional affiliations.

