Abstract
We suggested earlier a new sustainable method for permafrost thermal stabilization that combines passive screening of solar radiation and precipitation with active solar-powered cooling of the near-surface soil layer thus preventing heat penetration in depth. Feasibility of this method has been shown by calculations, but needed experimental proof. In this article, we are presenting the results of soil temperature measurements obtained at the experimental implementation of this method outside of the permafrost area which actually meant higher thermal loads than in permafrost area. We have shown that near-surface soil layer is kept frozen during the whole summer, even at air temperatures exceeding +30 °C. Therefore, the method has been experimentally proven to be capable of sustaining soil frozen. In addition to usual building and structures’ thermal stabilization, the method could be used to prevent the development of thermokarst, gas emission craters, and landslides; greenhouse gases, chemical, and biological pollution from the upper thawing layers, at least in the area of human activities; protection against coastal erosion, and permafrost restoration after wildfires. Using commercially widely-available components, the technology can be scaled up for virtually any size objects.
1. Introduction
Permafrost is characterized by a subzero temperature of rocks and/or soil for two or more years and the absence of seasonal thawing. Permafrost underlies ca. 35 million km2 of land around the world: throughout Antarctica, about 85% of Alaska, 65% of Russia, 55% of Canada, about a quarter of the Northern Hemisphere.
The general trend for global temperature increase leads to permafrost thawing. Global warming is currently most pronounced in the Arctic, twice faster than the global average, leading to up to 0.7 °C/decade air and 1.0 °C/decade soil temperature increase [1,2,3,4]. This leads to permafrost thawing resulting in ground deformation, among other things. During the last century, permafrost regions shrunk by ca. 10%, and each 1 °C of warming leads to a loss of ca. 5.8 million km2. Permafrost also exists in 3.56 million km2 of alpine regions, where its thawing leads to rock and ice falls, landslides, and floods. Even if permafrost still has a negative temperature, its bearing capacity could be significantly reduced.
To protect constructions and buildings from damage caused by underlying permafrost degradation (for 80% of those in Russia, hard frozen soil is critical for the foundation), different methods are used currently, but those are becoming insufficient at ambient changes in conditions (thermosyphons, screens) or too expensive (fossil fuel-driven refrigerators). Despite long experiences of these methods’ implementation, analysis of best practices and cost effectiveness is still missing. This leads, particularly, to inappropriate methods’ application; e.g., thermosyphons have been suggested originally to maintain soil frozen in depth, under foundation pillars, but those are widely used now where near-surface freezing is actually needed.
The importance of soil state monitoring is also increasing to prevent disasters, but it is rather expensive across vast unpopulated areas. Nowadays, damage to property caused by permafrost degradation in Russia is measured in USD 100 M yearly [5,6]. While, even in monetary terms, harm to nature can be orders of magnitude higher (recent 21,000 t diesel fuel spill in Norilsk from a reservoir costing USD 300 k led to USD 15 M direct losses and USD 3 B environmental damage reimbursement). All this makes new and cost-effective approaches for permafrost thermal stabilization highly demanded.
We have earlier devised a concept combining passive shielding of solar radiation and precipitation and active cooling of the soil by solar-powered heat pump [7,8]. Assuming solar power generation efficiency to be 15% and power-to-chill efficiency to be 3.3, overall cooling effect is about a half of the solar radiation, in addition to the latter being completely rejected from the soil surface. Unlike thermosyphon-based systems [9] buried to ca. 10 m, we suggest cooling the near-surface layer and, therefore, prevent the heat penetration in depth, significantly reducing the active layer thickness to the ground probes’ position (first decimeters). These shallow ground probes could be highly demanded in mountainous areas, particularly, to prevent landslides. A significant thermal inertia of the soil resolves the main problem of the renewable energy—the need to maintain a balance of intermittent generation and priority consumption—here, energy can be used as it is generated without special storage devices. Greenhouse gases, chemical, and biological pollution [10] coming from the near-surface soil levels mainly are also prevented in this way. Such distributed solar-powered systems are well suited for critical infrastructure protection [11]. Presence of an autonomous power source provides possibilities for thorough monitoring of soil and protected objects in general.
We have performed an experimental proof of this concept, particularly near-surface heat shielding layer maintenance possibility, and hereby present the obtained results.
2. Experimental Site and Setup
2.1. General Layout
The experimental site consisted of the reference plot for soil temperatures and the experimental setup (Figure 1). The latter consisted of the sand prism (2.5 × 5.5 m footprint, 1.1 m height, 1:1 rate of the side slope) with buried temperature sensors and cooling ground probes (20 cm below sand surface at sides and top) and 100 mm extruded polystirol foam heat insulation (0.033 W/(m·K)) at the bottom and end faces; south end face was additionally covered with Al-foiled LDPE foam (5 mm thick).
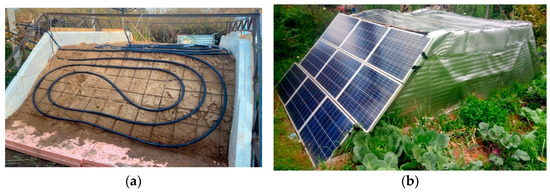
Figure 1.
General view of the experimental setup at construction (a) and operation (b).
2.2. Electric Subsystem
Solar panel arrays were placed ca. 40 cm above sand surface: at E and W faces at 45° tilt; the top array had just 2° tilt to S. Different types of solar modules were used: flexible mono-Si (1 kW, E side), rollable CIGS (1 kW, top), and framed poly-Si (0.9 kW, W side). Each array had a separate MPPT tracker (Photon-150-50, A-electronica) coupled to a 2.4 kWh Li:FePO4 battery (12–200, SunStonePower). Such array daily output reached 15 kWh. A 5 kW solar hybrid inverter (Progress-12–5000-Hybrid, A-electronica) was used to power the heat pump connected via remote controlled solid state relay (80 А) and a soft-start module (SSR-150 WA) to damp current at compressor start.
2.3. Heat Transfer Subsystem
Heat pump energy efficiency rate (EER) for cooling depends on temperature difference between cold and hot contours. The easiest option for us was to implement a heat sink demanding 50 K difference between mean temperatures in cold and hot contours. That could be reduced significantly (and so EER increased) if water or soil that does not need thermal stabilization were used. Such heat sinks could normally be found around on practice.
A 7.8 kWt ground–water heat pump (Access-7, EnergyLex) with a nominal (for the temperature range we used) COP 4.3 (or EER = COP-1 = 3.3) was cooling the ground probes (standard LDPE pipe 25 mm) filled with 50% water solution of ethylene glycol to –9 °C return (18 L/min) at start-stop regime. There were 4 loops of ground probes (each 20 m long, with nominal spacing of 20 cm): 1 per side and 2 on top. The heat was derived to the 60 m2 floor heating system within a house adjacent, with return temperature of +35 °C (7 L/min). The heated house was chilled to +22 °C by 8 kWt air conditioner. The heat pump had been working during the whole warm season: early April to late October.
2.4. Data Acquisition Subsystem
Data acquisition has been performed using Arduino Due and Uno boards. We have been monitoring soil temperatures in 3 lines at 0, 6.7, 13.5, 27, 54, and 98 cm below sand surface in the prism and in one reference line outside the setup (sensors at standard 20, 40, 80 cm depths were also added there), between and along ground probes, at the inlets and outlets of the heat pump (separate for each ground loop), air between solar panels and sand prism, and ambient air. Prior to installation, all waterproof DS18B20 temperature sensors were calibrated in an ice bath. We have also been measuring heat fluxes at soil and ground probes’ surface, water flow in heat pump contours, sand moisture, solar radiation at prism sides and top, and electric power consumed by the heat pump.
2.5. Ambient Conditions
We have performed the experiment outside the permafrost regions (N 55.1°; E 36.6°). However, this means even harder conditions for the thermal stabilization system since there is warmer air and no permafrost underlying. These all provided higher thermal loads and lower energy output from solar panels. The reference climatic data are provided in Table 1.

Table 1.
Reference climatic data for the experimental site [12,13,14].
We also used sand as a substrate, being the second hardest (after gravel and rocks) to keep frozen (has thick active layer); while the peat upper soil layer widely abundant in permafrost regions forms the thinnest active layer and, being almost black, is the most sensitive to direct solar radiation (if surface vegetation is damaged or removed). So, the sand environment also ensured harder conditions for our tests than expected naturally in most cases.
2.6. Numerical Modeling
We have calculated our experimental setup thermal state according to its actual layout using the same approaches as in [8] to evaluate the numerical and experimental results match. The modeling was performed using Frost-3D Multi-Core GPU software (https://frost3d.ru/eng/, accessed on 10 March 2022) which has been specially developed for permafrost soil calculations; its validity of results has been verified by analytical solutions [15] and practical applications, compared to the most popular FEM packages [16], and conformity to relevant national and corporate construction regulations certified.
3. Results
First, we have performed a numerical modeling for our experimental setup layout and ambient conditions to see if it is capable of maintaining soil frozen. The results have shown sand would be thawed slightly below ground probes’ level but frozen core would still exist in the embankment. This modeling allowed us to confirm chosen electric and cooling capacities which were sufficient.
3.1. Thermal Measurements
An example of experimental data is presented in Figure 2. Temperature rise in the beginning of this dataset corresponds to the circulation pump failure. One can see counter phase oscillations in surface and in depth temperatures caused by cooling output increase at high solar radiation when the heat pump was able to work at maximum performance. There is also about a half-day time lag for this depth, since weaker night heat waves reach the ground probes’ level once those are cooled to the maximum extent, and in reverse at night. The ability of comparatively fast (about 3 days) recovery to steady state indicates a fair cooling capacity reserve of the system.
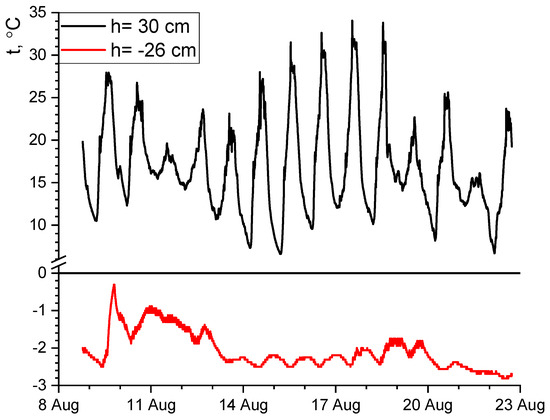
Figure 2.
Recorded temperatures of the air under solar panels (30 cm) and at 26 cm depth in August 2021.
Peak heat flux through the wall of the ground probe pipe reached 190 W/m2. Its time-averaged value depended on weather (heat pump duty cycle needed to keep the heat carrier in the ground loop cool enough) and power available from the solar panels and battery; it reached 110 W/m2 in the hottest weather. Assuming the temperature difference through the wall to be about 5 K, the peak and maximum average heat exchange rates could be evaluated as 38 and 22 W/(m2 K), correspondingly.
Temperature rise in the lower part of the experimental setup (Figure 3) is caused by non-ideal heat insulation of the bottom from the warm ground and heat sink from the edges. Since the heat shielding layer has always stayed frozen, it would not let heat in if there was permafrost below.
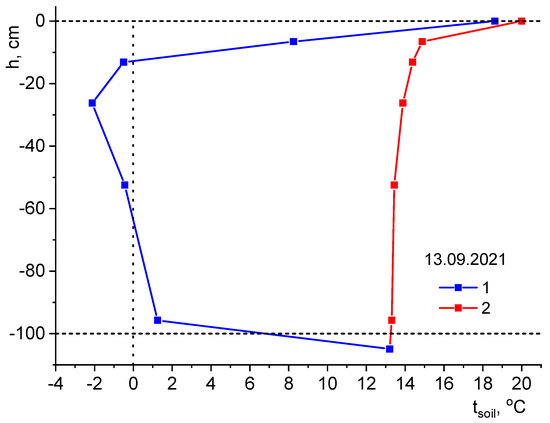
Figure 3.
Soil temperature profile at experimental and reference plots (1—Experimental and 2—Reference sites; dashed line at −100 cm depth shows the upper edge of the heat insulation layer).
Figure 4 shows that the heat flux at the ground surface of the experimental plot (solar radiation shielded) strongly correlates with the air temperature; while at the reference plot, it has higher amplitude obviously caused by solar radiation, even though the heat flux sensor is hidden under grass and is not irradiated directly. This figure shows how important it is to take solar radiation (note, it is divided by 10) into account in numerical calculations in the autumn and spring, particularly, when convective heat flux is reduced due to small difference between air and soil surface temperatures. Reference soil surface at night is warmer than air, so the heat flux is reversed; while at the experimental site, it is reversed only at negative air temperatures at night.
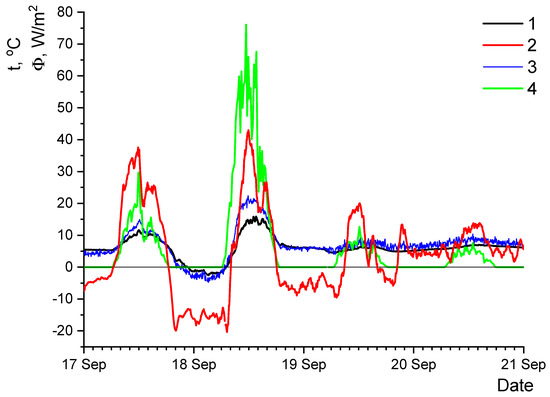
Figure 4.
Heat fluxes to the ground and their dependence on meteo data (1—Air temperature; heat fluxes Φ: 2—At the reference plot and 3—At the experimental site at soil surface, 4—Solar radiation at horizontal surface (divided by 10)).
The performance of the heat pumps is usually characterized by COP. We have evaluated this parameter measuring heat flow diverted to the sink (house floor) divided by electricity consumption (Figure 5). Since the heat pump was working in start-stop regime, the data were time-averaged to get COP values. We suggest fluctuations of the actual COP are, to a large extent, caused by measurement uncertainties using non-specialized sensors and averaging issues. Monthly data from electric and heat power meters have shown COP variation was rather marginal from 4.27 in August to 4.48 in May. That was due to the stable heat source (ground) temperature that stayed within −2.5 ± 0.5 °C mainly, and heat sink temperature that was sustained by AC unit setup at +22 °C (higher than mean air temperature of the hottest month in permafrost areas [12]; in fact, ultimate indoor temperature reached +26 °C).
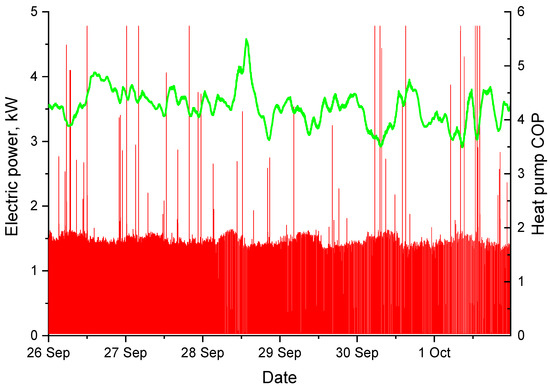
Figure 5.
The results of actual COP (green line) evaluation and actual electric power consumption measurements (red line, peaks correspond to start current records).
3.2. Technical Issues
Failures of the system happened due to high start currents (resolved by soft-start module); circulation pump burnt due to condensate filling the connection box completely (resolved by thermal insulation of the pump outer surfaces); MPPT controller fire during hot weather; compressor knocking due to solar inverter frequency modulation failure; DAQ failures after thunderstorms. Since the pipe’s volume is high, the system needs quite large buffer tanks to damp pressure fluctuations of the ethylene glycol-rich heat carrier.
We observed no sand surface drying since water vapor condensation on it was rather cool. Keeping soil wet at precipitation rejection is important since its thermophysical properties are strongly dependent on water content. The house where the heat was diverted to did not need other heating till late October.
3.3. System Cost
The main system components’ retail and bulk market prices are listed in Table 2. We suggest that retail price is more or less equal to bulk price plus associated assembly and mounting expenses. For remote areas, logistics might be a significant part of overall project cost, so it is not considered here; just an idea of specific mass for the components is given for basic evaluations. One can see solar panels give the main input in mass. We have not been considering light flexible ones since those are not suitable to withstand harsh weather conditions and would need some holding carcass anyway, so we considered those certified for −40 °C. The inverter power matches solar panel power, and takes into account that its nameplate capacity should be 2.5-fold of the heat pump compressor drive to avoid collapse at start. Noteworthy, solar panels have been showing 25% and heat pumps have a 10% price reduction in the long-term (negative CAGR).
Table 2.
Estimated costs of various methods’ implementation.
Other technologies for comparison are shown at the bottom of the table. We compared the solar-powered chiller as the most technically relevant technology and thermosyphons as the most popular way of soil thermal stabilization in Russia. Thermal insulation is mentioned as one of the cheapest methods for passive thermal stabilization. The reason why the cheapest method is not the most popular could be because heat insulation reduces not only heating, but cooling, too. So even though thawing in summer is reduced, there still could be a positive trend in soil temperature over the years [8].
4. Discussion
4.1. System Layout
Start-stop regime for a heat pump is unfavorable due to high loads on compressor, electric system, and battery cycling. It is much better to use the inverter technology (frequency conversion) for soft start and smooth output control to match the power of solar panels. In inverter technology, AC is converted to DC, and then back to AC at variable frequency. Additionally, the solar inverter makes DC to AC conversion before that. It is reasonable to avoid such multiple conversions to reduce system cost and increase its reliability supplying DC current from solar panels just before the last DC/AC conversion. Similar task exists for solar-powered irrigation, so recently, solar pump inverters have become commercially available. Those are fed from solar panels, have built-in MPPT-tracker and provide AC at the output so that the frequency matches the actual power supply.
Moreover, using DC-driven compressors might be even more reasonable, particularly with brushless (BLDC) drives widely used in electric transport currently. Such BLDC-driven cooling units are used for the car fridges, but usually have small power and poor performance. This approach is also used in solar-driven water pumps. Such drives coupled with magnetocaloric heat pumps [18] could significantly reduce balance-of-system cost by eliminating the nameplate capacity reserve needed to start a traditional heat pump compressor.
For large-scale systems and remote areas, rotary refrigerators (turbo expanders) could be considered since they have significantly lower specific mass and volume (ca. 4-fold while being twice more expensive per Wt) that considerably affects logistics expenses to remote regions. For the same reason, we suggest using solar vacuum tube collectors with absorption heat pumps which might be undesirable even though potentially having higher solar energy to chill conversion efficiency.
For ground probes assembly, two approaches are most suitable in general. The first one is to lay those on the cleaned surface and put a ground layer on top. This method is most suitable for the road embankments. It can be implemented regardless of substrate state: actual thawed layer thickness, rocks, etc. The disadvantage is needed for at least 0.25 m3/m2 of soil (depending on compression rate) to be laid; workforce for ground probes deployment. The second is to use cable-laying machines that are capable to deploy the probes in a highly productive mode. For that, the soil should be thawed at least 10 cm deeper than projected probes. It is not so meaningful in this case if the vegetation is damaged since the soil will be shielded by solar panels.
4.2. Method Applicability
A degree-days concept is often used for basic thermal balance evaluations that reflects temperature gradients correlating with the convective flux. In Table 3 and Figure 6, we present data for comparison of conditions in these terms at our test site and those used for calculations in [8]. Here, we are considering positive degree-days only, while negative are significant, too. For colder winters in permafrost areas, these negative degree-days should lead to better soil cooling, particularly, since almost no snow is accumulated under solar panels, therefore, putting our test site in even less favorable conditions for thermal stabilization. We derived a climatic performance indicator to evaluate solar-powered cooling capability of thermal stabilization as a ratio of solar radiation to degree-days during the warm season. The higher the value, the easier are the conditions for our method. Figure 6 shows that the method is potentially available throughout the Russian territory.
Table 3.
Comparison of ambient conditions (warm season–positive degree–days at no snow).
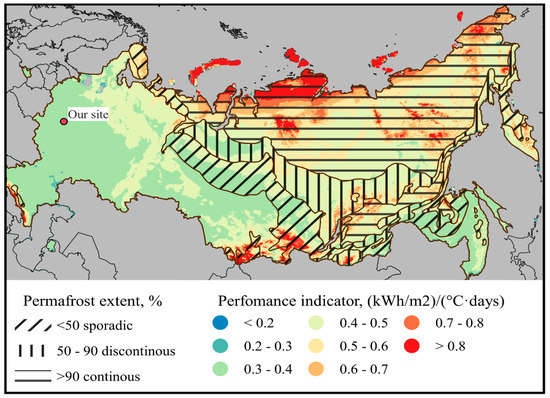
Figure 6.
The climatic performance indicator map showing the method applicability (values above 0.3 at equal power converters and protected area) according to climatic data (not normalized by system layout). Calculated using GIS data from [20].
To better evaluate the applicability of the method to the local conditions, the system layout should be considered, too. First, the product of solar energy conversion efficiency and heat pump EER gives the overall solar to chill conversion efficiency, which can vary significantly; that gives, after multiplication by the climatic performance indicator, the specific system performance indicator. Second, this parameter could also be improved by solar converters with an area larger than the protected one (thermally stabilized). However, we also suggest considering such a power increase using wind, particularly for coastal areas. It is also known that wind power output has a negative correlation with solar, being complementary sources [19], which makes energy flow to power the heat pump more stable. Such additional power increases the numerator, therefore, leading to the overall performance indicator rise. Another way to increase the resulting performance is to place converters vertically, since the incident solar radiation flux will be higher in high altitude regions, or at optimal angles on the wall, where applicable.
The next step is to pilot the project in a relevant environment with industrial heavy-duty equipment, casing, and scale. System control algorithms should also be developed to be synchronized with the weather forecast at different time scales; cooling capacity redistribution according to actual thermal loads. Noteworthy, cooler conditions in the Arctic ensure higher EER for the heat pump (less temperature difference between heat source and sink) and higher efficiency for solar panels than in this experiment. We suggest the technology could also be used to prevent the development of thermokarst, gas emission craters, and landslides, in certain cases; greenhouse gases, chemical, and biological pollution from the upper thawing layers, at least in the area of human activities; permafrost restoration after wildfires, and protection against coastal erosion [21]. The most important market feature of the proposed technology is that it can generate revenue through the sale of thermal energy removed from the ground (that could be used, for example, in greenhouses improving conditions for horticulture in remote Arctic settlements), and, to a lesser extent, excess electricity (more important is not the amount of energy supplied, but its availability throughout the protected object, for example, for control and monitoring systems).
5. Conclusions
We have experimentally proven the concept suggesting that solar radiation to chill conversion is capable of maintaining soil frozen, even at warmer and less sunny conditions outside the permafrost areas. The cheapest off-the-shelf equipment was used for this. Even though it could be specially optimized for the method implementation, for the moment, it is important that the system could be easily scaled up to virtually any size.
Technical results when using the proposed technology significantly exceed analogues at a comparable cost and specific mass; it could help reduce the insurance fees for environmental risks significantly. The main feature of this technology is blocking heat penetration in depth, therefore, preserving a thick frozen soil layer all year round. This approach is more efficient for surface objects than widely-used thermosyphons designed for foundation pillars base freezing in depth.
6. Patents
Authors are holding a patent RU 2 748 086 C1 (ePCT application RU2021/050325) for the method being proven.
Author Contributions
Conceptualization, methodology, validation, formal analysis, investigation, E.S.S., T.V.S. and E.Y.L.; resources and data curation, E.S.S. and E.Y.L.; writing—original draft preparation, E.Y.L.; writing—review and editing, E.S.S. and T.V.S.; visualization, E.S.S. and E.Y.L.; supervision and project administration, E.Y.L.; funding acquisition, E.S.S. All authors have read and agreed to the published version of the manuscript.
Funding
Work of E.Y.L. has been supported by the Russian Ministry of Science and Higher Education (state assignment No. 0705-2020-0046). Major hardware has been purchased using funds granted to E.S.S. by the Russian Foundation for Assistance to Small Innovative Enterprises (agreement No. 15718GU/2020) and the development is continued under agreement No. 4341GS1/70539.
Data Availability Statement
Main real-time data on temperature measurements are available at http://thingspeak.com/channels/1471266 (accessed on 10 March 2022).
Acknowledgments
Simmakers Ltd. has provided E.S.S. with free remote access to the Frost-3D package. Data acquisition and analysis were performed using the equipment of the “Beam-M” facility (Bauman Moscow State Technical University). Authors are extremely grateful to D.D. Skorik and R.A. Gerasimova for their help with the experimental site construction and maintenance, and to J.P. Clements for English proofreading.
Conflicts of Interest
The authors declare no conflict of interest, except those which could potentially arise at self-proving of the patented method. The funders had no role in the design of the study, in the collection, analyses, or interpretation of data; in the writing of the manuscript, or in the decision to publish the results.
References
- Chen, L.; Yu, W.; Lu, Y.; Liu, W. Numerical simulation on the performance of thermosyphon adopted to mitigate thaw settlement of embankment in sandy permafrost zone. Appl. Therm. Eng. 2018, 128, 1624–1633. [Google Scholar] [CrossRef]
- Post, E.; Alley, R.B.; Christensen, T.R.; Macias-Fauria, M.; Forbes, B.C.; Gooseff, M.N.; Iler, A.; Kerby, J.T.; Laidre, K.L.; Mann, M.E.; et al. The polar regions in a 2 °C warmer world. Sci. Adv. 2019, 5, eaaw9883. [Google Scholar] [CrossRef] [PubMed]
- Van Huissteden, J. Thawing Permafrost: Permafrost Carbon in a Warming Arctic; Springer: Berlin/Heidelberg, Germany, 2020. [Google Scholar] [CrossRef]
- Biskaborn, B.K.; Smith, S.L.; Noetzli, J.; Matthes, H.; Vieira, G.; Streletskiy, D.A.; Schoeneich, P.; Romanovsky, V.E.; Lewkowicz, A.G.; Abramov, A.; et al. Permafrost is warming at a global scale. Nat. Commun. 2019, 10, 264. [Google Scholar] [CrossRef] [PubMed]
- Badina, S.V. Estimation of the value of buildings and structures in the context of permafrost degradation: The case of the Russian Arctic. Polar Sci. 2021, 29, 100730. [Google Scholar] [CrossRef]
- Streletskiy, D.A.; Suter, L.J.; Shiklomanov, N.I.; Porfiriev, B.N.; Eliseev, D.O. Assessment of climate change impacts on buildings, structures and infrastructure in the Russian regions on permafrost. Environ. Res. Lett. 2019, 14, 025003. [Google Scholar] [CrossRef]
- Loktionov, E.Y.; Sharaborova, E.S.; Asanov, I.M. Prospective Sites for Solar-Powered Permafrost Stabilization Systems Integration in Russian Railways. In Proceedings of the 2019 8th International Conference on Renewable Energy Research and Applications (ICRERA), Brasov, Romania, 3–6 November 2019; p. 8996544. [Google Scholar] [CrossRef]
- Loktionov, E.Y.; Sharaborova, E.S.; Shepitko, T.V. A Sustainable Concept for Permafrost Thermal Stabilization. Sustain. Energy Technol. Assess. 2022, 52, 102003. [Google Scholar] [CrossRef]
- Hu, T.-F.; Liu, J.-K.; Hao, Z.-H.; Chang, J. Design and experimental study of a solar compression refrigeration apparatus (SCRA) for embankment engineering in permafrost regions. Transp. Geotech. 2020, 22, 100311. [Google Scholar] [CrossRef]
- Miner, K.R.; D’Andrilli, J.; Mackelprang, R.; Edwards, A.; Malaska, M.J.; Waldrop, M.P.; Miller, C.E. Emergent biogeochemical risks from Arctic permafrost degradation. Nat. Clim. Chang. 2021, 11, 809–819. [Google Scholar] [CrossRef]
- Asanov, I.M.; Loktionov, E.Y. Possible benefits from PV modules integration in railroad linear structures. Renew. Energy Focus 2018, 25, 1–3. [Google Scholar] [CrossRef]
- Popel, O.S.; Frid, S.E.; Kiselyova, S.V.; Kolomiets, Y.G.; Lisitskaya, N.V. Climate Data for Renewable Energy in Russia (Climatic Database); MIPT Publishing: Moscow, Russia, 2010. [Google Scholar]
- Research and Applications Reference Book on the Climate of the USSR; Hydrometeoizdat: Leningrad, Russia, 1989. Available online: http://aisori-m.meteo.ru/climsprn/ (accessed on 10 March 2022). (In Russian).
- Veselov, V.M.; Priblyskaya, I.R. Specialized Arrays for Climate Research. Available online: http://aisori.meteo.ru/ClimateR (accessed on 18 November 2020).
- Dauzhenka, T.A.; Gishkeluk, I.A. Consistency of the Douglas-Rachford splitting algorithm for the sum of three nonlinear operators: Application to the Stefan problem in permafrost soils. Appl. Comput. Math. 2013, 2, 100–108. [Google Scholar] [CrossRef][Green Version]
- Alekseev, A.; Gribovskii, G.; Vinogradova, S. Comparison of analytical solution of the semi-infinite problem of soil freezing with numerical solutions in various simulation software. IOP Conf. Ser. Mater. Sci. Eng. 2018, 365, 042059. [Google Scholar] [CrossRef]
- Zhang, A.A. Stabilization of the Temperature Regime in Frozen Soil of the Railroad Embankment Body and Foundation Using Slopes Heat Insulation. Ph.D. Thesis, Melnikov Permafrost Institute, Yakutsk, Russia, 2020; p. 128. [Google Scholar]
- Johra, H.; Filonenko, K.; Heiselberg, P.; Veje, C.; Dall’Olio, S.; Engelbrecht, K.; Bahl, C. Integration of a magnetocaloric heat pump in an energy flexible residential building. Renew. Energy 2019, 136, 115–126. [Google Scholar] [CrossRef]
- Solbakken, K.; Babar, B.; Boström, T. Correlation of wind and solar power in high-latitude arctic areas in Northern Norway and Svalbard. Renew. Energy Environ. Sustain. 2016, 1, 42. [Google Scholar] [CrossRef]
- Afonin, A.N.; Green, S.L.; Dzyubenko, N.I.; Frolov, A.N. Interactive Agricultural Ecological Atlas of Russia and Neighboring Countries. Economic Plants and Their Diseases, Pests and Weeds. Available online: http://www.agroatlas.ru (accessed on 11 January 2022).
- Ogorodov, S.; Aleksyutina, D.; Baranskaya, A.; Shabanova, N.; Shilova, O. Coastal Erosion of the Russian Arctic: An Overview. J. Coast. Res. 2020, 95, 599–604. [Google Scholar] [CrossRef]


Publisher’s Note: MDPI stays neutral with regard to jurisdictional claims in published maps and institutional affiliations. |
© 2022 by the authors. Licensee MDPI, Basel, Switzerland. This article is an open access article distributed under the terms and conditions of the Creative Commons Attribution (CC BY) license (https://creativecommons.org/licenses/by/4.0/).