Review

Integration of European Electricity Balancing Markets

by
Christos Roumkos
,
Pandelis N. Biskas
* and
Ilias G. Marneris
School of Electrical and Computer Engineering, Aristotle University of Thessaloniki, 54124 Thessaloniki, Greece
*
Author to whom correspondence should be addressed.
Energies 2022, 15(6), 2240; https://doi.org/10.3390/en15062240
Submission received: 13 February 2022 / Revised: 10 March 2022 / Accepted: 15 March 2022 / Published: 18 March 2022

Abstract

:
Achieving a fully integrated energy market under the EU electricity target model constitutes an ongoing process. Given that the integration of spot markets is already at a mature stage, the next step forward is the successful integration of the balancing markets across European control areas. An analytical review of all the aspects governing the European balancing market integration is presented in this paper, providing a detailed description on the European regulatory framework on this topic. In addition, the design variables that need to be harmonized among national balancing markets as well as the available balancing market arrangements for the exchange of cross-border balancing services are presented. Numerical examples of the essence of the balancing market integration are provided, and the implementation projects initiated by European transmission system operators (TSOs) towards this direction are described. The review concludes that balancing market integration may indeed lead to a significant reduction in the balancing costs for the participating control areas, but further effort is still required to move from a regional level to a European-wide real-time balancing market, so that the whole potential of such a new landscape is revealed to the benefit of end-consumers.

1. Introduction

During the last 25 years, the European Commission (EC) has set the ambitious goal of creating a fully integrated internal energy market (IEM) [1] in order to foster competition, ensure security of supply, and optimize the utilization of cross-border transmission capacity in all Member States. To do so, a variety of directives and regulations have been published, establishing the respective guidelines. Briefly, the first step towards this direction was the issuance of the First Energy Package (Directive 96/92/EC [2]) in 1996, which laid down the initial provisions for the establishment of common rules for the functioning of the internal electricity market. The most important requirement was the management and accounting unbundling of the national transmission system operators (TSOs). In 2003, the Second Energy Package (Directive 2003/54/EC [3] and Regulation 1228/2003/EC [4]) was adopted, continuing the liberalization of the internal electricity market and enabling commercial and residential consumers to choose freely their own electricity suppliers. In addition, the legal unbundling of the TSOs and the creation of independent national regulatory authorities (NRAs) were required. In 2009, the Third Energy Package (Directive 2009/72/EC [5], Regulation 713/2009/EC [6] and Regulation 714/2009/EC [7]) came into force, aiming to further liberalize and integrate European electricity markets by requiring a further unbundling of suppliers from network operators and the establishment of the agency for the cooperation of energy regulators (ACER) and the European network for transmission system operators for electricity (ENTSO-E). Moreover, this package outlines the guidelines for the development of network codes targeting the harmonization of the operational, technical, and market rules applying across European power systems. Of course, the successful completion of such a challenging task requires the close and continuous cooperation between the involved stakeholders (EC, ACER, ENTSO-E, and TSOs).
Towards this direction, in November 2008, the European Electricity Regulatory Forum (Florence Forum) decided to establish a working group of experts, regulators, and other stakeholders to develop an EU electricity market target model and a roadmap for the integration of electricity markets across European regions. The core tasks were the design of a well-functioning and effective model for the alignment of transmission capacity allocation and congestion management, and the establishment of a concrete roadmap with guidelines and steps for the successful integration of forward, day-ahead, intra-day, and balancing markets [8].
In brief, this target model envisions the coupling of the national electricity markets into one common electricity market, ensuring optimal use and potential investments in cross-border transmission capacity. By applying such market integration, the EC intends to take advantage of various benefits. Among the most crucial ones are the mitigation of the concentration levels in national balancing markets and the reductions in balancing costs for the involved TSOs. Of course, these cost reductions pass through to the electricity consumers via the reduced transmission tariffs and/or the imbalance settlement [9].
The main contribution of this paper is the fact that it gathers and analyses all the aspects governing the integration of the European electricity balancing markets. To the best of the authors’ knowledge, there is no such paper in the literature covering this topic. At this point, it is important to note that Europe is a pioneer in the conceptualization and implementation of electricity market integration. The respective level of maturity is high, already commencing several initiatives for the cross-border exchange of balancing services using pan-European platforms, and its implementation framework and regulations can constitute the basis for the integration of other markets (i.e., the U.S., Australia, and Asia). At the moment, the U.S. markets follow a decoupled regime with different regional transmission operators (RTOs), clearing their own internal markets (at the intra-RTO level) and performing some electricity transactions with neighboring RTOs (at the inter-RTO level) but with non-coupled wholesale electricity markets [10]. In the same vein, in Australia, a decoupled regime with three different price regions (Western Australia, the Northern Territory, and the eastern/south-eastern coasts) is being applied [11]. Finally, the southern Asian markets operate in a decoupled scheme, but there are research works [12] highlighting the gains that could emerge in case these markets adopt a coupled regime, by following the lessons and the experience gained from the European case.
The structure of this paper is as follows: Section 2 presents the regulatory framework established for the implementation of the electricity target model, whereas Section 3 emphasizes the way the balancing market can be integrated into one common market. Section 4 presents a numerical example of the concept of the balancing market integration incorporating three control areas, whereas Section 5 elaborates on European projects initiated by European TSOs for the successful completion of the integration process. Section 6 elaborates on the research works found in the literature that investigate the integration of electricity balancing markets, and finally Section 7 draws the respective conclusions.

2. European Commission Regulations on the Electricity Market Integration

This section provides more details on the respective regulatory frameworks established by the European directives/regulations to define concrete guidelines for the successful integration/coupling of the electricity markets.
As mentioned in the introductory section, the target model includes a set of implementation frameworks and network codes. After their adoption, such network codes became binding regulations in all Member States, as follows:
  • Regulation 1222/2015/EC of 24 July 2015 establishing a guideline on capacity allocation and congestion management [13]: This regulation includes detailed provisions on cross-zonal capacity (CZC) allocation and congestion management. The most remarkable provisions are the following:
    (a)
    The introduction of the flow-based transmission capacity calculation methodology. It is noted that in specific cases, if required, the net transmission capacity-based methodology can apply. The core advantage of the former is that it takes into account the physical flows on the interconnections, which are being calculated in accordance with the physical laws (Kirchhoff’s Laws) [14]. In other words, physical flows on interconnectors are different from the respective scheduled commercial power exchanges in the sense that, in reality, electricity flows from an exporting market area to an importing one through different paths (interconnectors) and not directly through the interconnector connecting such market areas (there is a distinction between the physical and economic perspectives). For example, in a highly meshed network as is the European one, a scheduled commercial exchange between Germany and France will partially flow directly between the two countries since the other portion will go through the routes Netherlands-Belgium-France, Switzerland-France and Switzerland-Italy-France. Hence, it becomes apparent that the latter methodology (net transmission capacity-based) fails in meshed electricity networks since it ignores the physical perspective;
    (b)
    The adoption of the implicit capacity allocation approach. In accordance with this allocation approach, the capacity between two market areas is allocated based on the market price difference between such market areas, and a netting of the flows in opposite directions may be achieved;
    (c)
    The definition of capacity calculation regions (CCRs) is geographic areas in which a coordinated capacity calculation is applied. According to [15], eight CCRs have been defined: Baltic (Poland, Lithuania, Estonia, and Latvia), Core (France, Belgium, The Netherlands, Germany, Austria, Czech Republic, Slovakia, Poland, Croatia, Hungary, and Romania), Greece-Italy, Hansa (The Netherlands, Germany, Poland, and Denmark), Italy North (Italy North, France, and Austria), Nordic (Sweden, Finland, and Denmark), South East Europe (Romania, Bulgaria, and Greece), and South West Europe (France, Spain, and Portugal).
  • Regulation 2017/2195/EC of 23 November 2017 establishing a guideline on electricity balancing [16]: This regulation refers to the balancing markets and outlines the requirements that shall be met towards the integration of this market segment, namely: (a) the definition of common rules for the procurement and the settlement of balancing reserves (frequency containment reserves (FCR), automatic frequency restoration reserves (aFRR), manual frequency restoration reserves (mFRR), and replacement reserves (RR)); (b) the definition of standard balancing products to be exchanged between European market areas; (c) the establishment of common clearing platforms for the activation of balancing energy from aFRR, mFRR, and RR.
  • Regulation 2017/1485/EC of 2 August 2017 establishing a guideline on electricity transmission system operation [17]: This regulation includes all the technical and operational guidelines that the European TSOs shall meet in order to ensure the normal functioning of their system networks and, consequently, the continuous supply of electricity.
Figure 1 schematically presents the conceptual framework of the European electricity target model as provisioned in the above-presented regulations.
As mentioned above, all these regulations are binding in all Member States of the European Union (EU), and their implementation is not affected by policies applied in non-EU (or third) countries. If the latter express their willingness to join the common platforms for exchanging balancing energy, then they shall be fully aligned with the provisions of such regulations by modifying their national policies accordingly.

3. Electricity Balancing Market Integration

This section focuses on the electricity balancing markets in Europe, providing details regarding the architecture of these balancing markets. In addition, this section elaborates on the specific variables that shall be harmonized between European TSOs so that the national electricity balancing markets are integrated into one common pan-European balancing market. Finally, this section presents the integration models that can be implemented towards this direction, referring to the preferable integration model in Regulation 2017/2195/EC.

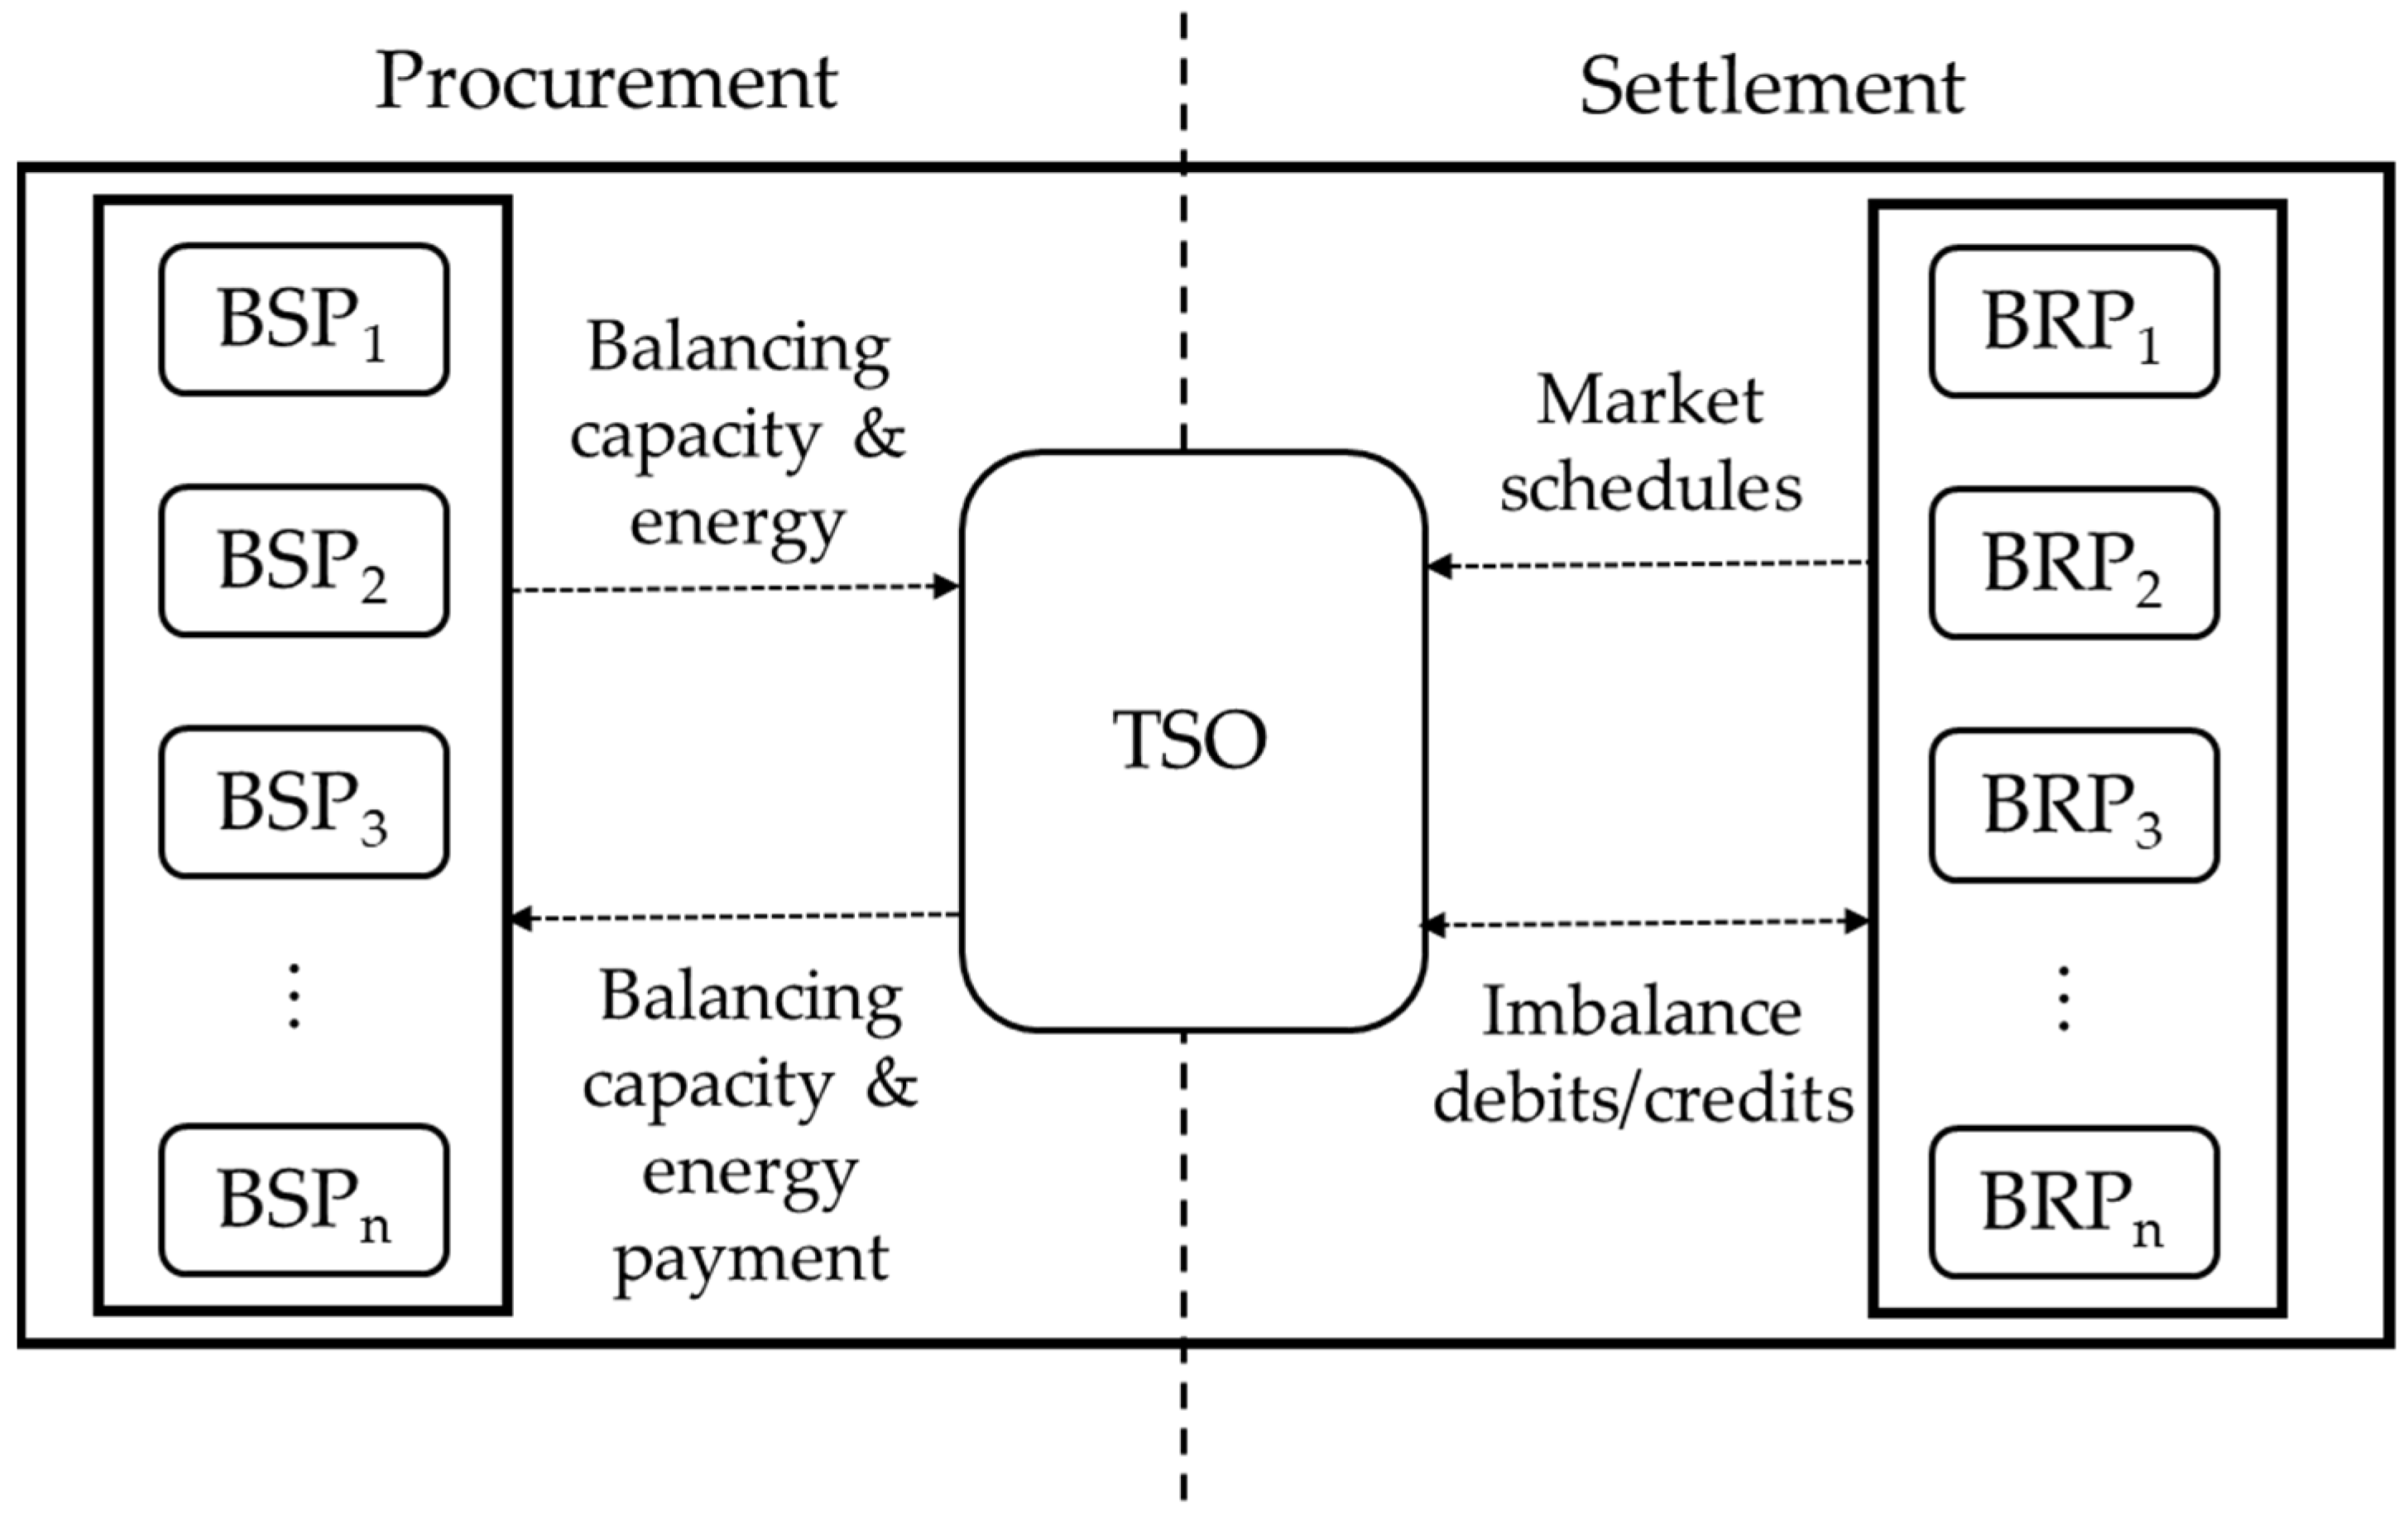
3.1. High-Level Architecture of the Balancing Market

The balancing market constitutes the last market segment where a TSO can ensure the security of electricity supply in its control area by maintaining, in a continuous manner, the balance between supply and demand. The core structural elements of this market found in the literature [18,19] are the following:
(a)
The balancing capacity market, which includes all the required actions taken proactively by a TSO in order to reserve well in advance enough balancing capacity from the balance service providers (BSPs) so as to be able to cover, in real-time, its imbalance needs by activating such reserves. In other words, the TSO secures the availability of BSPs that may be requested in real-time, if needed, to provide balancing energy. According to Regulation 2017/1485/EC [17], there are the following four types of balancing capacity:
  • FCR, also called a primary control reserve;
  • aFRR, also called a secondary control reserve;
  • mFRR, also called a fast tertiary control reserve or load-following reserve in the U.S.;
  • RR, also called slow tertiary control reserve.
For each one of the above-defined types, eligible BSPs (generating units, demand response resources, dispatchable renewable energy resources (RES), and energy storage resources) can submit upward and downward reserve orders in order to satisfy the respective upward and downward reserve requirements specified by the TSO. The orders with the lowest offer prices are accepted for possible activation in real-time conditions;
(b)
The balancing energy market, which includes all the required actions taken by a TSO in order to activate the capacity reserved in the balancing capacity market. Depending on the magnitude and direction (short or long) of the system imbalance (being the difference between demand and supply at each dispatch period), the TSO activates the appropriate volume of balancing energy. In general, in the case of a system shortage, upward balancing energy orders (BEOs) are activated, whereas in the case of a system surplus, downward BEOs are accepted for activation. The acceptance of the BEOs is based on their respective offer prices, and the general rule is that the upward orders with the lowest price and the downward orders with the highest price are accepted first to cover the system imbalance needs. Notably, the TSO compensates the BSPs for the provision of upward balancing energy while, on the other hand, BSPs pay back the TSO for the provision of downward balancing energy. Regarding the activation sequence of the reserves (Figure 2), the following is valid:
  • FCR constitutes the fastest balancing service to face a disturbance between supply and demand. It is activated within seconds (up to 30 s) after the appearance of the disturbance, and it is automatically provided through the kinetic energy of the connected generators. Its core objective is to stabilize the grid frequency to a new acceptable level close to the respective nominal frequency (50 Hz). It is noted that in the case of interconnected power systems, all systems jointly contribute to the provision of such a service. FCR is also called “primary reserve” in other ancillary services markets;
  • aFRR is utilized for the full restoration of the nominal grid frequency, and it is activated for up to 5–7.5 min after a disturbance. Unlike FCR, in the case of interconnected power systems, aFRR is activated only in the power system where the imbalance is experienced. aFRR is also called “secondary reserve” in other markets and “regulation” in the U.S. RTOs;
  • mFRR is utilized to release aFRR and it is activated for up to 12.5–15 min after a disturbance; mFRR can be included in the broader scope of tertiary control and can also be named “fast tertiary reserve” or “load-following reserve” [20]. mFRR is used for “load following” purposes, i.e., it helps to manage the system load and RES injection variability and uncertainty for timeframes that exceed 10 min [21];
  • RR is utilized to release or support the required level of FRR potential, so that the latter is available for future imbalances, and it is activated from 30 min to 60 min after a disturbance. RR is also included in the broader scope of tertiary control and can be named “slow tertiary reserve” or “contingency reserve”.
The mFRR and RR can be spinning or non-spinning; spinning mFRR is usually provided by rotating synchronous machines of thermal units, whereas non-spinning mFRR is provided by open cycle gas turbines (OCGTs), hydro units, and hydro-pumped storage units. Battery energy storage systems (BESS) can provide all types of reserves in all directions, based on their state-of-charge and their charge/discharge power;
(c)
The imbalance settlement is an ex-post process that allocates the costs derived from the operation of the balancing capacity and balancing energy markets to the balance responsible parties (BRPs), for example, to retailers with non-dispatchable load portfolios or to RES aggregators with non-dispatchable RES portfolios, based on the concept of balance responsibility. BRPs are entities that undertake the responsibility for settling the imbalances between their market schedules, as obtained from the clearing of the respective spot markets (day-ahead and intra-day) and the metered/allocated production (for RES aggregators) or consumption (for retailers). Such imbalances are penalized, and they are settled at the imbalance price. In general, BRPs with a short position pay to the TSO the respective amounts, while BRPs with a long position get paid by the TSO. There are several imbalance settlement schemes, such as single pricing (which is the preferred scheme for the European Commission [16]), dual pricing, as well as variations of these with additive cost components. A detailed analysis follows in Section 3.2.
Figure 3 draws schematically the core architecture of the balancing market, incorporating the two main pillars, namely, the following: (a) balance management (balancing capacity market and balancing energy market) and (b) imbalance settlement.

3.2. Design Variables for Balancing Market Harmonization and Integration

The integration of the day-ahead market has been achieved through the multi-regional coupling (MRC) [22], whereas the respective integration of the intra-day market is growing at a fast pace. Specifically, all intra-day markets, except for Greece, Ireland, and Slovakia, participate in the intra-day continuous trading mechanism, and their participants have access to the respective platform called XBID, to sell/buy energy quantities up to one hour before real-time. The incorporation of the remaining markets to achieve full integration is expected within the year 2022.
Thus, it is rational that the next step towards the creation of the IEM is the successful completion of the integration of the European balancing markets. The integration of this market segment is not a straightforward process since the balancing mechanisms applied by the European TSOs vary in terms of balance responsibility, balance service provision, and imbalance settlement.
A prerequisite to reaching a fully integrated balancing market is the harmonization, between the involved TSOs, of the national market rules (individual market design variables) that directly affect the creation of a common balancing market. More precisely, the term “harmonization” refers to the appropriate modifications that need to be performed in each national balancing regulatory and business framework in order to be aligned and ready for integration. Once completed, the integration process could be initiated, including the transition from a national regulatory framework to a Europe-wide one and the reformation of the market architecture [23].
An analytical overview of the core market design variables for balancing market harmonization found in literature [24,25,26,27] follows:
  • Dispatch period: the time-interval (usually quarter-hourly) over which the BEOs are activated [26];
  • Imbalance settlement period: the time-interval (hourly, half-hourly, or quarter-hourly) over which the BRP imbalances are calculated and settled [26]. For example, Greece, Germany, Belgium, The Netherlands, Austria, Slovakia, Hungary, and Romania apply a quarter-hourly imbalance settlement period [28]. While France and Ireland are the only control areas to apply a half-hourly settlement period, while the Nordic countries and Spain apply an hourly settlement period [28]. It is noted that the shorter the imbalance settlement period, the more challenging it is for BRPs to be balanced, and hence accurate forecasting processes shall be developed;
  • Balancing products: there are three types of balancing products, namely, FCR, FRR (with manual and automatic activation), and RR, for which different procurement processes and system/zonal requirements may be defined;
  • Timings of the balancing market: the timings include the gate opening and closure times for the submission of BEOs by BSPs and imbalance needs by TSOs as well as the appropriate coordination with the clearing timings of the spot markets (day-ahead and intra-day markets);
  • Procurement mechanism: BSPs provide balancing services to the TSO through bidding in the balancing market using specific types of balancing products. Another way for procuring balancing services is the bilateral contracting between the TSOs and the BSPs;
  • Reserve requirements: they constitute the required amount of power capacity that must be reserved in advance in order for a TSO to safeguard the generation/demand balance and the normal operation of the power system in real-time. For each of the above-defined balancing products, a different quantification method applies [29]. However, the exact quantification method per reserve type has been homogenized by ENTSO-E in the Regulation 2017/1485/EC (Article 153 for FCR, Article 157 for FRR and Article 160 for RR) [17];
  • Order specifications: the BSPs shall submit BEOs respecting the order submission rules, such as the maximum and minimum order price limits, volume, location, activation time, activation duration and activation method. Obviously, in a coupled balancing market such requirements must be aligned between the involved TSOs (control areas), otherwise no coupling can be performed;
  • Activation mechanism: it constitutes the process followed by a TSO for the activation of BEOs. There exist the following two main mechanisms: (a) pro-rata activation, where a TSO activates reserves to cover an imbalance in proportion to the size of the contracted reserves of each BSP; (b) merit-order activation, where a TSO covers its imbalance needs with the cheapest BEOs submitted by the BSPs. The former mechanism does not provide a signal of balancing prices, while the latter requires the existence of standard products [30,31]. The Regulation 2017/2195/EC [16] follows the second market-based approach. An additional factor for this variable is the time of activation. Notably, it is useful to distinguish between reactive and proactive activation. On one hand, reactive activation pursues curative objectives such as containing frequency deviation or restoring the frequency (FCR and FRR are principally deemed reactive processes since they observe the imbalance status and employ reserves to contain and restore the frequency) [32,33]. On the other hand, proactive activation follows preventive objectives such as reducing the future imbalance, creating reserve margins, or relieving congestion (RR can be classified as a proactive process);
  • Balancing energy pricing mechanism: it constitutes the method used by a TSO for settling the activated BEOs. There are the following two pricing mechanisms, namely: (a) pay-as-bid pricing and (b) marginal pricing. With marginal pricing, all accepted BEOs are remunerated with the order price of the last (marginal) BEO activated from a merit order list. The main advantage of the pay-as-bid mechanism is the fact that the BSPs receive the price they bid, while the disadvantageous point is the lack of a clear market reference price. On the other hand, the marginal mechanism provides a transparent price derivation and imbalance price calculation, but it may lead to higher procurement costs and imbalance settlement prices [34]. In the marginal pricing scheme, the balancing energy prices can be regarded as an index of the very short-term marginal cost of increasing/decreasing production to achieve system balancing, thus it can provide the economic signals to potential investors of flexible resources for the expected revenues from providing frequency-response and flexibility services to the TSO. All European TSOs follow the marginal pricing scheme based on the provisions of Article 30 of Regulation 2017/2195/EC [16];
  • Imbalance volume calculation methodology: the methodology through which imbalance volumes of BRPs are quantified varies across European TSOs. According to [35,36], there are the following three methodologies for the calculation of the imbalance volumes: (a) the first one considers that all generation and consumption resources are included in the same balance perimeter, thus they are part of the same BRP. Meaning that this BRP is responsible over the whole portfolio (both energy production and consumption), and that consumption imbalances could be offset by production imbalances (indicatively, this scheme is followed in France, Germany, Belgium, the Netherlands, and Poland [28]); (b) The second one under which all generation resources constitute one balance perimeter and all consumption resources constitute another balance perimeter, without having the possibility to net the imbalances among each other (indicatively, this scheme is followed in Spain, Norway, Finland, Sweden, and Denmark [28]). (c) each generating unit constitutes a separate balance perimeter of the BRP and all consumption resources constitute a distinct balance perimeter of the BRP (indicatively, this scheme is followed in Italy and Greece [28]);
  • Imbalance pricing mechanism: the method used by a TSO to calculate the imbalance settlement price for a given imbalance settlement period, at which all debits/credits between BRPs and the TSO will be settled. This calculation is based on the prices of the upward and downward BEOs activated to cover the imbalance for the concerned imbalance settlement period. The controversial point in this variable is whether the imbalance settlement prices for a given position in the system (either short or long) shall be identical (single imbalance pricing) or not (dual imbalance pricing) [37,38]. In the former mechanism, as shown in Table 1, only one imbalance settlement price is derived, which applies to all BRPs, independently of their respective individual positions, and it is equal to the price that occurred for the dominant direction of the system imbalance. To be more precise, if the system is short, then the imbalance settlement price is equal to the price of the marginally accepted upward BEO for markets with marginal pricing or the average price of all accepted upward BEOs for markets with pay-as-bid pricing (Pup in Table 1). In the same vein, if the system is long, then the imbalance settlement price is equal to the price of the marginally accepted downward BEO for markets with marginal pricing or the average price of all accepted downward BEOs for markets with pay-as-bid pricing (Pdn in Table 1).
On the other hand, in the dual pricing mechanism, two imbalance settlement prices are derived (if for a given imbalance settlement period, both upward and downward BEOs are activated) and, depending on the BRPs’ imbalance position, the respective imbalance settlement price applies. At this point, it should be noted that for this mechanism. two cases can be defined as follows:
(a)
BRPs with the short position pay the price of the marginally accepted upward BEO or the average price of all accepted upward BEOs (Pup in Table 2) and BRPs with long position get paid at the price of the marginally accepted downward BEO or at the average price of all accepted downward BEOs (Pdn in Table 2);
(b)
BRPs with the opposite position against the system position pay or get paid at the price of the day-ahead market [39] (PDAM in Table 3), while BRPs with the same position against the system position pay or get paid at the price of the marginally accepted upward or downward BEO or at the average price of all accepted upward or downward BEOs (Pup and Pdn in Table 3).
At the moment, across the European region, France, Germany, Greece, Belgium, and Poland apply single imbalance pricing, whereas the Czech Republic, Hungary, Slovenia, and Bulgaria apply the dual one [28]. It is also worth mentioning that in control areas where generation and consumption constitute different balance perimeters, TSOs may apply different imbalance pricing mechanisms for the imbalances of generation and consumption. For instance, in Nordic control areas, the imbalances that occur for generation are settled with the dual imbalance pricing mechanism, while the respective imbalances for consumption are settled with a single one [40]. According to Article 52 of the Regulation 2017/2195/EC [16], the preferred imbalance settlement scheme is single pricing, which is advantageous for BRPs with significant imbalances (e.g., RES aggregators representing wind and solar stations).
  • Timing of settlement: the frequency (weekly or monthly) and time of financial settlement between the TSOs and BSPs for the provided balancing services and between the TSOs and BRPs for the imbalances of the latter;
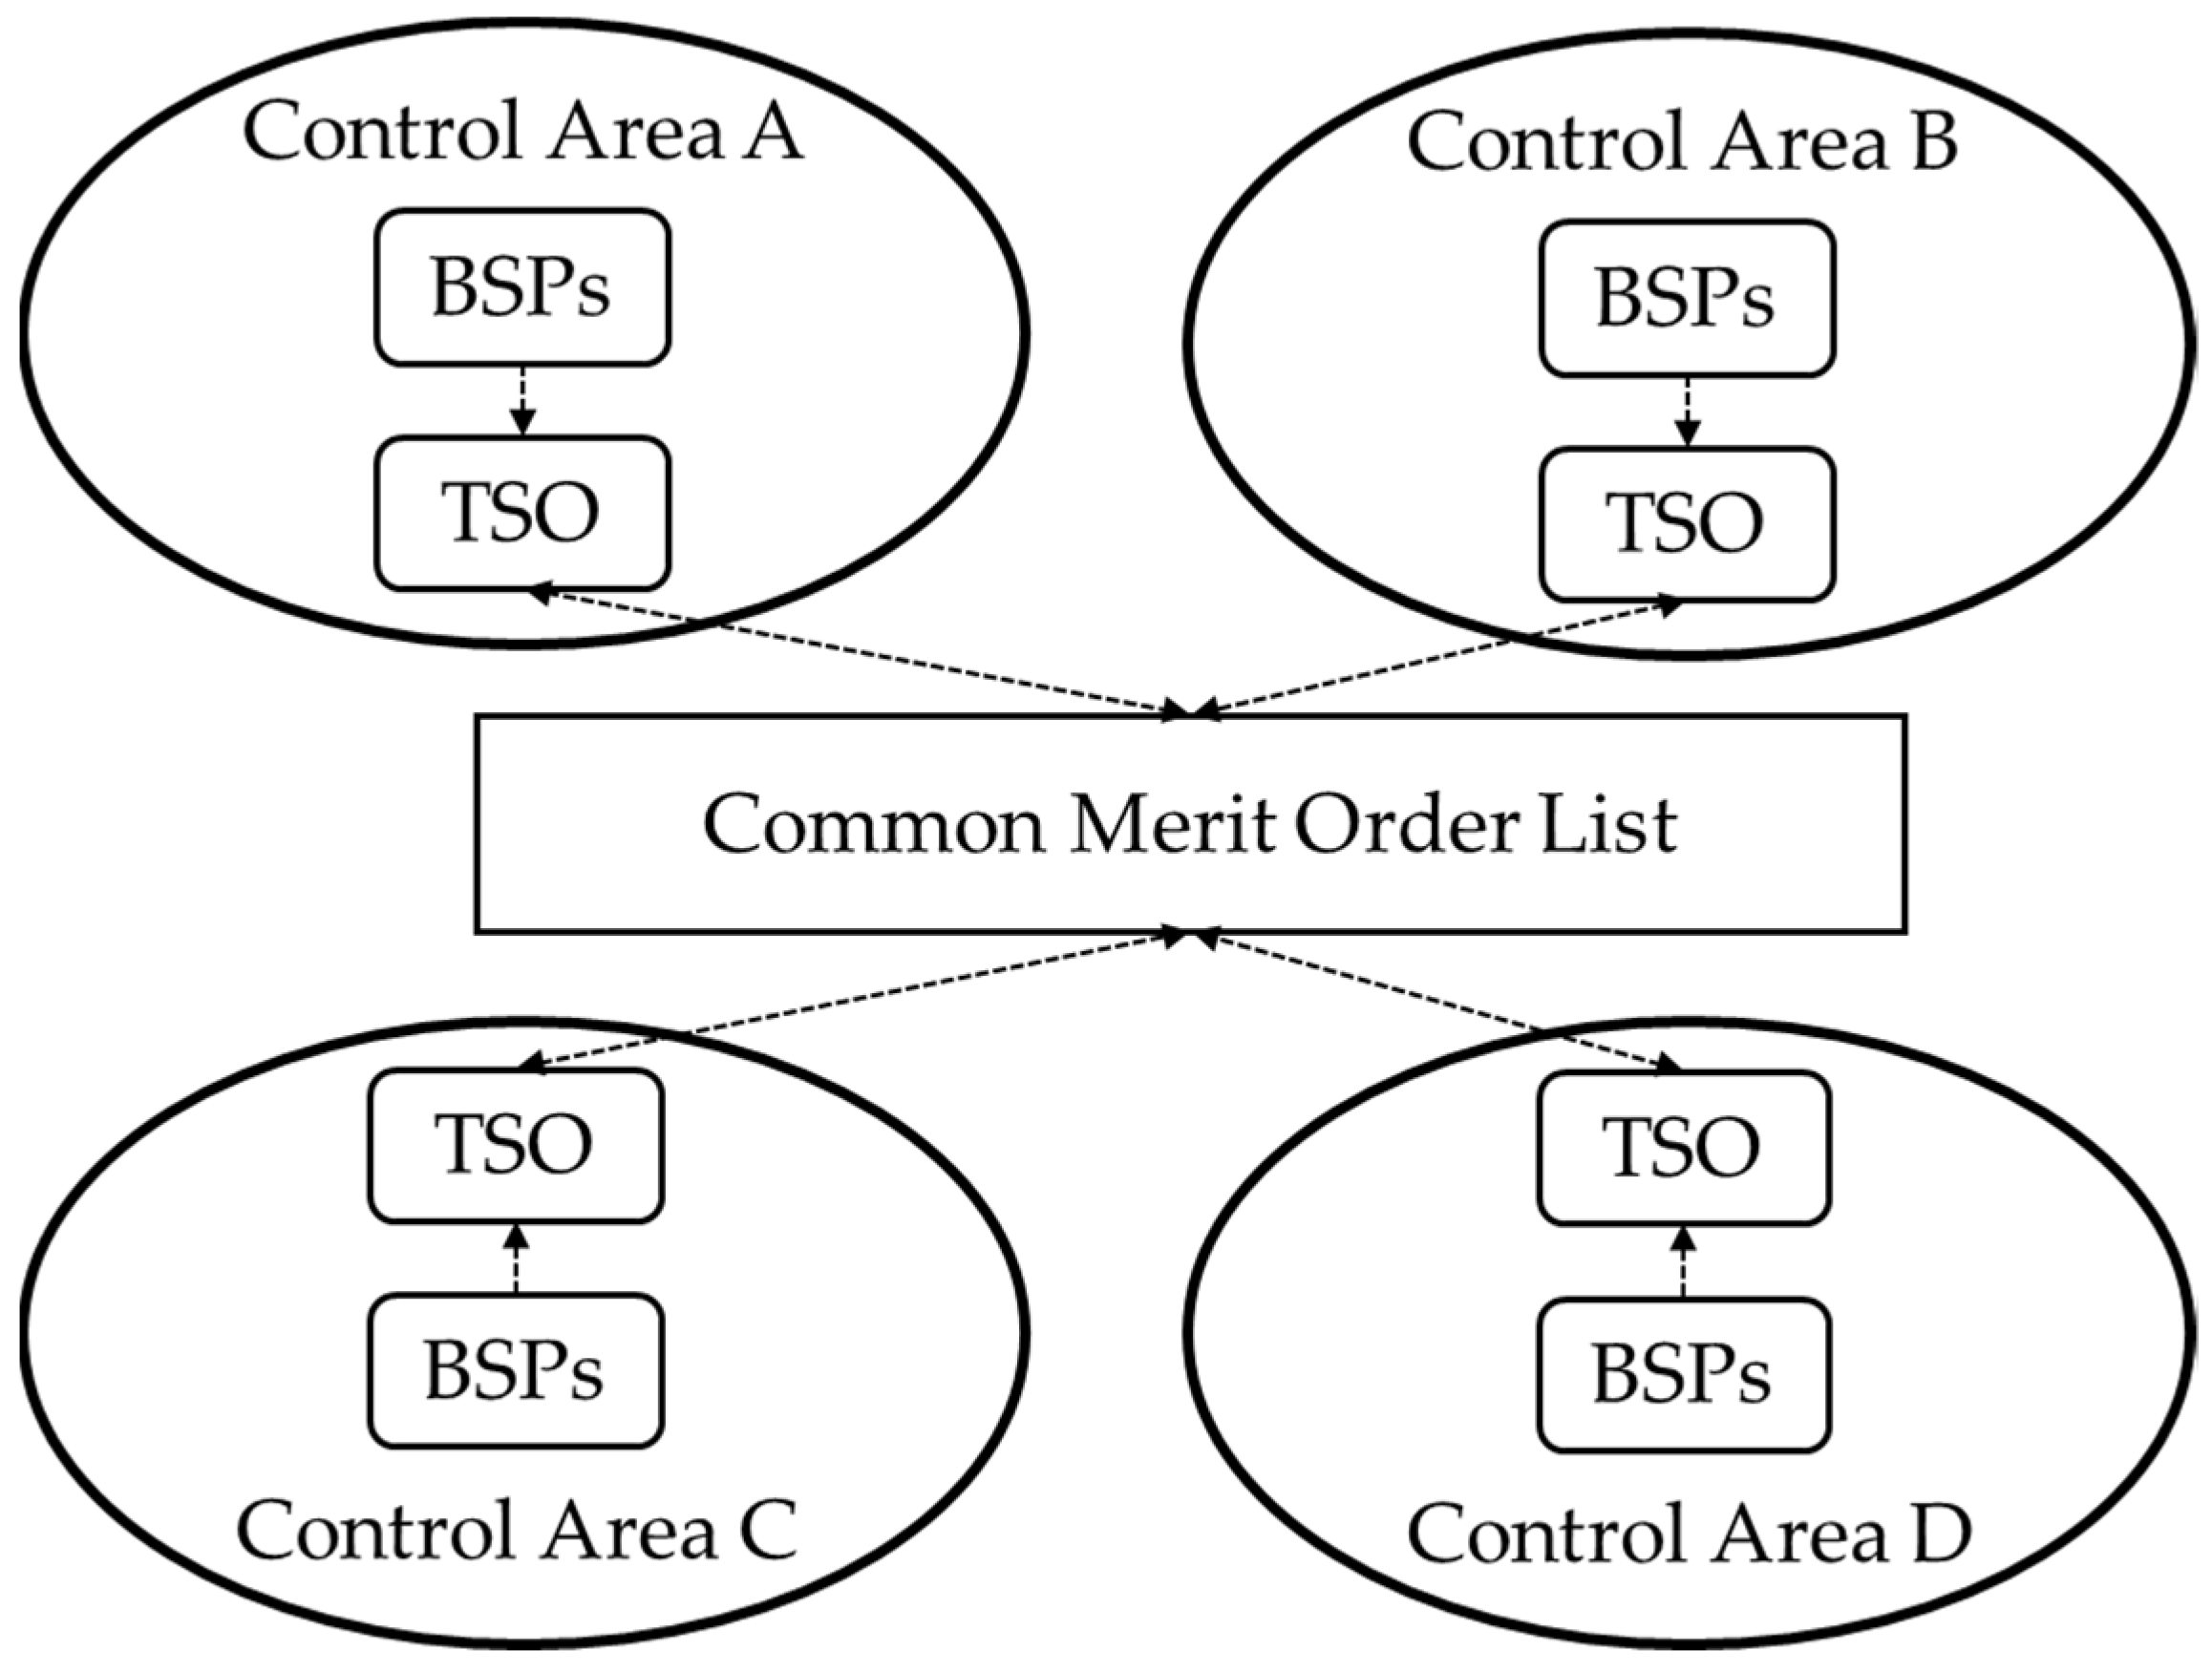
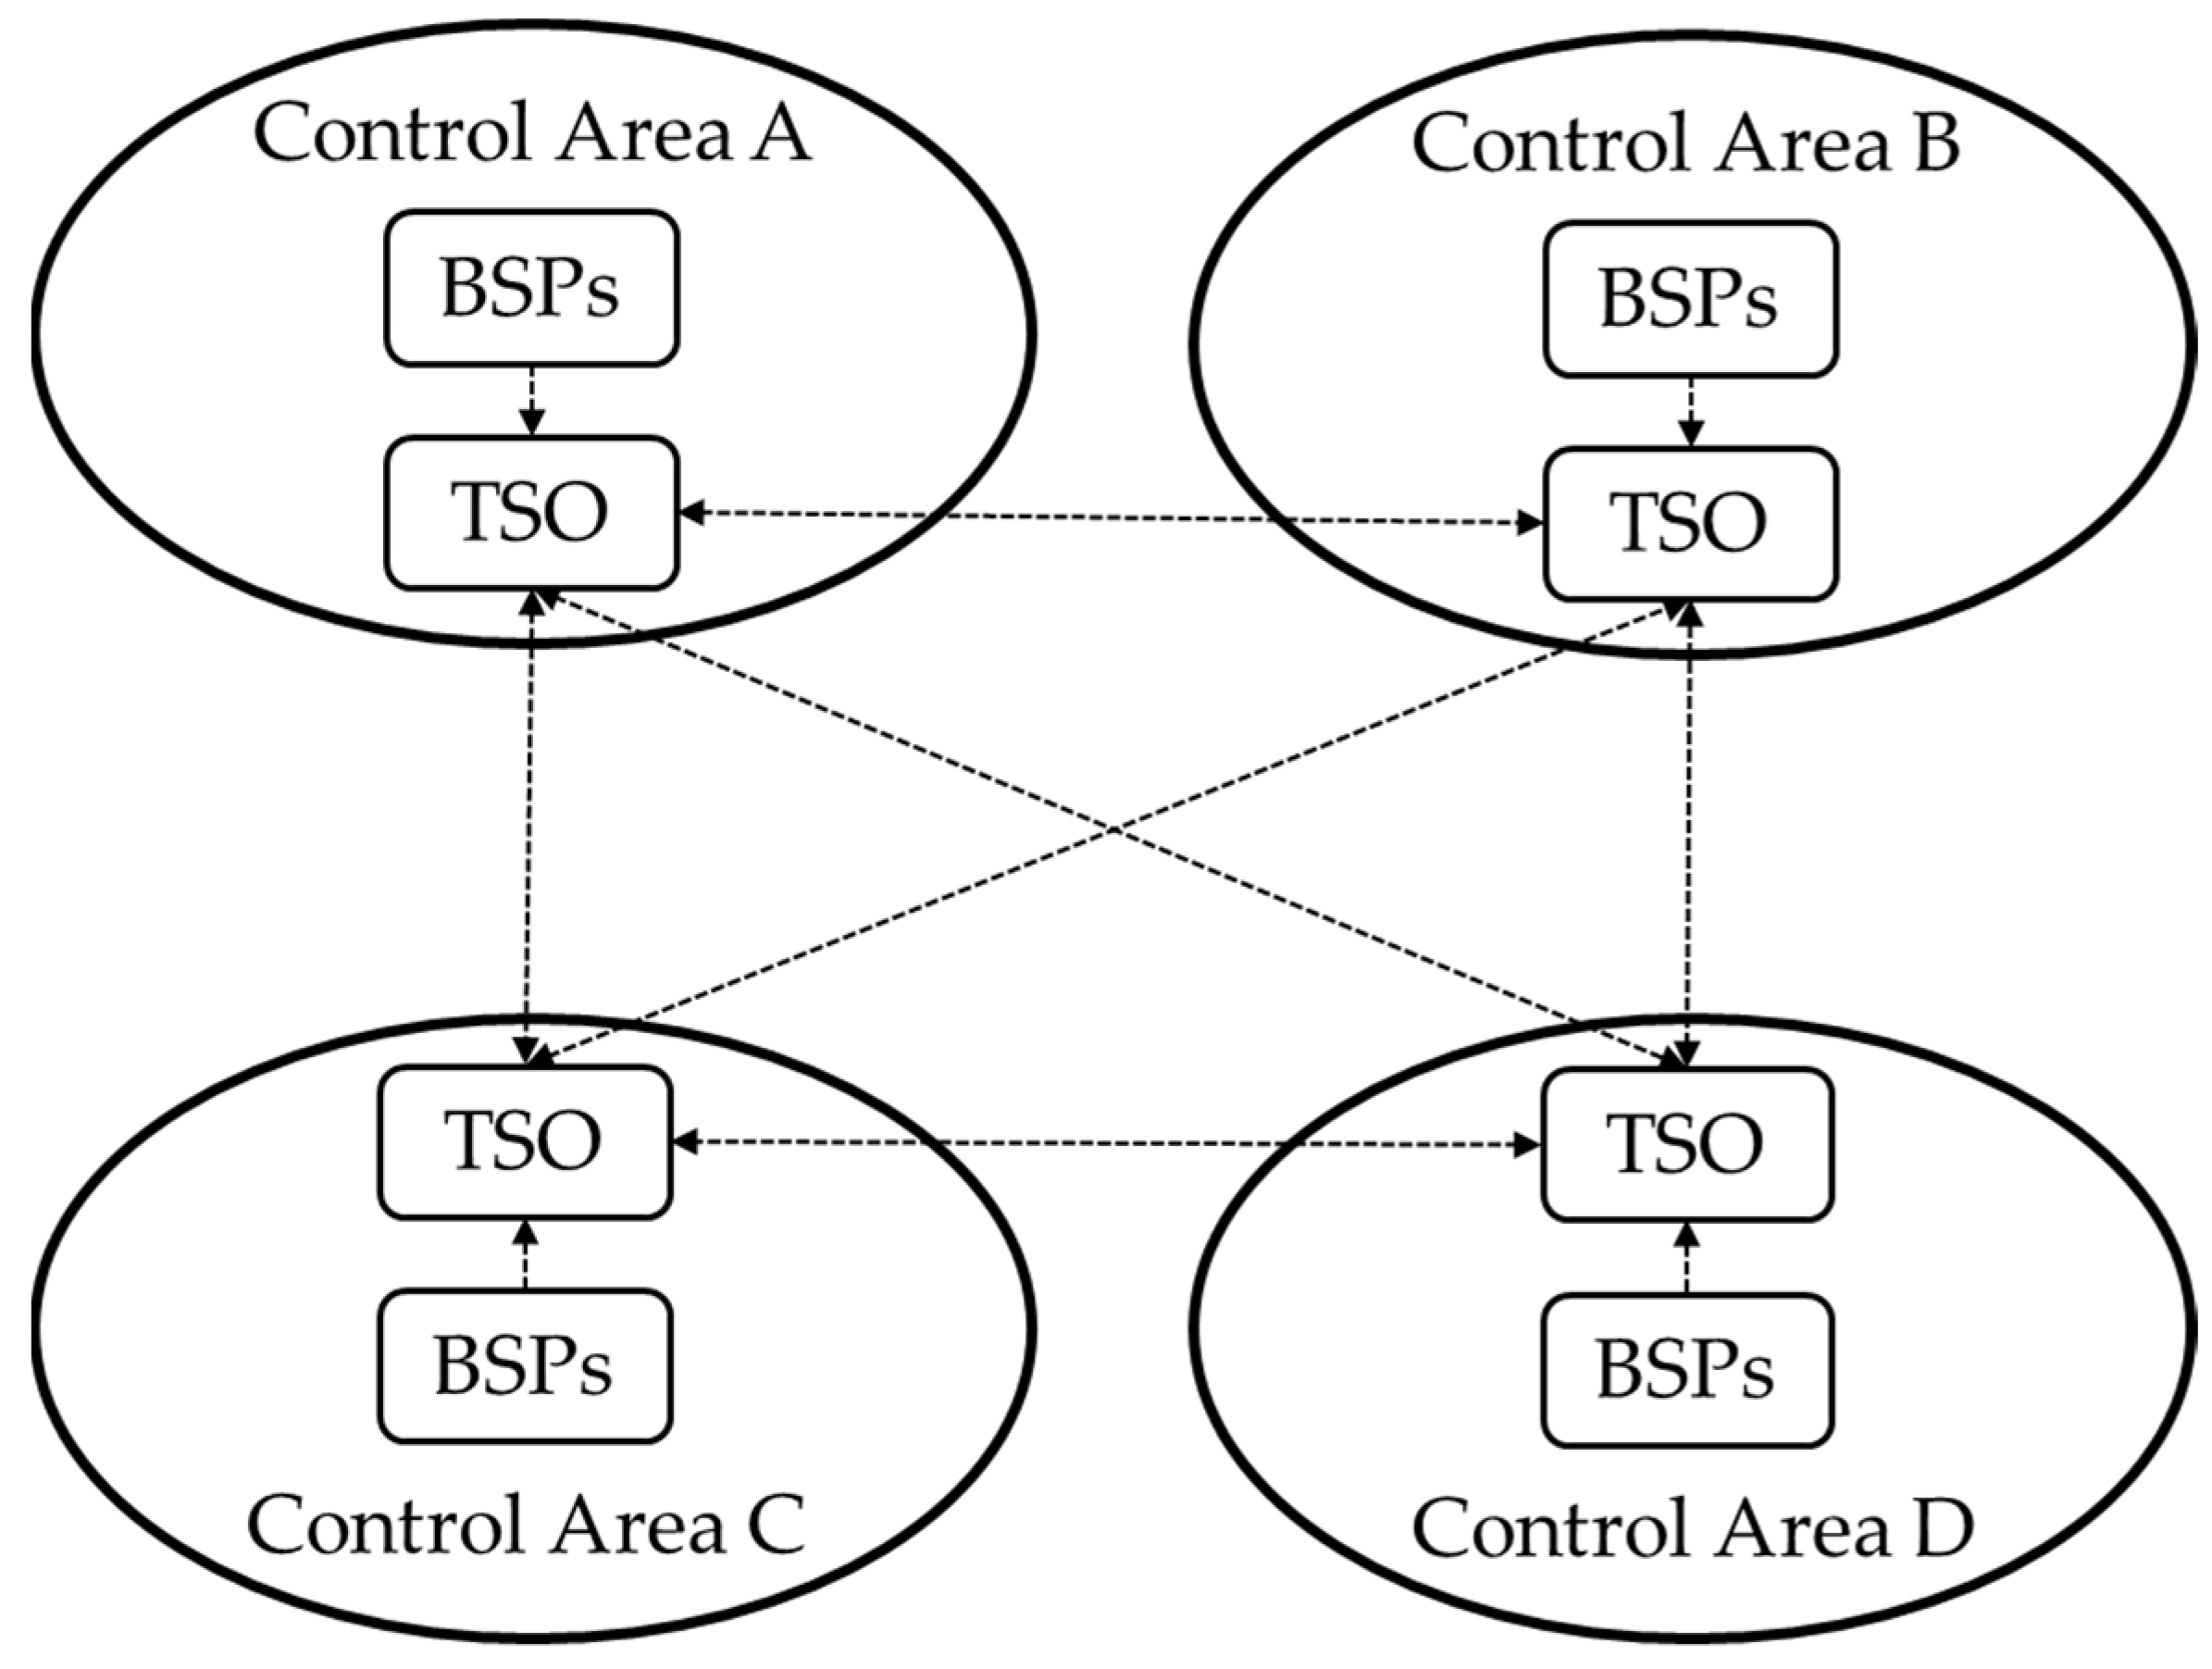
  • Integration model: There are the following three integration models for the balancing markets: (a) the BSP-TSO model; (b) the TSO-TSO with a common merit order list; (c) the TSO-TSO without a common merit order list. The preferable integration model in the Regulation 2017/2195/EC is the TSO-TSO with common merit order list. Detailed provisions on each of the above integration models are provided in Section 3.3.2, Section 3.3.3 and Section 3.3.4 below.

3.3. Main Balancing Market Integration Models

In this subsection, the main balancing market integration models found in the literature [41,42,43,44,45,46,47] are introduced, namely, the following: (a) imbalance netting; (b) BSP-TSO model; (c) TSO-TSO model without a common merit order list; (d) TSO-TSO model with a common merit order list.

3.3.1. Imbalance Netting

Imbalance netting (or area control error netting) concerns the exchange of imbalances with opposite signs between TSOs subject to available CZC. Through this process a reduced activation of BEOs is required (avoidance of counteracting activation of balancing energy) resulting in a more economic, secure, and effective functioning of the balancing markets.
In order to better understand the savings that can be achieved when applying the imbalance netting model, a numerical example is provided based on the concept presented in [48]. Let us assume that two TSOs (TSO A and TSO B) exchange aFRR balancing energy, implementing the imbalance netting process. In addition, it is assumed that TSO B provides TSO A with 30 MWh of balancing energy. An important point here is to consider the opportunity cost for each one of the involved TSOs, i.e., the additional balancing cost that would occur if only national resources could cover the imbalance needs of each control area. If we assume an upward balancing energy price equal to 90 EUR/MWh for the control area of TSO A, then the total avoided cost of TSO A amounts to EUR 2700. Similarly, if we assume a downward balancing energy price of −40 EUR/MWh for the control area of TSO B, then the opportunity cost amounts to EUR 1200.
The target of this analysis is to define the value of the avoided aFRR balancing energy activations in the two control areas [49], in order to define a common settlement price for the imbalance netting transaction. To this end, we calculated the weighted average price of the avoided balancing energy prices considered above, as follows:
(30 MWh × 90 EUR/MWh + 30 MWh × (−40 EUR/MWh))/(30 MWh + 30 MWh) = 25 EUR/MWh
Considering this settlement price, the respective debits/credits of the TSOs and the achieved savings of the TSOs can be calculated as the difference between the balancing costs without imbalance netting and the respective costs with imbalance netting, as follows:
  • The TSO A pays to the TSO B the amount 30 × EUR 25 = EUR +750;
  • The financial benefits for TSO A amount to EUR 2700−EUR 750 = EUR 1950;
  • The financial losses for TSO B amount to EUR 750−EUR 1200 = EUR −450;
  • The increase in the overall welfare amounts to EUR 1950−EUR 450 = EUR 1500.
According to the results, it is shown that TSO A reduces its balancing costs while TSOs B increases its respective costs. This is rational since in coupled regimes some involved TSOs enjoy benefits while others increase their costs [50], but, in total, the social welfare increases.

3.3.2. BSP-TSO Model

In a BSP-TSO model (Figure 4), BSPs belonging to a given control area can provide balancing services directly to a TSO located in another control area if sufficient CZC is available after the clearing of the spot markets (day-ahead and intra-day). Of course, the participating BSPs shall be aligned with the balancing market participation rules of the control area they are submitting their BEOs, i.e., the balancing energy activation time-interval, the gate opening, closure timings, and the order specifications. A rather controversial issue in this model is whether the BSPs providing balancing services to other control areas can also participate in their national balancing markets. More specifically, the following two cases can be defined:
(a)
BSPs are permitted to participate only in one balancing market by explicitly declaring their preference. In principle, BSPs tend to participate in balancing markets with high balancing energy prices for profit maximization purposes. Of course, this strategy results in higher balancing energy prices in the control areas with low balancing energy prices;
(b)
BSPs are permitted to participate in more than one balancing market. This case poses challenging tasks to the respective TSOs since they have to deal with high uncertainties regarding the availability and activation of BEOs so as to cover their imbalance needs. Consequently, strict and concrete allocation processes must be defined.
It should be noted that Regulation 2017/2195/EC [16] does not promote the BSP-TSO model.

3.3.3. TSO-TSO with Common Merit Order List

Contrary to the previous model, in this model, BSPs cannot provide directly balancing services to TSOs belonging to other control areas as shown in Figure 5. All settlement processes are undertaken by the involved TSOs. Additionally, this model is based on the creation of a common merit order list, meaning that all TSOs gather the national BEOs submitted by the BSPs belonging to their control area and then forward them to a common (European) platform for clearing/activation. It is noted that the activation process is based on the selection of the most economical BEOs and is subject to operational security constraints such as the CZC of the interconnectors. In this model, imbalance netting is implicitly performed. In accordance with Regulation 2017/2195/EC [16], the TSO-TSO model with a common merit order list is the preferred model for the integration of European balancing markets.

3.3.4. TSO-TSO without Common Merit Order List

In this model, as depicted in Figure 6, the BSPs belonging to a control area can indirectly provide balancing services to other control areas only if their respective TSO decides, taking into consideration operational and technical constraints, to make available the submitted BEOs to other TSOs. Again, all the settlement processes are undertaken by the involved TSOs.

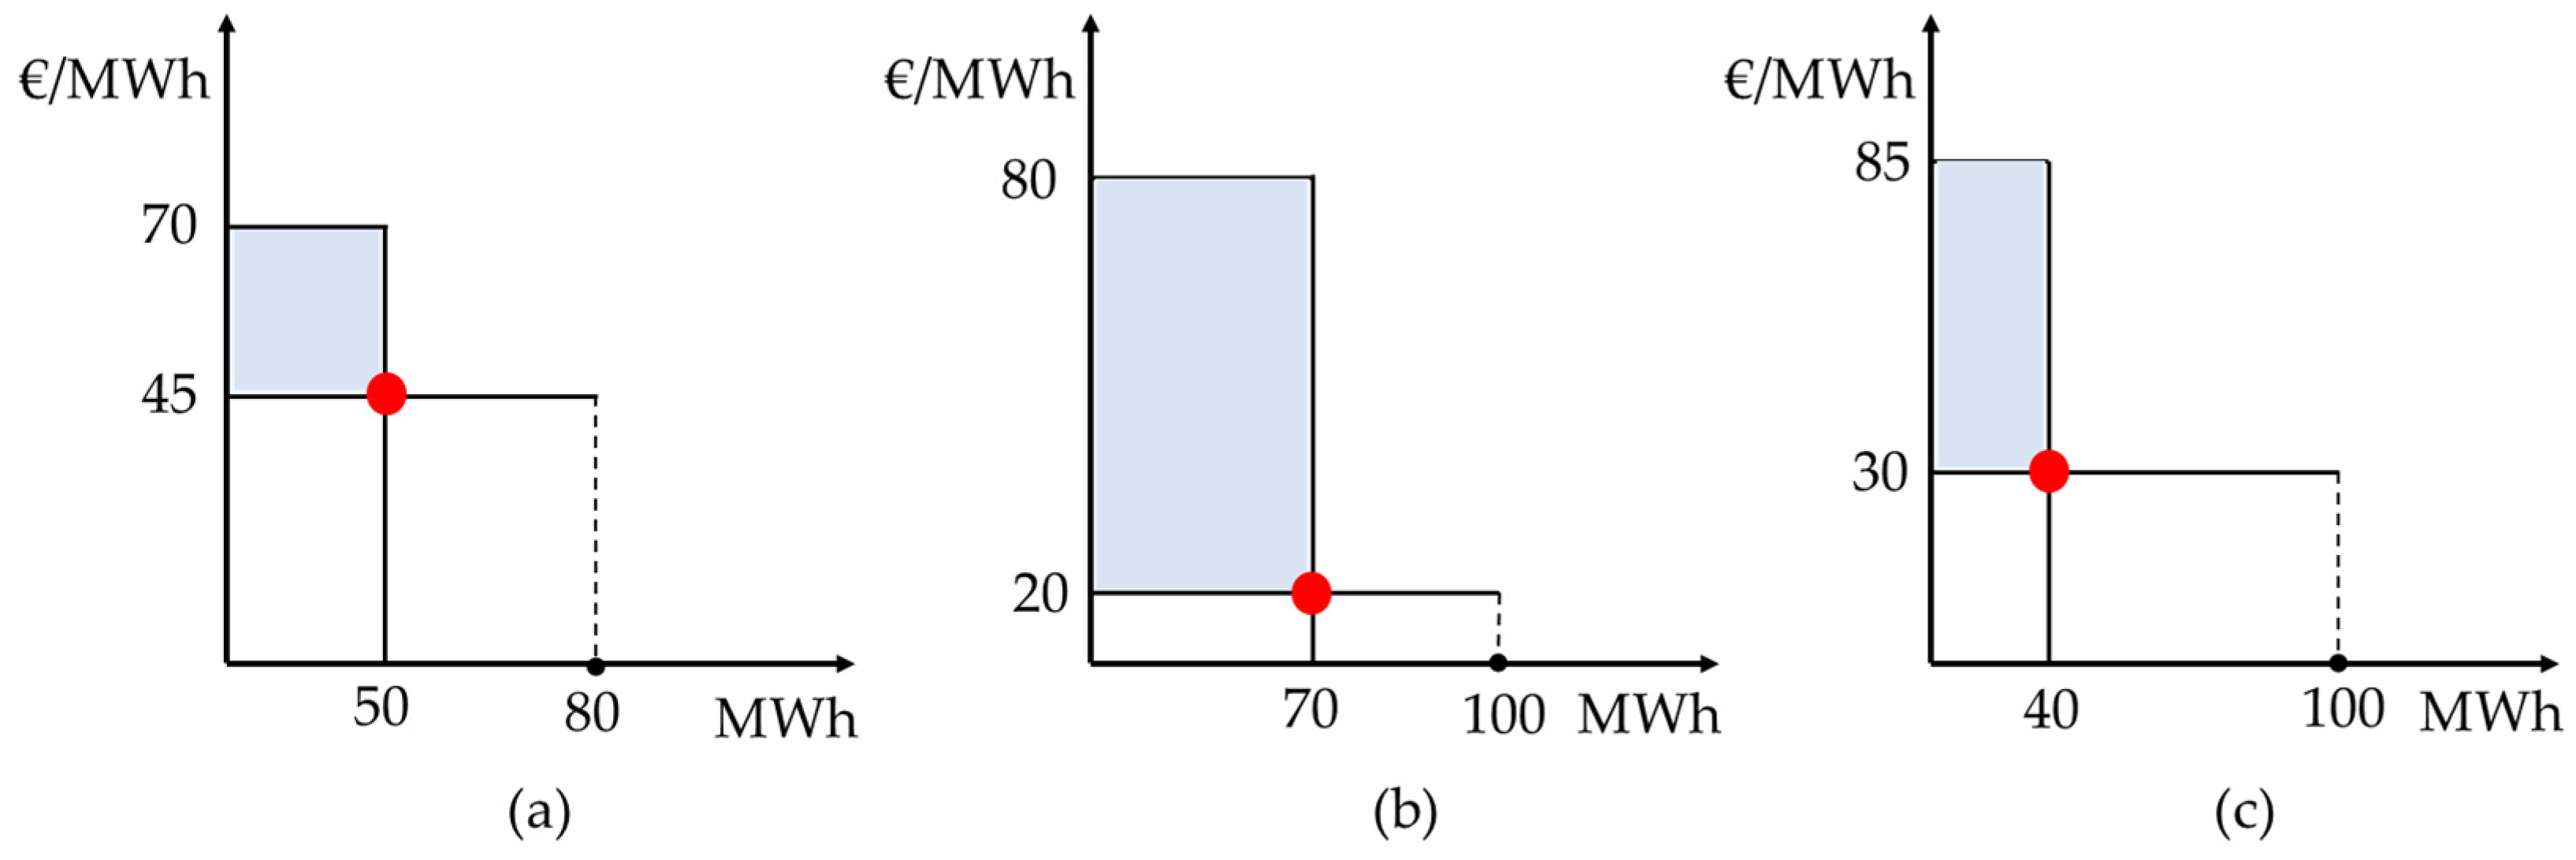
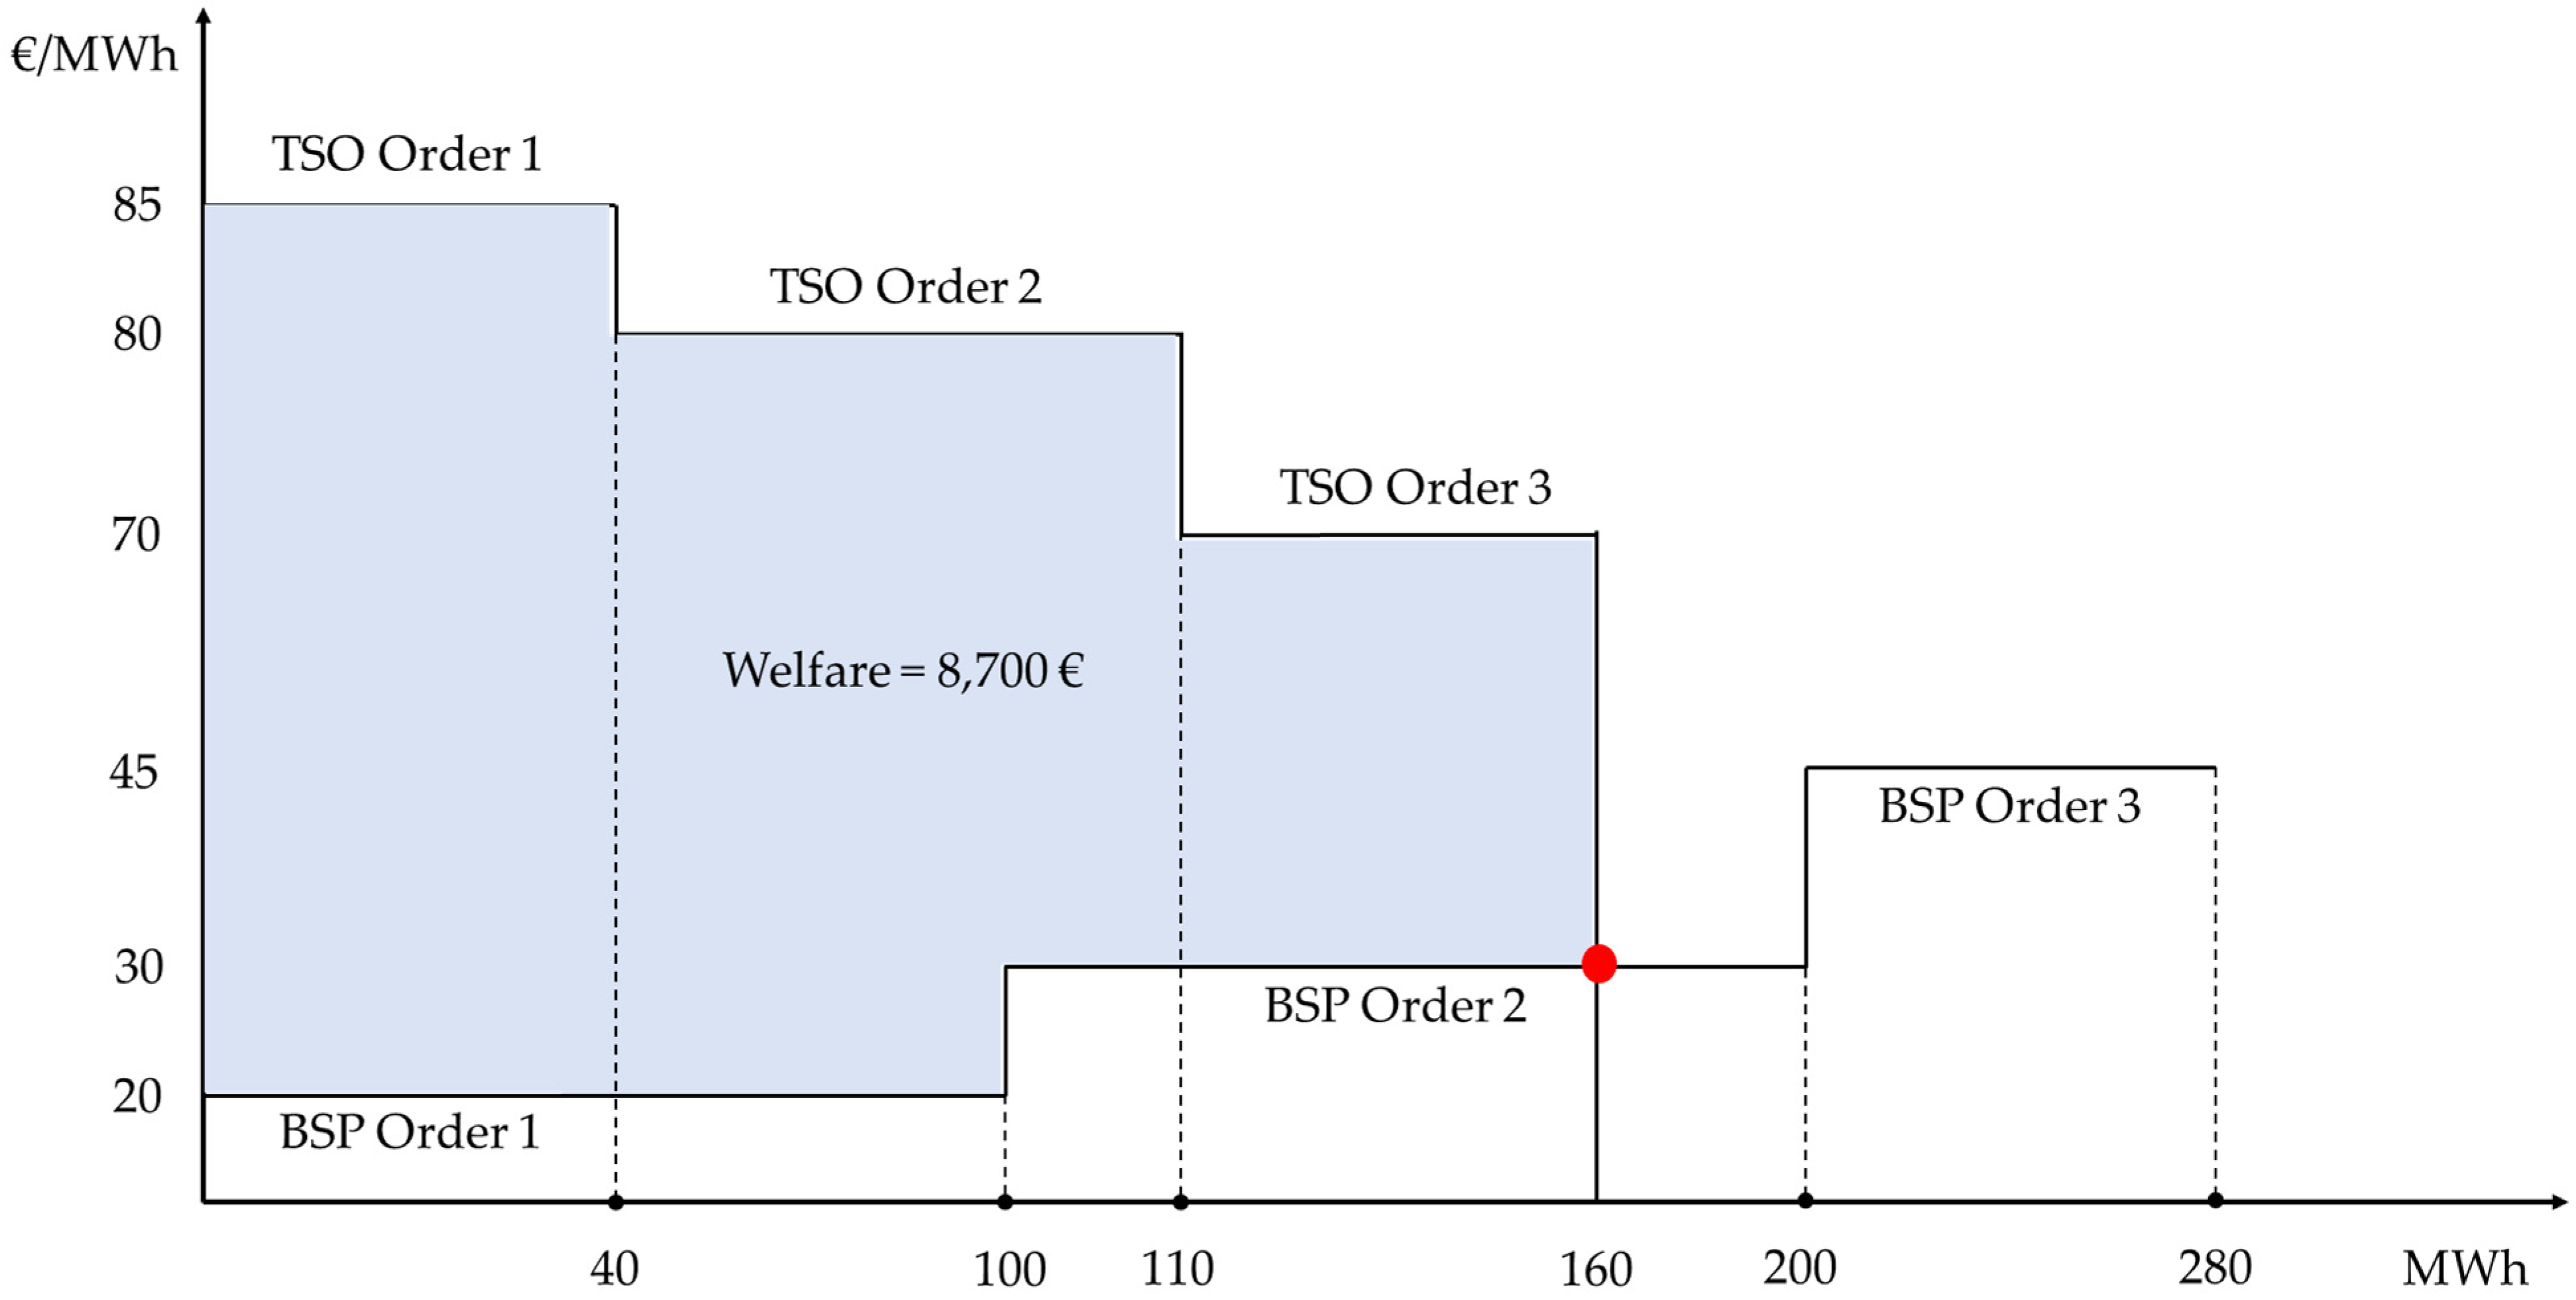
4. Example of Three Integrated Balancing Markets with Common Merit Order List

As stated in Section 3.3.3, according to the European guidelines, the TSO-TSO model with a common merit order list is being promoted for the integration of European electricity balancing markets. For clarification purposes, this section presents a numerical example of three integrated balancing markets applying the TSO-TSO model with a common merit order list.
More specifically, according to [51,52], the above-defined integration model is based on the development of an optimization problem with specific constraints. The core objective of such a problem is the maximization of the social welfare of the involved control areas. At a high level, the optimization problem incorporates the BEOs (both upward and downward) of the involved control areas, which are jointly cleared in order for the total welfare to be maximized. In other words, the optimization problem is similar to the respective optimization problem of a single control area, where the upward BEOs with the lower prices are accepted to cover the positive imbalance needs and the downward BEOs with the higher prices are accepted to cover the negative imbalance needs. The only difference in the integrated mode is that BEOs and imbalance needs from different control areas are aggregated into a common merit order list, and the result of optimization depends on the available CZC between the involved control areas. Network topology, operational constraints, and CZCs are taken into consideration when solving this optimization problem. This input data is determined and forwarded to the clearing platforms by the respective TSOs. The ultimate goal is to determine which upward or downward BEOs will be accepted in order to satisfy the respective demand (needs) in the most economical way.
To continue, let us consider the following three control areas: CA1, CA2, and CA3. The submitted upward and downward BEOs per control area are listed in Table 4. For simplicity and illustration purposes, it is assumed that all control areas have positive imbalance needs and only one BSP is available in each control area, submitting an upward BEO. Figure 7a–c, present schematically the submitted BEOs and the imbalance needs for each control area. It is noted that, in real conditions, TSOs may submit both inelastic (non-priced) and elastic (priced) orders in order to satisfy their needs, but in this example, only elastic orders are considered.
If the three control areas were not coupled, then they would have cleared a quantity of 50, 70, and 40 MWh at prices of 45, 20, and 30 EUR/MWh, respectively. More specifically, the price determination in each control area can be understood if we take into account the demand and supply curves presented in Figure 7a–c. The price in all control areas is derived from the intersection of the demand and supply curves. The total welfare from these decoupled clearings is equal to 50 MWh × (70 – 45) + 70 MWh × (80 – 20) + 40 MWh × (85 – 30) = EUR 7650 (sum of blue-colored areas in Figure 7a–c).
In cases where the CZC is adequate and the control areas are coupled, the welfare and cleared quantities are higher. The total imbalance needed in the case of coupled control areas is equal to 160 MWh and the market clearing price is equal to 30EUR/MWh (red dot in Figure 8). In Table 5 and Table 6, the authors aggregate the respective BSP and TSO orders from the three control areas into a single curve. The first 100 MWh of the total imbalance are covered by the BSP of CA2, since this BSP has submitted the BEO with the lowest price (20 EUR/MWh), and the remaining 60 MWh are covered by the BSP of CA3 (a price of 30 EUR/MWh). The BSP of CA3 can cover 100 MWh, but it covers 60 MWh (marginal BEO, which determines the clearing price). The BSP of CA1 does not contribute to covering the system imbalance since it has submitted the BEO with the highest price. In this coupled case, the total welfare from the cross-border exchange of balancing energy is 40 MWh × (85 − 20) + 60 MWh × (80 − 20) + 10 MWh × (80 − 30) + 50 MWh × (70 − 30) = EUR 8700 (blue colored area in Figure 8). The increase in welfare is caused by the replacement of the more expensive BEO submitted at CA1 with the cheaper BEO submitted at CA2. The difference is EUR 1050. Notably, the clearing price in CA2 increases from 20 EUR/MWh to 30 EUR/MWh after the price coupling of the three control areas. Contrary to that, the clearing price in CA1 decreases from 45 EUR/MWh to 30 EUR/MWh. This outcome is rational since when coupling takes place, the prices in some control areas increase, while in others they decrease, but the total welfare increases.

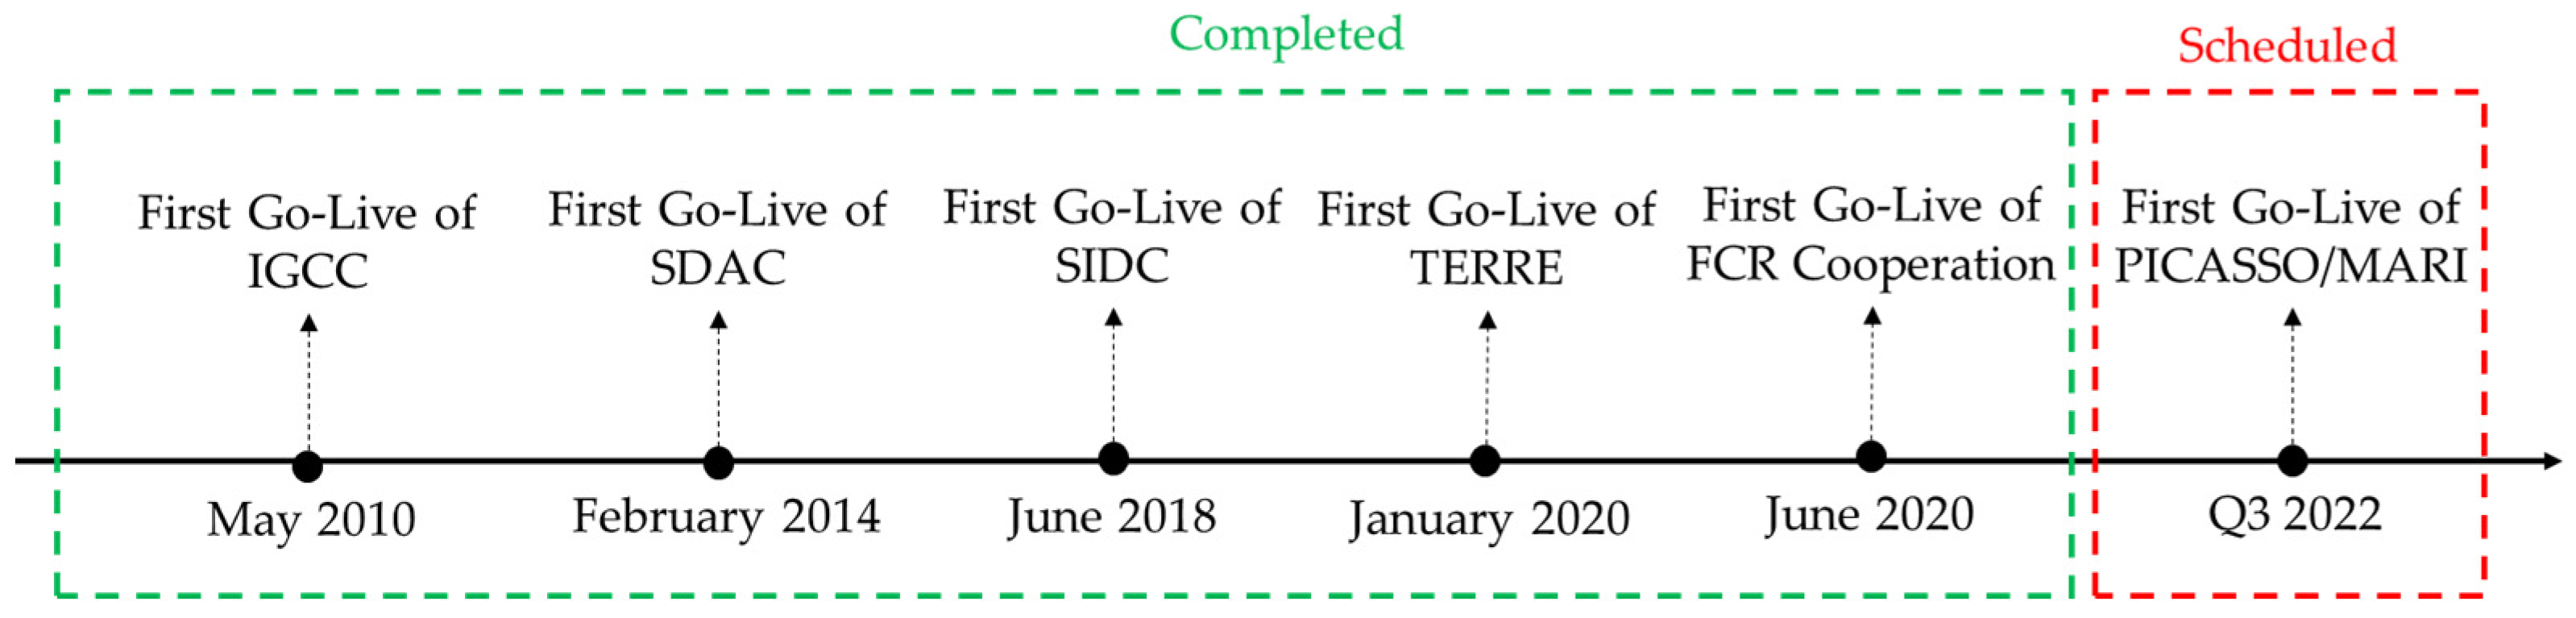
5. European Balancing Market Integration Projects

5.1. Introduction

In this section, a brief description of European initiatives and projects towards the electricity balancing market integration is presented. These projects are the following:
  • FCR cooperation;
  • International Grid Control Cooperation (IGCC);
  • Platform for the International Coordination of Automated Frequency Restoration and Stable System Operation (PICASSO);
  • Manually Activated Reserves Initiative (MARI);
  • Trans European Replacement Reserves Exchange (TERRE);
In general, the common target of these projects is to harmonize national electricity market rules and develop single clearing platforms for each of the balancing markets to facilitate cross-border exchange of balancing energy.
Figure 9 presents the first go-live date for each of the afore-mentioned projects. Further go-lives followed in order for more countries to be connected to the common platforms. As shown, up to now, only the PICASSO and MARI platforms are in the development/implementation phase, but according to the roadmaps, they are expected to be operational within the third quarter of 2022. More details regarding such projects/initiatives can be found in the following sections.

5.2. Balancing Market Initiatives

Concerning the integration of balancing markets, a variety of regional implementation projects have been launched between European TSOs covering the three types of reserves, namely FCR, FRR, and RR. It is noted that the operational members mentioned below per implementation project are valid at the time of writing this paper. As the projects progress, new members may be added.

5.2.1. FCR Cooperation

The FCR Cooperation [53] is a project including eleven TSOs from eight countries (Austria, Belgium, Slovenia, Switzerland, Germany, Western Denmark, France, and The Netherlands). It is the first regional cooperation to achieve a common market pursuant to the guidelines specified in Regulation 2017/2195/EC [16], and it is considered the largest FCR market in Europe, satisfying almost half of the continental European FCR demand [54]. According to Regulation 2017/1485/EC [17], FCR is defined as “the active power reserves available to contain system frequency after the occurrence of an imbalance”.
The procurement and exchange of FCR is based on daily auctions carried out for the following dispatch day with six 4-h symmetric products which means that BSPs shall procure the same quantity for upward and downward FCR [55]. A common merit order list is being constructed, incorporating all the capacity orders submitted by the BSPs to the respective connecting TSO and finally forwarded by the TSOs to the common FCR platform for clearing. It is noted that BSPs are compensated only for the reserved capacity and not for the energy. The first auction was held on 30 June 2020 between Austria, Belgium, Switzerland, Germany, France, and The Netherlands. Slovenia and Western Denmark joined the cooperation on 18 January 2021 [56].

5.2.2. International Grid Control Cooperation (IGCC)

Another implementation project towards balancing market integration is the IGCC [57]. It covers 20 TSOs from 17 countries (Austria, Belgium, Croatia, Czech Republic, Denmark, France, Germany, Greece, Hungary, Italy, the Netherlands, Poland, Portugal, Slovak Republic, Slovenia, Spain, and Switzerland). In principle, the IGCC performs imbalance netting of aFRR. More specifically, it is based on the communication of the power-frequency control of a single TSO, which enables online balancing of the different power imbalances. The aFRR demand of participating control areas is reported to the aFRR optimization system, which returns a correction signal to the secondary controllers or aFRR optimization systems of each IGCC operational member after each optimization step. In this sense, the counter-activation of aFRR balancing energy is avoided, and therefore the use of aFRR is optimized.

5.2.3. Platform for the International Coordination of Automated Frequency Restoration and Stable System Operation (PICASSO)

The “Platform for the International Coordination of Automated Frequency Restoration and Stable System Operation (PICASSO)” [58] is the core implementation project for the exchange of balancing energy from aFRR between European control areas. It covers 26 TSOs from 23 countries (Austria, Belgium, Bulgaria, Croatia, Czech Republic, Denmark, Finland, France, Germany, Greece, Hungary, Italy, Luxembourg, the Netherlands, Norway, Poland, Portugal, Romania, Slovak Republic, Slovenia, Spain, Sweden, and Switzerland).
In Regulation 2017/1485/EC [17], aFRR is defined as “the FRR that can be activated by an automatic control device”. This control device shall be an automatic control device designed to regulate the frequency restoration control error to zero [59,60]. In literature, this device is referred to as a load-frequency controller [61] or an automatic generation controller (AGC) [62].
The ultimate goal of this project is the creation of a common platform where all submitted BEOs will be gathered along with their respective needs, and they will be cleared through a common merit order list (Article 21 of Regulation 2017/2195/EC [16]). Although the common merit order list is the target solution, many European TSOs apply, at the moment, the pro-rata distribution methodology and, thus, modifications in their national mechanisms are required in order to achieve harmonization and integration of the balancing markets [63].
Additionally, it is important to note that, similarly to IGCC, the PICASSO platform performs an implicit netting of demands by considering positive and negative demands in the same clearing process. Hence, in the enduring solution, the IGCC will be substituted by PICASSO and will then cease to exist [64]. Nevertheless, since not all TSOs will join the PICASSO platform at the same time, there will be a need for separate processes. Until now, the aFRR platform has not been in operational mode, but according to [65], a first go-live is scheduled for the third quarter of 2022.

5.2.4. Manually Activated Reserves Initiative (MARI)

The Manually Activated Reserves Initiative (MARI) [66] is the project for the exchange of balancing energy from mFRR. It covers 30 TSOs from 27 countries (Austria, Belgium, Bulgaria, Croatia, Czech Republic, Denmark, Estonia, Finland, France, Germany, Great Britain, Greece, Hungary, Italy, Latvia, Lithuania, Luxembourg, the Netherlands, Norway, Poland, Portugal, Romania, Slovak Republic, Slovenia, Spain, Sweden, and Switzerland).
Similar to the PICASSO platform, the MARI platform will gather all submitted BEOs along with their respective needs, and it will use a common merit order list for clearing (Article 20 of Regulation 2017/2195/EC [16]). Contrary to the aFRR activation rule, the common merit order list is already used by the majority of the European TSOs for activating mFRR [63]. However, modifications in national balancing mechanisms are still required for harmonization purposes (e.g., product characteristics). Again, the mFRR platform is not in operational mode, but according to [67], a go-live is scheduled for the third quarter of 2022. However, some participating countries (Greece, Hungary, France, and Slovakia) have requested a derogation until the official deadline for joining the mFRR platform, which is 24 July 2024.

5.2.5. Trans European Replacement Reserves Exchange (TERRE)

The Trans European Replacement Reserves Exchange (TERRE) project [68] is the reference project for the exchange of balancing energy from RR. The concept and scope are identical to those described for the PICASSO and MARI platforms. It covers six TSOs from six countries (Czech Republic, France, Italy, Portugal, Spain, and Switzerland).
The most remarkable point is that, as of now, only the TERRE platform (also called the “LIBRA” platform) has been in operational/commercial mode since 6 January 2020 and the six above-mentioned markets have successfully been coupled, taking advantage of the sharing of cross-border balancing energy. The launch of the TERRE platform was a first milestone towards the completion of the integration of the European balancing markets. Contrary to the LIBRA platform, the common platforms for PICASSO and MARI are in the development phase, and it is expected that they will use the same solution as the LIBRA platform subjected to the required adjustments [69].

5.2.6. Exchange and Sharing of Reserves

According to Article 3 of Regulation 2017/1485/EC [17], an exchange or sharing of reserves between the European TSOs can take place. The core difference between exchange and sharing is the fact that in the former mechanism, reserves are made available from the providing TSO to the respective receiving TSO, and only the receiving TSO can activate such reserves if required. On the other hand, in the case of the sharing of reserves, the involved TSOs can cover their respective requirements by considering the same reserves (both TSOs can activate part of such shared reserves) [70].
For example, let us assume that a sharing of reserves is applied between two control areas (A and B). The reserve requirement of control area A is equal to 250 MW and the reserve requirement of control area B is equal to 150 MW, meaning that in isolated mode, the total reserve capacity would be equal to 400 MW. However, there are cases when a surplus of reserve capacity in a given control area can be shared with TSOs of other control areas. In our example, it is assumed that control area A experiences a surplus of 50 MW and makes that quantity available for sharing with control area B. In this cooperative scheme, the total reserve requirement is reduced by 50 MW. This common reserve capacity can be activated either from the TSO of control area A or from the respective TSO of control area B. However, obviously, the challenging point in this shared process is the scenario when both TSOs shall activate the common reserve capacity in order to satisfy real-time imbalance needs. To come up with these cases, concrete procedures shall be defined between the involved TSOs.

6. Existing Literature in Balancing Market Integration

This section analyzes the existing research work on the integration of electricity balancing markets. In general, many studies have analyzed and highlighted the prospective gains of the cross-border exchange of balancing services among European control areas.
Ref. [71] assesses the competitive advantages of the balancing market integration between Italy, Austria, and Slovenia. The authors investigate the benefits raised when secondary and tertiary reserves are exchanged between such control areas. A zonal electricity market clearing model with quarter-hourly resolution is used, which gathers upward and downward orders and the respective imbalance needs while also considering network constraints. The pricing scheme considered is pay-as-bid, and the allocation of capacity is based on the flow-based approach (usage of power transfer distribution factors). The attained results of this analysis show that with the establishment of a single balancing market, balancing cost savings can reach up to 60% compared to the current decoupled regime (from 137 mEUR to 54.2 mEUR). More specifically, the balancing costs for Italy and Slovenia decrease while the costs for Austria increase since more economical resources from Austria are requested to cover the imbalance caused in Italy and Slovenia. In total, the cost savings observed in Italy and Slovenia are higher than the cost increase in Austria, leading to higher social welfare.
In the same vein, ref. [72] examines the potential improvement and income increase for the Portuguese power system when an exchange of tertiary reserve (or RR) between Portugal, Spain, and France takes place, implementing a cross-comparative evaluation between different bilateral combinations of TSOs’ orders. This coupled approach (trilateral solution) is compared with the case where the Portuguese TSO exchanges balancing services only with the Spanish TSO (bilateral solution). The results depict that in the former case, the income for the Portuguese power system could be improved by 30%.
To continue with, ref. [73] explores the potential benefits of the balancing market integration of three other European regions, namely, the Nordic, Germany, and the Netherlands. A mixed integer optimization problem is formulated considering the TSOs’ imbalance needs, the upward and downward orders submitted by the BSPs, the available CZC between the interconnections (net transmission capacity-based approach), as well as some technical constraints for generating units when providing upward and downward balancing energy. Marginal pricing is applied. According to the results, an important decrease in the annual balancing costs is achieved (from 34.7 mEUR to 8.6 mEUR). This decrease is attributed to the imbalance netting and to the fact that more economical resources from the Nordic region provide balancing energy to the other two regions.
An analysis of the exchange of balancing services between the Northern countries (Nordic, Germany, and The Netherlands) is also presented in ref. [74]. Two cases are defined and compared (coupled mode vs. decoupled mode). At first, a common clearing of the day-ahead market and the reserve market takes place. Then, any resulting imbalances are handled through a real-time economic dispatch model. The results show that the annual reserve cost is reduced from 195 mEUR to 42 mEUR (75% reduction), while the respective annual balancing cost is reduced from 393 mEUR to 189 mEUR. In other words, a total annual saving of 399 mEUR is calculated.
One more study investigating the potential benefits of integrating the balancing markets of the northern countries is presented in ref. [75]. Based on the numerical results, by implementing an integrated balancing market, the total annual balancing costs can decrease by around 80 mEUR (from 180 mEUR to 100 mEUR) for an allocation of 10% of the CZC for balancing energy exchanges instead of spot trading. Additionally, the total amount of activated balancing energy is reduced due to the offsetting of national imbalances.
In ref. [76], a balancing market integration through the BSP-TSO model between Norway and The Netherlands is being investigated. The results indicate that the price in Norway is much more resistant to market integration, while the price in The Netherlands is more sensitive and more likely to change as a result of market integration. More precisely, Norway provides mostly upward balancing energy, and depending on the available transmission capacity between the two countries, the price in The Netherlands can decrease considerably due to the economic upward BEOs submitted by hydro power units. This price reduction may reach 110 EUR/MWh when a CZC of 300 MW is available. In the case of the downward regulation, the BSPs in The Netherlands submit more competitive downward BEOs, exporting in this way downward balancing energy to Norway.
In [77], the aim of the European project CROSSBOW is presented. This project targets the establishment of a common platform for the exchange of mFRR balancing energy, taking into consideration the requirements and specifications of Regulation 2017/2195/EC [16]. A high-level design of the clearing platform and the respective legal framework is described. Neither mathematical modeling nor numerical results are reported.
In [78], a detailed simulation of the IEM is executed, incorporating all EU countries on an hourly basis. The proposed model applies coupling to all market segments, covering the sequence of day-ahead, intra-day, and balancing. In addition, a unit commitment problem is solved as a mixed-integer optimization problem, including implicit flow-based capacity allocation, technical constraints of BSPs, CZCs, and the provision of ancillary services. According to the simulation results, the balancing costs can decrease by 76%, highlighting in this way the importance of the creation of a common balancing market throughout the European region. This is useful information because these balancing cost savings can lead to an average reduction in electricity bills for consumers in 2030 of 1.9 EUR/MWh.
In [79], a constrained optimization problem is used to investigate the potential cost reduction resulting from the exchange of reserves between Norway and Germany. In the analysis, both spot and balancing markets are considered. It is highlighted that most of the available transmission capacity is utilized by the spot markets, while limited capacity remains for the exchange of reserves. Nevertheless, a partial reserve exchange from Norway to Germany is reported for 77% of the hours and a respective cost reduction of 45 mEUR.
In [80], two quantitative analyses of balancing market integration are performed, assessing the balancing costs that occur when applying a coupled and non-coupled regime. The first analysis concerns the balancing markets of Great Britain and France. Based on data for the year 2011 and implementing a non-linear optimization algorithm for the minimization of the balancing cost (acceptance of the most favorable orders submitted by BSPs from a common merit order list), it is concluded that this cost can be reduced by 51 mEUR for this specific year when a market coupling takes place. In addition, if it is assumed that all the transmission capacity of this interconnector is reserved only for the exchange of balancing services (no available transmission capacity for day-ahead or intra-day power exchanges), then the balancing cost reduction reaches 56 mEUR for the year 2011. An assumption is made that no imbalance netting occurs. In the same vein, the second analysis concerns the Nordic countries (Sweden, Norway, Finland, and Denmark) when a sharing of tertiary reserves is in place. The analysis ignores the respective direct current (DC) interconnections. Again, the concerned period is the year 2011. According to the results, annual cost savings of 221 mEUR can be achieved. For the biggest part, these savings are attributed to the imbalance netting that applies in the case of Nordic countries (unlike in the case of Great Britain and France).
Ref. [81] analyzes the gains that occurred from the operation of the European IEM (incorporating the day-ahead, intra-day, and balancing markets). As far as the balancing market is concerned, no mathematical modeling is presented, but the estimations and the respective analysis are based on data that are available in the ACER report [82] and in [80]. More specifically, considering the reported cost savings observed in a set of selected interconnectors, this paper computes the cost savings to a Europe-wide level, estimating an amount of 1.3 bEUR per year. Moreover, it highlights the fact that these savings constitute 41% of the total savings that can be achieved from the integration of all market segments (day-ahead, intra-day, and balancing). This high percentage indicates the need to hold cross-border transmission capacity for balancing purposes.
In [83], the authors present for the first time an analytical explicit mathematical formulation for the clearing of the TERRE platform, taking into consideration all the requirements defined in the respective implementation frameworks. Moreover, they incorporate all the involved countries participating in the TERRE project for examining the exchange of RR balancing energy between them. Continuing their work, the authors present in [84] a similar mathematical model for the clearing of the respective mFRR platform based on the provisions and guidelines of the MARI project presented in Section 5.2.4. Both works reveal the benefits generated when balancing markets are integrated and balancing services are exchanged.
To continue with, ref. [85] estimates the gains that could have been made following a cross-border balancing energy exchange between Belgium and France on a specific day in 2008. The result show that for this day a balancing cost reduction of 50 KEUR (from 844 kEUR to 794 kEUR) can be achieved. This cost reduction is attributed to imbalance netting and cross-border procurement of relatively cheaper services.
Refs. [86,87] emphasizes another aspect of the balancing of market integration. The authors introduce for the first time the importance of the conversion of balancing orders submitted by BSPs into standard products in control areas applying central-dispatch schemes, as provisioned in Article 27 of Regulation 2017/2195/EC [16]. Ref. [86] prescribes, from a theoretical point of view, the participation of the Italian TSO in an integrated balancing market for the exchange of balancing energy from mFRR. Notably, ref. [87] presents an analytical mathematical formulation for the conversion of the balancing energy orders of a local central dispatch system to standard products before regional clearing.
Ref. [88] performs a technical analysis, giving attention to how an integrated balancing market improves the containment of grid frequency of the involved control areas. In this context, a case study with the United Kingdom and the Continental Europe is investigated, which concludes that when the United Kingdom exchanges balancing capacity from FCR with the Continental Europe, the deviations of frequency from its nominal values during disturbances are lower compared to the de-coupled case.
Ref. [89] focuses on the procurement of balancing capacity (both upward and downward) between Austria, Belgium, Germany, and The Netherlands. The case study concerns the procurement of aFRR and mFRR. Different scenarios are investigated, varying in terms of the product resolution (from weekly to four-hour), delivery period (off-peak and peak) and procurement type (symmetric and asymmetric). The reference scenario states that balancing capacity is procured locally at each control area (de-coupled mode). According to the results, the shortening of product resolution leads to a reduction of 167 mEUR in procurement costs. In addition, in the scenario where only aFRR is procured commonly between these control areas, an increase in the mFRR procurement cost by 51 mEUR and a reduction of 179 mEUR in the aFRR procurement cost are observed. In the case where both aFRR and mFRR are commonly procured, the reduction reaches 243 mEUR. Another interesting conclusion is the fact that the incorporation of other resources (batteries, electric vehicles) capable of providing balancing capacity can yield a further reduction of 3 mEUR. Finally, it is highlighted that all these benefits can be realized only if the national balancing markets are harmonized.
Ref. [90] analyzes the gains stemming from the sharing of balancing services between Austria, Germany, and Switzerland, emphasizing the procurement of aFRR and mFRR. The analysis is executed using a multi-step mixed integer optimization problem formulated in GAMS, incorporating both the spot and the balancing markets. The following four scenarios are tested: (a) local procurement of balancing services (reference scenario); (b) imbalance netting; (c) integrated balancing energy markets; (d) integrated balancing capacity and balancing energy markets. The results show that the most beneficial scenario is the fourth one, resulting in an annual cost reduction of 36.8 mEUR. The respective amounts of the second and third scenarios are almost identical and lie at the level of an 11.4 mEUR reduction.
Ref. [91] investigates the benefits occurring from the common procurement of aFRR between Belgium, France, Germany, The Netherlands, Portugal, and Spain. The estimated procurement cost reduction equals to 165 mEUR per year when enough CZC is available in the respective interconnectors, but in case the CZC is limited then the benefits fall to EUR 135 mEUR per year.
Finally, the latest ACER report, published in January 2022 [92], elaborates on the main conclusions regarding the status and progress of the integration of European balancing markets. The core observation is that the exchange of balancing energy (except imbalance netting) is still swallow (if not existing) on most European borders. More specifically, the national character in combination with the harmonization mismatches constitute the basic obstacles towards the successful completion of the integration at Europe-wide scale. An analysis carried out (based on data provided by the respective NRAs) for the procurement of balancing capacity and balancing energy from aFRR across European Member States shows that the balancing capacity prices and the balancing energy prices (both upward and downward) vary significantly among the involved countries.
Contrary to this, an increased sharing of reserves and balancing energy is observed at the following regional levels: (a) between Austria and Germany for the exchange of balancing energy from aFRR; and (b) between France, Spain, and Portugal for the exchange of balancing energy from RR (participation in the TERRE project). For example, in Portugal, cross-border exchanges cover 8% of the total national balancing needs, a percentage that increased by 4% with the participation of the Portuguese TSO in the TERRE project. Moreover, some other countries, such as Slovenia, Croatia, and the Czech Republic, initiate processes for the exchange of balancing services, but, at the moment, cross-border balancing trading is at very low levels (at most 1% of their total balancing needs). As for the FCR cooperation, the experience up to now indicates a low level of exchange of balancing capacity.
However, it is believed that the potential for the exchange of balancing services within the European region will increase in the future, taking advantage of the establishment of the common platforms that will be developed and the reforming of national balancing rules in accordance with the requirements of Regulation 2017/2195/EC [16].
Table 7 summarizes the research work on the integration of electricity balancing markets, referring to the exchanged products and the related platforms that have been implemented or are currently being implemented to perform cross-border balancing per product. Additionally, Table 7 highlights the prospective gains of the cross-border exchange of balancing services among European control areas.

7. Conclusions

In this paper, an analytical review of all aspects governing the European balancing market integration is presented. Taking into consideration the respective EU regulatory framework and, more specifically, the requirements and provisions defined in Regulation 2017/2195/EC [21], a cooperative approach between the national TSOs is followed for the establishment of common standard balancing products that can be available for cross-border trading between control areas. Such products shall be exchanged through common clearing platforms by applying a TSO-TSO settlement model with a common merit order list.
Until now, the integration of spot markets (day-ahead and intra-day) has been very mature across the European region, while the integration of balancing markets is in progress, and it is expected to be partially completed within the third quarter of 2022. The deadline for the control areas to move to the coupled regime has been set to 24 July 2024. The integration of balancing markets is based on various projects/initiatives and refers to each of the conventional balancing products (FCR, aFRR, mFRR, and RR). The most challenging task in this process is the harmonization between the national balancing rules. At the moment, the platforms for the exchange of balancing energy from FCR and RR are in operational mode, while the platforms for mFRR and aFRR are in the development phase.
The topic of balancing market harmonization and integration has attracted the interest of many scientific works that try to reveal and quantify the economic potential of the balancing market integration. The core method to do so is to apply optimization models and compare the attained results with and without the implementation of the balancing market coupling principles. The main conclusion of such works is that a significant reduction can be achieved in the total balancing costs (i.e., of all involved control areas) through market integration, but in control areas with more economical BSPs, the respective balancing costs will rather increase since they will be requested to cover the imbalance needs of other control areas. Essentially, it becomes evident that this reduction in balancing costs will create more favorable conditions for end-consumers who will enjoy more reasonable electricity tariffs. With the successful completion of the balancing market integration, the EU will accomplish its ambitious goal of creating an internal energy market.

Author Contributions

Conceptualization, C.R. and P.N.B.; writing—original draft preparation, C.R.; writing—review and editing, C.R., P.N.B. and I.G.M.; figures preparation, C.R.; supervision, P.N.B. and I.G.M. All authors have read and agreed to the published version of the manuscript.

Funding

This research received no external funding.

Conflicts of Interest

The authors declare no conflict of interest.

Abbreviations

ACERAgency for the Coopeartion of Energy Regulators
aFRRAutomatic frequency restoration reserve
AGCAutomatic generation control
BEOBalancing energy order
BESSBattery energy storage system
BMBalancing market
BRPBalance responsible party
BSPBalance service provider
CAControl area
CCRCapacity calculation region
CMOLCommon merit order list
CZCCross-zonal capacity
DAMDay-ahead market
DCDirect current
ECEuropean Commission
ENTSO-EEuropean Network of Transmission System Operators for Electricity
EUPHEMIAEuropean Hybrid Electricity Market Integration Algorithm
FCRFrequency containment reserve
IEMInternal Energy Market
IGCCInternational Grid Control Cooperation
IDMIntra-day market
JAOJoint allocation office
LPLinear programming
mFRRManual frequency restoration reserve
MARIManually Activated Reserves Initiative
MILPMixed integer linear programming
MRCMulti regional coupling
NEMOsNominated electricity market operators
NLPNon-linear programming
NRANational regulatory authorities
OCGTOpen cycle gas turbine
PICASSOPlatform for the International Coordination of Automated Frequency Restoration and Stable System Operation
RESRenewable energy sources
RRReplacement reserve
RTORegional transmission operator
SDACSingle day-ahead coupling
SIDCSingle intra-day coupling
TERRETrans European Replacement Reserves Exchange
TSOTransmission system operator
XBIDCross-border intra-day

References

  1. European Parliament. Internal Energy Market. Available online: https://bit.ly/3H1mUR2 (accessed on 3 January 2022).
  2. European Commission. Directive 96/92/EC of the European Parliament and of the Council of 19 December 1996 Concerning Common Rules for the Internal Market in Electricity. Available online: https://bit.ly/3H4clg3 (accessed on 3 January 2022).
  3. European Commission. Directive 2003/54/EC of the European Parliament and of the Council of 26 June 2003 Concerning Common Rules for the Internal Market in Electricity and Repealing Directive 96/92/EC. Available online: https://bit.ly/32xcJVj (accessed on 3 January 2022).
  4. European Commission. Regulation (EC) No 1228/2003 of the European Parliament and of the Council of 26 June 2003 on Conditions for Access to the Network for Cross-Border Exchanges in Electricity. Available online: https://bit.ly/3fXCIrX (accessed on 3 January 2022).
  5. European Commission. Directive 2009/72/EC of the European Parliament and of the Council of 13 July 2009 Concerning Common Rules for the Internal Market in Electricity and Repealing Directive 2003/54/EC. Available online: https://bit.ly/3r0EsXH (accessed on 3 January 2022).
  6. European Commission. Regulation (EC) No 713/2009 of the European Parliament and of the Council of 13 July 2009 Establishing an Agency for the Cooperation of Energy Regulators. Available online: https://bit.ly/348wS4e (accessed on 3 January 2022).
  7. European Commission. Regulation (EC) No 714/2009 of the European Parliament and of the Council of 13 July 2009 on Conditions for Access to the Network for Cross-Border Exchanges in Electricity and Repealing Regulation (EC) No 1228/2003. Available online: https://bit.ly/3H7kqR1 (accessed on 3 January 2022).
  8. European Wind Energy Association. Creating the Internal Energy Market in Europe. Available online: https://bit.ly/3qZdrDX (accessed on 3 January 2022).
  9. Vandezande, L. Design and Integration of Balancing Markets in Europe. Ph.D. Thesis. Available online: https://bit.ly/33Js8CF (accessed on 3 January 2022).
  10. Oksanen, M.; Karjalainen, R.; Viljainen, S.; Kuleshov, D. Electricity Markets in Russia, the US, and Europe. In Proceedings of the 6th International Conference on the European Energy Market, Leuven, Belgium, 27–29 May 2009; pp. 1–7. [Google Scholar] [CrossRef]
  11. AEMO. The National Electricity Market. Available online: https://bit.ly/3J1ABAb (accessed on 10 February 2022).
  12. Li, Y.; Chang, Y.; Hoong, C.F.; Sharma, S. Business Model and Market Design for ASEAN Electricity Market Integration: Principles, Practicalities, and Conditions for Success. ERIA Research Project Report 2015–2016. Available online: https://bit.ly/362qw7B (accessed on 10 February 2022).
  13. ENTSO-E. Commission Regulation (EU) 1222/2015 of 24 July 2015 Establishing a Guideline on Capacity Allocation and Congestion Management. Available online: https://bit.ly/3H4EZNR (accessed on 3 January 2022).
  14. Kurzidem, M. Analysis of Flow-Based Market Coupling in Oligopolistic Power Markets. Ph.D. Thesis. Available online: https://bit.ly/3u0DY60 (accessed on 3 January 2022).
  15. ENTSO-E. Capacity Calculation Regions. Available online: https://bit.ly/3sv6SbY (accessed on 3 January 2022).
  16. ENTSO-E. Commission Regulation (EU) 2017/2195 of 23 November 2017 Establishing a Guideline on Electricity Balancing. Available online: https://bit.ly/3fY3gtc (accessed on 3 January 2022).
  17. ENTSO-E. Commission Regulation (EU) 2017/1485 of 2 August 2017 Establishing a Guideline on Electricity Transmission System Operation. Available online: https://bit.ly/3GvtP3C (accessed on 3 January 2022).
  18. ENTSO-E. Electricity Balancing in Europe. Available online: https://bit.ly/3oKxXqC (accessed on 3 January 2022).
  19. Vandezande, L.; Meeus, L.; Belmans, R.; Saguan, M.; Glachant, J.M.; Rious, V. Lacking Balancing Market Harmonisation in Europe: Room for Trader Profits at the Expense of Economic Efficiency? HAL 2009. post-print. Available online: https://bit.ly/3uM0waX (accessed on 3 January 2022).
  20. Bakirtzis, E.A.; Chatzigiannis, D.I.; Ntomaris, A.V.; Simoglou, C.K.; Biskas, P.N.; Labridis, D.P.; Bakirtzis, A.G. Determination of load-following reserves in power systems with high wind penetration: An application to the Greek power system. In Proceedings of the 2014 Power Systems Computation Conference, Wroclaw, Poland, 18–22 August 2014. [Google Scholar] [CrossRef]
  21. U.S. Department of Energy. Electric Market and Utility Operation Terminology. Available online: https://bit.ly/3urNvmP (accessed on 3 January 2022).
  22. ENTSO-E. Enhancing Regional Cooperation. Available online: https://bit.ly/3JpUtx0 (accessed on 6 January 2022).
  23. CIGRE. Harmonization and Integration of National Balancing Markets in Europe–Regulatory Challenges. Available online: https://bit.ly/3r0fF6b (accessed on 6 January 2022).
  24. Doorman, G.; van der Veen, R. An analysis of design options for markets for cross-border balancing of electricity. Util. Policy 2013, 27, 39–48. [Google Scholar] [CrossRef]
  25. Rebours, Y.; Kirschen, D.; Trotignon, M. Fundamental Design Issues in Markets for Ancillary Services. Electr. J. 2007, 20, 26–34. [Google Scholar] [CrossRef]
  26. van der Veen, R.A.C.; Hakvoort, R.A. The electricity balancing market: Exploring the design challenge. Util. Policy 2016, 43, 186–194. [Google Scholar] [CrossRef] [Green Version]
  27. Röben, F. Comparison of European Power Balancing Markets—Barriers to Integration. In Proceedings of the 15th International Conference on the European Energy Market (EEM), Lodz, Poland, 27–29 June 2018; pp. 1–6. [Google Scholar] [CrossRef]
  28. ENTSO-E. Survey on Ancillary Services Procurement, Balancing Market Design 2020. Available online: https://bit.ly/3J4NPvN (accessed on 6 January 2022).
  29. Frunt, J.; Kling, W.; van den Bosch, P. Classification and quantification of reserve requirements for balancing. Electr. Power Syst. Res. 2010, 80, 1528–1534. [Google Scholar] [CrossRef]
  30. Meeus, L. The Evolution of Electricity Markets in Europe. Available online: https://bit.ly/3tWhMKd (accessed on 8 January 2022).
  31. Avramiotis-Falireas, I.; Zolotarev, P.; Ahmadi-Khatir, A.; Zima, M. Analysis and Comparison of Secondary Frequency Control Reserve Activation Rules: Pro-rata vs. Merit Order. In Proceedings of the 2014 Power Systems Computation Conference, Wroclaw, Poland, 18–22 August 2014; pp. 1–7. [Google Scholar] [CrossRef]
  32. Håberg, M. Optimal Activation and Congestion Management in the European Balancing Energy Market. Ph.D. Thesis. Available online: https://bit.ly/3KLFQWc (accessed on 8 January 2022).
  33. Håberg, M.; Doorman, G. Classification of balancing markets based on different activation philosophies: Proactive and reactive designs. In Proceedings of the 13th International Conference on the European Energy Market (EEM), Porto, Portugal, 6–9 June 2016; pp. 1–5. [Google Scholar] [CrossRef]
  34. European Commission. Impact Assessment. Available online: https://bit.ly/32A9sEI (accessed on 8 January 2022).
  35. Vandezande, L.; Meeus, L.; Belmans, R. The Next Step in the Central Western European Electricity Market: Cross-Border Balancing. Available online: https://bit.ly/3fY7qkO (accessed on 8 January 2022).
  36. van der Veen, R.A.C.; Abbasy, A.; Hakvoort, R.A. A Comparison of Imbalance Settlement Designs and Results of Germany and The Netherlands. Available online: https://bit.ly/3IAP0Tt (accessed on 8 January 2022).
  37. Ntomaris, A.; Marneris, I.; Biskas, P.; Bakirtzis, A. Optimal participation of RES aggregators in electricity markets under main imbalance pricing schemes: Price taker and price maker approach. Electr. Power Syst. Res. 2022, 206, 107786. [Google Scholar] [CrossRef]
  38. Vandezande, L.; Meeus, L.; Belmans, R.; Saguan, M.; Glachant, J. Well-functioning balancing markets: A prerequisite for wind power integration. Energy Policy 2010, 38, 3146–3154. [Google Scholar] [CrossRef] [Green Version]
  39. Morales, J.M.; Conejo, A.J.; Madsen, H.; Pinson, P.; Zugno, M. Integrating Renewables in Electricity Markets; International Series in Operations Research & Management Science; Springer: Boston, MA, USA, 2014. [Google Scholar] [CrossRef]
  40. Nordic TSOs Report. Analysing Different Alternatives for Single Pricing Model Implementation Timeline. Available online: https://bit.ly/3rtcrYZ (accessed on 8 January 2022).
  41. Frontier Economics and Consentec. Benefits and Practical Steps towards the Integration of Intraday Electricity Markets and Balancing Mechanisms. Available online: https://bit.ly/3oKUWSt (accessed on 9 January 2022).
  42. ERGEG. Revised ERGEG Guidelines of Good Practice for Electricity Balancing Markets Integration (GGP-EBMI). Available online: https://bit.ly/3Jo3DtO (accessed on 9 January 2022).
  43. van der Veen, R.A.C.; Abbasy, A.; Hakvoort, R.A. A Qualitative Analysis of Main Cross-Border Balancing Arrangements. In Proceedings of the 7th International Conference on the European Energy Market, Madrid, Spain, 23–25 June 2010; pp. 1–6. [Google Scholar] [CrossRef] [Green Version]
  44. Van der Veen, R.A.C.; Abbasy, A.; Hakvoort, R.A. An Agent-Based Analysis of Main Cross-Border Balancing Arrangements for Northern Europe. In Proceedings of the IEEE Trondheim PowerTech, Trondheim, Norway, 19–23 June 2011; pp. 1–8. [Google Scholar] [CrossRef]
  45. Zani, A.; Rossi, S.; Migliavacca, G.; Auer, H. Toward the Integration of Balancing Markets. In Proceedings of the 12th International Conference on the European Energy Market (EEM), Lisbon, Portugal, 19–22 May 2015; pp. 1–5. [Google Scholar] [CrossRef]
  46. Esterl, T.; Kaser, S.; Zani, A. Harmonization Issues for Cross-Border Balancing Markets: Regulatory and Economic Analysis. In Proceedings of the 13th International Conference on the European Energy Market (EEM), Porto, Portugal, 6–9 June 2016; pp. 1–5. [Google Scholar] [CrossRef]
  47. Zolotarev, P. Social Welfare of Balancing Markets. In Proceedings of the 14th International Conference on the European Energy Market (EEM), Dresden, Germany, 6–9 June 2017; pp. 1–6. [Google Scholar] [CrossRef]
  48. Regelleistung. Information on Grid Control Cooperation and International Development. Available online: https://bit.ly/3tYKMAZ (accessed on 9 January 2022).
  49. Contu, M.; Allella, F.; Carlini, E.M.; Montone, S.; Pascucci, A.; Michi, L.; Pecoraro, G. The European Electricity Balancing Platforms and the Imbalance Netting Process: Terna’s Participation in the International Grid Control Cooperation. In Proceedings of the AEIT International Annual Conference (AEIT), Florence, Italy, 18–20 September 2019; pp. 1–6. [Google Scholar] [CrossRef]
  50. Avramiotis-Falireas, I.; Margelou, S.; Zima, M. Investigations on a Fair TSO-TSO Settlement for the Imbalance Netting Process in European Power System. In Proceedings of the 15th International Conference on the European Energy Market (EEM), Lodz, Poland, 27–29 June 2018; pp. 1–6. [Google Scholar] [CrossRef]
  51. ACER. Implementation Framework for the European Platform for the Exchange of Balancing Energy from Frequency Restoration Reserves with Manual Activation. Available online: https://bit.ly/36aQmGM (accessed on 10 February 2022).
  52. N-SIDE. MARI Algorithm Design Principles. Available online: https://bit.ly/3hWgyqZ (accessed on 10 February 2022).
  53. ENTSO-E. Frequency Containment Reserves (FCR). Available online: https://bit.ly/3nYmfYP (accessed on 10 January 2022).
  54. Tennet. The FCR Cooperation Reaches the Next Milestone in the Development of the Largest FCR Market in Europe. Available online: https://bit.ly/3G2xC8j (accessed on 10 January 2022).
  55. Next Kraftwerke. What is Frequency Containment Reserve (FCR)? Available online: https://bit.ly/3H5DUWh (accessed on 10 January 2022).
  56. Swissgrid. New Members Join International FCR Cooperation. Available online: https://bit.ly/35hanuy (accessed on 10 January 2022).
  57. ENTSO-E. Imbalance Netting. Available online: https://bit.ly/3r1mTXF (accessed on 10 January 2022).
  58. ENTSO-E. Platform for the International Coordination of Automated Frequency Restoration and Stable System Operation (PICASSO). Available online: https://bit.ly/3AxicYM (accessed on 10 January 2022).
  59. ENTSO-E. Automatic Frequency Restoration Reserve Process Implementation Guide. Available online: https://bit.ly/3r29Xk5 (accessed on 10 January 2022).
  60. ENTSO-E. Explanatory Note for the Calculation of Frequency Restoration Control Error Target Parameter for LFC Blocks of Synchronous Area Continental Europe. Available online: https://bit.ly/3u3AqzZ (accessed on 10 January 2022).
  61. Suman, M.; Venu Gopala Rao, M.; Naga Kumar, G.R.S.; Chandra Sekhar, O. Load Frequency Control of Three-Unit Interconnected Multimachine Power System with PI and Fuzzy Controllers. In Proceedings of the International Conference on Advances in Electrical Engineering (ICAEE), Vellore, India, 9–11 January 2014; pp. 1–5. [Google Scholar] [CrossRef]
  62. Kaur, H.; Kumar, P.; Sinha, S.K.; Tayal, V.K. Automatic Generation Control Using PSO Optimized PI and Optimal Fuzzy Controller. In Proceedings of the Annual IEEE India Conference (INDICON), New Delhi, India, 17–20 December 2015; pp. 1–6. [Google Scholar] [CrossRef]
  63. ENTSO-E. Survey on Ancillary Services Procurement, Balancing Market Design 2019. Available online: https://bit.ly/3G0TUHD (accessed on 10 January 2022).
  64. PICASSO Stakeholder Workshop Q&A Document. Available online: https://bit.ly/3r42hxX (accessed on 10 January 2022).
  65. aFRR-Platform Accession Roadmap. Available online: https://bit.ly/3J6HkZh (accessed on 10 January 2022).
  66. ENTSO-E. Manually Activated Reserves Initiative. Available online: https://bit.ly/3H4o6mI (accessed on 10 January 2022).
  67. mFRR-Platform Accession Roadmap. Available online: https://bit.ly/3uCdqrM (accessed on 10 January 2022).
  68. ENTSO-E. Trans European Replacement Reserves Exchange (TERRE). Available online: https://bit.ly/3KJ7lQ6 (accessed on 10 January 2022).
  69. ELEXON. Project MARI. Available online: https://bit.ly/3k9A5a1 (accessed on 11 January 2022).
  70. ENTSO-E. Operational Reserve Ad Hoc Team Report. Available online: https://bit.ly/3HAzdUA (accessed on 11 January 2022).
  71. Zani, A.; Migliavacca, G. Pan-European Balancing Market: Benefits for the Italian Power System. In Proceedings of the AEIT Annual Conference, Trieste, Italy, 19 September 2014; Available online: https://bit.ly/2F4WOhz (accessed on 11 January 2022).
  72. Frade, P.M.S.; Shafie-khah, M.; Santana, J.J.E.; Catalao, J.P.S. Cooperation in ancillary services: Portuguese strategic perspective on replacement reserves. Energy Strategy Rev. 2019, 23, 142–151. Available online: https://bit.ly/39AnCV4 (accessed on 11 January 2022). [CrossRef]
  73. Gebrekiros, Y.; Doorman, G. Balancing Energy Market Integration in Northern Europe—Modeling and Case Study. In Proceedings of the IEEE Power and Energy Society General Meeting, National Harbor, MD, USA, 27–31 July 2014; Available online: https://bit.ly/2sqdmOu (accessed on 11 January 2022).
  74. Farahmand, H.; Doorman, G. Balancing market integration in the Northern European continent. Appl. Energy 2012, 96, 316–326. [Google Scholar] [CrossRef]
  75. Abbasy, A.; van der Veen, R.A.C.; Hakvoort, R.A. Effect of Integrating Regulating Power Markets of Northern Europe on Total Balancing Costs. In Proceedings of the IEEE Bucharest PowerTech, Bucharest, Romania, 28 June–2 July 2009; pp. 1–7. [Google Scholar] [CrossRef]
  76. Abbasy, A.; van der Veen, R.A.C.; Hakvoort, R.A. Possible Effects of Balancing Market Integration on Performance of the Individual Markets. In Proceedings of the 8th International Conference on the European Energy Market (EEM), Zagreb, Croatia, 25–27 May 2011; pp. 608–613. [Google Scholar] [CrossRef]
  77. Jeriha, J.; Lakic, E.; Gubina, A.F. Innovative Solutions for Integrating the Energy Balancing Market (mFFR). In Proceedings of the 16th International Conference on the European Energy Market, Ljubljana, Slovenia, 18–20 September 2019; Available online: https://bit.ly/2Qr2Oq0 (accessed on 12 January 2022).
  78. Kannavou, M.; Zampara, M.; Capros, P. Modelling the EU Internal Electricity Market: The PRIMES-IEM Model. Energies 2019, 12, 2887. Available online: https://bit.ly/2syiNL9 (accessed on 12 January 2022). [CrossRef] [Green Version]
  79. Bellenbaum, J.; Weber, C.; Doorman, G.; Farahmand, H. Balancing Market Integration-Model-Based Analysis of Potential Cross-Border Reserve Exchange Between Norway and Germany. In Proceedings of the 15th International Conference on the European Energy Market (EEM), Lodz, Poland, 27–29 June 2018; pp. 1–5. [Google Scholar]
  80. European Commission. Impact Assessment on European Electricity Balancing Market. Available online: https://bit.ly/3r3TRXt (accessed on 14 January 2022).
  81. Newbery, D.; Strbac, G.; Viehoff, I. The benefits of integrating European electricity markets. Energy Policy 2016, 94, 253–263. [Google Scholar] [CrossRef] [Green Version]
  82. ACER/CEER. Annual Report on the Results of Monitoring the Internal Electricity and Natural Gas Markets in 2013. Available online: https://bit.ly/3AHG4sH (accessed on 14 January 2022).
  83. Roumkos, C.; Biskas, P.; Marneris, I. Modeling Framework Simulating the TERRE Activation Optimization Function. Energies 2020, 13, 2966. [Google Scholar] [CrossRef]
  84. Roumkos, C.; Biskas, P.N.; Marneris, I. Manual Frequency Restoration Reserve Activation Clearing Model. Energies 2021, 14, 5793. [Google Scholar] [CrossRef]
  85. European Commission. Study of the Interactions and Dependencies of Balancing Markets, Intraday Trade and Automatically Activated Reserves. Available online: https://bit.ly/3HcIodS (accessed on 14 January 2022).
  86. Fedele, A.; Benedettto, G.D.; Pascucci, A.; Pecoraro, G.; Allella, F.; Carlini, E.M. European Electricity Market Integration: The Exchange of Manual Frequency Restoration Reserves among Terna and the Other TSOs. In Proceedings of the AEIT International Annual Conference (AEIT), Catania, Italy, 23–25 September 2020; pp. 1–5. [Google Scholar] [CrossRef]
  87. Marneris, I.G.; Roumkos, C.G.; Biskas, P.N. Towards Balancing Market Integration: Conversion Process for Balancing Energy Offers of Central-Dispatch Systems. IEEE Trans. Power Syst. 2020, 35, 293–303. [Google Scholar] [CrossRef]
  88. Escudero Concha, C.; de Haan, J.E.S.; Virag, A.; Gibescu, M.; Kling, W.L. Towards a Pan-European Energy Balancing Market: Exercise on Coupling the United Kingdom and Continental Europe. In Proceedings of the 11th International Conference on the European Energy Market (EEM), Krakow, Poland, 28–30 May 2014; pp. 1–5. [Google Scholar] [CrossRef]
  89. Dallinger, B.; Auer, H.; Lettner, G. Impact of harmonised common balancing capacity procurement in selected Central European electricity balancing markets. Appl. Energy 2018, 222, 351–368. [Google Scholar] [CrossRef]
  90. Casimir, L.; Clemens, G. New Cross-Border Electricity Balancing Arrangements in Europe. Available online: https://bit.ly/35mj9Yf (accessed on 20 January 2022).
  91. Baldursson, F.; Lazarczyk, E.; Ovaere, M.; Proost, S. Cross-Border Exchange and Sharing of Generation Reserve Capacity. Energy J. 2018, 39, 39. [Google Scholar] [CrossRef]
  92. ACER. Market Monitoring Report 2020–Electricity Wholesale Market Volume. Available online: https://bit.ly/3nWYEYL (accessed on 17 January 2022).
Figure 1. EU electricity target model.
Energies 15 02240 g001
Figure 2. Load-frequency control processes.
Energies 15 02240 g002
Figure 3. Architecture of a balancing market.
Energies 15 02240 g003
Figure 4. BSP-TSO model.
Energies 15 02240 g004
Figure 5. TSO-TSO model with common merit order list.
Energies 15 02240 g005
Figure 6. TSO-TSO model without common merit order list.
Energies 15 02240 g006
Figure 7. (a) Demand-supply curves in CA1; (b) Demand-supply curves in CA2; (c) Demand-supply curves in CA3.
Energies 15 02240 g007
Figure 8. Common merit order list for the three control areas.
Energies 15 02240 g008
Figure 9. First go-live of European common clearing platforms.
Energies 15 02240 g009
Table 1. Single pricing mechanism.
Single Pricing MechanismSystem ShortSystem Long
BRP shortPupPdn
BRP longPupPdn
Table 2. Dual pricing mechanism—Case 1.
Dual Pricing MechanismSystem ShortSystem Long
BRP shortPupPup
BRP longPdnPdn
Table 3. Dual pricing mechanism—Case 2.
Dual Pricing MechanismSystem ShortSystem Long
BRP shortPupPDAM
BRP longPDAMPdn
Table 4. Submitted BSP and TSO orders per control area.
Control AreaCA1CA2CA3
TSO Orders
Price [EUR/MWh]708085
Quantity [MWh]507040
BSP BEOs
Price [EUR/MWh]452030
Quantity [MWh]80100100
Table 5. Aggregated BSP order curve.
Order IDControl AreaPrice
[EUR/MWh]
Quantity
[MWh]
1220100
2330100
314580
Table 6. Aggregated TSO order curve.
Order IDControl AreaPrice
[EUR/MWh]
Quantity
[MWh]
138540
228070
317050
Table 7. Basic features of the research works reported in literature.
Ref.MarketsMethodologyModelingNetwork CONSTRAINTSProducts
Exchanged and Related Platforms
Imbalance Netting?Integration
Model
Case Study/Analysis PeriodBalancing Cost
Reduction
[mEUR & %]
[71]BMSimulationLPFlow-basedBalancing energy from secondary and tertiary reserves (PICASSO and MARI)YesTSO-TSO with CMOLItaly, Austria, and
Slovenia (one year)
82.8 mEUR
60%
[72]BMData analysis--RR (TERRE)NoTSO-TSO with CMOLPortugal, Spain, France (three years)13.4 mEUR
30%
[73]BMSimulationMILPNTC-basedBalancing energyYesBSP-TSONordic, Germany, The Netherlands (one year)26.1 mEUR
75%
[74]DAM, BM SimulationMILPNTC-basedBalancing capacity and energyYesTSO-TSO with CMOLNordic, Germany, The Netherlands (one year)204 mEUR
75%
[75]BMSimulation-NTC-basedBalancing capacity and energyYesTSO-TSO with CMOLNordic, Germany, The Netherlands (one year)80 mEUR
44.5%
[76]BMSimulation--Balancing energy from secondary
reserves (PICASSO)
NoBSP-TSONorway,
The Netherlands
-
[78]DAM, IDM,
BM
SimulationMILPFlow-basedBalancing capacity and energy--All EU Member States (one year)5800 mEUR
76%
[79]DAM, BMSimulation-NTC-basedaFRR (PICASSO)--Norway, Germany (three years)-
[80]BMSimulationNLPNTC-basedBalancing energy from tertiary reserves
(MARI and TERRE)
No-Great Britain, France (one year)-
BMSimulationNLPNTC-basedBalancing energy from tertiary reserves
(MARI and TERRE)
Yes-Nordic (one year)-
[81]DAM, IDM,
BM
Data analysis--Balancing energy--Selected interconnectors (one year)1300 mEUR
41%
[83]BMSimulationMILPNTC-basedRR (TERRE)YesTSO-TSO with CMOLAll countries participating in TERRE project-
[84]BMSimulationMILPNTC-basedmFRR (MARI)YesTSO-TSO with CMOLAll countries participating in MARI project-
[85]BMSimulation-NTC-basedBalancing energyYesTSO-TSO with CMOLBelgium, France (one day)0.05 mEUR
6%
[86]BMSimulationLPNTC-basedmFRR (MARI)No-Italy-
[87]BMSimulationMILPNTC-basedRR (TERRE)No-Greece-
[88]BMSimulation--Primary
reserves
--United Kingdom, Continental Europe-
[89]BMSimulationMILPFlow-basedaFRR and mFRR
(PICASSO and MARI)
NoTSO-TSO with CMOLAustria, Belgium, Germany, The Netherlands (one year)-
[90]DAM, BMSimulationMILPNTC-basedaFRR and mFRR
(PICASSO and MARI)
YesTSO-TSO with CMOLAustria, Germany, Switzerland (one year)-
[91]BMSimulation--aFRR (PICASSO)--Belgium, France, Germany, The Netherlands, Portugal, Spain (one year)-
Publisher’s Note: MDPI stays neutral with regard to jurisdictional claims in published maps and institutional affiliations.

