Abstract
The high-temperature and high-speed permanent magnet synchronous generator (HTHSPMSG) is the core component ensuring the efficient and safe operation of the high-speed aircraft power supply system. At present, the existing iron loss model fails to meet the requirements for the precise calculation of the iron loss of HTHSPMSG under high-temperature and high-frequency conditions. In this paper, a 40 kW, 18,000 rpm HTHSPMSG is used to study the accurate calculation of iron loss at an ambient temperature of 350 °C. Considering the influence of high temperature and high frequency on the loss and performance of electromagnetic materials, a test platform for the loss performance of the magnetic core materials is established. Then, according to the loss performance of the electromagnetic material, the corresponding iron loss coefficient is fitted by the variable coefficient iron loss separation model. In addition, the digital twin field-circuit co-simulation method is proposed to guarantee the accuracy of the iron loss calculation. Then, the influence of carrier frequencies and modulation ratios on the iron loss characteristics of the HTHSPMSG under the conditions of SVPWM modulation is studied. Lastly, the effectiveness of the proposed method is verified by the experimental results, which provide a reference for the accurate analysis of iron loss of the same type of HTHSPMSG.
1. Introduction
Due to the advantages of high power density and high efficiency, high-temperature and high-speed (HTHS) permanent magnet synchronous generators (HTHSPMSGs) have attracted more and more attention in the aerospace field. However, severe working conditions such as HTHS brought by aero engines may lead to the excessive temperature of the PMs and increase the risk of irreversible demagnetization [1,2]. Therefore, it is necessary to accurately calculate the iron loss of the generator under the conditions of HTHS.
At present, many scholars have proposed calculation methods that consider the influence of multiple physical factors, such as the rotating magnetization model [3], the iron loss model based on the effect of temperature on magnetic properties proposed in [4,5], and a model based on the influence of mechanical stress on the magnetic properties proposed in [6]. Furthermore, the iron loss of the built-in PM motor considering the harmonics of the PWM inverter was calculated in [7,8], without considering the vector control, skin effect, and the effect of temperature. In [9], a method was proposed to predict the iron loss of an inverter-type induction motor by separating the hysteresis component and the eddy current loss. In [10], the eddy current losses of a slotless permanent magnet motor were calculated using a two-dimensional subdomain analytical method in polar coordinates, and the current penetration effect was considered. The losses of a 100 kW, 32,000 rpm high-speed permanent magnet motor were analyzed in [11]. However, the above studies were all based on approximate analytical methods, which require the determination of magnetic materials under a specific functional model, which has certain limitations for the HTHSPMSG in complex environments. It is not applicable to obtain the accuracy and versatility of the HTHSPMSG iron loss model calculation. In [12,13], the effects of high-frequency magnetic field and temperature on iron consumption were considered, respectively, which improved the calculation accuracy. However, only the influence of a single factor on iron loss is considered. A comparison of iron loss characteristics with vector magnetic characteristics was considered in [14], but its applicability to HTHSPMSG iron loss calculations is limited.
In this paper, a high-precision iron loss calculation of an HTHSPMSG used in an aeroengine was carried out. The innovation of this paper is that a special test platform for core material loss performance considering the influence of HTHS is established. Using the digital twin field-circuit coupling co-simulation model, the influence of the carrier frequency and modulation ratio on the iron loss characteristics of HTHSPMSG under SVPWM modulation conditions is studied, which improves the calculation accuracy of the iron loss for the HSPMSGs.
Firstly, an electromagnetic material loss test is carried out to obtain the loss characteristics of materials at different temperatures. Then the loss characteristics of the HTHSPMSG are analyzed. A co-simulation model of motor and its control is established, which is used for the analysis of the motor performance. Lastly, the validity and accuracy of the calculation results are verified by experiments.
2. Test of Core Loss Characteristics under HTHS
The magnetization and loss characteristics of electromagnetic materials are not only related to the frequency of the magnetic field, but also affected by the high-temperature environment. Therefore, it is necessary to measure the magnetization and loss characteristics of electromagnetic materials at different ambient temperatures and frequencies. At present, all electromagnetic material manufacturers can only provide loss characteristics at lower frequencies and lower temperatures, which cannot meet the requirements for accurate calculation of iron loss of HSPMSGs in the high-temperature environment. Therefore, this paper uses the Tektronix PA4000 power analyzer to test the magnetization characteristics and loss characteristics of the 1J22 soft magnetic alloy strip at the ambient temperature of 0 to 350 °C and the frequency of 50 Hz to 2 kHz. The schematic diagram of the test system is shown in Figure 1.
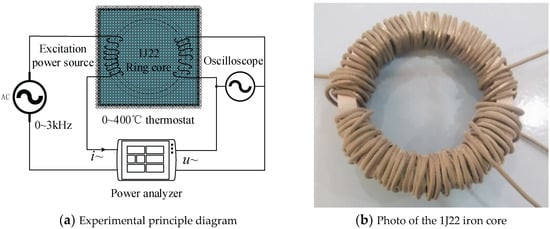
Figure 1.
Experiment for testing the characteristics of the 1J22 iron core; i~ and u~ are the current and voltage of the power analyzer respectively.
The material composition of 1J22 is shown in Table 1. The maximum saturation magnetic induction intensity of 1J22 is 2.4 T, the Curie point is 980 °C, the maximum saturation magneto strictive coefficient is (60 − 100) × 10−6, and the resistivity is 0.27 μΩ·m. The 1J22 soft magnetic alloy sheets are stacked into a ring-shaped iron core as shown in Figure 1, and the stator iron core of the actual HSPMSG is simulated by hydrogen annealing treatment to enhance the magnetic permeability. The tested loss curves of the 1J22 iron core at different temperatures and different frequencies are shown in Figure 2. It can be seen from Figure 2 that, at the same frequency, the stator core loss decreases with increasing temperature. At the same temperature, the stator core loss increases significantly with increasing frequency.

Table 1.
1J22 Composition of electrical steel.
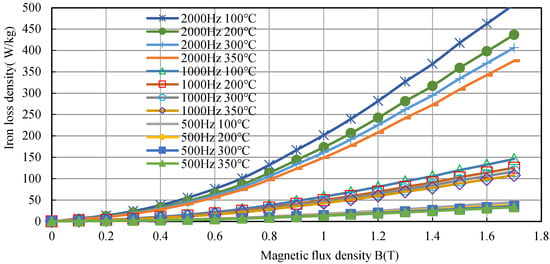
Figure 2.
Specific loss of the 1J22 iron core at different frequencies and different temperatures.
3. Mathematical Calculation Model of Iron Loss
The iron loss of the HSPMSG includes the stator core loss and the rotor eddy current loss. The stator core includes the hysteresis loss, eddy current loss, and additional loss caused by the alternating magnetic field. The SmCo permanent magnet (PM) is surface-mounted on the rotor yoke, and the superalloy is used as a sleeve to enhance the strength of the rotor and wrap the entire rotor as shown in Figure 3. The electrical conductivity of the two materials is relatively large, but the magnetic permeability is relatively low; thus, the eddy current loss accounts for most of the losses of the entire rotor.
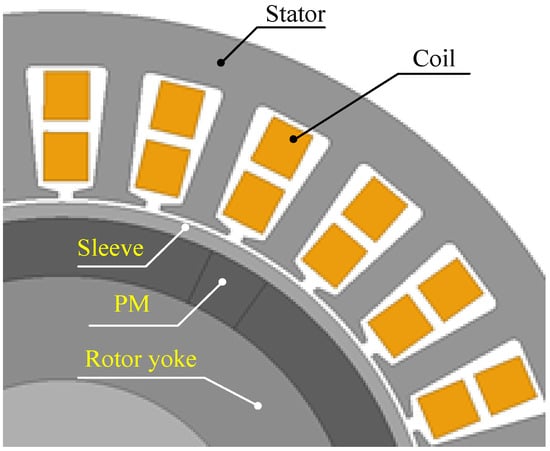
Figure 3.
Schematic diagram of HSPMSG structure.
The stator core of the HSPMSG is made of a 0.2 mm 1J22 soft magnetic alloy silicon steel sheet. The relationship linking loss, frequency, and magnetic density can be expressed as follows [3,4,5]:
For this application, ρ is the electrical resistivity, with a value of 4 × 10⁻⁷ Ω·m, d is the thickness of the 1J22 strip, with a value of 0.2 mm, μr is the relative permeability, with a value of 2000, and μ0 is the vacuum permeability, with a value of 4 π × 10−7. The relationship between Ke(f) and frequency is shown in Figure 4.
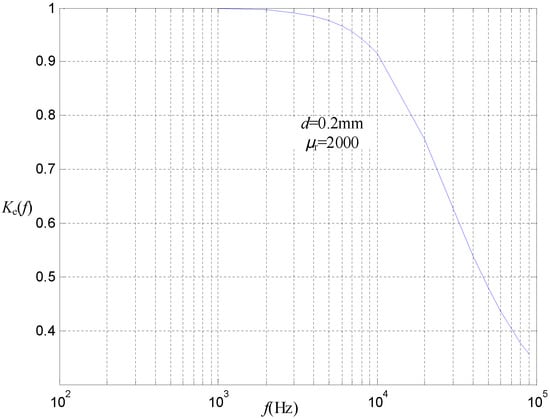
Figure 4.
The relationship between additional loss factor Ke(f) and frequency.
For the HSPMSG with a large number of time harmonics in the phase current, the loss generated on the sleeve and the PM can be calculated as follows [9]:
where V is the volume of each part of the rotor, σ is the electrical conductivity of the rotor material, A is the magnetic potential vector passing through the rotor unit, ρ is the material resistivity, and c(t) is a time-dependent variable.
4. Loss Analysis of the HTHSPMSG
4.1. Parameters and Configuration of the HTHSPMSG
A 40 kW, 18,000 rpm HTHSPMSG used in an aeroengine with an ambient temperature of 350 °C was taken as an example to analyze the iron loss. The main parameters of the HTHSPMSG are shown in Table 2. The rotor uses special SmCo PMs resistant to high temperatures of 500 °C to form a Halbach array structure. The material of the rotor yoke is stainless steel 2Cr13. The core material is soft magnetic alloy 1J22. The sleeve is made of 1 mm superalloy. The HSPMSG is cooled by the constant-temperature oil medium through the spiral channel of the casing, and, after outputting an AC voltage, the power converter rectifies and stabilizes the output DC voltage. The HTHSPMSG and the power converter are shown in Figure 5.

Table 2.
Parameters of the HSPMSG prototype.
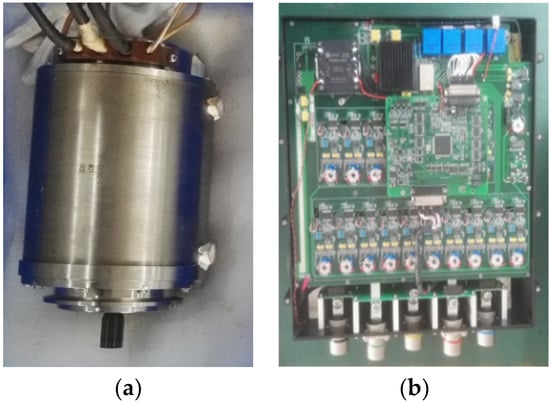
Figure 5.
The physical picture of prototype and power converter: (a) photo of the HSPMSG; (b) photo of the power converter.
4.2. Power Generation System Control Strategy
The strategy when designing the controller of the motor is to use the generator phase power supply, the three-bridge arm IGBT module SKiM909GD066HD, diodes, and voltage-stabilizing capacitors to form a three-phase voltage source PWM bridge rectifier power supply circuit, as shown in Figure 6.
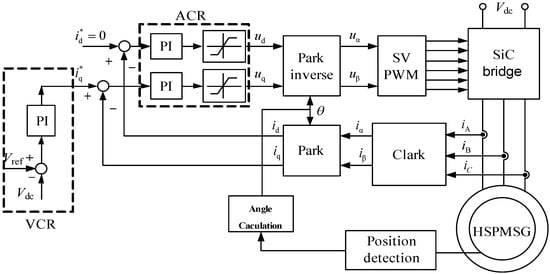
Figure 6.
The block diagram of the power converter control strategy for high-temperature HSPMSG; Vdc is the feedback value of dc voltage sampling, Vef+ is the reference value of DC voltage, id* and iq* are the reference value of direct axis and alternating axis current, respectively, ACR is the current PI regulating loop, VCR is the voltage PI regulating loop, id and iq are the feedback value of direct axis and alternating axis current after the change of three-phase AC vector, respectively.
The controller adopts the 1ED020I12FA2 dedicated 1200 V IGBT driver chip of Infineon Company to realize signal isolation. The control program takes the digital chip TMS320F2812 as the processing unit and adopts the vector control method of the direct-axis current id = 0. The resolver cooperates with the decoding chip AD2S1210 to read the rotor position signal and uses the SVPWM modulation program to fit the space voltage vector control IGBT power tube to generate PWM waveform. The active current iq component and id current component are controlled by the ACR current inner-loop program to realize the feedforward decoupling of the current and voltage of the cross-axis, and the DC voltage is stabilized by the VCR voltage outer-loop program.
4.3. Iron Consumption Calculation Program of HTHS PMSG
According to the actual controller program and device structure, the digital twin field-circuit coupled vector control circuit model is established, as shown in Figure 7. Here, the switching frequency of the IGBT power tube is 12 kHz to 18 kHz, the voltage outer-loop control parameters are KP = 55, KI = 805, and the current inner-loop control parameters are KP = 0.72, KI = 12.5, mainly composed of the resolver rotor position signal module, coordinate vector transformation module, ACR current loop, VCR voltage loop, SVPWM modulation program module, all the motor model materials, and electronic components. These are modified and parameterized according to the actual temperature, and the simulation of 40 kW power generation is carried out in a high-temperature environment at 350 °C and 18,000 rpm speed.
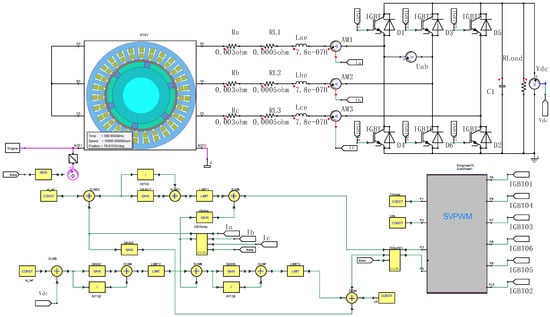
Figure 7.
The digital twin field-circuit coupling vector control circuit model of HSPMSG; Engine is the engine with the input torque, Vdc is the DC voltage sampling feedback value, iqref is the given reference value of the DC voltage and the direct-axis current at the same time, idref is the given reference value of the direct-axis current, theta is the rotor position feedback signal. The three-phase current Ia, Ib, Ic outputs the direct-axis and quadrature-axis current feedback values after passing through the ABC todqm vector transformation module, TPWM is the switching frequency constant, and the SVPWM module outputs 6 switching signals such as IGBT1~ IGBT6 after modulation.
The three-phase winding of the motor is Y-connected; Ra, Rb, and Rc respectively represent the resistance value of the three-phase winding, RL1, RL2, and RL3 respectively represent the resistance value of the external cable of the three-phase winding, and Lae, Lbe, and Lce respectively represent the leakage inductance at the end of the three-phase winding of the motor.
Directly comparing the final output performance is the most obvious method to verify the accuracy of the digital calculation model. The DC output voltage waveform obtained by the field-circuit coupling simulation model is shown in Figure 8, which is very close to the actual test results. The voltage amplitude fluctuates within the range ±3 V, the average effective output value is approximately equal to 270 V, and the output power at this time reaches 40.3 kW.
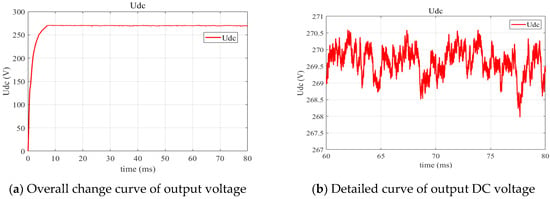
Figure 8.
The output DC voltage waveform obtained by the co-simulation model.
To verify the consistency between the simulation model and the actual motor internal control system, the vector control current curve shown in Figure 9 shows that the average value of the direct-axis current component id is controlled in the range of 0 A, and the effective value of the active quadrature-axis component iq is −255 V, which means that the computational model implements the vector control of the actual controller in the SVPWM modulation mode, which is exactly what we need to be consistent with the actual physical entity.
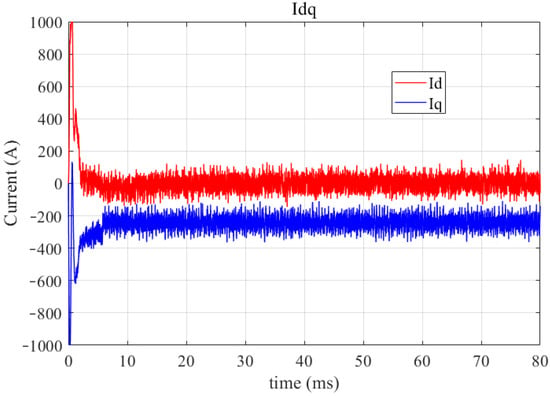
Figure 9.
The current waveform of the quadrature and direct-axis components obtained by the co-simulation model.
When the controllable boost rectifier adopts id = 0 vector control, the AC terminal line current and line voltage waveforms are shown in Figure 10. The line voltage waveform at this time is a series of PWM rectangular waves, and the line current waveform contains a large number of high-frequency time harmonics, which is the main reason for the eddy current loss of the rotor of the high-speed motor.
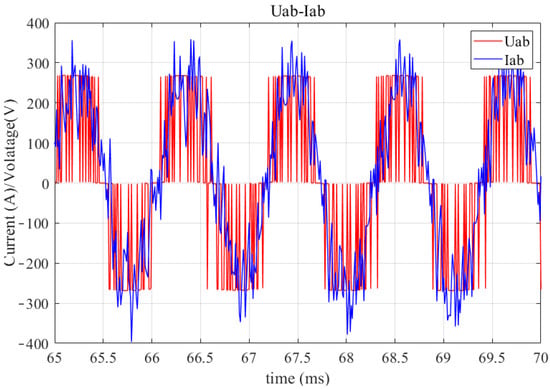
Figure 10.
Line current and line voltage waveforms obtained by the co-simulation model.
The input torque waveform of the prime mover obtained by simulation is shown in Figure 11. At this time, the average input torque of the prime mover is 24.2 N·m, the driving speed is 18,000 r/min, the output power of the DC terminal is 40.3 kW, and the three-phase AC power output of the generator is about 41.6 KW. It can be obtained that the generator efficiency at this time is about 91.2%, and the efficiency of the entire rectifier system is about 88%.

Figure 11.
The input torque waveform of the prime mover.
4.4. Calculation and Analysis of Iron Loss of Generators
After verifying the validity of the calculation model, the loss integration is performed on the generator finite element model co-simulated with the simultaneous mapping data. Before the calculation, the magnetic steel remanence density, coercivity, and conductivity of high-temperature alloy sheath and other electromagnetic material data at 350 °C were modified. The eddy current loss distribution of the generator rotor calculated by the finite element time integration is shown in Figure 12, the stator core loss is shown in Figure 13, and the integrated curve display results are shown in Figure 14.
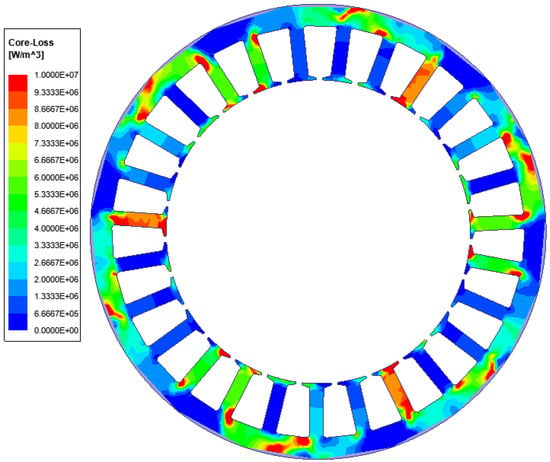
Figure 12.
Distribution of stator core loss density.
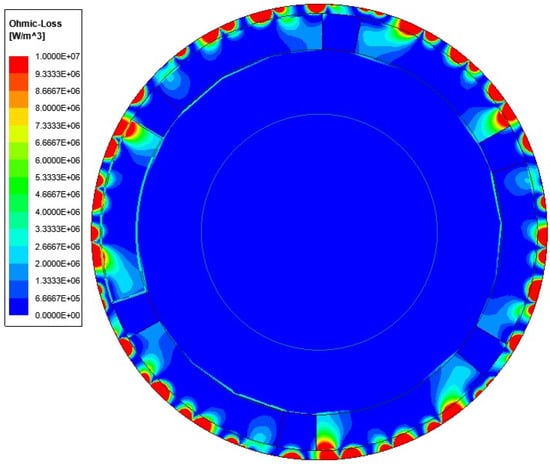
Figure 13.
Distribution of rotor eddy current loss density.
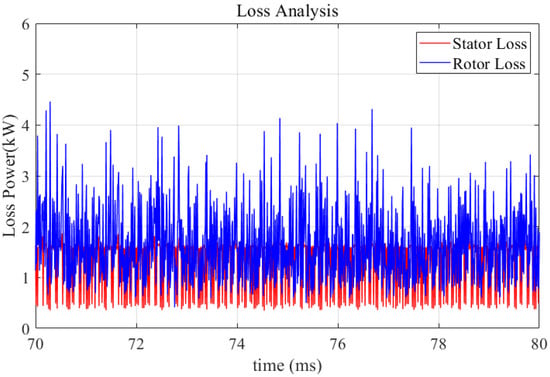
Figure 14.
The iron loss curve of motor stator and rotor under rated conditions.
It can be found from the calculation results that the eddy current loss of the motor rotor increases significantly when SVPWM modulation is used, which is caused by the high-frequency time-harmonic deviation generated when the SVPWM modulation module performs the equivalent fitting of the voltage vector, and the high-conductivity superalloy sheath material further strengthens the eddy current effect. At the same time, it can be seen that the penetration depth of high-frequency harmonics decreases with the increase in frequency. From the air gap through the alloy sheath, permanent magnet, and yoke, the eddy current loss is mainly distributed on the surface of the sheath, and it is attenuated to be negligible when it reaches the yoke.
To obtain the variation relationship between the iron loss and the output power of the generator, a series of operating conditions were calculated by changing the load size. The calculation results are compared and verified with the measured data in Section 5.
5. Experiment and Analysis
The load test of the generator prototype was carried out on a special high-temperature test bench. The principle of the test device is shown in Figure 15, and the assembly of the test device is shown in Figure 16.
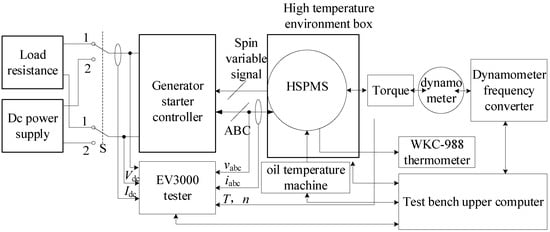
Figure 15.
Schematic diagram of the test device; ABC represents the three-phase cable, the Spin variable signal represents the resolver position feedback signal line, Vdc and Idc are the DC voltage and DC feedback values collected by the sensor, respectively, vabc and iabc are the three-phase voltage and three-phase current acquisition signals respectively, T and n are the generator input torque and rotational speed values collected by the torque and rotational speed sensors, respectively. EV3000 is a test signal conversion device.
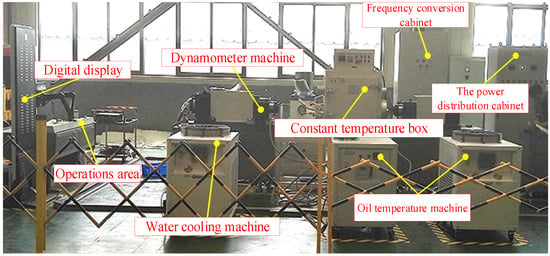
Figure 16.
Overall diagram of the test device.
Figure 17 shows the starting and power generation performance test platform, including the high-temperature oil thermostat, dynamometer, inverter, console, water cooler, high-temperature box, and load, which can meet the test requirements of a high-temperature and high-speed generator system of 40 kW, 18,000 rpm, and 350 °C. The controller’s DC voltage Vdc, DC current Idc, three-phase AC voltage vabc, three-phase AC current iabc, torque T, and speed n are obtained through the EV3000 power analysis system. The internal winding temperature of the motor is obtained by a WKC-988 thermometer The high-temperature lubricating oil of the generator is provided by the oil thermostat, and the high-temperature environment of the generator is provided by the high-temperature environment box. Except for the internal temperature of the motor obtained by the WKC-988 thermometer, the other test data are obtained by the upper computer of the test bench.
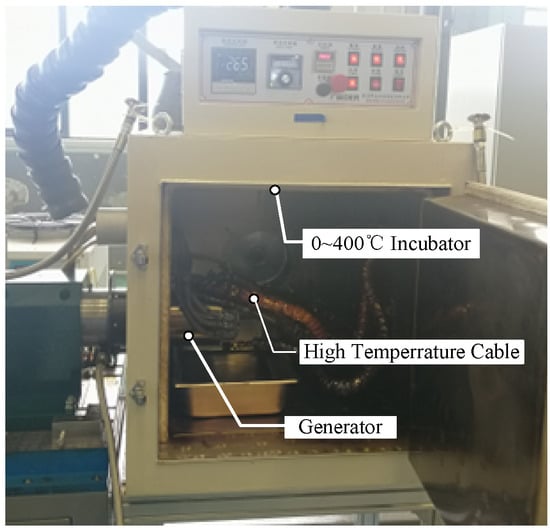
Figure 17.
The installation schematic diagram of the motor in the environmental test chamber.
By changing the experimental platform, the measured output voltage and current waveforms of the motor are shown in Figure 18. Comparing the calculation results of the co-simulation model with the experimental results, the motor loss comparison under different load conditions is shown in Figure 19. On this basis, the motor loss is compared with that when the influence of temperature change on the core loss coefficient is ignored. The settlement result is shown in Table 3.
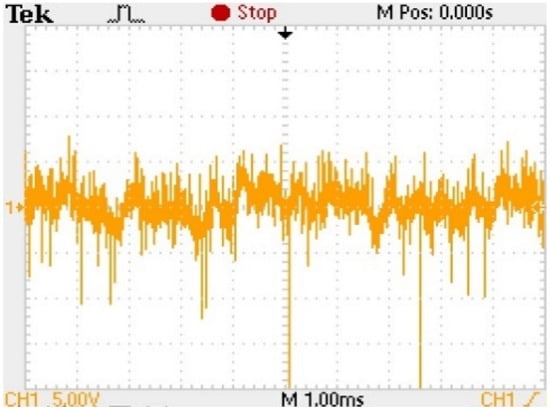
Figure 18.
Measured output DC voltage waveform.
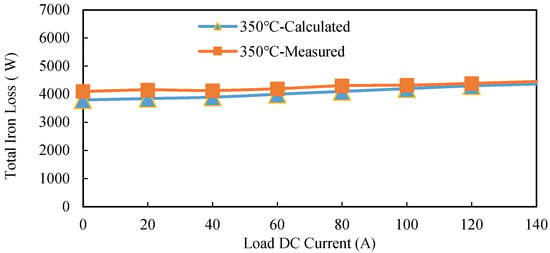
Figure 19.
Iron loss curve of various load at 350 °C, 18,000 rpm, fs = 18 kHz.

Table 3.
Measured value of generator loss.
It can be seen from Figure 19 that the iron loss calculation results are in good agreement with the experimental results, with an average error of 4.7%. It can be seen from the table that, due to the large loss of the generator and the controller, the efficiency of the entire power generation/rectification system is about 84.3%. The calculated total loss is consistent with the measured value, which also proves the rationality of the calculation method. Without considering the change of the loss coefficient with temperature, the error of the calculation result will increase by about 15%, which proves the necessity of this model for calculating the loss of the HTHSPMSG.
To verify the harmonic content in the phase current of the generator, Fourier analysis was performed on the actual phase current data collected by the generator in a high-temperature environment and SVPWM modulation. The comparison of measured current waveform and simulation current waveform by Fourier decomposition is shown in Figure 20.
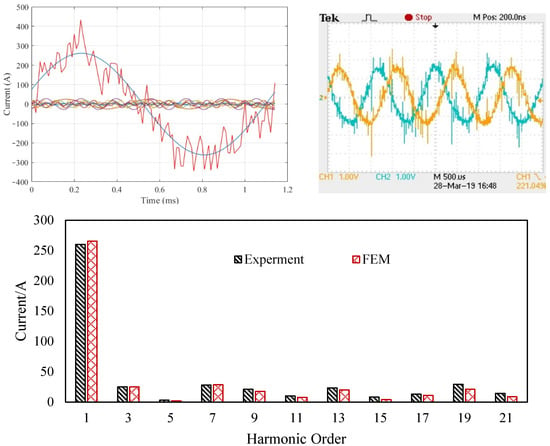
Figure 20.
Fourier decomposition of generator phase current.
It can be seen from the analysis results that the simulation results of the motor output current waveform are in good agreement with the experimental results. The error between the simulated fundamental wave amplitude and the experimental value is 2.1%, and the errors between other harmonics and experimental results are also small. It can be found that a large number of high-order harmonics will be generated in the phase current of the motor during PWM rectification, and these high-order harmonics are the main reason for the increase in motor loss.
From the principle of SVPWM vector voltage modulation, it can be known that the PWM level trigger point is determined by the triangular carrier and the modulation wave. Therefore, the rectification performance can be optimized by adjusting the carrier frequency and modulation ratio. The temperature of the incubator was set to 350 °C, the DC load was adjusted to 40 kW, the carrier frequency fs was set to 12–18 kHz, and the modulation ratio M was set to 0.6 and 0.78 in the control program to carry out experimental verification. At the same time, the same settings were calculated in the field-circuit simulation model, and the measured and calculated loss of the HSPMSG is shown in Figure 21. It can be seen that, as the carrier frequency and modulation ratio decrease, the eddy current loss and core loss of HSPMSG increase, and the simulation results are in good agreement with the measured results. When the carrier ratios are 0.6 and 0.78, the average errors are 1.8% and 1.9%, respectively.
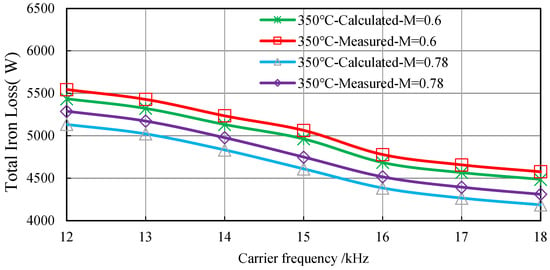
Figure 21.
The measured and calculated loss of HSPMSG of various carrier frequencies at 350 °C, 18,000 rpm, 40 kW.
6. Conclusions
In this paper, a co-simulation model was proposed to accurately calculate the iron loss of HTHSPMSG under SVPWM power supply. The change in the iron loss of the motor at high temperature and high frequency was considered by testing the loss coefficient of the stator core at different temperatures and frequencies. The loss test of the motor under different load conditions proves that the model is effective and has high calculation accuracy, which is of great significance for the accurate analysis of iron loss of HTHSPMSGs. Under different switching frequencies and carrier ratios, the iron loss calculation error was within 2%.
According to the simulation model and the test results of the HTHS platform, temperature has a great influence on the iron loss of HTHSPMSG. When the influence of the temperature change on the iron loss was considered, the calculation accuracy was significantly improved, and the error between the co-simulation results and the experimental results was 4.7%. The high-frequency harmonic is the main factor of iron consumption, and the switching frequency loss of SVPWM can be significantly reduced by increasing SVPWM. However, when the switching frequency is more than 20 times the fundamental frequency of the motor, the loss remains the same. At this time, the iron loss of the motor can be further suppressed by increasing the carrier ratio.
Author Contributions
Conceptualization, R.S.; Data curation, D.Y.; Funding acquisition, R.S.; Investigation, L.S.; Methodology, L.Z., L.S. and J.Z.; Project administration, D.Y. and R.S.; Resources, J.Z.; Software, L.S.; Visualization, J.Z.; Writing—review & editing, L.Z. All authors have read and agreed to the published version of the manuscript.
Funding
This research received no external funding.
Institutional Review Board Statement
Not applicable.
Informed Consent Statement
Not applicable.
Data Availability Statement
Data is available.
Conflicts of Interest
The authors declare no conflict of interest.
References
- Lee, J.-H.; Kim, W.-J.; Jung, S.-Y. Analysis and Verification of Traction Motor Iron Loss for Hybrid Electric Vehicles Based on Current Source Analysis Considering Inverter Switching Carrier Frequency. Electronics 2021, 10, 2714. [Google Scholar] [CrossRef]
- Du, J.; Li, C.; Zhao, J.; Ren, H.; Zhang, K.; Song, X.; Chen, L.; Yu, S.; Mi, Y. Investigation of Eddy Current Loss and Structure Design with Magnetic-Thermal Coupling for Toothless BLDC High-Speed PM Motor. Machines 2022, 10, 118. [Google Scholar] [CrossRef]
- Huang, Y.; Dong, J.; Zhu, J.; Guo, Y. Core Loss Modeling for Permanent-Magnet Motor Based on Flux Variation Locus and Finite-Element Method. IEEE Trans. Magn. 2012, 48, 1023–1026. [Google Scholar] [CrossRef]
- Xue, S.; Feng, J.; Guo, S.; Peng, J.; Chu, W.Q.; Zhu, Z.Q. A New Iron Loss Model for Temperature Dependencies of Hysteresis and Eddy Current Losses in Electrical Machines. IEEE Trans. Magn. 2018, 54, 1–10. [Google Scholar] [CrossRef]
- Fujisaki, K.; Hirayama, R.; Kawachi, T.; Satou, S.; Kaidou, C.; Yabumoto, M.; Kubota, T. Motor core iron loss analysis evaluating shrink fitting and stamping by finite-element method. IEEE Trans. Magn. 2007, 43, 1950–1954. [Google Scholar] [CrossRef]
- Liu, G.; Liu, M.; Zhang, Y.; Wang, H.; Gerada, C. High-Speed Permanent Magnet Synchronous Motor Iron Loss Calculation Method Considering Multiphysics Factors. IEEE Trans. Ind. Electron. 2019, 67, 5360–5368. [Google Scholar] [CrossRef]
- Yamazaki, K.; Watari, S. Loss analysis of permanent-magnet motor considering carrier harmonics of PWM inverter using combination of 2-D and 3-D finite-element method. IEEE Trans. Magn. 2005, 41, 1980–1983. [Google Scholar] [CrossRef]
- Yamazaki, K.; Abe, A. Loss Analysis of Interior Permanent Magnet Motors Considering Carrier Harmonics and Magnet Eddy Currents Using 3-D FEM. In Proceedings of the 2007 IEEE International Electric Machines & Drives Conference, Antalya, Turkey, 3–5 May 2007; Volume 2, pp. 904–909. [Google Scholar]
- Boglietti, A.; Cavagnino, A.; Ionel, D.M.; Popescu, M.; Staton, D.A.; Vaschetto, S. A General Model to Predict the Iron Losses in PWM Inverter-Fed Induction Motors. IEEE Trans. Ind. Appl. 2010, 46, 1882–1890. [Google Scholar] [CrossRef]
- Dubas, F.; Rahideh, A. Two-Dimensional Analytical Permanent-Magnet Eddy-Current Loss Calculations in Slotless PMSM Equipped with Surface-Inset Magnets. IEEE Trans. Magn. 2013, 50, 54–73. [Google Scholar] [CrossRef]
- Huang, Z.; Fang, J.; Liu, X.; Han, B. Loss Calculation and Thermal Analysis of Rotors supported by Active Magnetic Bearings for High-Speed Permanent Magnet Electrical Machines. IEEE Trans. Ind. Electron. 2015, 63, 1. [Google Scholar] [CrossRef]
- Roy, R.; Dalal, A.; Kumar, P. Prediction of high frequency core loss for electrical steel using the data provided by manufacturer. J. Magn. Magn. Mater. 2016, 410, 248–256. [Google Scholar] [CrossRef]
- Chen, J.; Wang, D.; Cheng, S.; Wang, Y.; Zhu, Y.; Liu, Q. Modeling of temperature effects on magnetic property of nonoriented silicon steel lamination. IEEE Trans. Magn. 2015, 51, 1–4. [Google Scholar] [CrossRef]
- Yokoyama, D.; Sato, T.; Todaka, T.; Enokizono, M. Comparison of Iron Loss Characteristics of Divided Cores Considering Vector Magnetic Properties. IEEE Trans. Magn. 2014, 50, 1–4. [Google Scholar] [CrossRef]
Publisher’s Note: MDPI stays neutral with regard to jurisdictional claims in published maps and institutional affiliations. |
© 2022 by the authors. Licensee MDPI, Basel, Switzerland. This article is an open access article distributed under the terms and conditions of the Creative Commons Attribution (CC BY) license (https://creativecommons.org/licenses/by/4.0/).