Article

Physical Model Test and Heat Transfer Analysis on Backfilling Construction of Qinghai-Tibet Transmission Line Tower Foundation

1
School of Civil Engineering, Institute of Cold Regions Science and Engineering, Northeast-China Observatory and Research-Station of Permafrost Geo-Environment of the Ministry of Education, Northeast Forestry University, Harbin 150040, China
2
Northwest Institute of Eco-Environment and Resources, China Academy of Sciences, Lanzhou 730000, China
3
Melnikov Permafrost Institute, Siberian Branch, Russian Academy of Science, 677010 Yakutsk, Russia
*
Author to whom correspondence should be addressed.
These authors contributed equally to this work.
Energies 2022, 15(7), 2329; https://doi.org/10.3390/en15072329
Submission received: 21 February 2022 / Revised: 15 March 2022 / Accepted: 16 March 2022 / Published: 23 March 2022

Abstract

:
The cone-cylindrical pile foundation is a kind of shallow buried foundation, which needs to be open excavated and backfilled during construction. The density of the backfill is closely related to the refreezing process of the backfill. However, there is still a lack of relevant research on the relationship between backfill density and the refreezing process of backfill. The method of model experiment is selected to study the refreezing process of backfill under three backfill soil densities. The controlled density of backfill is 1.83, 1.62 and 1.36 g/cm3, and the times of freeze–thaw cycle is 14, 22 and 39, respectively. The main research findings are as follows: First, the effect of the initial temperature of the backfill on the refreezing is mainly reflected in the first three freeze–thaw cycles; the second is that the higher the density of the backfill, the faster the backfill responds to changes in outside air temperature, and the shorter the freezing time; third, the pile foundation is a good conductor of heat, which will cause the soil temperature change on the pile side to be significantly greater than that of the natural soil, and the temperature change of the pile foundation surface is greater than that of the backfill. The research results can provide a reference for the backfill construction of pile foundations in cold regions and the selection of boundary conditions for related numerical simulations.

Graphical Abstract

1. Introduction

Frozen soil has complex engineering properties related to negative temperature [1]. Foundations are the important components of engineering structures, which are embedded in the soil. In permafrost regions, the main body of the foundation must be frozen in cold and warm seasons to ensure the stability of the foundation. According to the embedded depth, foundations are divided into shallow foundation and deep foundation. There are many studies about the deep foundation, mainly focused on the refreezing process [2], bearing capacity [3], and long-term thermal stability [4]. However, theoretical and experimental research on the shallow foundation in permafrost is short, and the research is far behind the practice. In this paper, we mainly focused on the temperature regime of the cone-cylindrical pile foundation (a kind of shallow foundation).
The cone-cylindrical pile foundation is composed of a gradual conical pile and base. Inevitably, the foundation is constructed by open excavation and backfilling in engineering practice. At present, the foundation is mainly used in transmission lines as the tower foundation to reduce the influence of tangential frost heave force and enhance the frost-uplift resistance of the foundation [5,6]. Compared with other forms of pile foundations, when subjected to uplift loads, the cone-cylindrical pile foundation is constrained by the upper soil to maintain the relative stability of the structure [7,8,9,10,11]. The Qinghai–Tibet Power Transmission line runs across permafrost regions. Many kinds of foundation types were applied in the project, and the most common type is the shallow foundation covered in this paper, which accounted for more than 60% of the total tower foundations [12]. Since the cone-cylindrical pile foundation is a shallow buried foundation, its foundation depth is about 3.7–5.8 m [5], so it needs to be excavated and backfilled during construction. This construction method will undoubtedly disturb the permafrost temperature. Zhang et al. [13] established a thermal model to predict the soil temperature and settlement in each freeze–thaw cycle, and found that the settlement of the foundation occurred 20 to 30 years after construction, and the embedded depth of the foundation would affect the settlement. Wang et al. [14] established a thermal model using the stochastic analysis method, which can be used to analyze the settlement of the foundation under the condition of temperature changes. Shi et al. [15,16] designed an indoor test to explore the water migration status and pile foundation refreezing process. You et al. [17] and Xie et al. [18] monitored the change of soil temperature after construction by setting temperature sensors during foundation construction, and found that construction in winter has little effect on soil temperature, and the refreezing process of soil around tower foundation is significantly affected by the type of permafrost and the ice content. Compared with the rich permafrost, the soil in the less permafrost area cools faster. How to maintain the relative stability of the frozen soil temperature after the construction of the tower foundation of the transmission line is also an essential issue. To keep the main foundation frozen with the surrounding soil, some remedial measurements were adopted in the unstable permafrost areas, which can reduce the temperature of the foundation. Li et al. [19] analyzed the permafrost active layer and other contents based on the study of the freezing and thawing characteristics and temperature field of the pile foundation without protection measures. Mu et al. [20] studied the cooling effect of the thermosyphon on the soil, and found that the cooling effect of the thermosyphon was better in the first five years of operation, and the soil around the thermosyphon was significantly cooled. Yu et al. [21] studied the stability of pile foundations after construction by means of field monitoring. The monitored settlement values of 130 tower foundations were all within the allowable range. Guo et al. [22] studied the influence of the thermal effect of the thermokarst lake on the pile foundation. The simulation results show that the thermal effect of the thermokarst lake can reach 30 m outside the lake. In the case of climate warming, this thermal effect will shorten the service time of the tower foundation. Periglacial processes are also an important threat to the safety of power lines, but this problem is largely dependent on the climatic environment and is less likely to occur [23].
These existing studies often only focus on the backfilling process after construction, the mechanical stability of the tower foundation, and the adoption of engineering measures to protect the dynamic stability of the backfill to maintain the operation of the transmission line. However, the impact of the construction process on the backfill soil and freezing is ignored, and the backfill construction is an important part of the tower foundation construction of the transmission line. Because of the construction time, frozen block inevitably existed in the backfill. It is difficult to compact the foundation backfill in the engineering practice. With difficulties in compacting backfill, the density of backfill varies greatly in the engineering practice. However, little attention is paid to explore the relationship between backfill density and the refreezing process. To investigate the temperature regime under the different densities of backfill in permafrost regions, three model experiments were conducted. Referring to the experimental design of references [24,25], the main contribution of this paper can be summarized as follows: firstly, temperature variations with depth and horizontal direction are analyzed; secondly, the effect of initial temperature in backfilling is considered in the long-term refreezing process; thirdly, the differences of boundary conditions and thermal conductivity between backfill and foundation are proposed; lastly, the refreezing process of foundation backfill under freeze–thaw cycles was investigated. The experimental results were analyzed to have an overall understanding of the refreezing process of high-, middle-, and low-density backfill, as well as to make some engineering recommendations for the backfilling construction of shallow foundations by open excavation in permafrost regions.

2. Experimental Scheme and Method

In the construction of transmission line tower foundation in permafrost regions, the whole construction process can be divided into three steps: foundation excavation, pile foundation installation, and backfilling (Figure 1). During the model test, we also followed the actual construction process, but limited by the conditions, we scaled down the model.

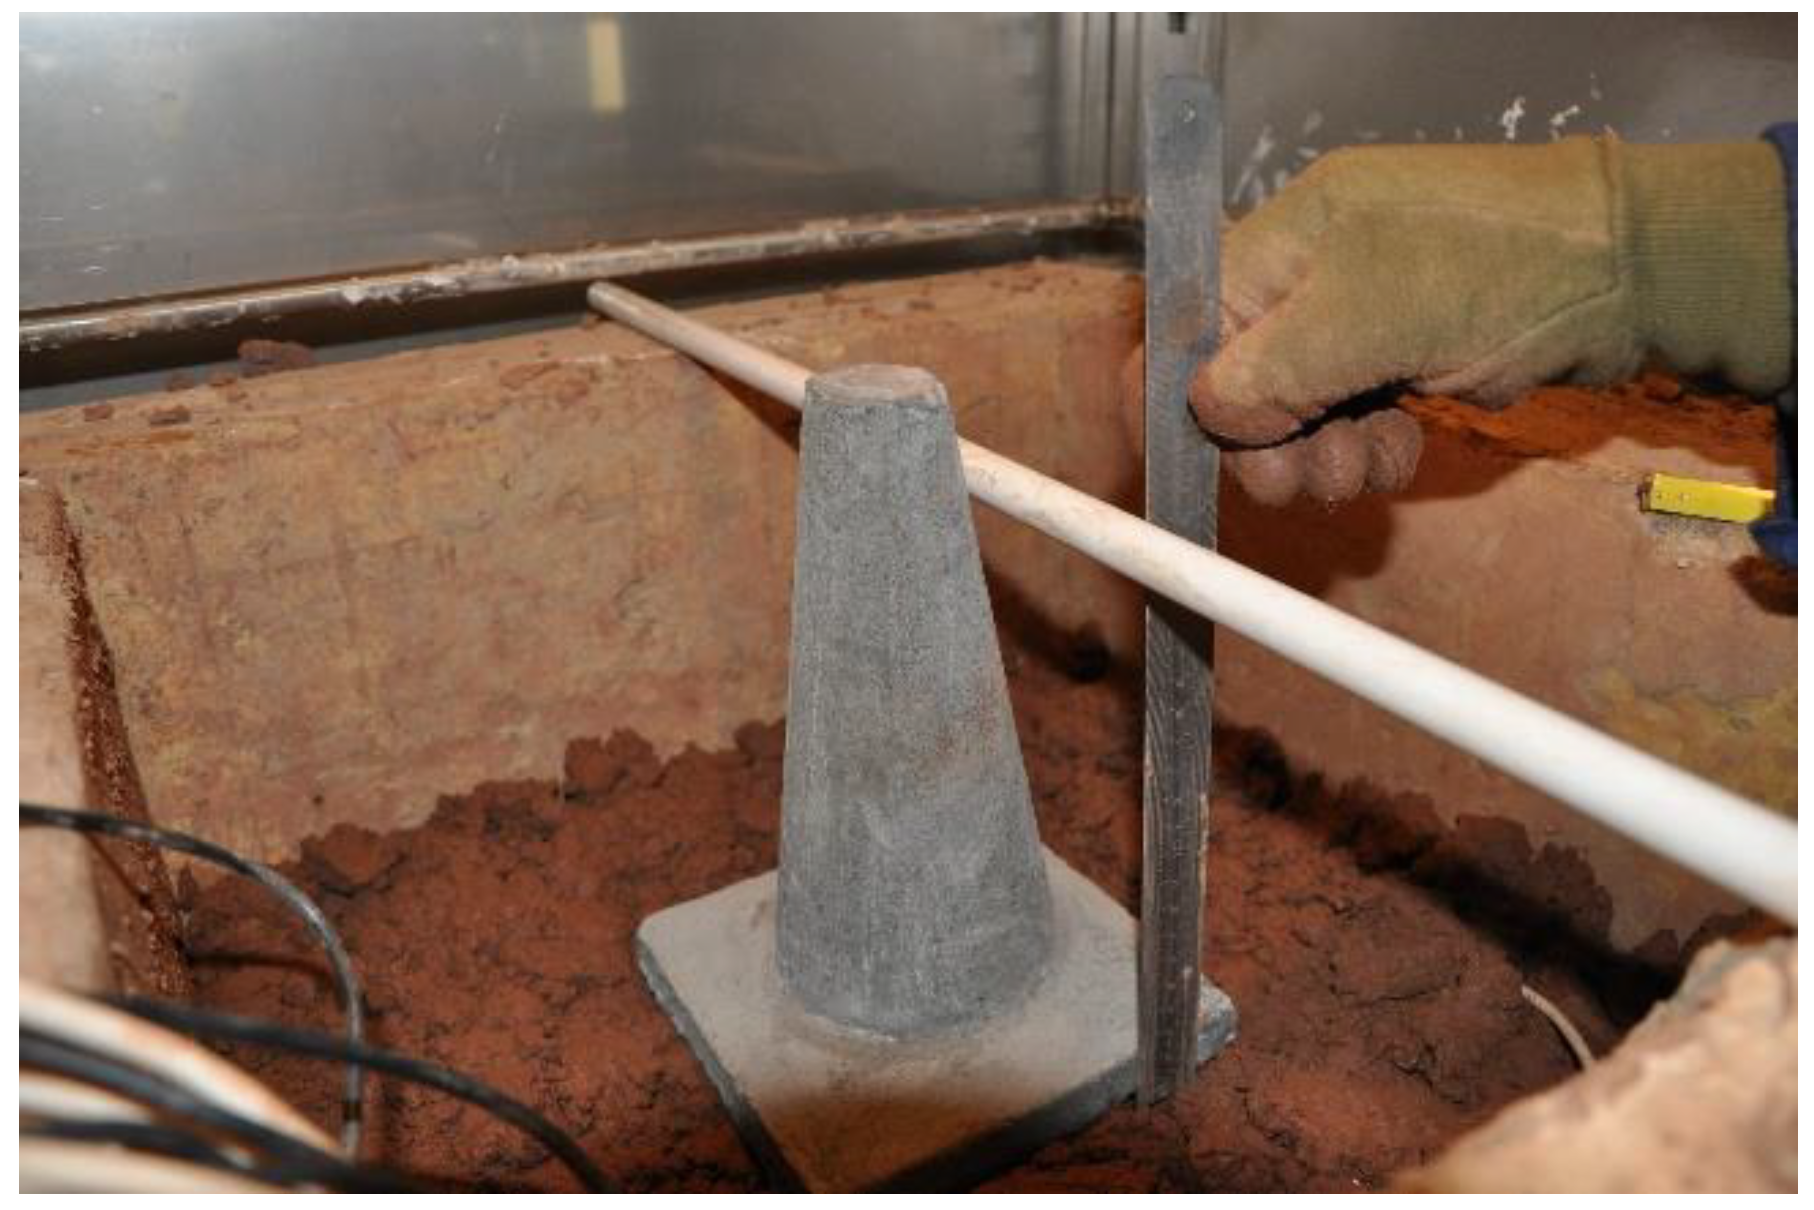
2.1. Foundation Model

According to the similitude theory of modeling tests for no-load conditions in the freeze–thaw process, when the soil, temperature, and moisture content are same as the prototype, the square of the geometric ratio is equal to the time ratio [28], expressed as Equation (1).
c l = c t
where c t is the time ratio, c l is the geometric ratio.
For experiment operation and data processing convenience, we set 24 h as a freeze–thaw cycle to simulate the temperature variation in one year. Therefore, the value of time ratio is 365. The geometric ratio is calculated based on Equation (1), which is approximately 19.0. The length and height of base are 165 and 20 mm, respectively. The main part of the foundation is a short conical pile, and the top diameter, bottom diameter, and height are 40, 100, and 210 mm, respectively. The slope height between cone and base is 10 mm. The foundation model was prefabricated by the stainless mold, and the reinforced concrete was cast into the mold. The foundation model was shown in Figure 2.

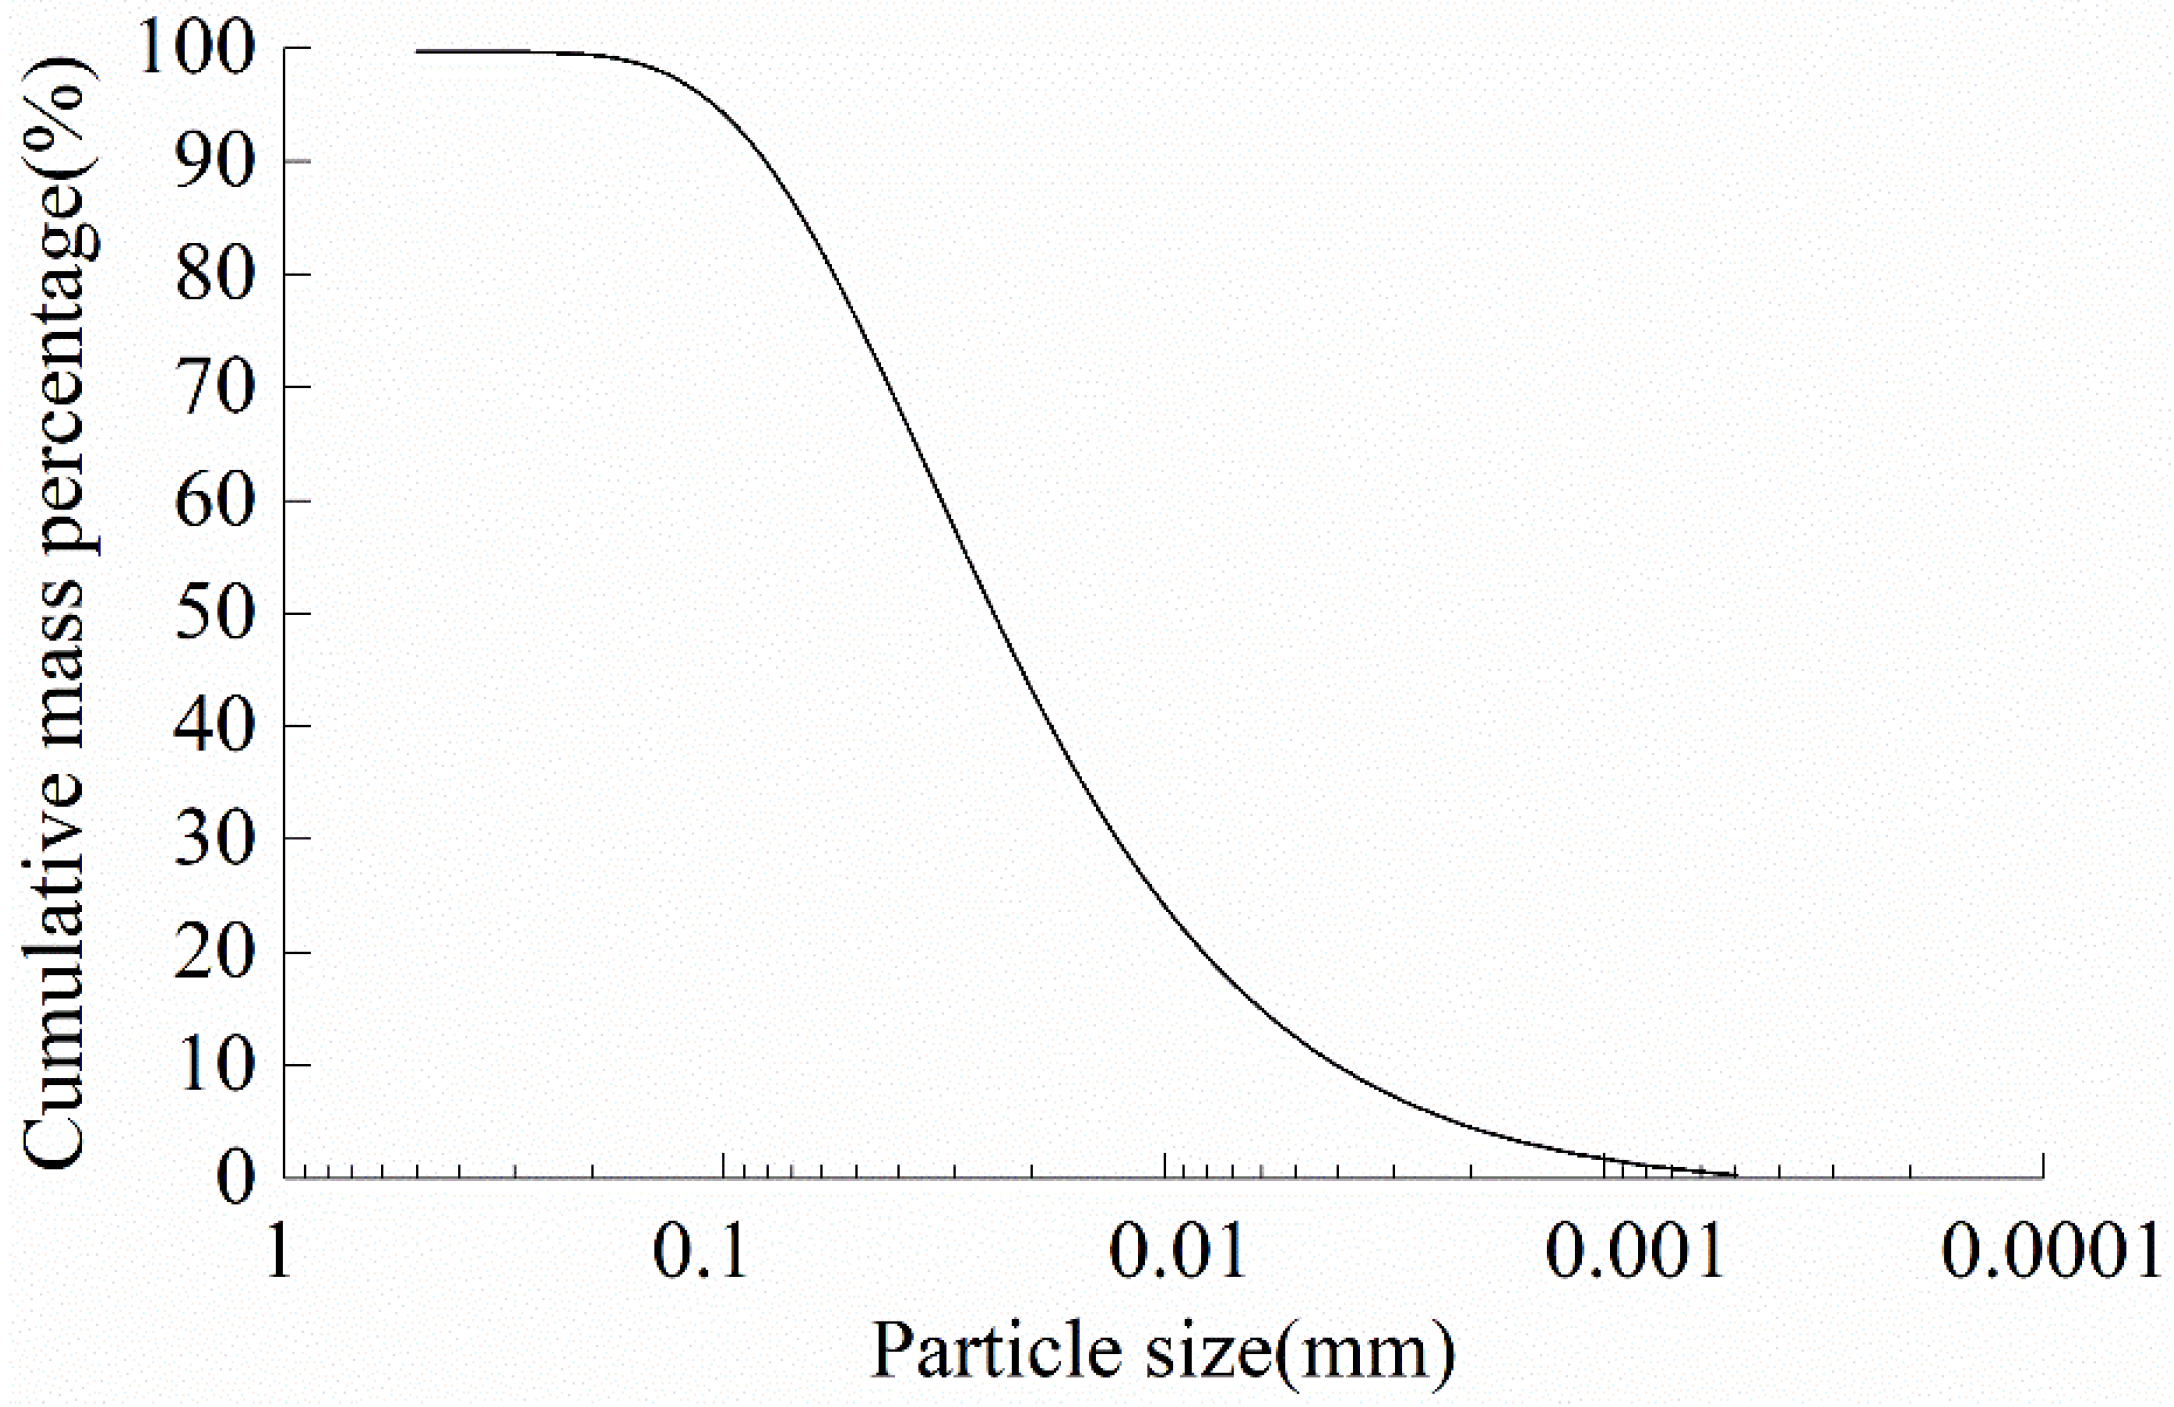
2.2. Experimental Materials

The model experiments were carried out with clay which was taken from the Qinghai–Tibet Plateau, and the grain composition is shown in Figure 3. The plastic limit and liquid limit were 14.6% and 22.0%, respectively. Based on the results of site tests, the initial moisture content of the backfill was kept about 15% in experiments, the maximum dry density is 1.85 g/cm3. This was according to the requirement of the minimum degree of compaction of 0.8 (Chinese Technical Code). The backfill was controlled in high, middle and low density, the value is 1.83 g/cm3 (0.98), 1.62 g/cm3 (0.87) and 1.36 g/cm3 (0.73), respectively. From high to low, three groups of experiments were numbered I, II, and III.

2.3. Temperature Sensors Layout

The model experiments were conducted in a small-scale model test box, which can simulate actual environment temperature change. The size of the box is 50 × 50 × 35 cm, and the surrounding and bottom are adiabatic in the experiments. As shown in Figure 4, the foundation model is located in the middle of the model box, and the temperature sensors were arranged on one side of the central section of the box. Fifteen temperature sensors were laid in the backfill and 3 sensors were laid on the soil surface. The horizontal and vertical spacing of each test point was 7 cm. For convenience, we numbered the sensors. From the surface to the bottom of the backfill along the vertical direction, the locations of 0, 7, 14, 21, 28, and 35 cm were numbered A, B, C, D, E, and F, respectively. From the center outside, the location of 0, 7, 14, and 21 cm were numbered 1, 2, 3, and 4, respectively. The location of every temperature sensor was represented by the combination of letters and numbers. One temperature sensor was laid at the top of the foundation, which was numbered P1. Besides, one temperature sensor was located above the box to measure the ambient temperature of the chamber.

2.4. Experimental Boundary Conditions

Both the bottom and surrounding of the box were adiabatic, and only the surface suffered freeze–thaw cycles. Based on the data from in-site weather station and the adherent layer theory [29], the annual temperature change was fitted according to Equation (2), expressed as:
T = T a + A s i n ( w t + θ )
where T a is the average annual temperature, based on the annual monthly temperature, A is the amplitude of annual temperature change, w is the temperature cycle period, t is time, θ is initial phase.
When c l = 19.0 was satisfied, the prototype temperature change can be simulated in 24 h. Therefore, the freeze–thaw cycle of the model test is 24 h in this paper. The cycles started at the moment of maximum air temperature. The fitted temperature formula is expressed as Equation (3):
T = 2.71 + 11.34 s i n ( 2 π 24 t + π 2 )
The correlation coefficient between the air temperature calculated by Equation (3) and the observed air temperature is 0.99, the average error is 0.29, and the largest error occurs in September with a difference of 0.51. Before experiments, temperature data were input in the temperature control system of the environmental test chamber. The temperature change curve is shown in Figure 5.
Considering the most unfavorable conditions of open excavation and backfilling construction, the refreezing process of backfill is studied under the conditions that construction is completed in warm seasons. After backfilling, the chamber was adjusted to 8.7 °C and maintained some time until the temperature of inside soil reached 3–7 °C. When the initial temperature reached a certain temperature, the freeze–thaw cycle experiments were started. During the experiments, the bottom of the box was kept with water supplement and the surface of soil was treated with water separation by plastic film.
The automatic full-time data acquisition instrument was used to collect and store the temperature data, and the data collection frequency is 1 min−1. Three groups of model tests were conducted under different densities and different freeze–thaw cycles, as shown in Table 1.

3. Results and Analysis

Using the method of model test, we tested the temperature change after the backfill construction of the tower foundation of the transmission line. The initial temperature after the backfill construction, the temperature variation of the three backfill soils, and the boundary temperature of the pile foundation and soil surface are presented separately.

3.1. Initial Temperature

The initial temperatures of the three groups are all different. The initial temperature of backfilling is evaluated by using the temperature data 14 cm outside the axis of symmetry of the pile. The temperature values are shown in Table 2. The initial temperature of group II is the highest, which reaches 6.25 °C. The initial average temperature of Group I and Group III is close, the values are 3.48 °C and 3.98 °C, respectively. Figure 6 shows the temperature change of the first five freeze–thaw cycles at the D3 position in the backfill. It can be seen that the first two freeze–thaw cycles have a significant cooling effect on the soil temperature. Although not frozen, the backfill reduces to near 0 °C.
The first two freeze–thaw cycles have almost eliminated the effects of different initial temperatures on the refreezing process. It is found that the initial temperature difference has little influence on the long-term refreezing. Because of the latent heat released by water–ice phase change, the heat capacity of backfill at the temperature range of phase change is noticeably greater than that of unfrozen soil. Therefore, soil water plays a very important role to retard the refreezing process. That is why backfill temperature drastically decreases at the first two cycles and almost stays at 0 °C in later cycles.

3.2. Temperature Variation along with the Depth

Figure 7 shows the variation of backfill temperature with time at different depths in group II. The backfill temperature drastically decreases at the first two cycles. After several cycles, the temperature at B3 position cyclically varies; the temperature at C3 position is also cyclically fluctuating, but the amplitude is smaller than that of the shallow position, i.e., B3; the temperature at D3 almost keeps stable (about 0 °C), and the average temperature of internal soil gradually decreases with time. Figure 8 shows the change of temperature at depth of 7 cm below surface in three groups. The temperature of three groups decreases with cyclically fluctuation, the backfill density has a significant influence on the temperature amplitude. The backfill density of group I is the highest in three groups, and the amplitude value is the maximum after five cycles. Although the thickness below surface is just 7 cm, the temperature response of backfill to the ambient temperature varies greatly because of density difference.
The temperature of backfill cyclically changes with the ambient freeze–thaw cycles. It is found that the amplitude of fluctuation decreases with the increase of depth in Figure 7 and the attenuation ability for temperature becomes weaker in denser backfill as shown in Figure 8. Because heat conduction needs time and the temperature change must absorb or release heat, the amplitude decreases with depth and the temperature change of internal backfill lags behind air temperature. Under the same water content, the denser soil has the higher thermal conductivity whether the soil is in a frozen or unfrozen state [30]. Therefore, the temperature variation of group I (1.83 g/cm3) is more sensitive to the ambient temperature change than the other groups and its amplitude is the maximum in three groups.

3.3. Boundary Conditions of Foundation and Backfill

The temperature measured by three sensors at the soil surface is almost the same, so the temperature of the soil surface denotes the measured data at the A3 position. Temperature changes with time of soil surface and foundation top are shown in Figure 9. The sub-figure I, II, and III is the corresponding experiment group, and temperature change with time is drawn at the first 14 cycles. From Figure 9, it is found that the temperature amplitude of the foundation top is greater than that of the soil surface. Temperature variation keeps the step of ambient cycle. Both the cycle and phase angle of the temperature variation of soil surface and foundation top is almost equal to the ambient cycle, but the amplitude difference between soil surface and foundation always exists in all cycles. At the moment of the maximum ambient temperature in the 14 cycles, the difference in value between soil surface and foundation top of three groups is 3.08 °C, 5.86 °C, and 6.44 °C, respectively. At the moment of the minimum ambient temperature in the 14 cycles, the difference value is 3.64 °C, 7.17 °C, and 7.46 °C, respectively. The difference in the minimum value is greater than that of the maximum value in one cycle.
Thermal boundary conditions of foundation and backfill are different. Three groups have similar characteristics of temperature change, and the temperature of soil surface and foundation top temperature cyclically changes. The foundation is more sensitive to the ambient temperature, and the difference is mainly dependent on the materials. The foundation is made of reinforced concrete, which has better heat conductivity and less heat capacity than soil. The difference of thermal boundary conditions may directly lead to unconformity of temperature change along the horizontal direction. If the same boundary conditions are applied on soil and foundation in the numerical simulation, the simulation results may be quite different from the actual value. Therefore, thermal boundary conditions of foundation and backfill must be dealt with in each case on its material properties.

3.4. Thermal Effect of the Foundation

Based on the measured temperature data, the thermal effect of foundation on the backfill was analyzed. Because the results of the three groups have similar effect rules, group III with the highest number of freeze–thaw cycles was selected for analysis. Temperature changes with time at different locations along horizontal direction are shown in Figure 10 and Figure 11. C4 and C3 are located at the depth of 14 cm below surface, and their distance from foundation center is 21 and 14 cm, respectively. From Figure 10, the temperature of C4 and C3 has a similar change in all cycles. C2 is close to the foundation, which suffers more thermal effects of foundation. As shown in Figure 11, the temperature at C2 is always greater than that of C3 and the response to the ambient cycles is more sensitive. Both the temperature amplitudes are small at 10 cycles, and the difference of maximum values is 0.14 °C. In the 30 cycles, the difference of maximum values is 0.17 °C and the difference of minimum values is just 0.06 °C. However, the phase angle is different. The peak temperature of C2 is 0.38 d earlier than C3, but the minimum temperature of C2 and C3 is almost at the same time. In other words, the temperature changes of C2 and C3 are not synchronized. From Figure 12, temperature changes of D2 and D3 show the same variation tendency. It is found that the foundation has little thermal effect on the backfill at the buried depth of 21 cm.
The foundation has a thermal effect on the backfill and nearer backfill is more affected by ambient freeze–thaw cycles. However, the thermal effect is limited along with horizontal and vertical directions. Two reasons contribute to the result. One is the difference of thermal boundary conditions between foundation and backfill, the temperature response of foundation to ambient cycles is more sensitive and the amplitude is greater than that of soil (as shown in Figure 9). The other one is the difference in thermal properties, the foundation has better heat conductivity and lower heat capacity. Therefore, the foundation plays a “heat channel”, which can transfer heat between air and internal backfill. The space and value of the thermal effect is limited but always exist in all cycles. Under freeze–thaw cycles, the active layer adjacent to foundation may be deeper than natural ground. In addition, frost heave and thaw settlement in the space may cause some deformation of the foundation.

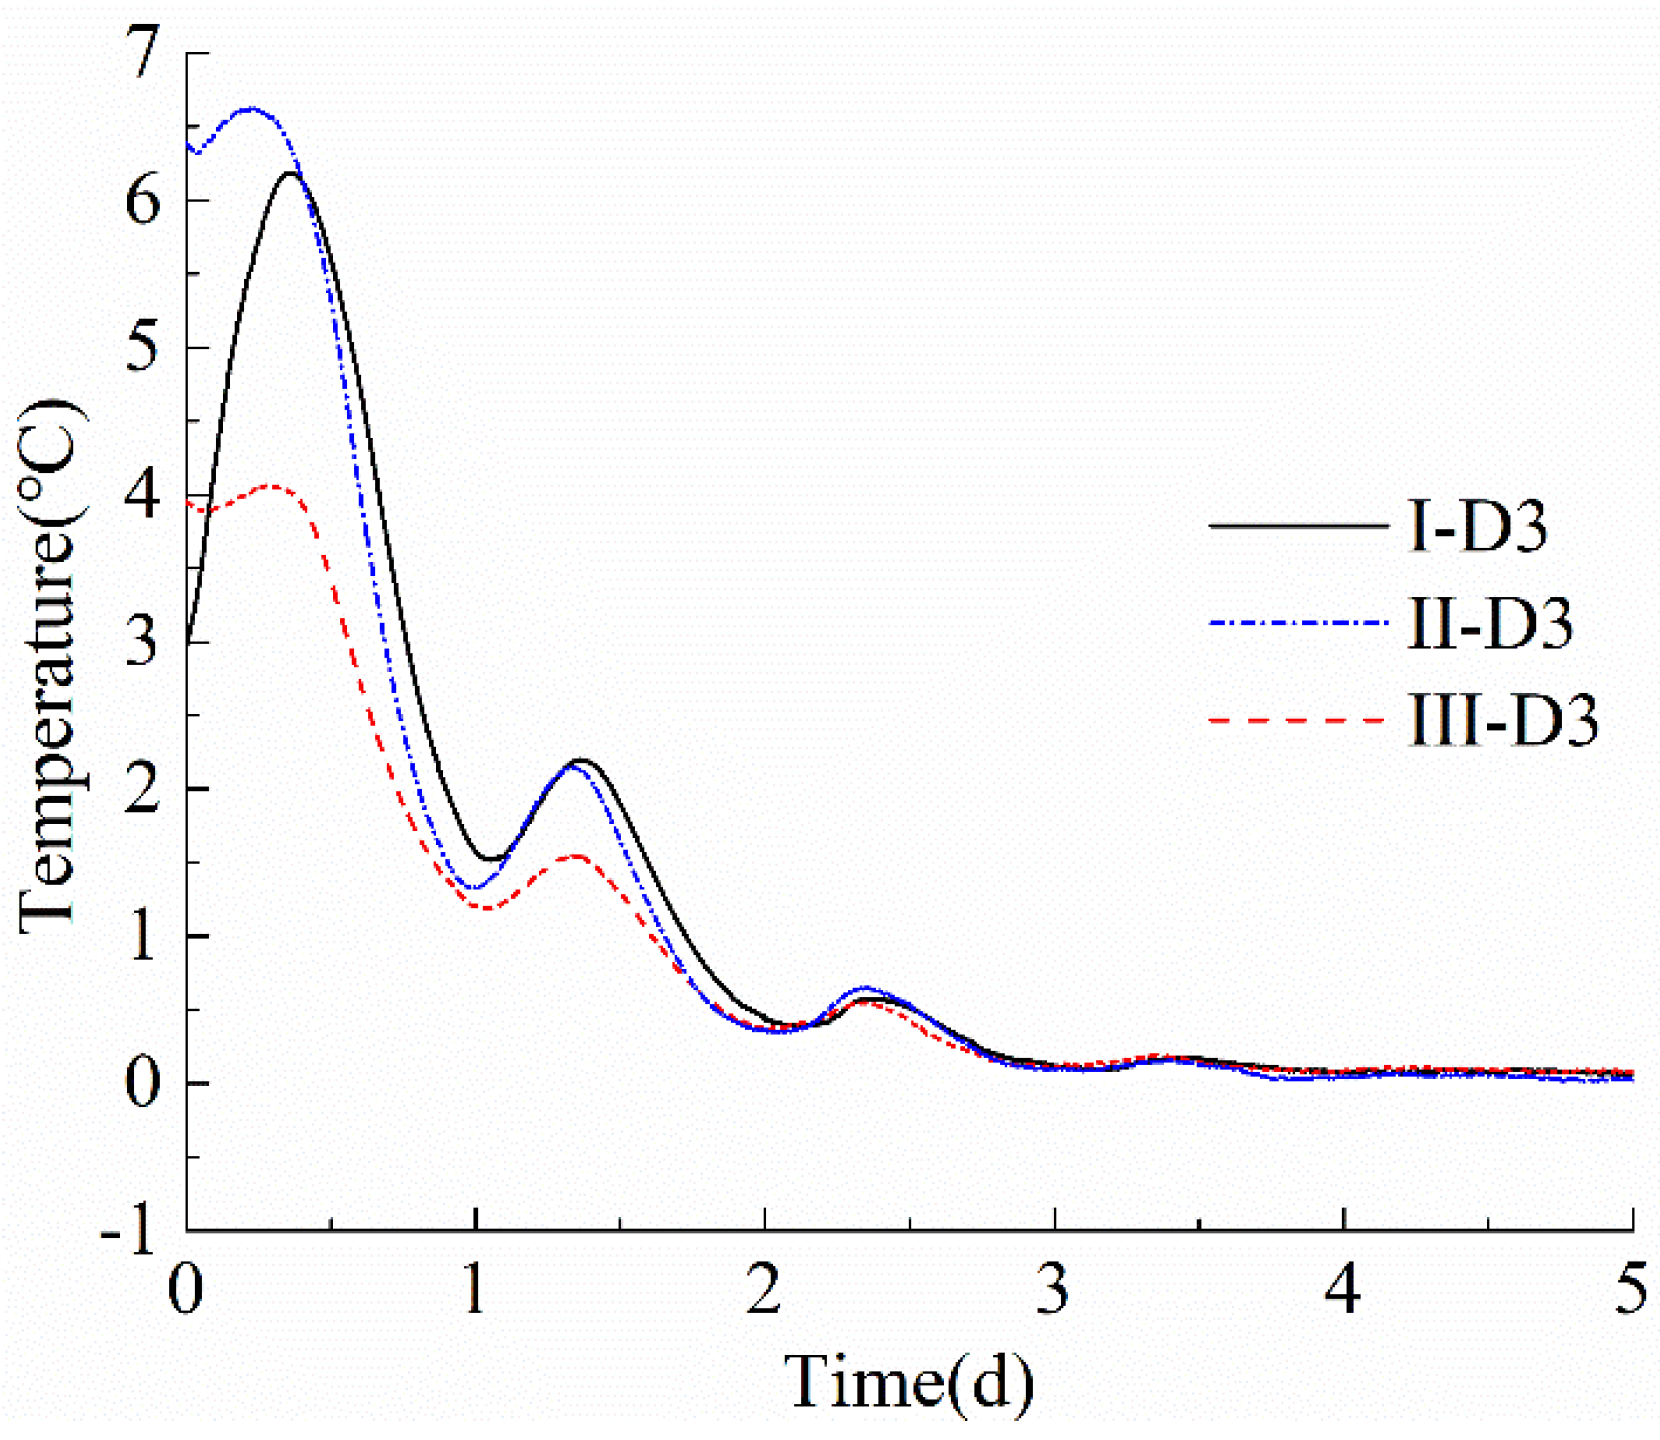
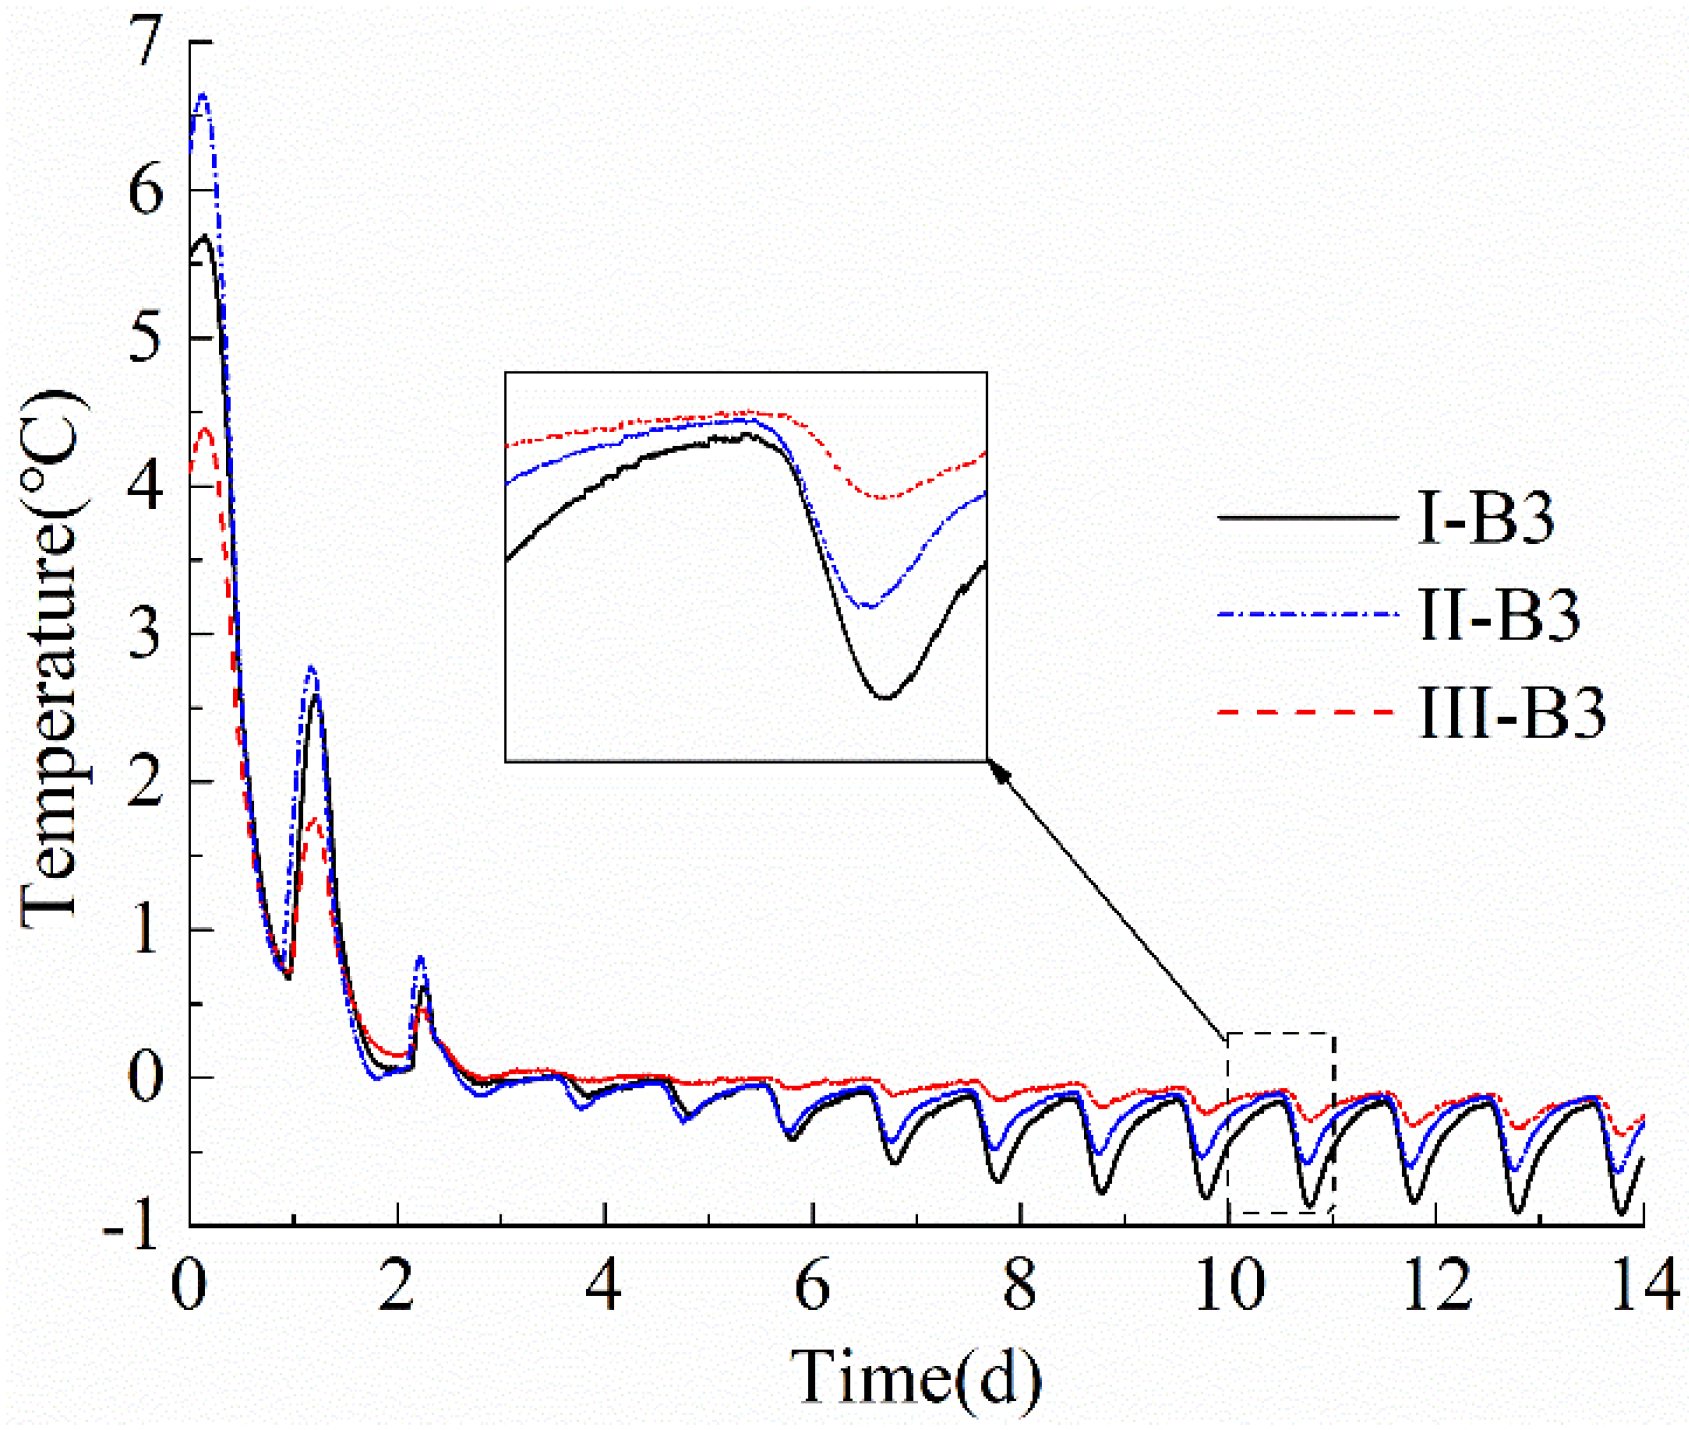
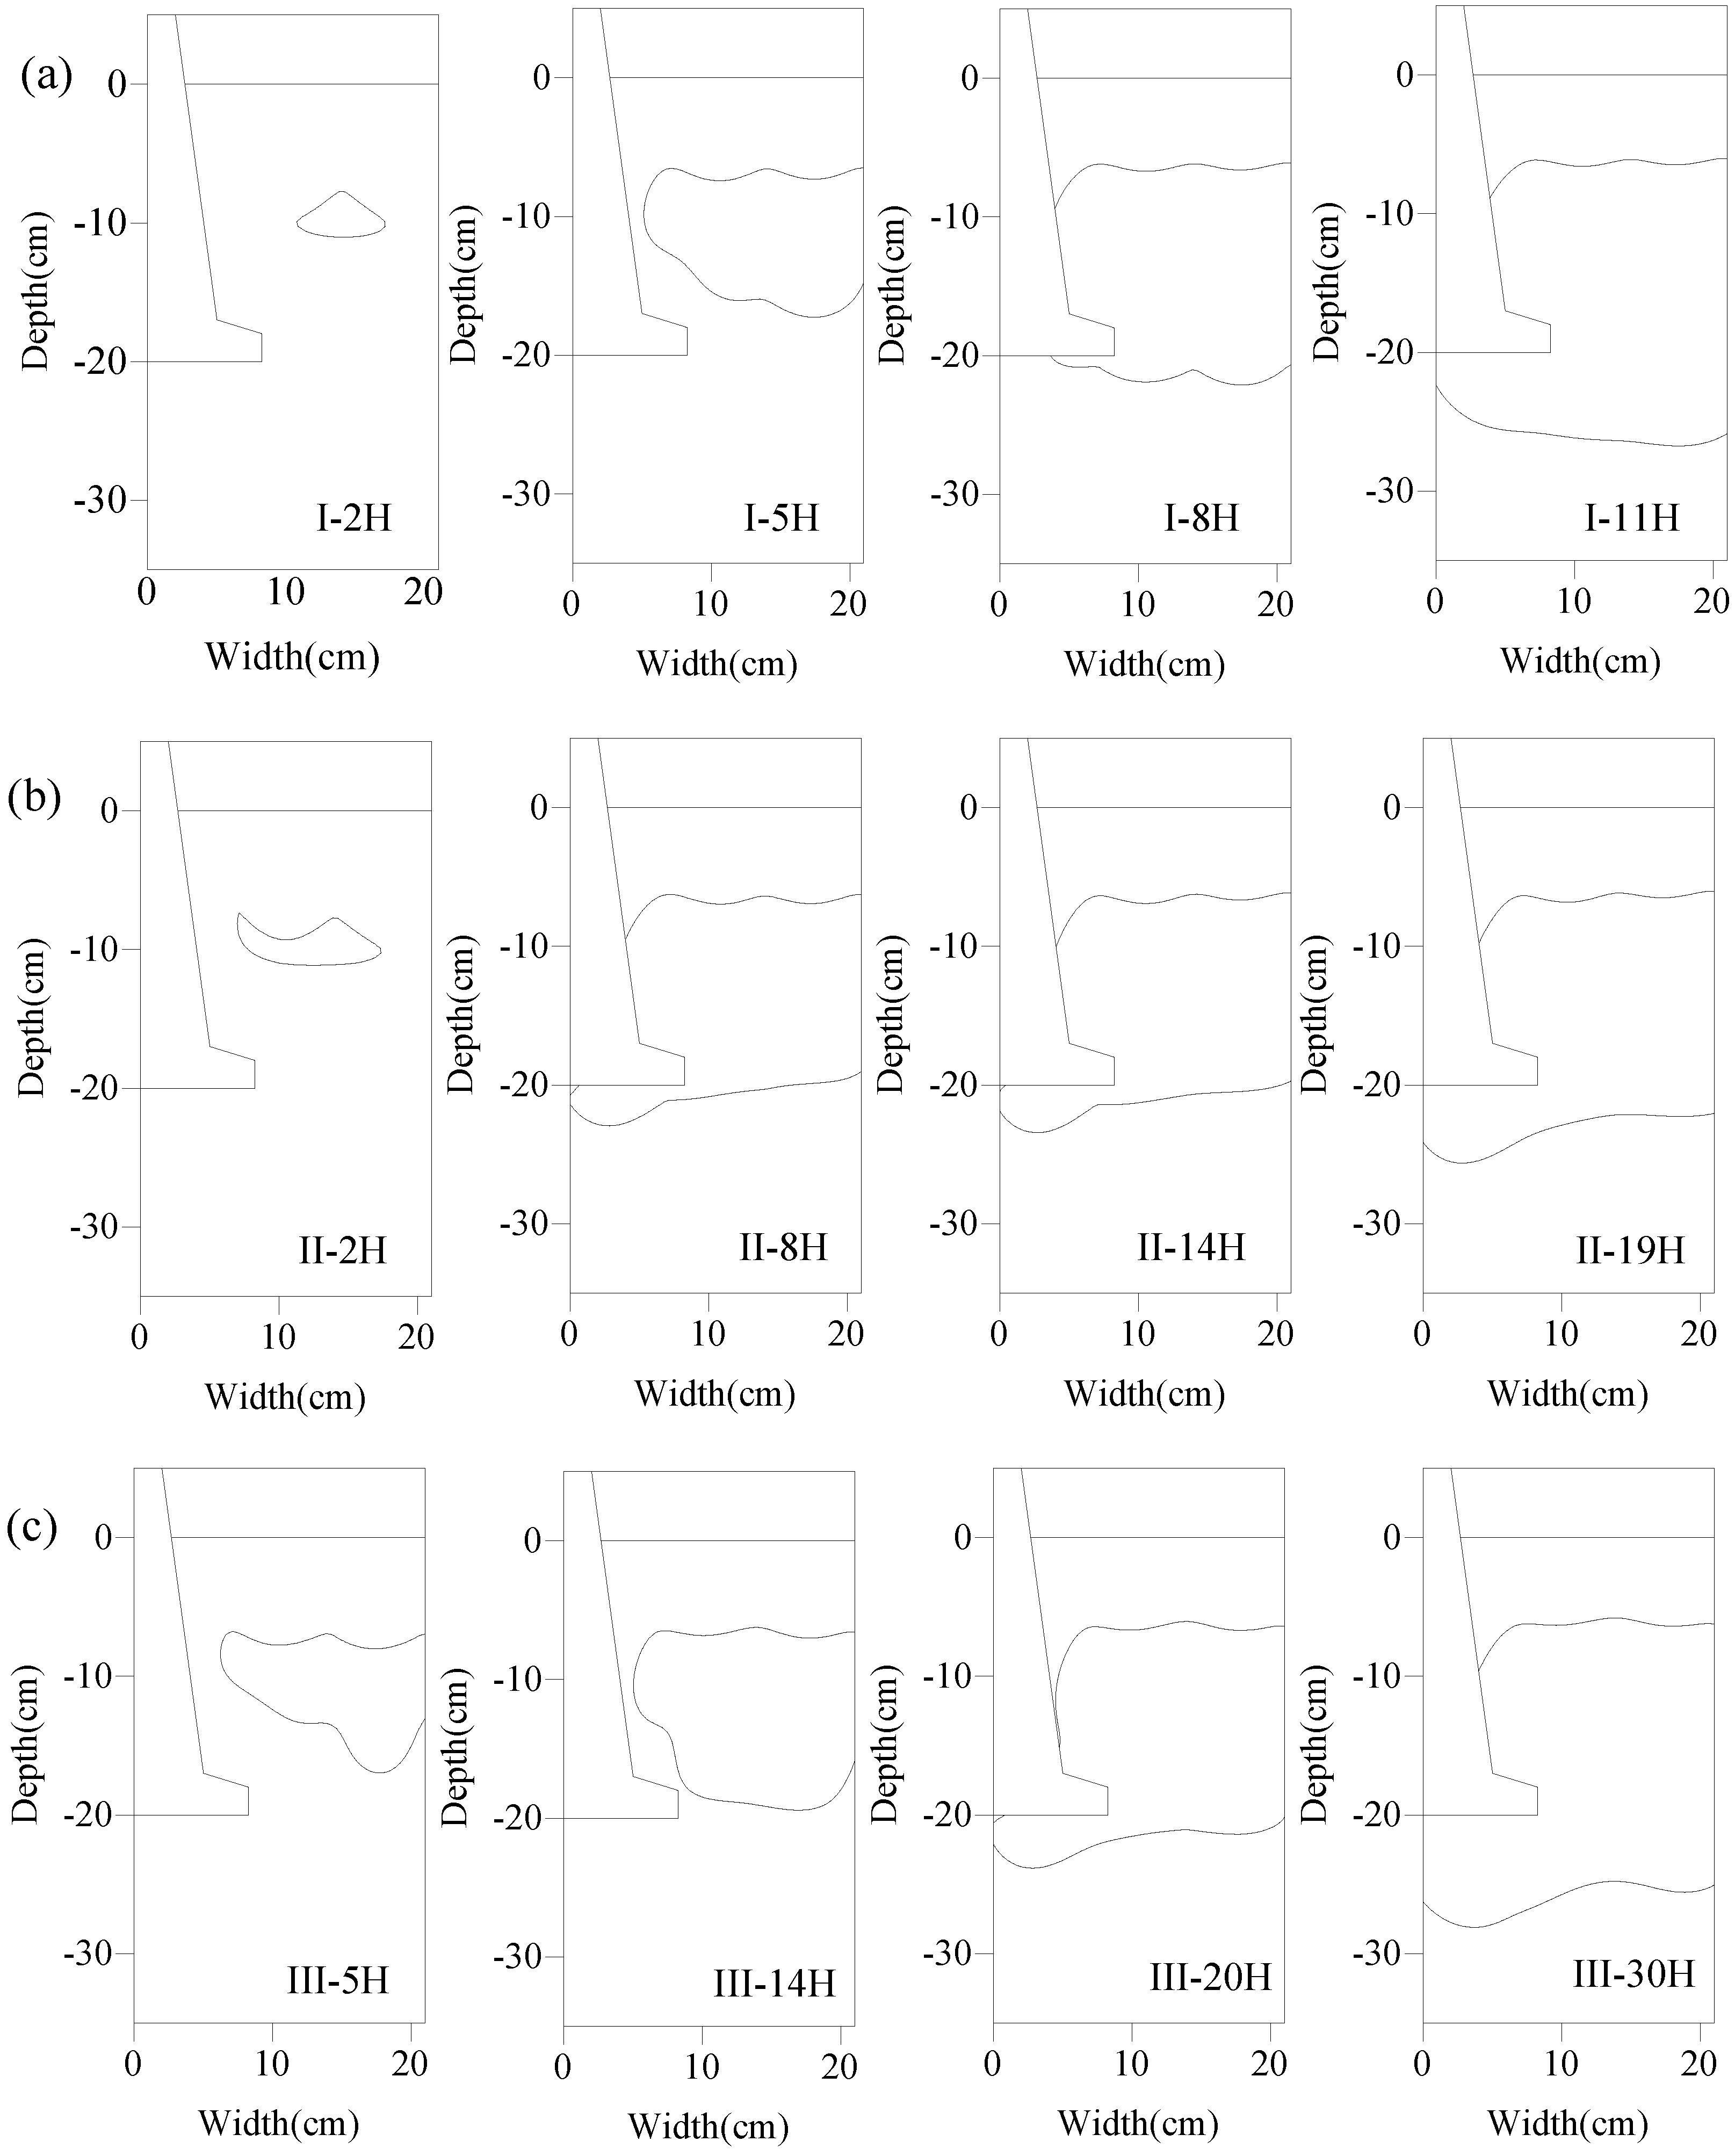
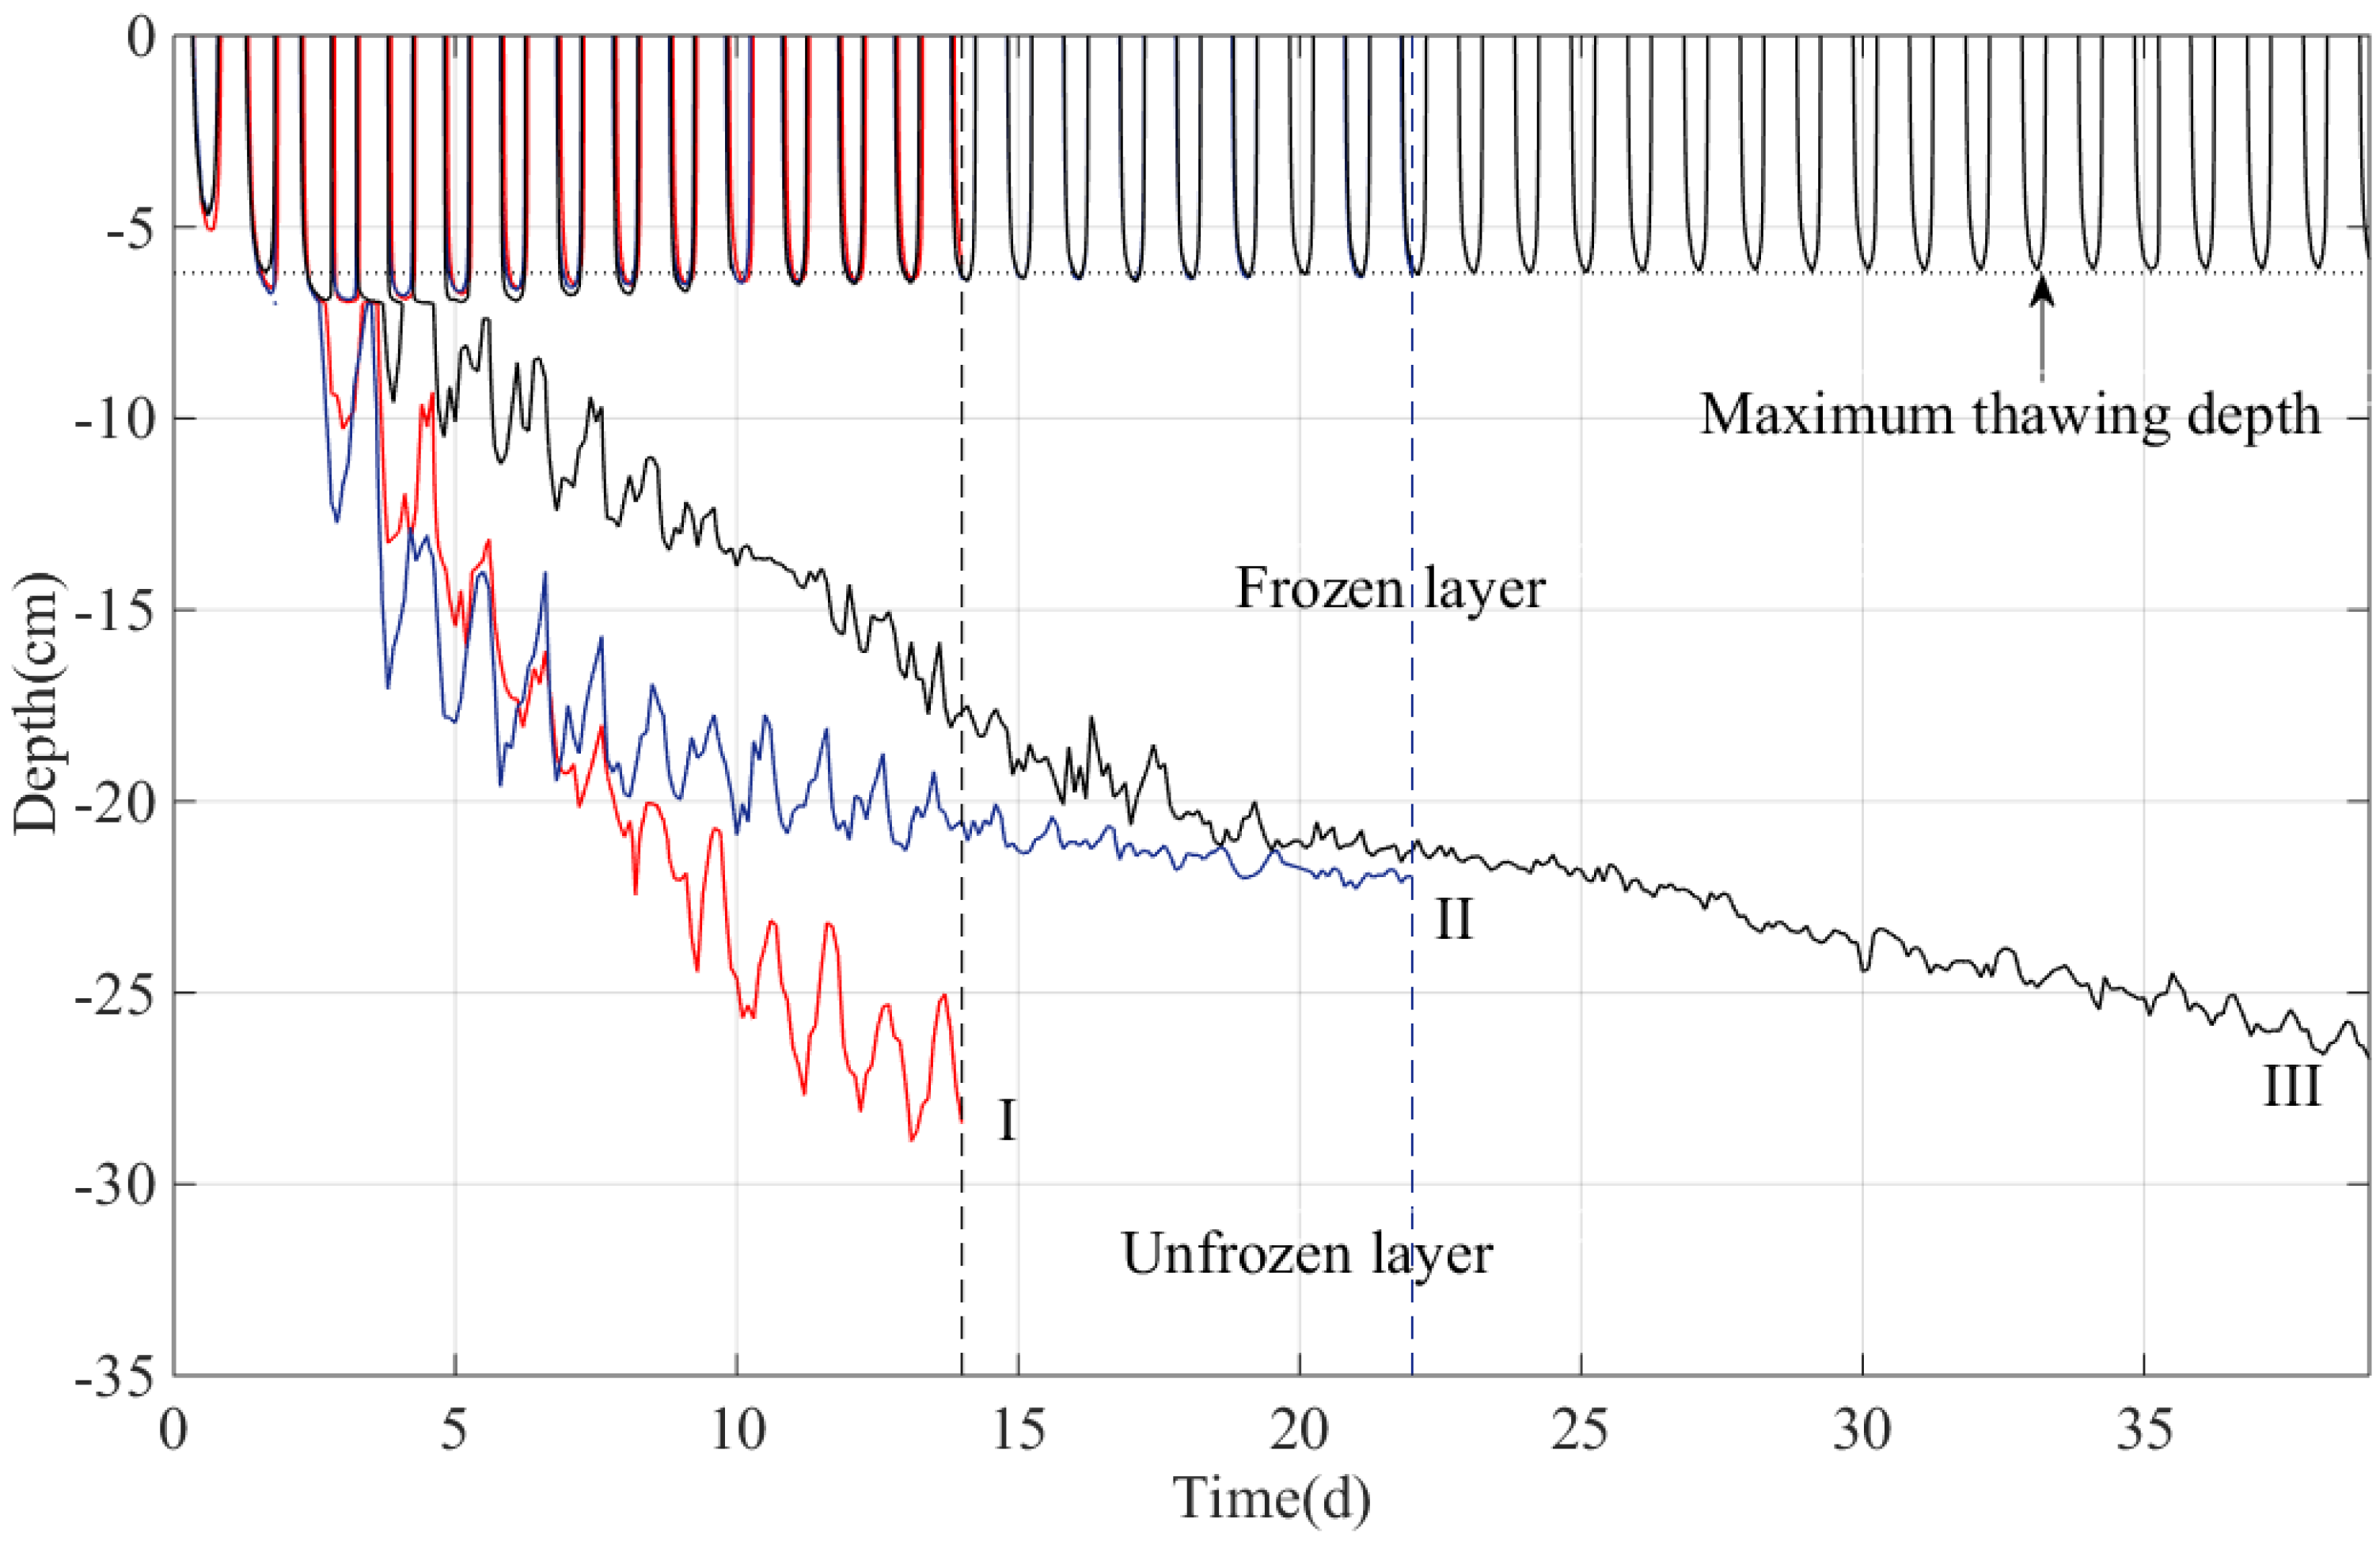
3.5. Refreezing Process of Foundation Backfill

Figure 13 shows the 0 °C level of the backfill at the moment of maximum ambient temperature. It indicates the development of the frozen layer under freeze–thaw cycles. The subgraphs in the figure are represented by group, cycle, and H, where H means the moment of the highest ambient temperature of the corresponding cycle. The foundation has a greater influence on the temperature field of the backfill, which results in the active layer of foundation side being deeper than farther place. The development of the frozen layer is not uniformly thickened, and the frozen area is gradually increasing with cycles. As shown in Figure 13a, a small area of the frozen layer is formed at two cycles; through the first five cycles, the thickness of the frozen layer further increases, but the foundation side is still unfrozen; the area of frozen layer increases and part of foundation is frozen with backfill at the eight cycle; until the 11 cycle, the foundation base is frozen, and the thickness of frozen layer below the base is the thinnest. In the other two groups, the refreezing process is similar to group I. Generally, the refreezing process of backfill is the development of frozen layer. The difference among the three groups is refreezing time, the group of lower density needs more time to refreeze to a certain depth or proportion.
As shown in Figure 10 and Figure 11, the foundation has little thermal effect on the backfill at 14 cm away from the foundation center along horizontal direction, so the horizontal distance can be considered undisturbed by the thermal effect of foundation. Based on the temperature data measured by six sensors at the distance, the change of the frozen layer is analyzed. Frozen depth lines at 0 °C of three groups are overlapped, which indicates the maximum thawing depth and development of the frozen layer, as shown in Figure 14. The average maximum thawing depth of three groups is almost equal, which reaches 6.2 cm. The frozen layer base increases downwards with fluctuation, and the tendency seems to be faster at the first stage and slower at the second stage. The base lines of group I and group II are close before the first seven cycles, and then the base of group I increases faster than group II. The base of group III increases slower than the other groups at the first several cycles, and the increase tendency continues far longer. The base fluctuation amplitudes of group II and group III show a trend of gradual decrease, but the amplitude of group I does not decrease in its experimental cycles.
The thickness and proportion of frozen layer increase with cycles, and foundation has thermal effects on the backfill, which lead to the active layer of foundation side being deeper. The surface of backfill cyclically freezes and thaws under freeze–thaw cycles, but the lower soil has gradually frozen. As the average temperature of ambient cycles is a negative value, the overall effect of freeze–thaw cycles on the lower soil is cooling. The heat dissipation caused by negative ambient temperature leads to the temperature of backfill drop. Therefore, the main reason for refreezing is the freeze–thaw cycles with negative average temperature. The heat property difference of backfill in three groups causes the thickness of frozen layer change with distance along horizontal direction. The foundation side is more affected by freeze–thaw cycles and the depth difference between foundation side and undisturbed backfill is about 3.0 cm. From Figure 14, it is found that the maximum thawing depth is about 6.2 cm. Obviously, the difference in value exceeds 48% and it cannot be ignored in the design stage of foundation. Therefore, the thermal effect of the foundation must be considered. If the thermal effect is ignored and the maximum thawing depth of natural ground is adapted in the design, the tangential frost heave force may be more than expected. Furthermore, the stability of the foundation will be threatened.
In permafrost regions, the bearing capacity of the foundation mainly depends on the adfreezing force, so the foundation backfill should be frozen in the shortest possible time. As shown in Figure 14, the developing rates of the frozen layer are different, and the bases of the frozen layer deepen with fluctuation. In other words, the lower soil is gradually frozen with freezing and thawing. Once the lower backfill is frozen and no longer thawed, it can be considered that the refreezing process has been completed. Based on this standard, the group I, group II and group III need 7.7, 13.6, and 17.7 days to refreeze to the depth of 20.0 cm, respectively. Group III (1.36 g/cm3) needs more time to refreeze than the other groups. Within the depth of 15 cm, group I and group II almost need the same time, which means that both the degrees of compaction density are allowed in the depth range. The shallow foundation is constructed by open excavation in permafrost regions, so the depth of the pit is also an important factor to design the backfill density under conditions of difficult compaction.

4. Discussion

From the above experimental results, the effect of backfill density on foundation refreezing cannot be ignored. Under the three backfill density conditions, the greater the backfill density, the faster the refreezing speed and the greater the depth of refreezing. The depth of refreezing of the three groups of model tests reaches the foundation depth at 7.5, 13.5, and 17.5 d, respectively, and the maximum refreezing depth is also proportional to the density of the backfill.
The main factor that affects the speed of refreezing is the thermal parameters of soil with different densities (Table 3), and the thermal parameters of soil mainly depend on soil particles and the content of water in the soil. Under the three density conditions, the higher the density, the more soil particles per unit volume, and the lower the water content. Taking the clay selected in the test as an example, as the density of the backfill increases, the thermal conductivity increases gradually (Figure 15). Therefore, the model test with high backfill density has a shorter refreezing time and a larger refreezing depth. From the perspective of the model test, this paper demonstrates the importance of controlling the density of backfill in the construction of pile foundations in permafrost regions.
To reduce the disturbance of the foundation construction to the permafrost, the principles of “winter construction” and “rapid construction” are usually adopted in practical projects to protect the permafrost to the greatest extent [31]. However, during construction in winter, it is difficult to avoid the existence of frozen soil blocks in the soil. The existence of frozen soil blocks makes it difficult to obtain a high density of backfill, which in turn affects the process of freeze and the safety of the foundation, especially the refreezing time and foundation settlement. Due to the insufficiency of the experiments in this paper, the effect of frozen soil blocks on the refreezing of backfill needs further research. In particular, the effect of water in the pores of backfill on the process of refreezing.

5. Conclusions

According to the test results and analysis, some conclusions are drawn.
(1) The effects of different backfill densities on the backfill refreezing process exist and are different. The backfill temperature with higher density is more sensitive to the ambient temperature, which needs shorter time to refreeze to a certain depth or proportion. Controlling the degree of compaction of the backfill during the construction of the tower foundation of the transmission line in the permafrost region is beneficial to speed up the refreezing process;
(2) The foundation has a thermal effect on the backfill and foundation plays a “heat channel”, which can transfer heat between air and inside backfill. The foundation side is more affected by freeze–thaw cycles, and the influence cannot be ignored in the practice. If the thermal effect is ignored and the maximum thawing depth of natural ground is adapted in the design, the tangential frost heave force may be more than expected; and
(3) Thermal boundary conditions of foundation and backfill are different. It is found that the difference always exists in all cycles. Different boundary conditions should be set for the surface of the pile foundation and the soil surface during numerical simulation. If the same boundary conditions are used for the soil surface and the pile surface, the calculation results will be deviated from reality.

Author Contributions

Conceptualization, writing—original draft preparation, J.Z.; visualization, data curation, C.Z.; funding acquisition, writing—review and editing, Z.Z.; supervision, A.M.; software, D.J.; resources, S.Z. All authors have read and agreed to the published version of the manuscript.

Funding

This research was supported by the SAFEA: High-End Foreign Experts Project (G2021131003L), the Science and Technology Project of Heilongjiang Transportation Investment Group (JT-100000-ZC-FW-2021-0129), and Russian Foundation for Basic Research: RFBR-NSFC project (20-55-53006).

Institutional Review Board Statement

Not applicable.

Informed Consent Statement

Not applicable.

Data Availability Statement

The data presented in this study are available on request from the corresponding author.

Conflicts of Interest

The authors declare no conflict of interest. The funders had no role in the design of the study; in the collection, analyses or interpretation of data; in the writing of the manuscript; or in the decision to publish the results.

References

  1. Qi, J.L.; Ma, W. State-of-art of research on mechanical properties of frozen soils. Rock Soil Mech. 2010, 31, 133–143. [Google Scholar]
  2. Wu, Y.P.; Guo, C.X.; Pan, W.D.; Zhao, S.Y.; Zhang, L.X. Influences of refreezing process of ground on bearing capacity of single pile and bridge construction in permafrost. Chin. J. Rock Mech. Eng. 2004, 23, 4229–4233. [Google Scholar]
  3. Wang, X.; Jiang, D.J.; Zhao, X.Y.; Liu, D.R. Experimental study on bearing features of bored pile under non-refreezing condition in permafrost region. Chin. J. Rock Mech. Eng. 2005, 27, 81–84. [Google Scholar]
  4. Shang, Y.H.; Niu, F.J.; Wu, X.Y.; Liu, M.H. A novel refrigerant system to reduce refreezing time of cast-in-place pile foundation in permafrost regions. Appl. Therm. Eng. 2018, 128, 1151–1158. [Google Scholar] [CrossRef]
  5. Yu, Q.H.; Wen, Z.; Ding, Y.S.; Wang, G.S.; Li, G.Y.; Zhang, J.M. Monitoring the Tower Foundations in the Permafrost Regions along the Qinghai-Tibet DC Transmission Line from Qinghai Province to Tibetan Autonomous Region. J. Glaciol. Geocryol. 2012, 34, 1165–1172. [Google Scholar]
  6. Ran, Y.H.; Li, X.; Cheng, G.D.; Nan, Z.T.; Che, J.X.; Sheng, Y.; Wu, Q.B.; Jin, H.J.; Luo, D.L.; Tang, Z.G.; et al. Mapping the permafrost stability on the Tibetan Plateau for 2005–2015. Sci. China-Earth Sci. 2021, 1, 62–79. [Google Scholar] [CrossRef]
  7. Verma, A.K.; Joshi, R.K. Uplift load carrying capacity of piles in sand. In Proceedings of the Indian Geotechnical Conference, Mumbai, India, 16–18 December 2010. [Google Scholar]
  8. Liu, G.; Zhang, Z.; Cui, Q. Uplift Behavior of Belled Piles Subjected to Static Loading. Arab. J. Sci. Eng. 2021, 46, 4369–4385. [Google Scholar] [CrossRef]
  9. Lutenegger, A.J. Uplift tests on shallow cast-in-place enlarged base pedestal foundations in clay. In Proceedings of the American Society of Civil Engineers IFCEE 2015—San Antonio, San Antonio, TX, USA, 17–21 March 2015. [Google Scholar]
  10. Honda, T.; Hirai, Y.; Sato, E. Uplift capacity of belled and multibelled piles in dense sand. Soils Found. 2011, 51, 483–496. [Google Scholar] [CrossRef] [Green Version]
  11. Ilamparuthi, K.; Dickin, E. The influence of soil reinforcement on the uplift behaviour of belled piles embedded in sand. Geotext. Geomembr. 2001, 19, 1–22. [Google Scholar] [CrossRef]
  12. Guo, L. Study on the Displacement Characteristics of Tower Foundations in Permafrost Regions and the Improvement. Ph.D. Thesis, Cold and Arid Regions Environmental and Engineering Research Institute, Chinese Academy of Sciences, Beijing, China, 2016. [Google Scholar]
  13. Zhang, J.M.; Ruan, G.F.; Su, K. Estimation on settlement of precast tower footings along the Qinghai–Tibet Power Transmission Line in warm permafrost regions. Cold Reg. Sci. Technol. 2016, 121, 275–281. [Google Scholar] [CrossRef]
  14. Wang, T.; Zhou, G.Q.; Wang, J.Z. Stochastic Thermal-Mechanical Characteristics of Frozen Soil Foundation for a Transmission Line Tower in Permafrost Regions. Int. J. Geomech. 2018, 18, 88–91. [Google Scholar] [CrossRef]
  15. Shi, X.Y.; Zhang, Z.; Li, D.Q.; Zhang, Z.Q. Model Test Study on Refreezing Process of Backfill in Cone-cylindrical Pile Foundation Pit. J. Hunan Univ. (Nat. Sci.) 2018, 45, 125–134. [Google Scholar]
  16. Shi, X.Y.; Zhang, Z.; Li, D.Q.; Zhou, P.F.; Feng, W.J. Research on dynamic variation of moisture, temperature and deformation of cone-cylindrical pile under freeze–thaw cycles. Chin. J. Geotech. Eng. 2019, 38, 3092–3101. [Google Scholar]
  17. You, Y.H.; Yu, Q.H.; Guo, L.; Wang, X.B.; Hu, J.; Qian, J.; Zhang, H. In-situ monitoring the thermal regime of foundation backfill of a power transmission line tower in permafrost regions on the Qinghai-Tibet Plateau. Appl. Therm. Eng. 2016, 98, 271–279. [Google Scholar] [CrossRef]
  18. Xie, Y.L.; Yu, Q.H.; You, Y.H.; Zhang, Z.Q.; Gou, T.T. The changing process and trend of ground temperature around tower foundations of Qinghai-Tibet Power Transmission line. Sci. Cold Arid. Reg. 2019, 11, 13–20. [Google Scholar]
  19. Li, G.Y.; Yu, Q.H.; Ma, W.; Chen, Z.Y.; Mu, Y.H.; Guo, L.; Wang, F. Freeze–thaw properties and long-term thermal stability of the unprotected tower foundation soils in permafrost regions along the Qinghai-Tibet Power Transmission Line. Cold Reg. Sci. Technol. 2016, 121, 226–236. [Google Scholar] [CrossRef]
  20. Mu, Y.H.; Li, G.Y.; Yu, Q.H.; Ma, W.; Wang, D.Y.; Wang, F. Numerical study of long-term cooling effects of thermosyphons around tower footings in permafrost regions along the Qinghai-Tibet Power Transmission Line. Cold Reg. Sci. Technol. 2016, 121, 237–246. [Google Scholar] [CrossRef]
  21. Yu, Q.H.; Zhang, Z.Q.; Wang, G.S.; Guo, L.; Wang, X.B.; Wang, P.F.; Bao, Z.H. Analysis of tower foundation stability along the Qinghai–Tibet Power Transmission Line and impact of the route on the permafrost. Cold Reg. Sci. Technol. 2016, 121, 205–213. [Google Scholar] [CrossRef]
  22. Guo, L.; Yu, Q.H.; You, Y.H.; Wang, X.B.; Yuan, C.; Li, X.N. Evaluation on the influences of lakes on the thermal regimes of nearby tower foundations along the Qinghai-Tibet Power Transmission Line. Appl. Therm. Eng. 2016, 102, 829–840. [Google Scholar] [CrossRef]
  23. Guo, L.; You, Y.; Yu, Q.; Shi, Z.; Li, H.; Wang, X. Field investigation on the influence of periglacial processes on pile foundations on the Qinghai–Tibet plateau. Permafr. Periglac. Process. 2021, 32, 335–348. [Google Scholar] [CrossRef]
  24. Khosravani, M.R.; Weinberg, K. Experimental investigations of the environmental effects on stability and integrity of composite sandwich T-joints [Experimentelle Untersuchung des Umwelteinflusses auf die Belastbarkeit von T-Stößen in Sandwich-Platten]. Mater. Werkst. 2017, 48, 753–759. [Google Scholar] [CrossRef]
  25. Zhang, W.; Liu, Y.Z.; Wu, M.Q. Theory and experiment of nonlinear vibrations and dynamic snap-through phenomena for bi-stable asymmetric laminated composite square panels under foundation excitation. Compos. Struct. 2019, 225, 111140. [Google Scholar] [CrossRef]
  26. Yu, Q.; Ji, Y.; Zhang, Z.; Wen, Z.; Feng, C. Design and research of high voltage transmission lines on the Qinghai–Tibet Plateau—A Special Issue on the Permafrost Power Lines. Cold Reg. Sci. Technol. 2016, 121, 179–186. [Google Scholar] [CrossRef]
  27. Guo, L.; Zhang, Z.Q.; Wang, X.B.; Yu, Q.H.; You, Y.H.; Yuan, C.; Gou, T.T. Stability analysis of transmission tower foundations in permafrost equipped with thermosiphons and vegetation cover on the Qinghai-Tibet Plateau. Int. J. Heat Mass Transf. 2018, 121, 367–376. [Google Scholar] [CrossRef]
  28. Zhu, L.N.; Li, D.Q.; Guo, X.M. Simulitude Analysis of Modeling Test for Chargeless Pressure in the Freezing-thawing Process of soil. J. Glaciol. Geocryol. 1993, 15, 166–169. [Google Scholar]
  29. Zhu, L.N. Study of the adherent layer on different types of ground in permafrost 10 regions on the Qinghai–Xizang Plateau. J. Glaciol. Geocryol. 1988, 10, 8–14. [Google Scholar]
  30. Xu, X.Z.; Wang, J.C.; Zhang, L.X. Physics of Frozen Soil; Science Press: Beijing, China, 2010. [Google Scholar]
  31. Wang, G.H.; Yu, Q.H.; Guo, L.; You, Y.H.; Wang, S.J.; Yu, Y. Prevention and control of freezing and thawing disasters electric transmission lines constructed in permafrost regions. J. Glaciol. Geocryol. 2014, 36, 137–143. [Google Scholar]
Figure 1. The construction process of tower foundation of the transmission line in permafrost regions: (a) foundation excavation; (b) pile foundation installation; (c) backfilling [21,26,27].
Energies 15 02329 g001
Figure 2. Picture of the foundation model and backfill.
Energies 15 02329 g002
Figure 3. Grain composition of backfill.
Energies 15 02329 g003
Figure 4. Schematic diagram of the temperature sensor layout of the model test.
Energies 15 02329 g004
Figure 5. Temperature variation with time in a freeze–thaw cycle.
Energies 15 02329 g005
Figure 6. Temperature variation with time of first 5 freeze–thaw cycles at D3.
Energies 15 02329 g006
Figure 7. Temperature curves with time at different depth in Group II. The three colored lines represent the temperatures at the three depths of the same model.
Energies 15 02329 g007
Figure 8. Temperature curves with time at B3 position in different groups.
Energies 15 02329 g008
Figure 9. Temperature change with time of soil surface and foundation top. The red line represents the temperature of the pile foundation surface. This figure is a comparison of the pile surface and soil surface temperatures during the model test period.
Energies 15 02329 g009
Figure 10. Temperature variations with time at C3 and C4 in Group III.
Energies 15 02329 g010
Figure 11. Temperature variations with time at C2 and C3 in Group III.
Energies 15 02329 g011
Figure 12. Temperature variations with time at D2 and D3 in Group III.
Energies 15 02329 g012
Figure 13. Temperature regime (0 °C) of foundation backfill at the highest air temperature. The area enclosed by the black line is the freezing zone at the highest temperature in each freeze–thaw cycle.
Energies 15 02329 g013
Figure 14. Change of frozen layer with time in 3 groups. The lines in the three colors are the soils of the three densities, and the curves that develop along the depth over time are the freezing depths of the three models. The lines in the three colors are the soils of the three densities, and the curves that develop along the depth over time are the freezing depths of the three models. The depth above the curve is the frozen area, and the depth below the curve is the unfrozen area.
Energies 15 02329 g014
Figure 15. The relationship between soil density and thermal conductivity.
Energies 15 02329 g015
Table 1. The density, initial water content, and times of freeze–thaw cycle in 3 groups.
Group ρ d   ( g / cm 3 ) Times of Freeze–Thaw CycleInitial Water Content (%)
I1.831415
II1.622215
III1.363915
Table 2. Initial temperature of backfill in different groups (unit: °C). The temperature in the table is measured by the sensors to evaluate the initial temperature of the model.
Group/LocationB3C3D3E3F3Average Value
I5.594.382.982.352.103.48
II6.266.266.396.365.976.25
III4.103.973.953.983.893.98
Table 3. Thermal parameters of soil.
Group/Parameter λ u /
W/(m K)
λ f /
W/(m K)
C u /
kJ/(m3 K)
C f /
kJ/(m3 K)
I1.601.822634.72032.5
II1.281.452341.91806.6
III0.921.242166.31639.3
Publisher’s Note: MDPI stays neutral with regard to jurisdictional claims in published maps and institutional affiliations.

