Abstract
In the chemical and petroleum industry, the axial flow pump is widely used for the circulation pipeline system, and most of the transportation mediums are the shear-thinning non-Newtonian fluids. However, previous investigations on axial flow pumps are focused on water, which leads to a considerable deviation between the actual application and the research finding. In this work, shear-thinning non-Newtonian fluid (CMC solution) and viscous Newtonian fluid (the viscosity equals the apparent viscosity of CMC solution as the flow index is 1) are selected as the working medium. Based on the research output, lower apparent viscosity occurs in the near-wall and rotor–stator interaction region due to the larger velocity gradient. The shear-thinning property results in an increased tip leakage flow rate, and a sharp decline in friction loss. Compared to the viscous Newtonian fluid, the head and efficiency of the pump improves substantially for the shear-thinning fluid. The discrepancy is observed to increase with a higher flow rate. The comprehensive analysis of flow field and energy performance reveals that friction loss is still the main part of the total loss in the shear-thinning fluid.
1. Introduction
The vane pump is the core component of the circulation pipeline system in the chemical [1,2], petroleum [3,4], and food processing industries [5]. Therefore, the pump performance has a great impact on the safety and operation efficiency of the transportation pipeline system [6,7]. To improve the pump performance, numerous studies have been conducted to understand the flow mechanism under pure water conditions. Based on an in-depth understanding of the internal flow mechanism, the design of the axial flow pump was improved and the pump efficiency was raised to 86% [8], which is close to the theoretical efficiency limit.
In fact, most of the transportation mediums encountered in the chemical and petroleum industries exhibit non-Newtonian characteristics, especially shear-thinning properties [9,10]. Previously, the investigations about the mechanism of shear-thinning fluid flow were mainly carried out on simple structures, such as the bubble column [11,12], pipeline [13,14] and so on. In recent years, more attention has been paid to the flow characteristics in rotating machinery, but the majority of research is about stirred tanks [15,16]. Based on the experimental and simulation methods, the energy consumption and velocity distribution under shear-thinning conditions were presented [17,18]. However, the effect of shear-thinning properties on the flow characteristics was not revealed in depth. Furthermore, under Newtonian fluid (water and glycerin solution) and shear-thinning fluid conditions, a comparative analysis of stirred tanks’ flow characteristics has been conducted [19,20]. The results showed that both rheological properties and apparent viscosity distribution can influence the flow pattern, the circulation intensity, and the turbulent kinetic energy generation rate, and these will lead to a difference in the energy dissipation rate of various solutions.
Notably, one particular issue in vane pumps that needs to be examined is the rotor–stator interaction [21,22,23], and this does not exist in stirred tanks. In the interaction region, the shear flow has a great impact on the distribution of apparent viscosity. In recent years, some investigations have been conducted on centrifugal pumps. Aldi et al. [24] numerically studied the pump’s performance under both shear-thinning non-Newtonian fluid and Newtonian fluid (water) conditions, and the results showed that the pump’s head is reduced by two thirds when transporting shear-thinning fluid in comparison to water. Donmez et al. [25] also conducted a comparative study between the two conditions regarding the pump’s performance and apparent viscosity variation. However, it is important to note that the Newtonian fluid employed in the above investigations is water. Even if the fluid viscosity is influenced by the shearing action, there is still a great difference between the viscosities of water and shear-shinning fluid. It is well known that, compared with water conditions, the performance of vane pumps is greatly reduced when transporting viscous Newtonian fluids [26,27,28]. Therefore, it is difficult to decide whether the deterioration of performance is caused by the shear-thinning property from the above comparison method. Therefore, Valdés et al. [29] investigated centrifugal pumps’ performance using viscous Newtonian and shear-thinning fluids, and the performance deterioration was explained by the apparent viscosity variation. Nevertheless, an unreasonable aspect still exists, i.e., the densities of the adopted mediums are different.
In this paper, the effect of shear-thinning properties on the transportation characteristics in an axial pump is investigated. In our analysis, particular attention will be paid to the rotor–stator interaction. The employed viscous Newtonian fluid has the same density with the shear-thinning fluid, and its viscosity is equal to the apparent viscosity of shear-thinning fluid with a flow index of 1. By this way, we aim to provide an in-depth and more objective understanding of the effect of shear-thinning property, which may help to improve the pump design in actual medium conditions.
2. Experimental Setup and Numerical Methods
2.1. Experimental Setup
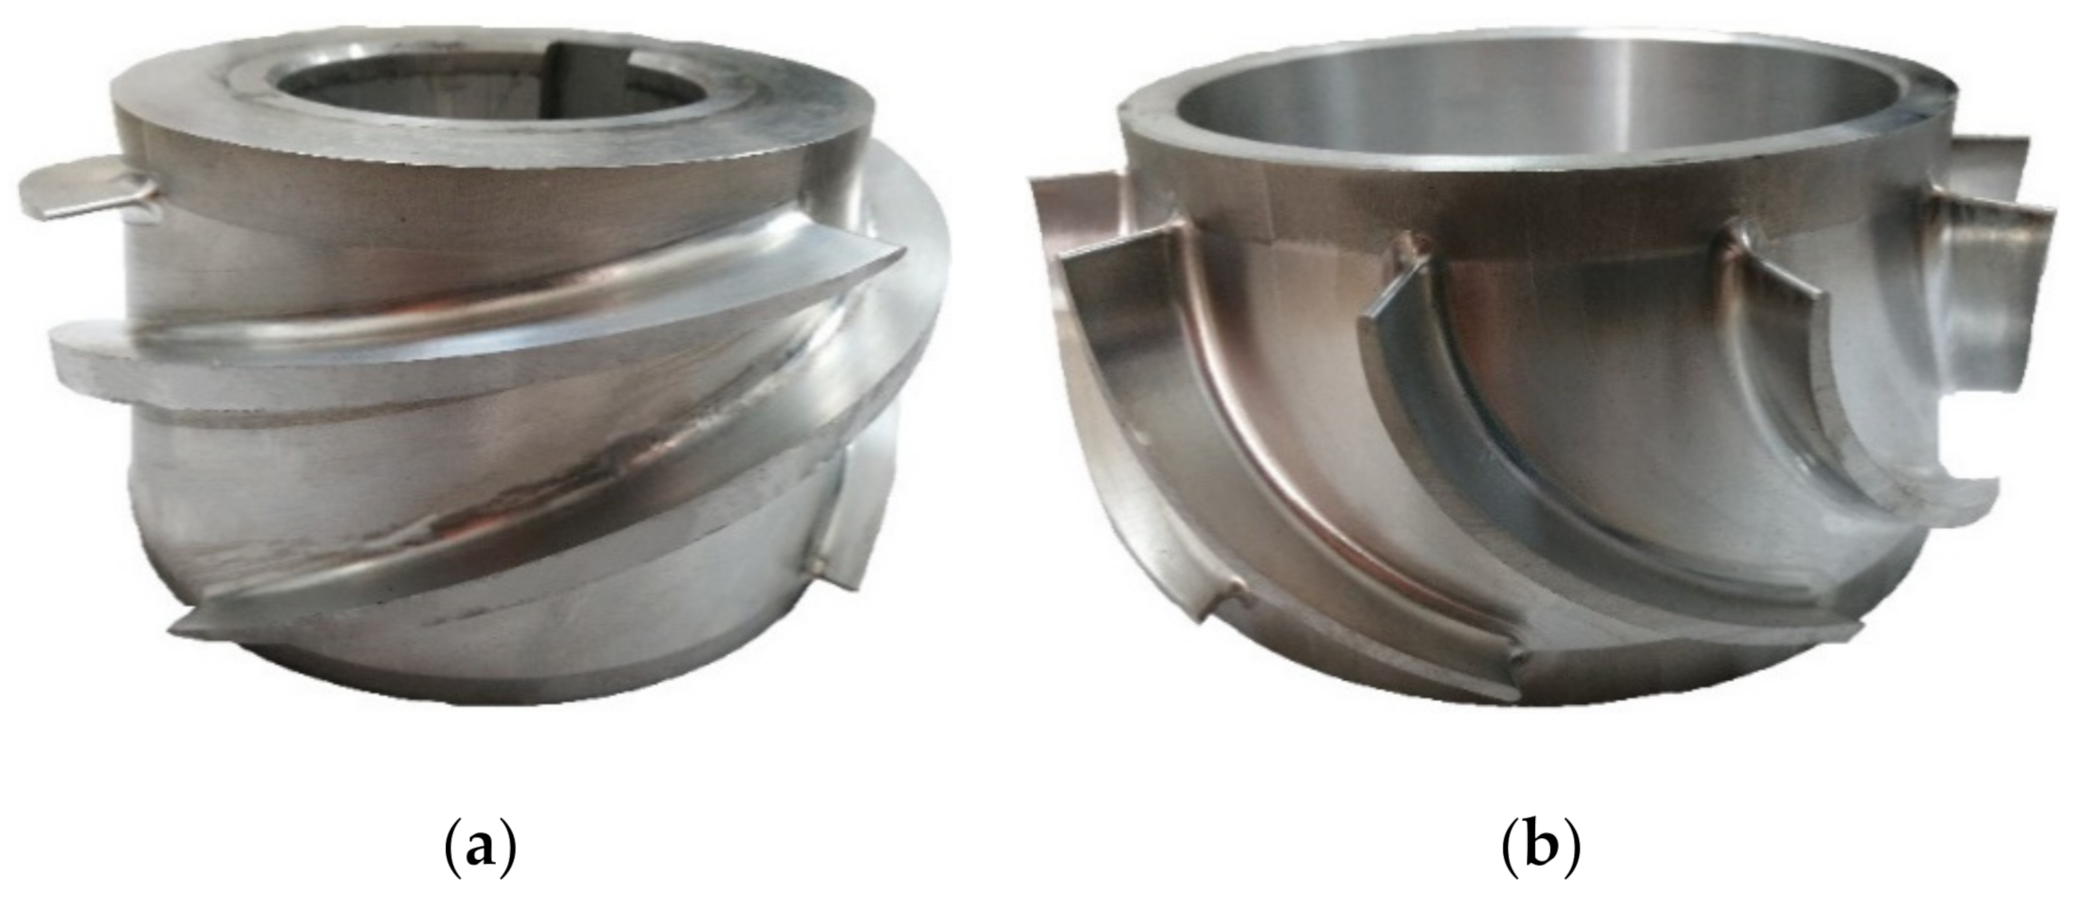
In this work, the self-designed axial flow pump is used, which has also been used for the analysis of Newtonian pure water flow and air-water two-phase flow [1,22,30]. This way, a more comprehensive study will be performed in the near future. The design head (H) and flow rate (Qd) of this pump are 15 m and 50 m3/h, respectively. Other design parameters are displayed in Table 1. The impeller and the guide vane of the test pump are shown in Figure 1.

Table 1.
Parameters of the pump.

Figure 1.
Test pump: (a) impeller, (b) guide vane.
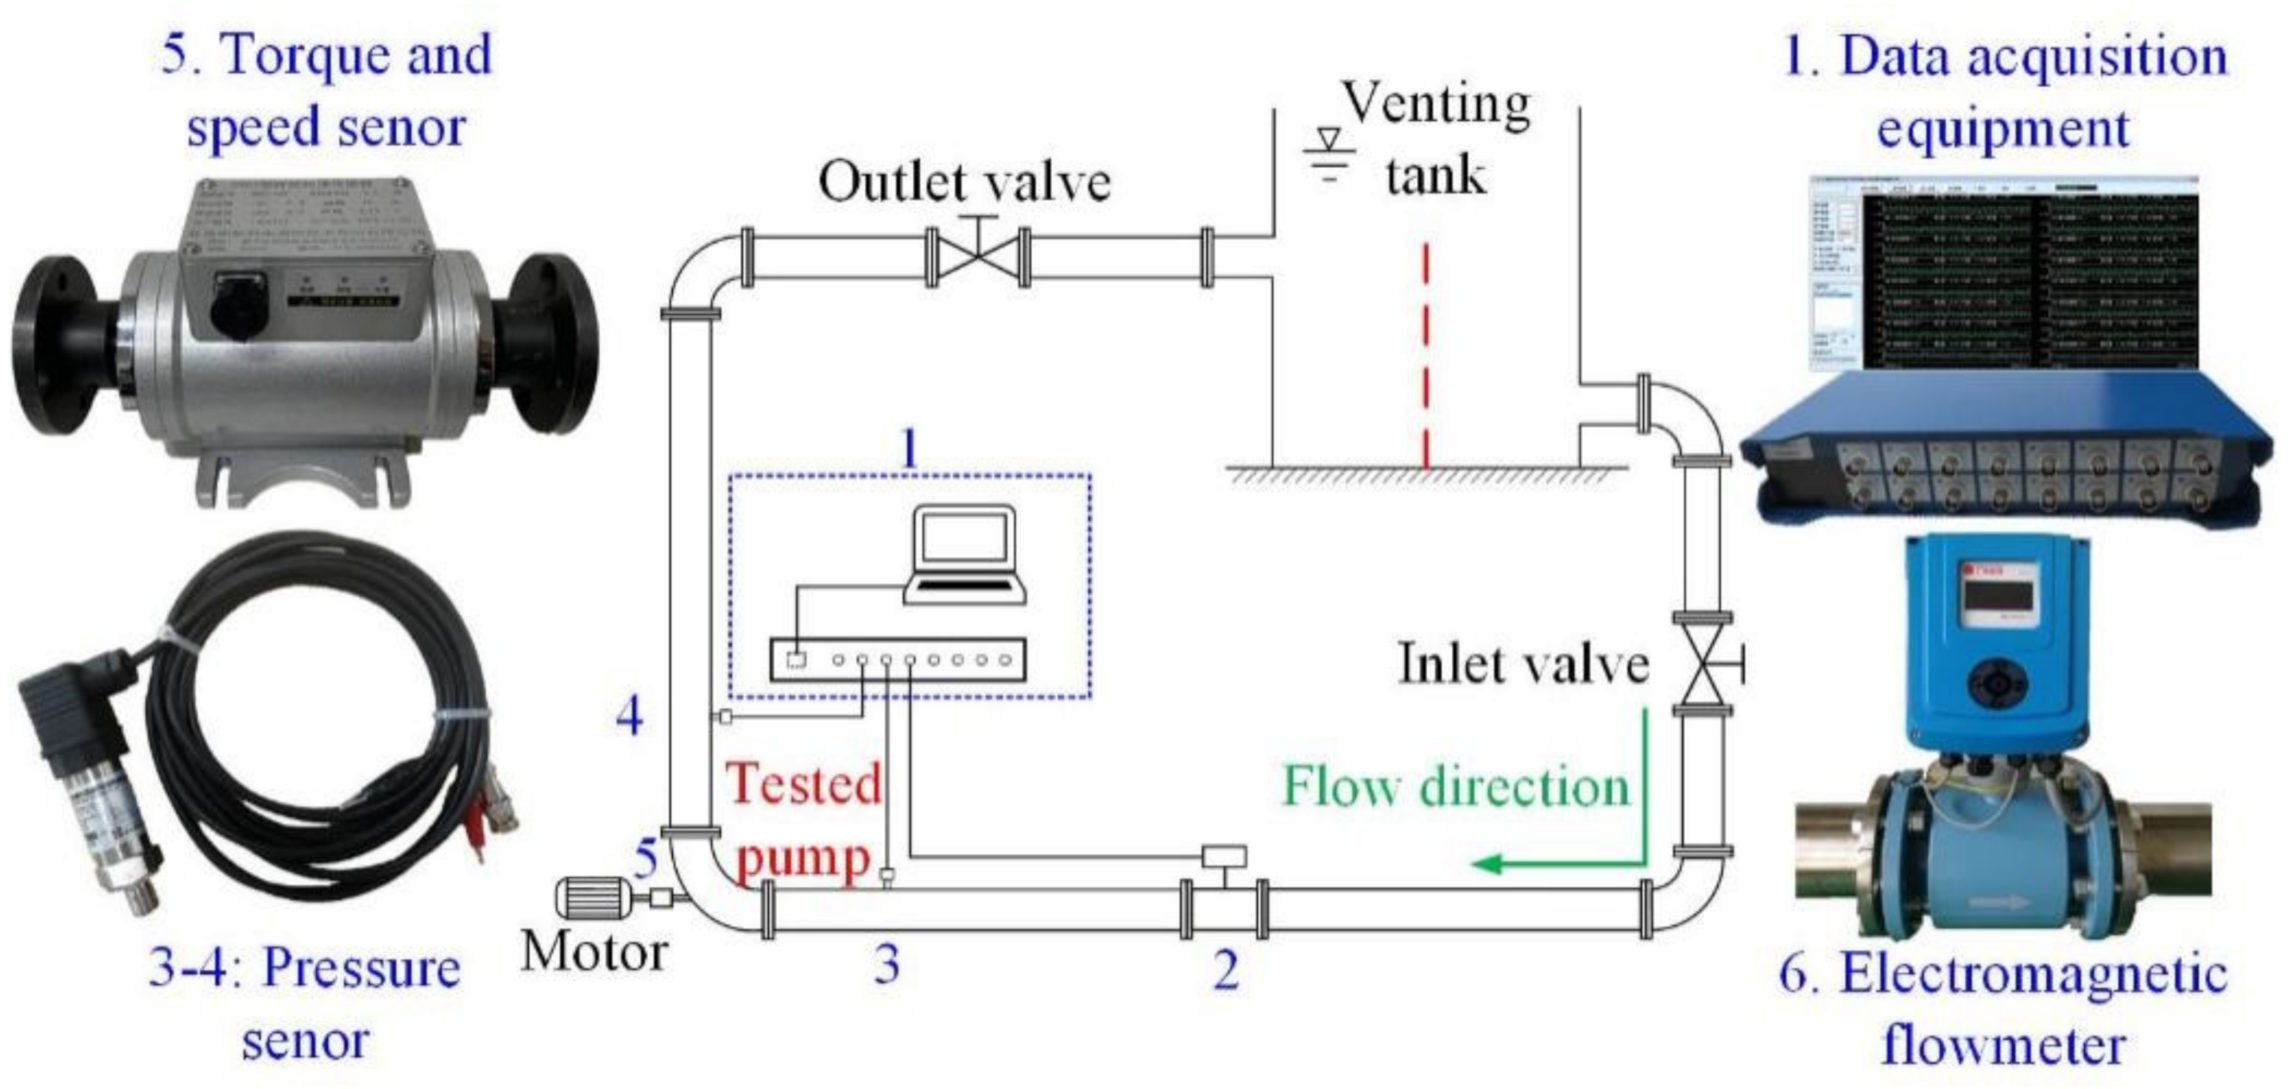
The experimental results presented in this paper were collected in the axial pump testing rig shown in Figure 2. The test system primarily includes a pipeline circulation system (water tank, inlet pipeline, outlet pipeline, return pipeline, inlet and outlet valves), pump section (axial flow pump, coupling, variable frequency motor), and data acquisition system (inlet and outlet pressure sensors, flow meter, speed and torque meter, data acquisition equipment). The detailed information of the above equipment is shown in Table 2. Moreover, based on the random error analysis, the uncertainties for the test system are ± 0.46%.
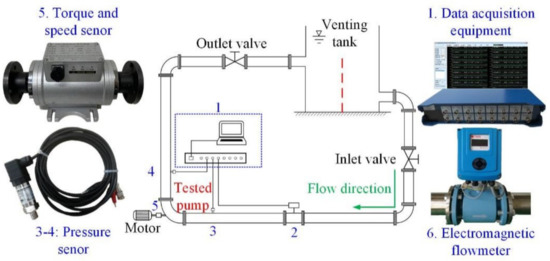
Figure 2.
Schematic diagram of testing rig.
Table 2.
Main instruments installed in the testing rig.
At the beginning of the experiment, the inlet and outlet valves were completely opened. Then, the outlet valve was adjusted to change the operational conditions so that the data would be collected as a steady-state operation was attained. The pressure, torque, speed, and flowrate were monitored and collected synchronously using the data acquisition equipment. Finally, the energy performance curve was plotted based on the above data. Notably, the above process was repeated three times to ensure the accuracy of the results.
The carboxymethyl cellulose (CMC) solution with shear-thinning properties was used as the test medium. Compared to the general shear-thinning solution, the CMC solution has the advantages of being easy to clean, non-toxic, harmless, and having negligible viscoelasticity. Therefore, the CMC solution is a suitable choice to study the effect of shear-thinning properties on the axial flow pump transport performance. The mass fraction of the CMC solution used in the present work was 0.3%. Moreover, the rheological property of the CMC solution sample was tested using the MCR series rheometer from Anton Paar, which is shown in Figure 3.
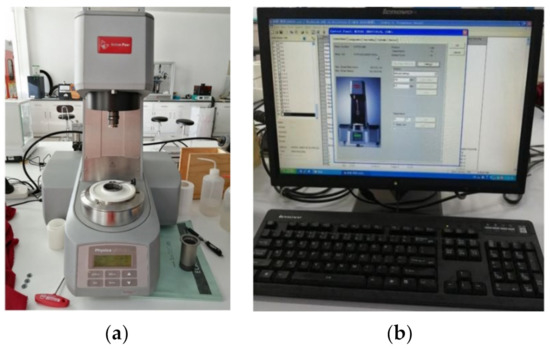
Figure 3.
Testing equipment of rheological properties: (a) rheometer, (b) software interface.
According to the rheological test results (Figure 4), the logarithmic coordinate curve of the shear rate versus the apparent viscosity for the 0.3% CMC solution is found to be linear, expressed by Equation (1).
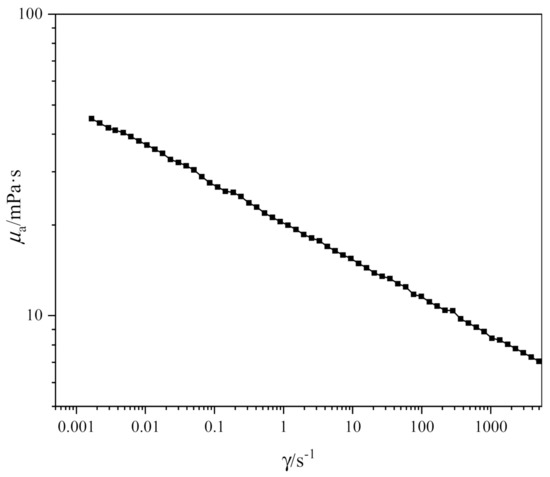
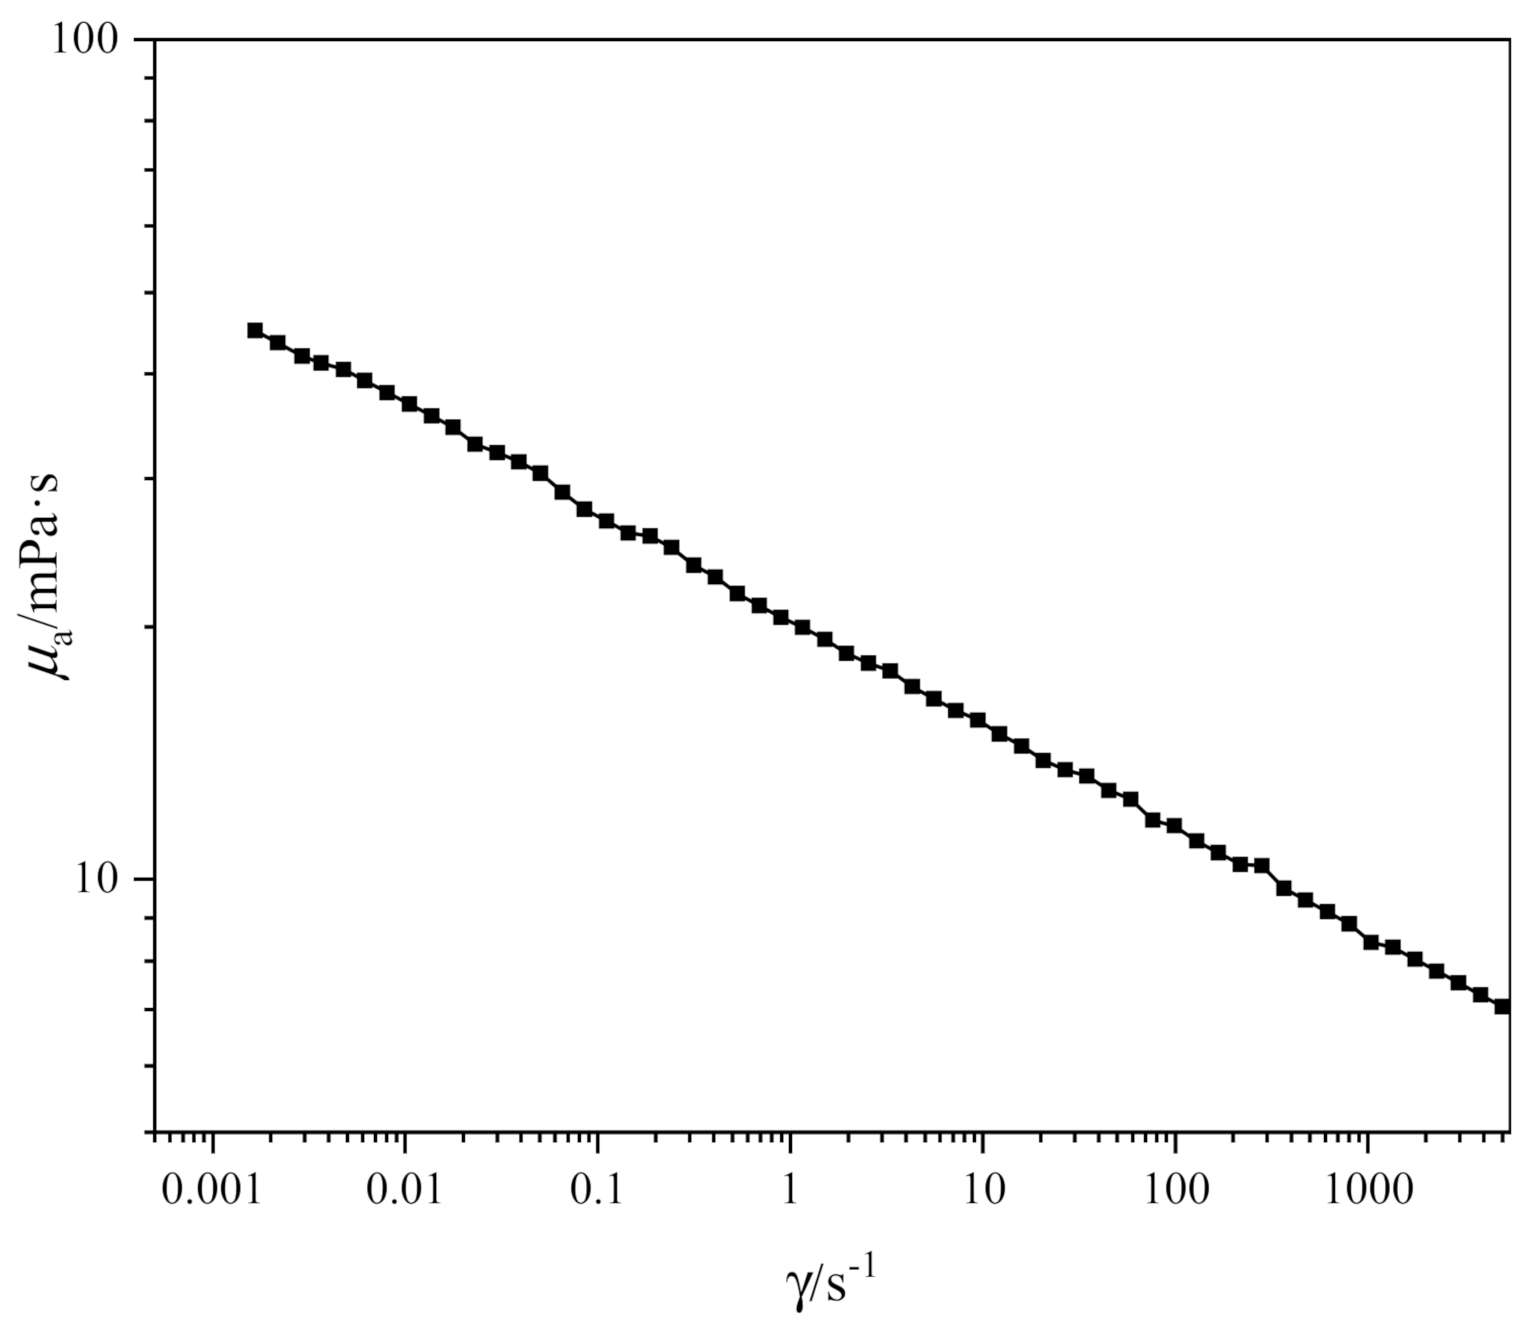 where μa is apparent viscosity, Ka is consistency coefficient, γ is shear rate, and na is flow index. The accuracy of the solution concentration is inevitably influenced by the accumulated liquid and solid impurities, which are difficult to drain from the pipe system. Moreover, the rheological properties of the solution could change with the solution flowing through the pump. To better match the real experimental situation, an extracted sample from the pipeline circulation system was used for the rheological test.
Figure 4.
Rheological properties of 0.3% CMC solution.
Figure 4.
Rheological properties of 0.3% CMC solution.
2.2. Numerical Method
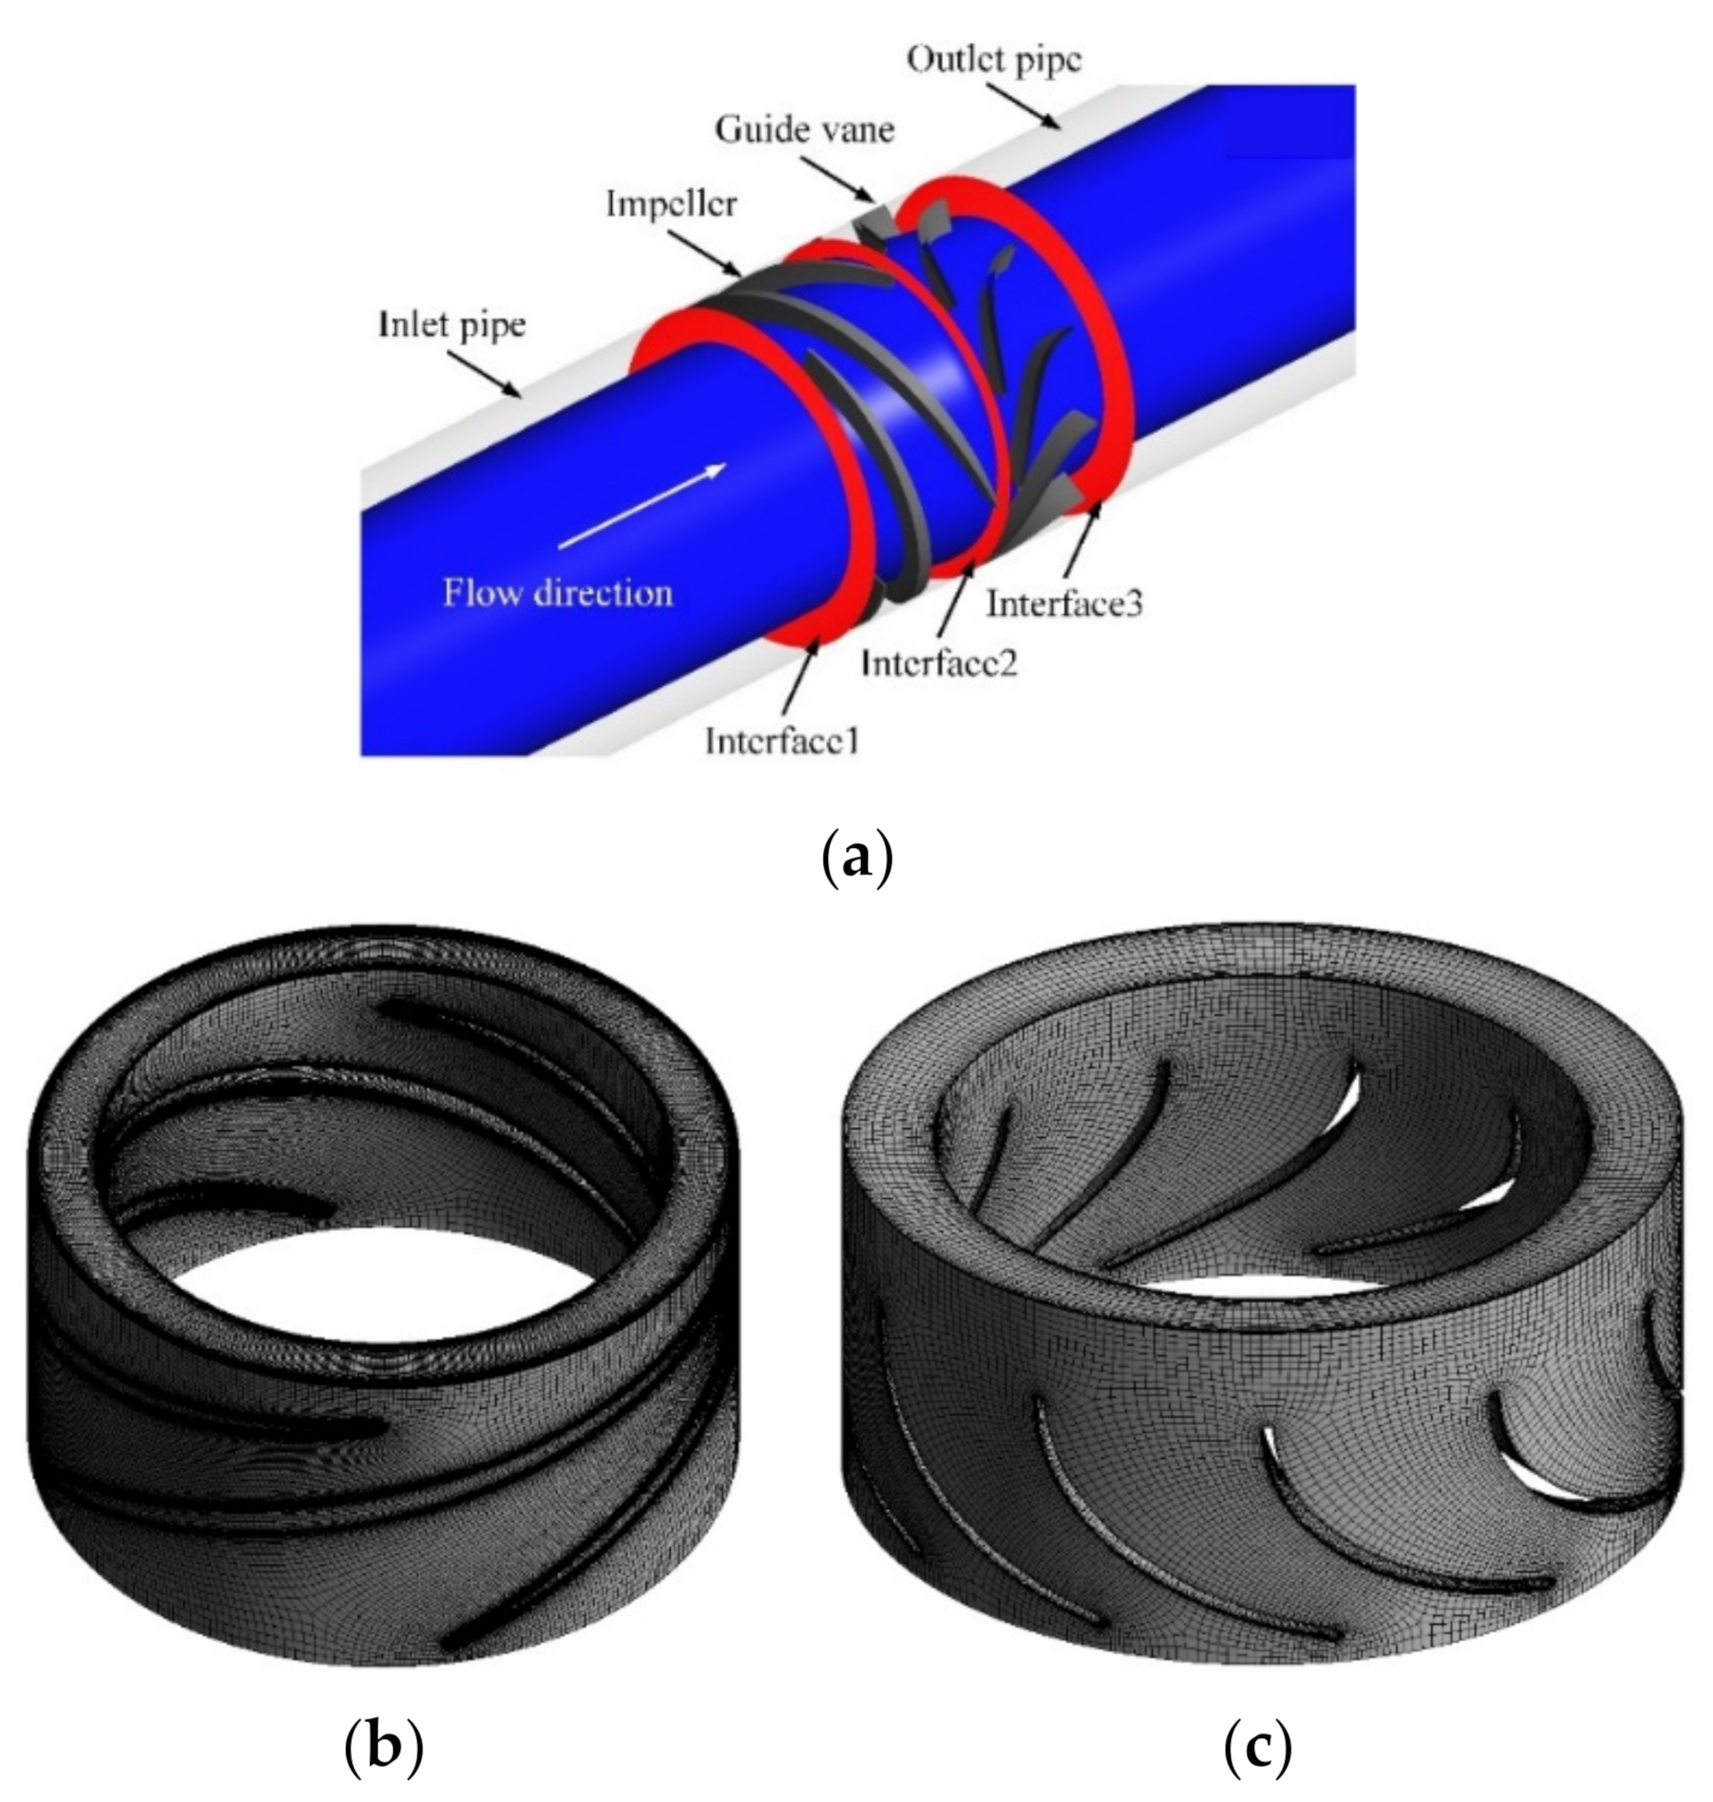
The computational domain of the whole pump consists of four parts (inlet pipe, impeller, guide vane, outlet pipe domains), as shown in Figure 5a. Moreover, to improve the stability of the numerical calculation, the length of the inlet and outlet pipes was extended by four times the pipe diameter [30]. The impeller and guide vane domains were divided into hexahedral structure mesh using ANSYS Turbo Grid 2020 R2. Moreover, the mesh in the region near the tip clearance and the wall was refined to capture detailed flow characteristics. The mesh of the impeller domain and guide vane domain are shown in Figure 5b,c, respectively. The rotor–stator interfaces (Interface 1 and Interface 2) were employed to couple the rotational and stationary domains, where the stationary domains were coupled by the general connection interface (Interface 3). The detailed mesh independence was given in our previous work [22].
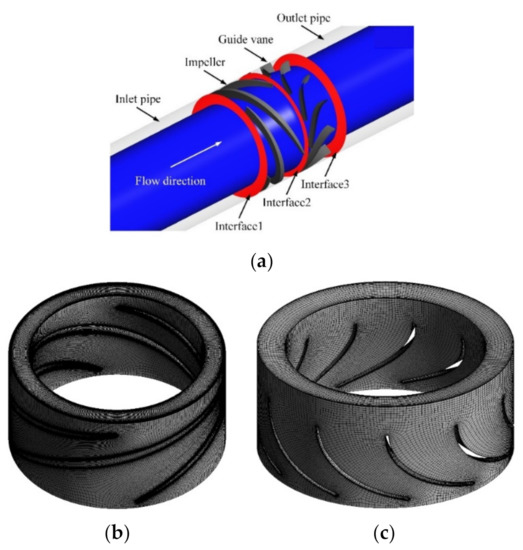
Figure 5.
Computational domain and mesh agreements: (a) computational domain, (b) mesh of impeller, (c) mesh of guide vane.
To simulate the turbulence flow in the pump, unsteady Reynolds-averaged Navier–Stokes (URANS) equations were solved using the commercial code ANSYS CFX 2020 R2. To better describe the flow separation of the model pump, the SST k-ω turbulence model was adopted [31].
In the boundary condition setting, a total pressure was assigned for the domain inlet, whereas the mass flow rate was given for the outlet. In addition, a counter-rotating speed was applied for the casing of the impeller region in the relative coordinate system. To analyze the non-Newtonian fluid flow, the fluid’s apparent viscosity in the material module needed to be redefined. In ANSYS CFX 2020 R2, the suitable models to describe fluid shear-thinning properties include the Carreau model, the Cross model, and the Ostwald de Waele model. Among them, the Ostwald de Waele model (expressed by Equation (1)) has been widely used due to its simple and clear physical concept [15,20,32]. With this model, good agreement is shown with the rheological test results, which are presented in Figure 4. Therefore, the Ostwald de Waele model was adopted to describe the shear-thinning properties of the CMC solution. Moreover, according to the test results of the 0.3% CMC solution, the values of Ka and na were found to be 20.33 and 0.876, respectively.
3. Results and Discussion
3.1. Validation of Calculation
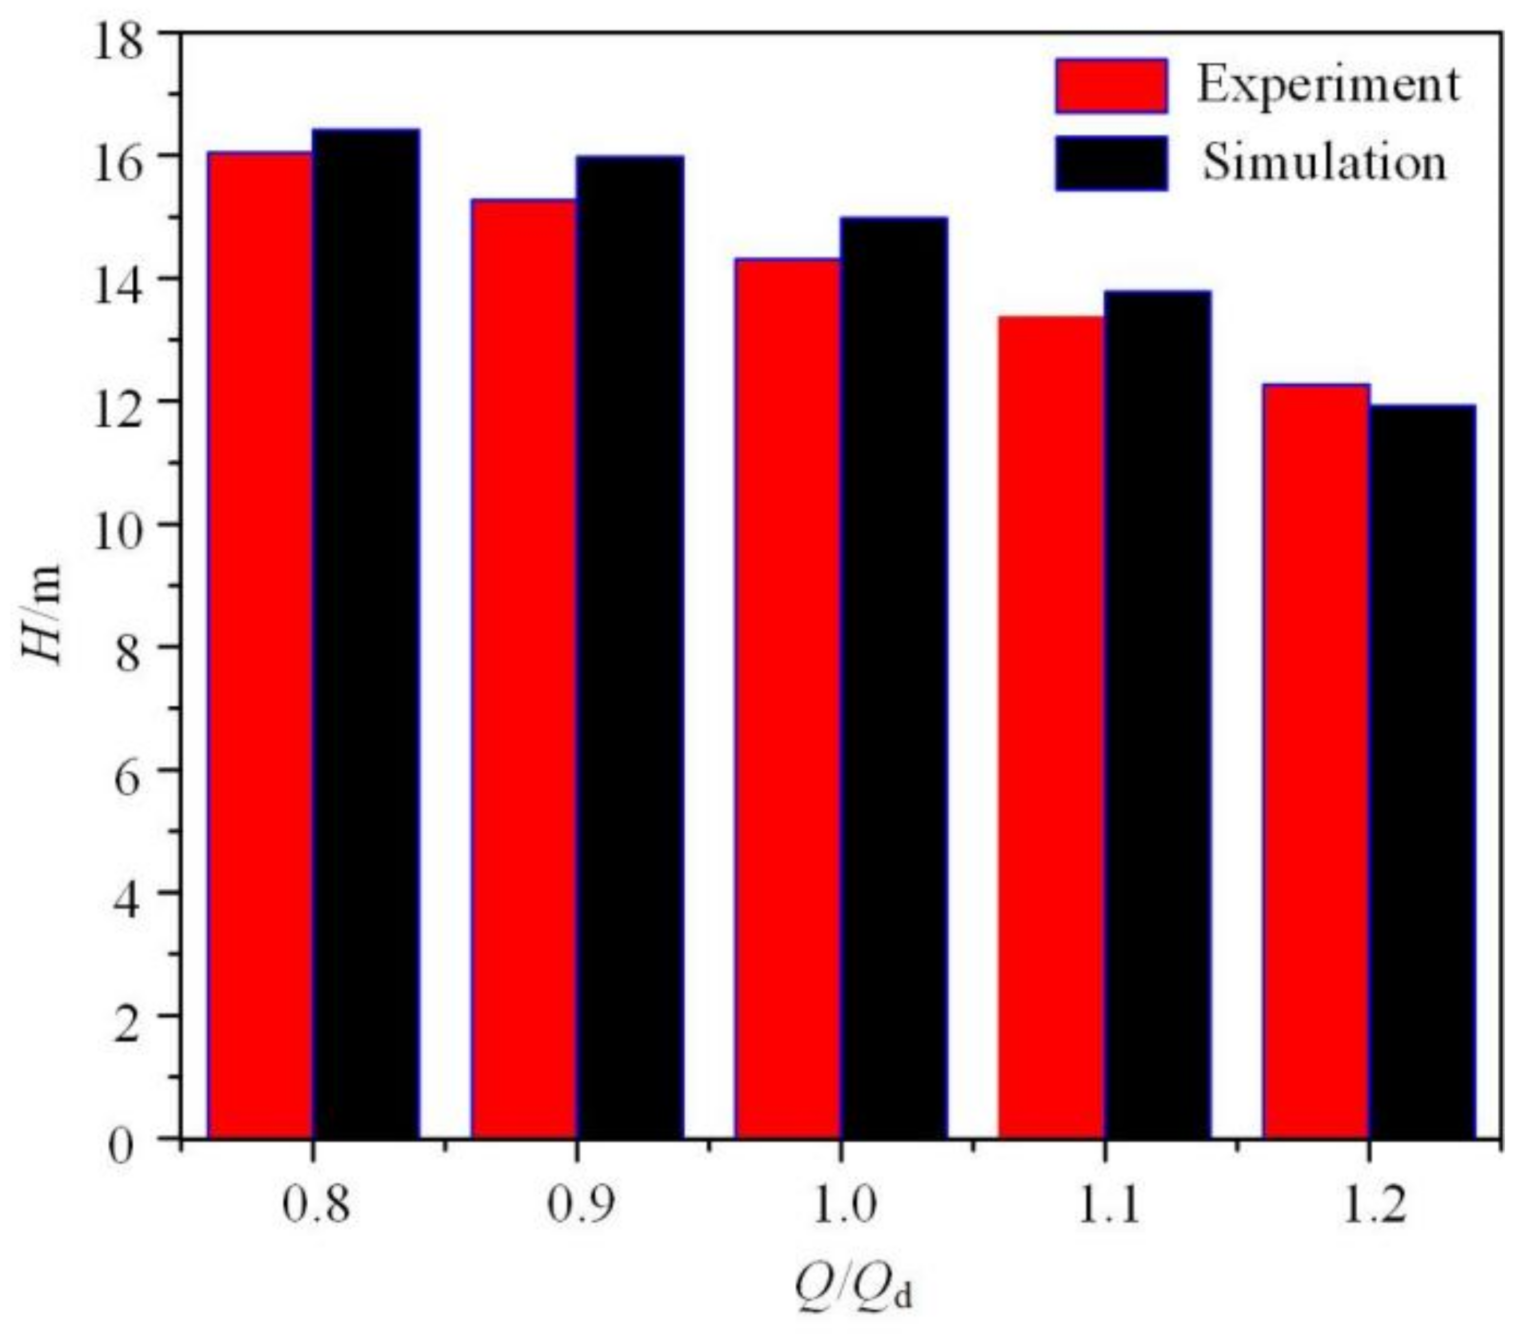
Figure 6 shows the comparison of the numerical simulation and experimental measurement results of the 0.3% CMC solution at different flow rates. Both the numerical simulation and the experimental outcome demonstrate that the head decreases with the rise in flow rate, which is in good agreement with the results of the two methods. For example, the head obtained by the experimental and simulation methods are 14.33 m and 14.96 m, respectively, and the error value is 4.40%. Moreover, the mean absolute percentage error (MAPE) is 3.41%. The above results reveal that the numerical method in the present work is reliable.
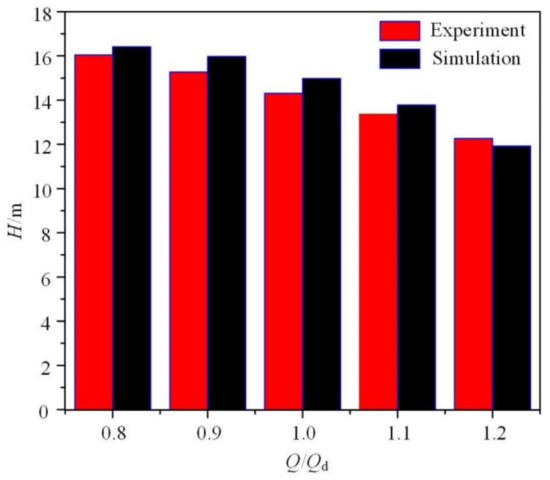
Figure 6.
Head comparison between experiment and numerical simulation.
3.2. Discussion on Flow Fields
3.2.1. Variation of Apparent Viscosity
To understand the variation of apparent viscosity inside the axial flow pump, the 0.3% CMC solution is employed in this section. The investigation is conducted under the design conditions.
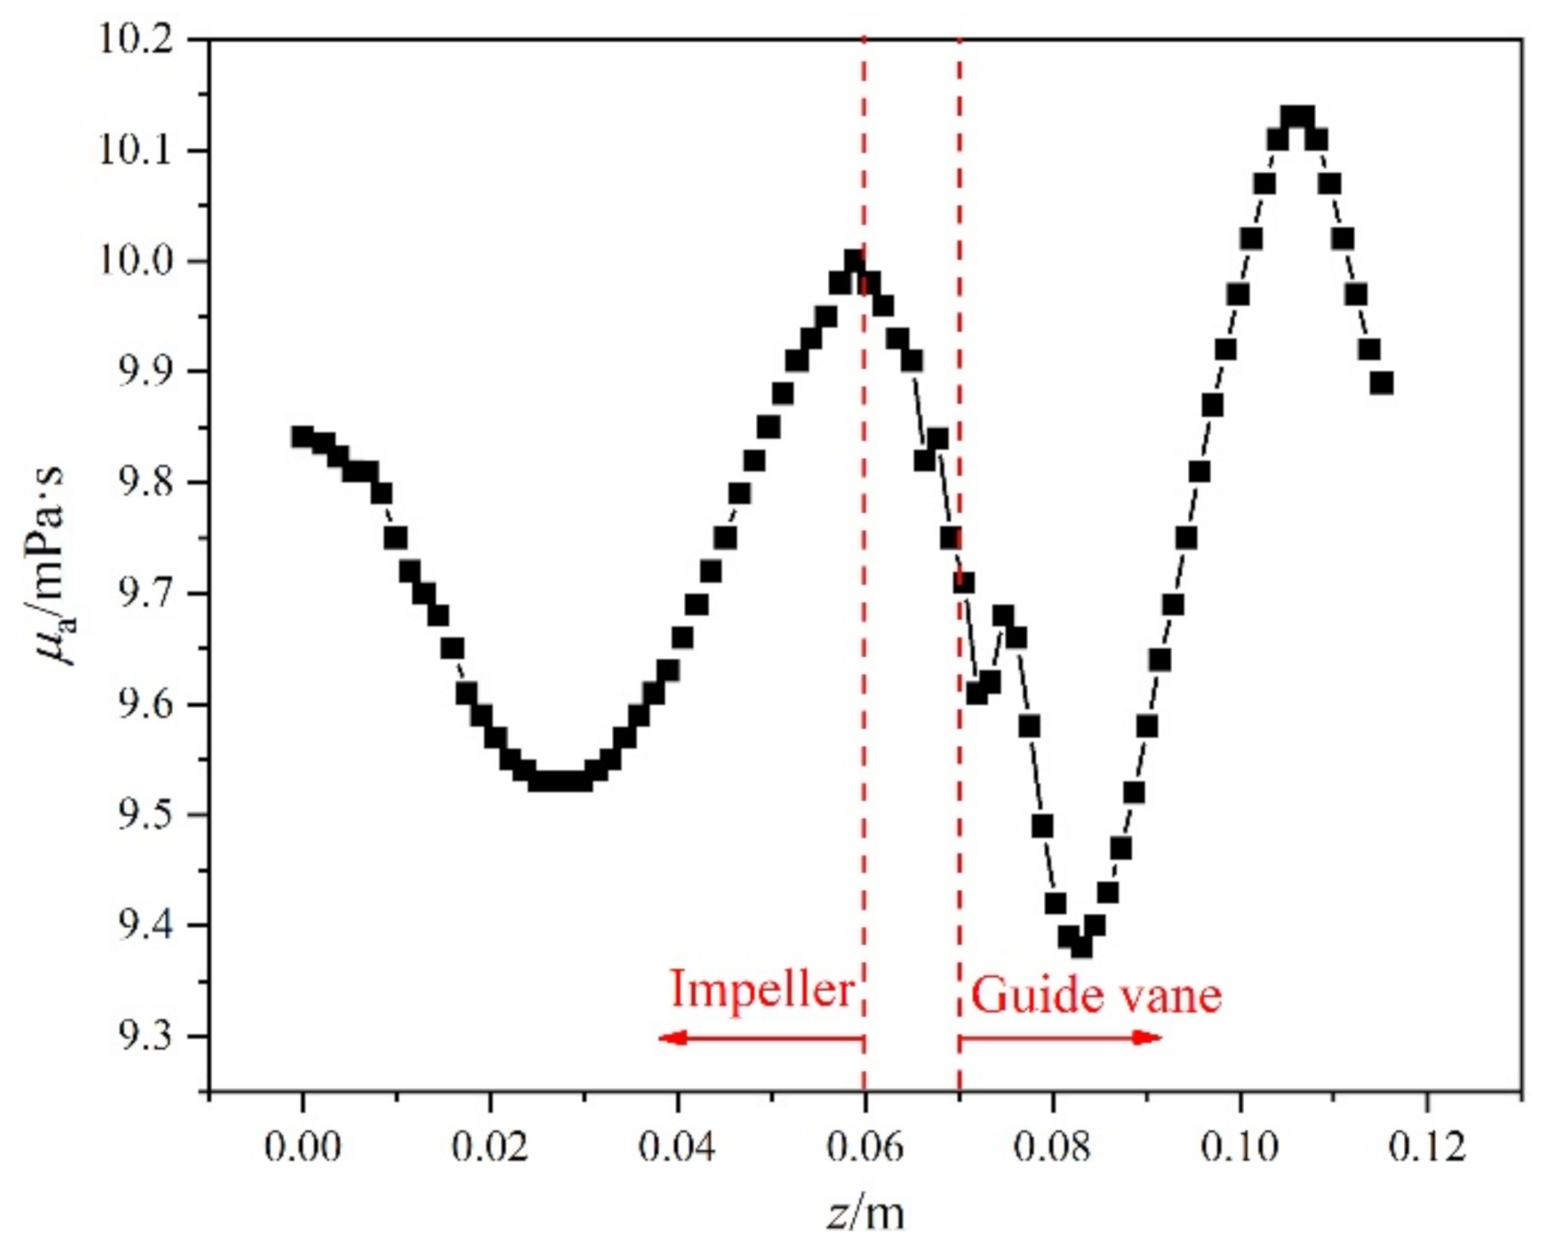
As shown in Figure 7, the average apparent viscosity decreases sharply as the transported medium enters into the impeller passage. In this region, the flow direction changes significantly [11], which results in a larger shear rate. Within the impeller passage, the shear effect gradually fades away and the apparent viscosity value increases accordingly. In the vaneless area between the impeller and the guide vane, the fluid is also significantly affected by the rotor–stator interaction effect. Therefore, the shear rate enhances, leading to a sharp decline in the average apparent viscosity value.

Figure 7.
Variation in average apparent viscosity along the mainstream flow direction.
Once the transportation medium enters into the guide vane passage, the average apparent viscosity of the solution is further reduced in the passage inlet, because of the dual effects of the rotor–stator interaction and flow separation. However, the fluid kinetic energy gradually converts into pressure energy along the flow direction. The velocity difference between the flow layer decreases, resulting in a weaker shear-thinning effect. In addition, in the guide vane passage outlet, the average apparent viscosity decreases again due to the influence of the trailing vortex.
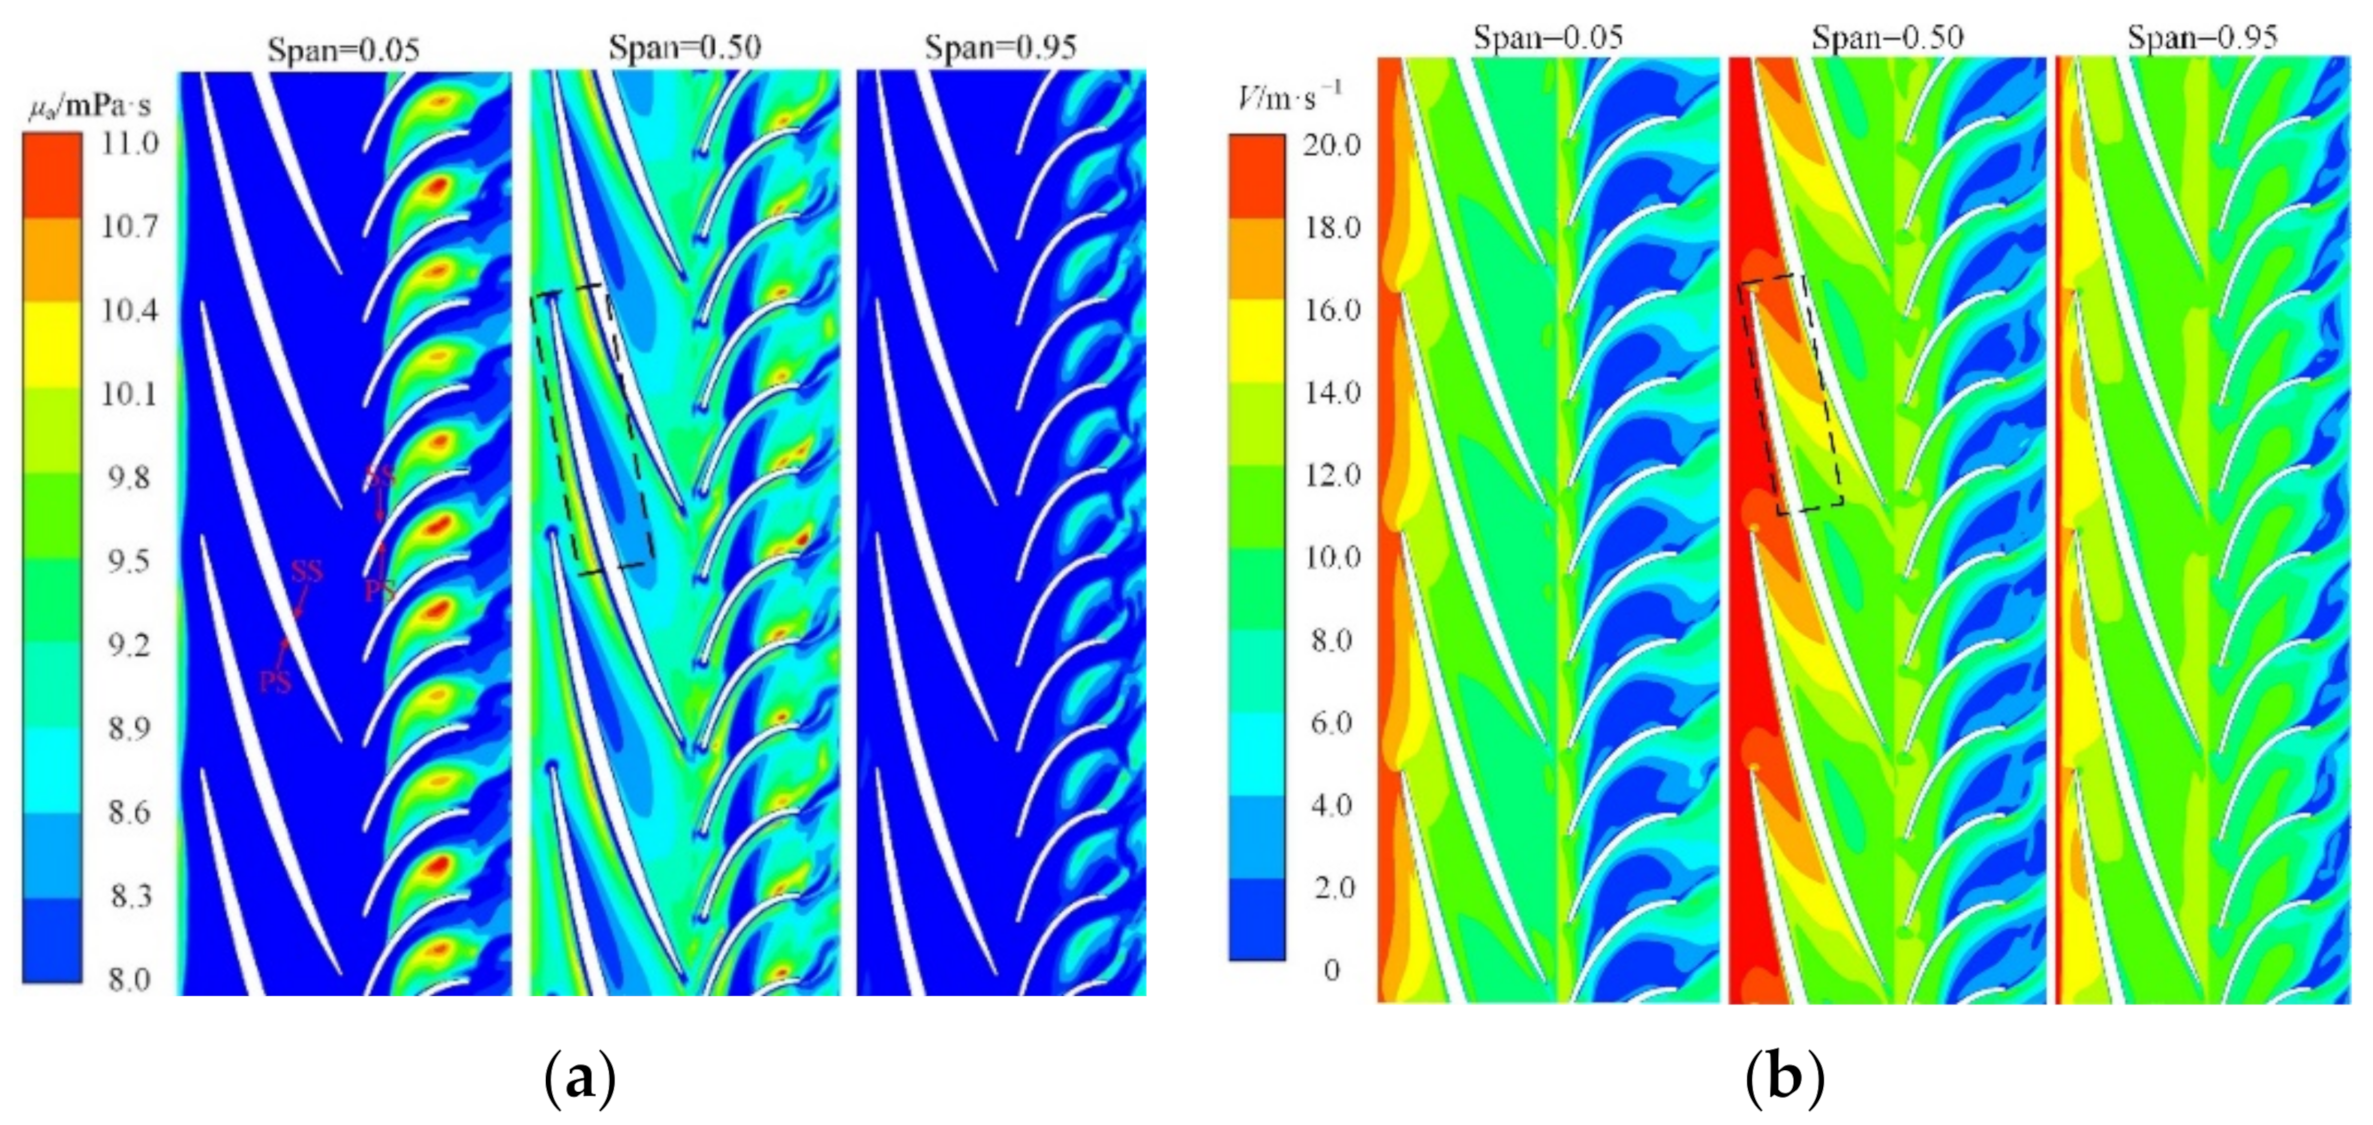
To comprehensively analyze the apparent viscosity variation, the distribution of apparent viscosity on the turbo-surfaces (Span = 0.05, 0.50, and 0.95) under the design flow rate is represented in Figure 8a. The velocity distributions at the corresponding surfaces are shown in Figure 8b.
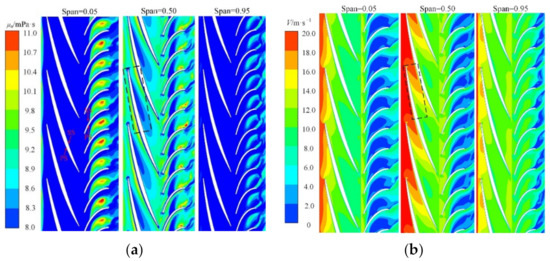
Figure 8.
Distributions of apparent viscosity and velocity on different turbo-surfaces: (a) apparent viscosity, (b) velocity.
Figure 8a reveals that the fluid apparent viscosity in the impeller passage is significantly lower than in the guide vane passage. The reason is the high-speed impeller rotation, resulting in a remarkable increase of fluid shear force. As the fluid kinetic energy is converted into pressure energy in the guide vane passage, the velocity difference between the fluid layers reduces, and hence the shear rate weakens accordingly. In the impeller passage, the higher velocity gradient near the wall (Span = 0.05, Span = 0.95) results in a sharp decline of the fluid apparent viscosity due to the wall friction. However, at the middle of the flow passages (Span = 0.50), the velocity remains relatively uniform, so the apparent viscosity increases. Moreover, the apparent viscosity remains remarkably low in the impeller inlet (See the dashed box region in Figure 8a). In this region, the flow direction changes sharply, which intensifies the velocity non-uniformity (See the dashed box region in Figure 8b).
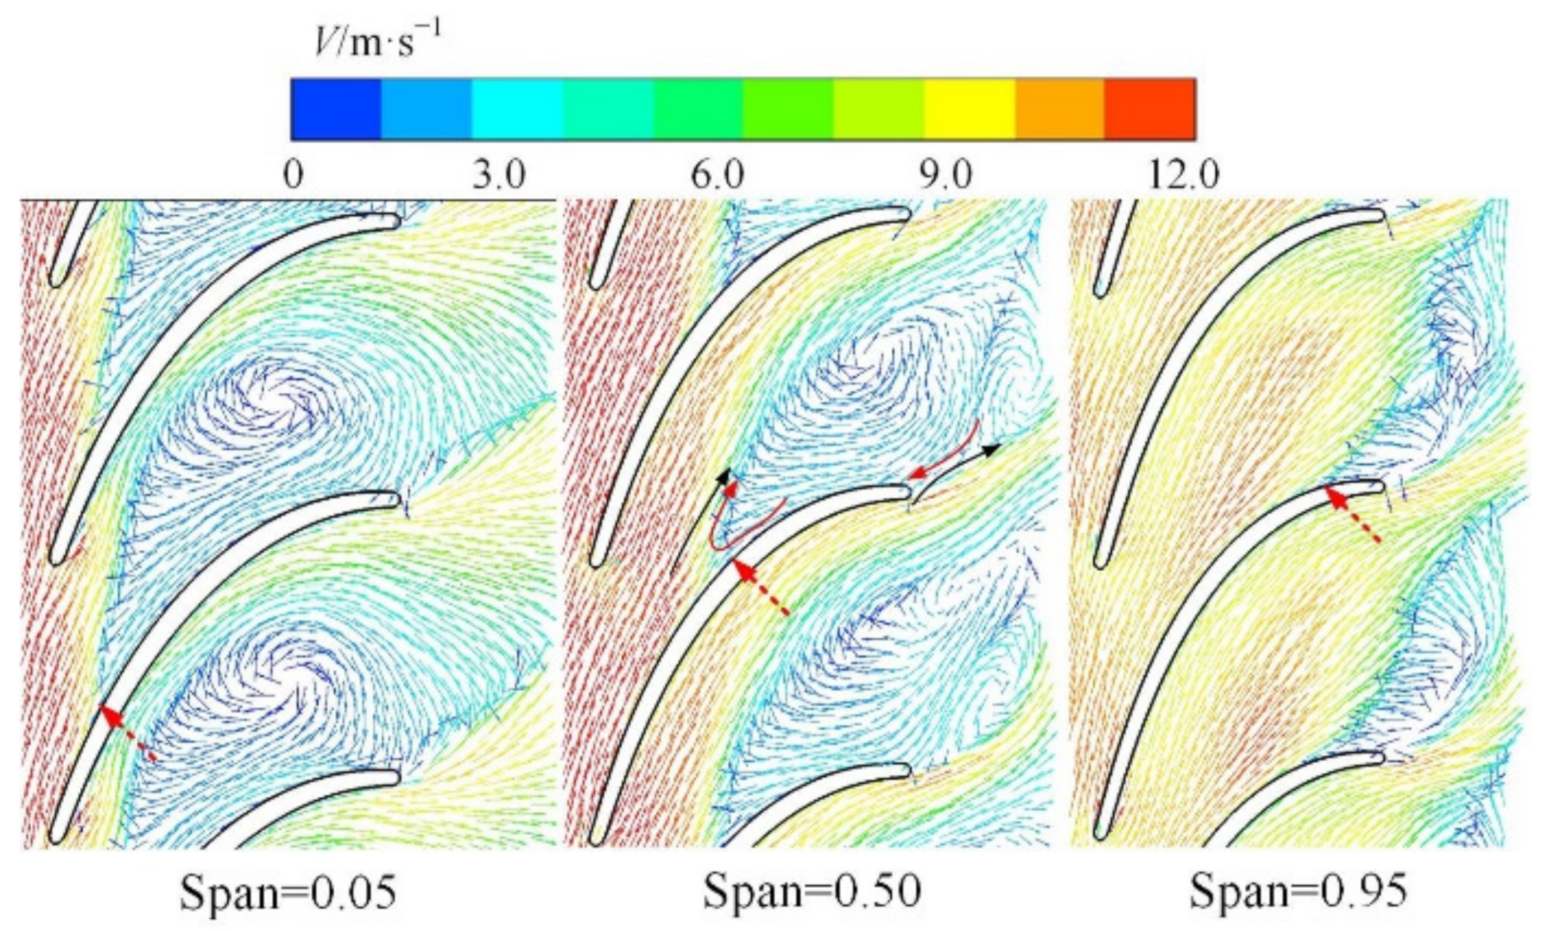
In the guide vane region, the low magnitude of the apparent viscosity is located near the suction side (SS) in the middle of the passage. To portray the reason behind the formation of this region, the distribution of the velocity vector on different turbo-surfaces in the guide vane is shown in Figure 9. Comparing Figure 8a and Figure 9, it can be understood that the low apparent viscosity region appears at the junction position between the mainstream region and the flow separation vortex region. The reason is attributed to the opposite direction fluid flow near the junction of the above two regions, leading to the larger shear force among the flow layers. Based on the velocity triangle analysis, the kinetic energy of the transported medium increases from hub to shroud. Therefore, the fluid in the guide vane inlet also increases accordingly, which leads to the shift in the flow separation position to downstream (marked by the red dashed arrow in Figure 9, and together with the movement of the low apparent viscosity as shown in Figure 8a). Moreover, due to the separation vortex, the opposite flow directions in the tailing edge of the guide vane exists, as marked by the red and black arrows in Figure 9. Therefore, a larger shear rate also exists in the junction region, leading to a low apparent viscosity region at the corresponding position.
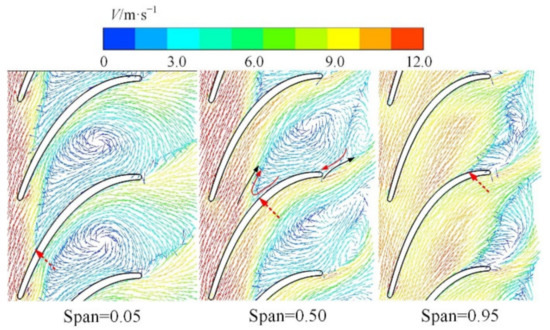
Figure 9.
Velocity vector on the different turbo-surfaces of the guide vane.
3.2.2. Influence of Shear-Thinning Properties
In this section, shear-thinning non-Newtonian fluid (0.3% CMC solution) and viscous Newtonian fluid are employed as the working media. It is noteworthy to mention that the two fluids have the same density. The viscosity of the viscous Newtonian fluid is determined to be 20.33 mPa·s, which equals the apparent viscosity of 0.3% CMC solution as the na is 1. In the following work, the internal flow fields of these two fluids are comprehensively analyzed.
The tip clearance plays an important role in the pump performance and the flow field [33,34]. Part of the fluid could cross the tip clearance because of the pressure difference between the pressure side (PS) and suction side (SS). This can lead to volume and energy loss induced by the leakage flow and mainstream interaction. Therefore, as shown in Figure 10, the monitoring surface is set in the tip clearance from the impeller’s leading edge to the trailing edge.
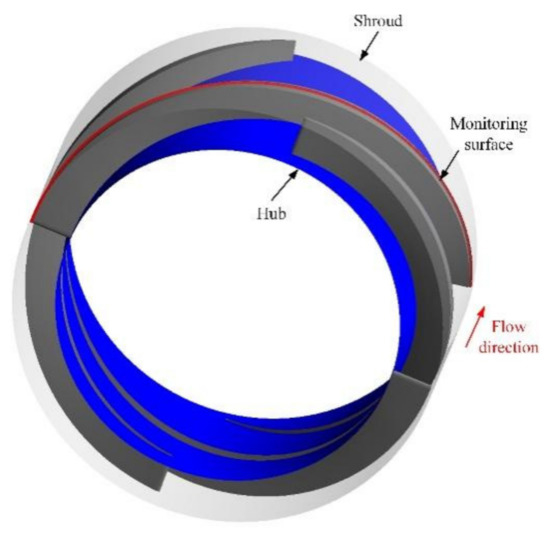
Figure 10.
Schematic diagram of the monitoring surface.
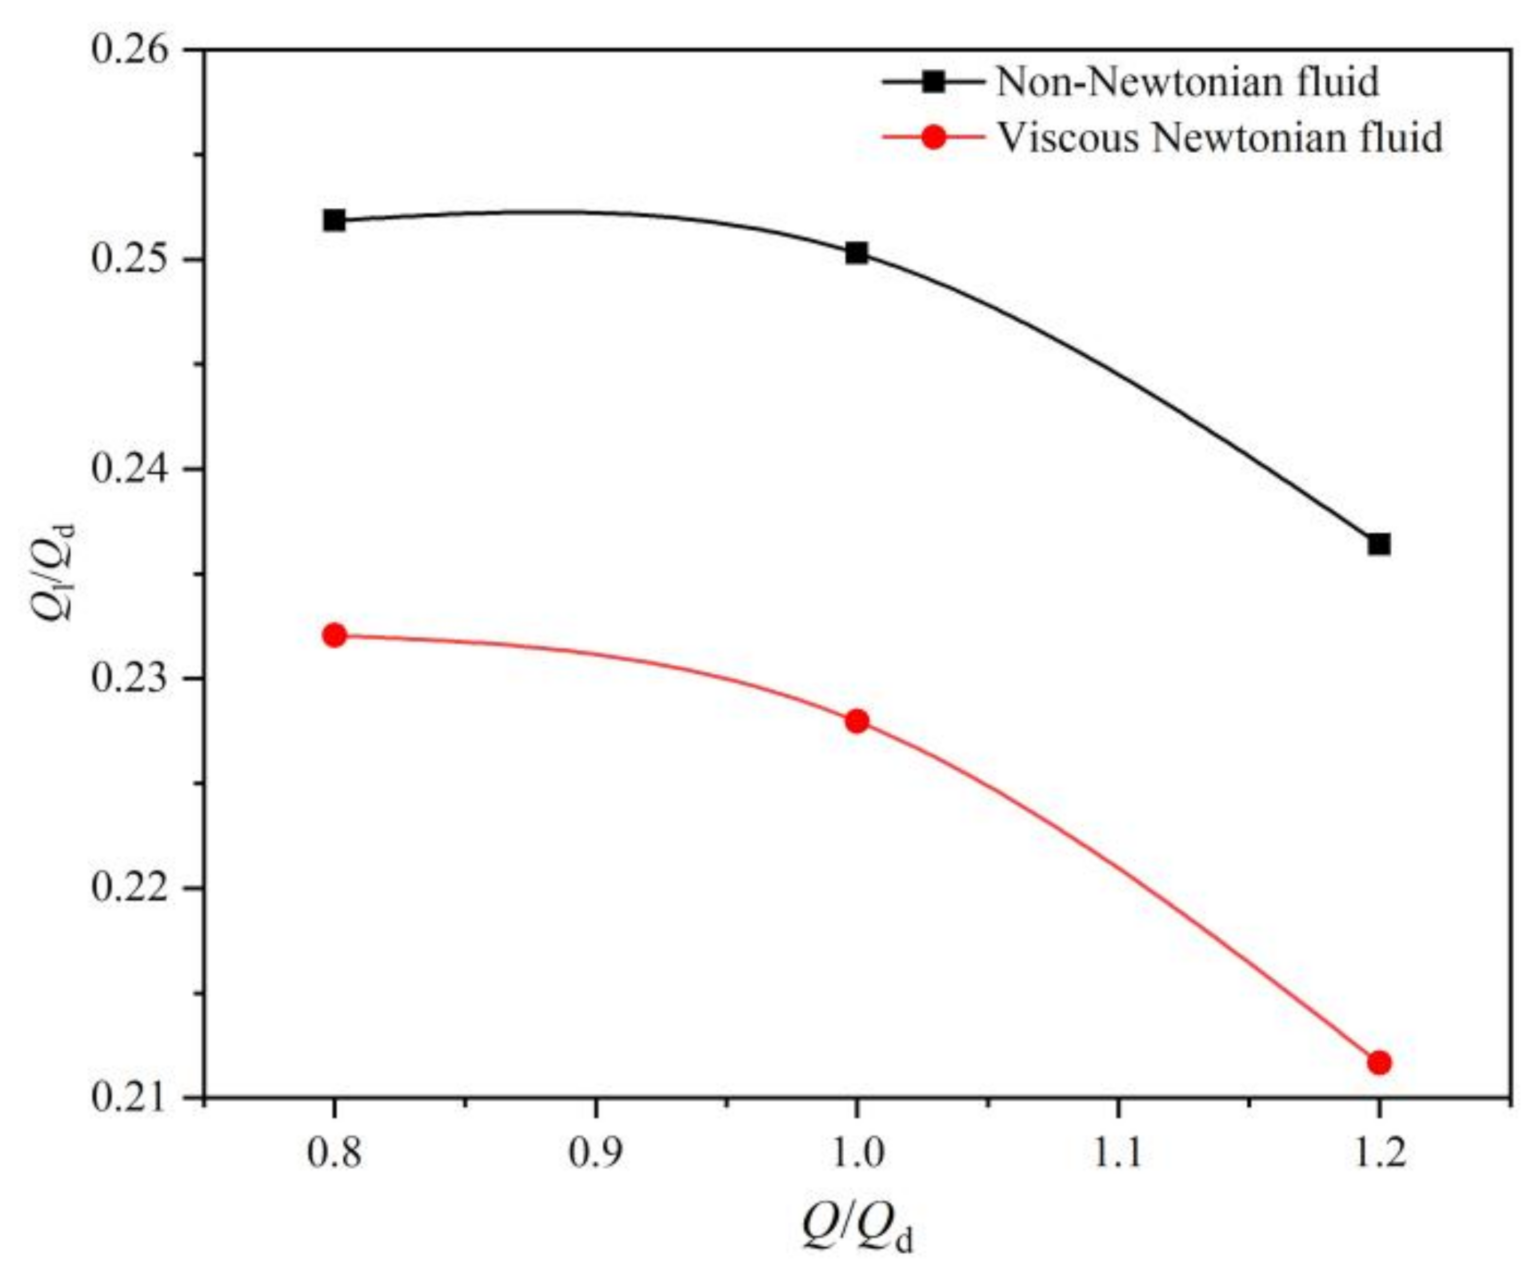
The variation in the leakage flow rate with the rise of the flow rate under different fluid conditions is shown in Figure 11. In comparison with viscous Newtonian fluid, the tip leakage flow rate increases sharply with non-Newtonian fluid transportation. Under the design flow rate, the leakage flow rate is determined to be 25.03% and 22.80% of the total flow rate for the non-Newtonian fluid and viscous Newtonian fluid, respectively. This phenomenon reveals that the leakage flow leads to a large volume loss, whereas the shear-thinning properties could lead to the increased loss. As the fluid crosses the narrow channel of the tip clearance, the flow resistance demonstrates a significant effect on the leakage flow [35]. The high-speed rotation of the impeller results in a larger shear rate in this region. Moreover, the apparent viscosity of the non-Newtonian fluid and the flow resistance decreased sharply due to the shear-thinning properties (Figure 8a).

Figure 11.
Tip leakage flow rate.
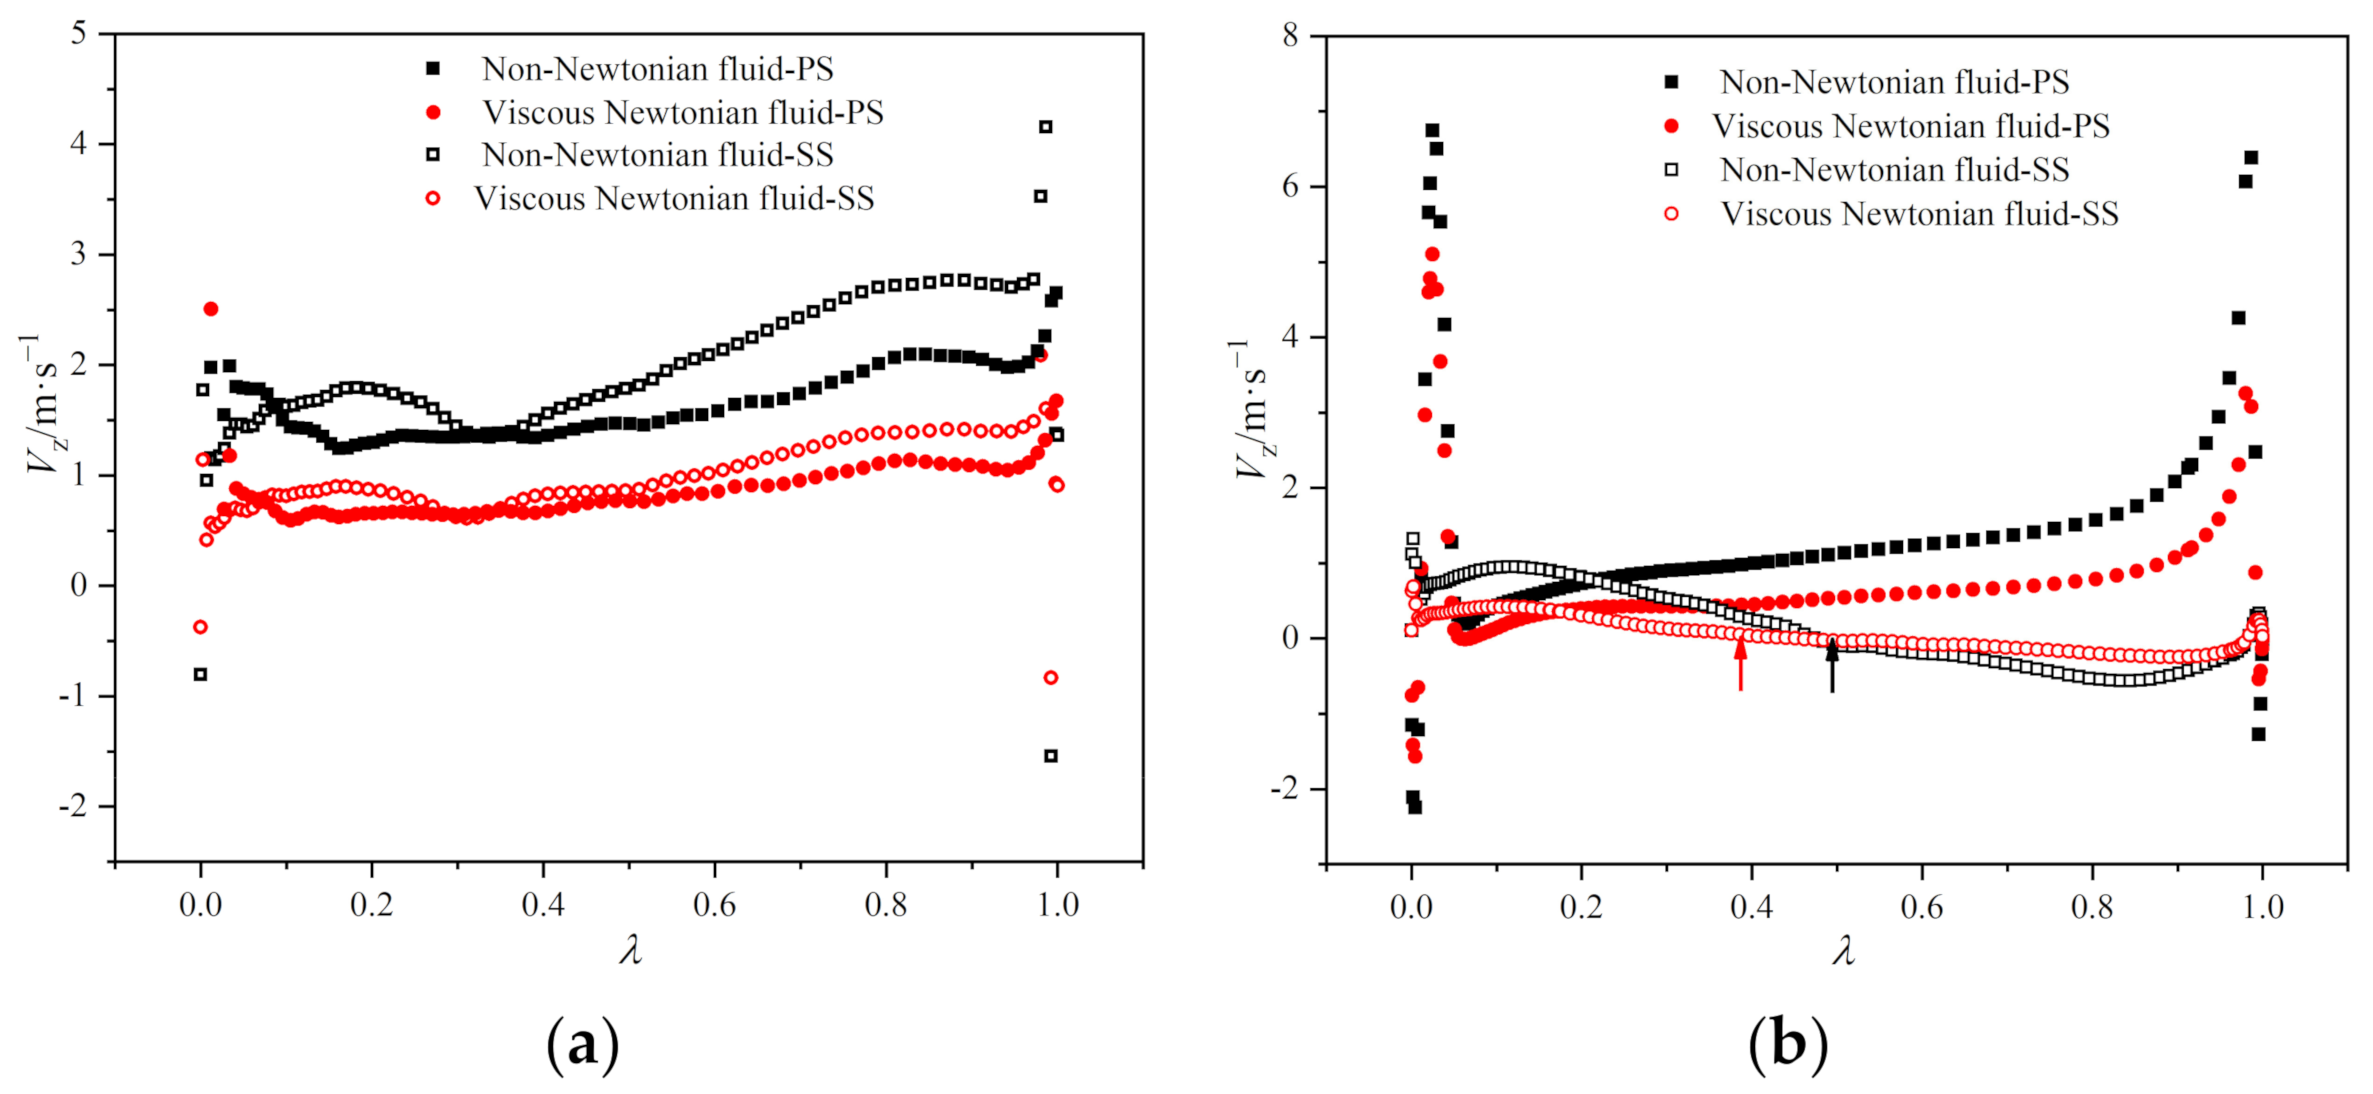
The variation in axial velocity (Vz) on the impeller and guide vane blade surfaces along the blade chord (λ) at 0.50 span is shown in Figure 12. From Figure 12a, it is found that under non-Newtonian fluid conditions, the Vz on the impeller surfaces is considerably higher than for the viscous Newtonian fluid. The above phenomenon is related to the large velocity gradient near the surfaces so that flow resistance is lower when transporting non-Newtonian fluid. Moreover, the fluid kinetic energy gradually increases along the mainstream flow direction, so the Vz difference between the two solution conditions also enlarges accordingly. Analogously, the Vz on the SS is higher than the PS, leading to an increased Vz difference between these two conditions on the SS.
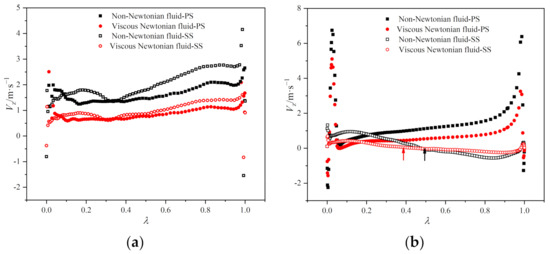
Figure 12.
Axial velocity at 0.50 span: (a) impeller, (b) guide vane. (The red and black arrow denote the separation point under the viscous Newtonian and non-Newtonian conditions, respectively).
The fluid kinetic energy is gradually converted into pressure energy once the transport medium enters into the guide vane. This phenomenon results in a weakened effect of the shear-thinning properties (as demonstrated in Figure 8), followed by a decline in the velocity discrepancy between the two conditions. The Vz on the PS gradually increases along the mainstream flow direction, but the variation on the SS demonstrates an opposite trend. The Vz on the SS downstream displays a negative value. The difference of Vz on the PS between the two solution conditions increases significantly, especially at the passage downstream. The above phenomenon is primarily caused by the flow separation vortex. According to the distribution of the velocity vector (Figure 9), the flow separation vortex occurs in the region near the SS at the passage downstream. Therefore, a large part of the passage is occupied by the vortex structure, and the velocity of the fluid near the PS increases accordingly. As shown in Figure 12b, compared to the viscous Newtonian fluid, the separation point shifts towards the downstream when transporting shear-thinning fluid. The reason could be attributed to two main factors, i.e., (i) after an acceleration in the impeller, higher kinetic energy is obtained because of the lower friction loss under the non-Newtonian fluid, and (ii) the flow resistance in the guide vane reduces remarkably, induced by shear-thinning properties.
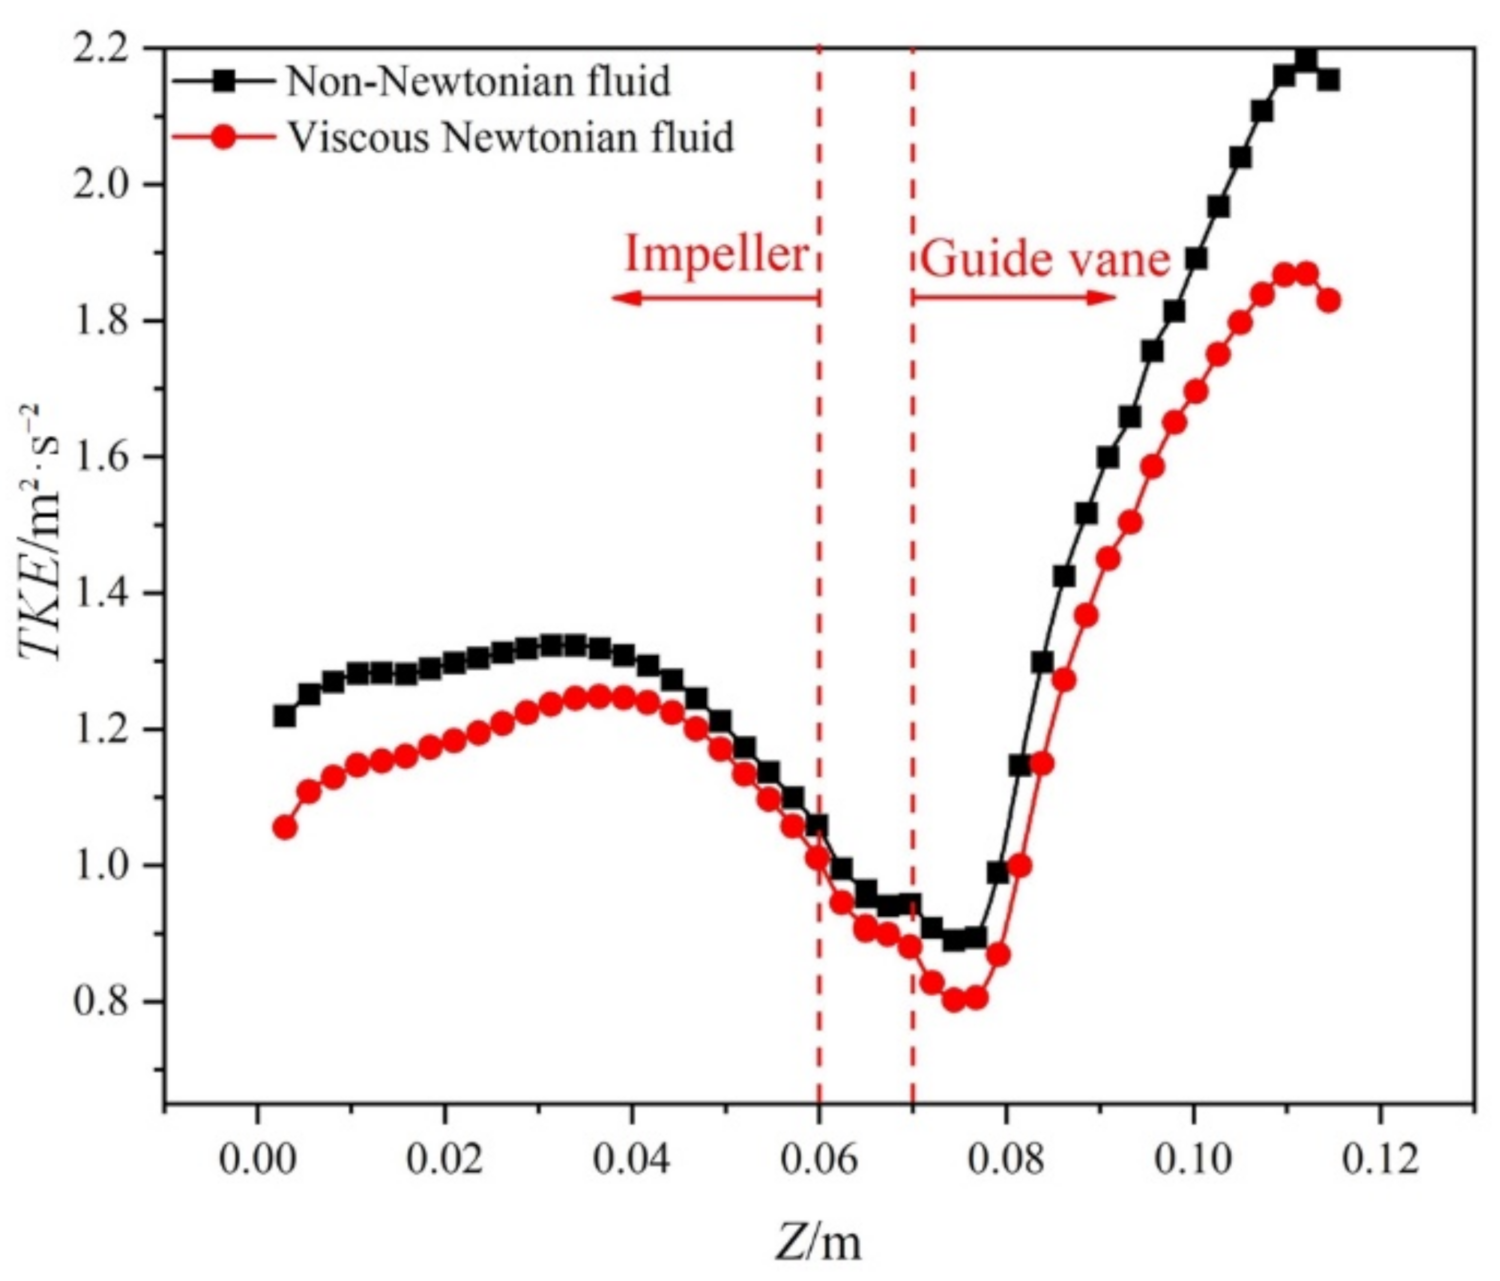
The turbulent kinetic energy (TKE) is the main physical quantity that reflects the turbulence intensity. The variation in the average TKE from the impeller inlet to the guide vane outlet is shown in Figure 13. The average TKE of the non-Newtonian fluid is higher than the viscous Newtonian fluid in the whole passage. A higher difference of TKE between the two fluid conditions occurs in the impeller inlet, which is related to the decreased apparent viscosity, as shown in Figure 7. Subsequently, the difference gradually decreases with the increase in apparent viscosity along the streamwise. The difference in the vaneless area is relatively small, which reveals that the flow instability in this region is mainly influenced by the rotor–stator interaction. However, due to the decline in apparent viscosity induced by the flow separation vortex, the difference sharply increases in the guide vane passage along the streamwise.

Figure 13.
Variation in average TKE in the impeller and the guide vane.
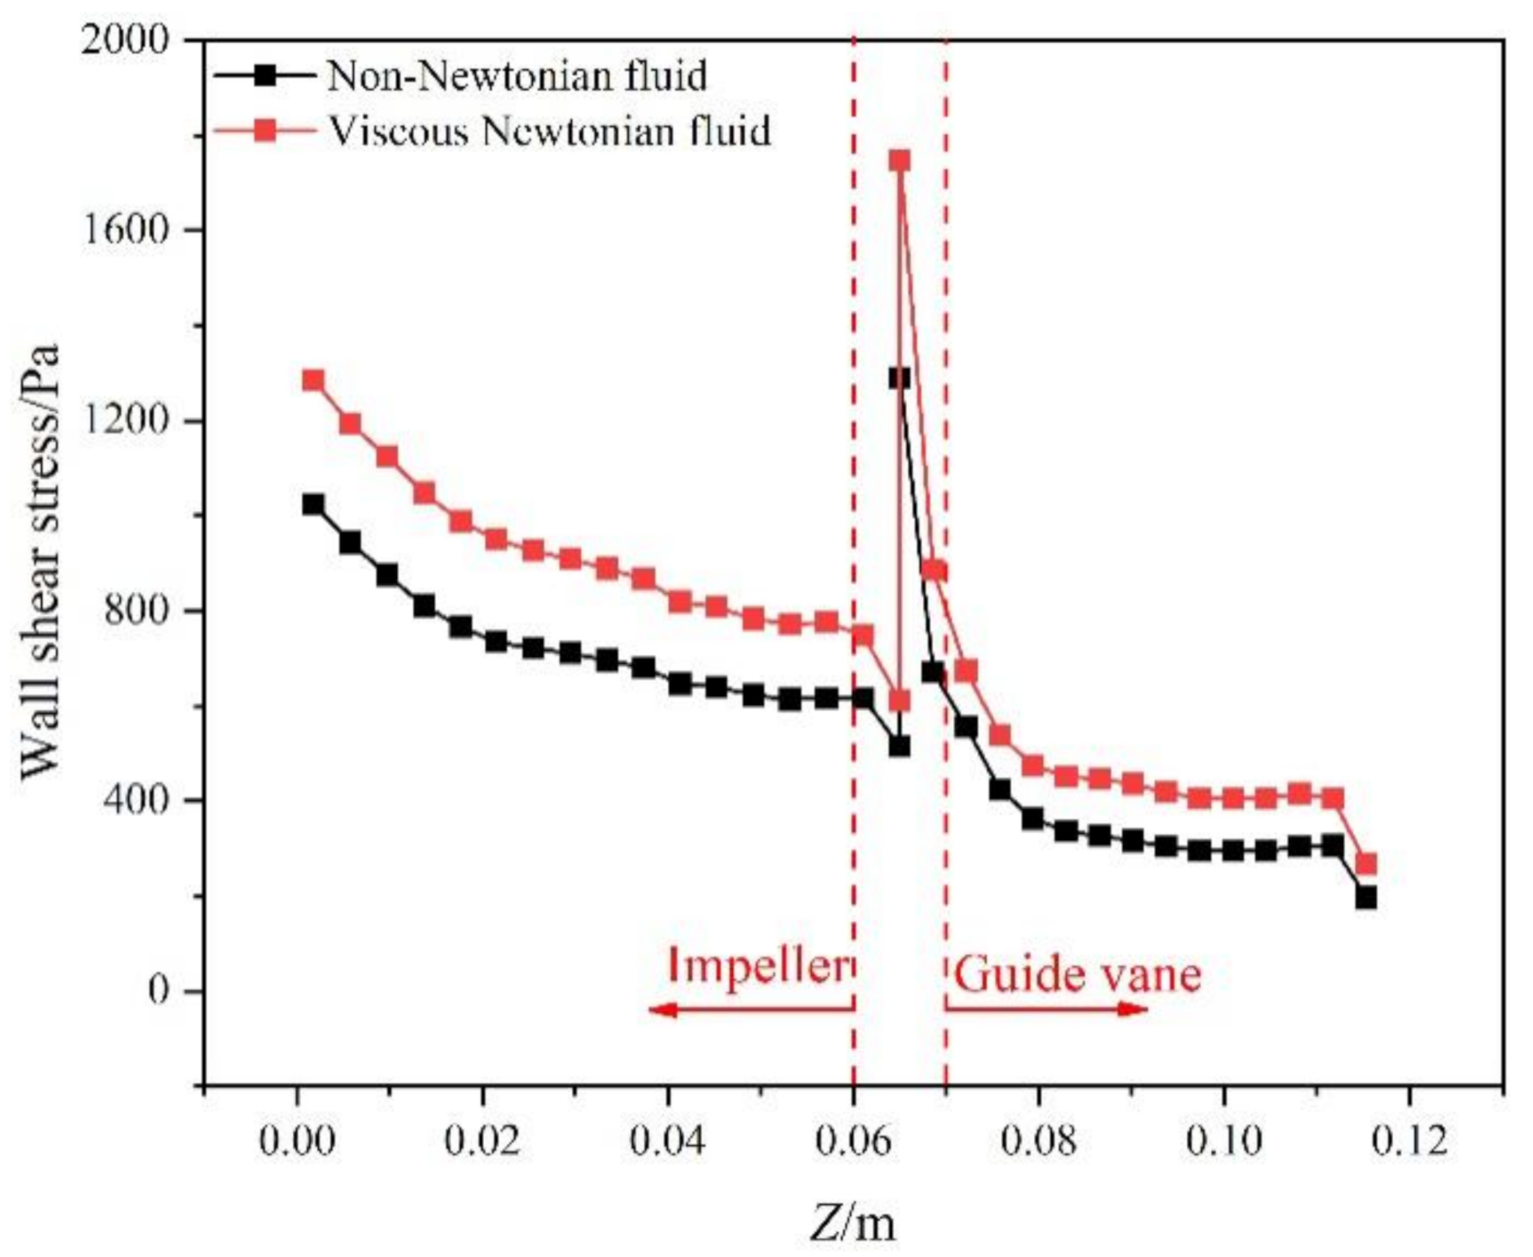
To investigate the effect of shear-thinning properties on the friction loss in the pump, the variation in the average wall shear stress is shown in Figure 14. It is found that the shear stress is higher for the viscous Newtonian fluid compared to the non-Newtonian fluid. The reason is attributed to the decline in friction loss caused by the decreased apparent viscosity for non-Newtonian fluid conditions. According to the distribution of the apparent viscosity (Figure 8a), the higher shear rate in the impeller results in the lower apparent viscosity, and therefore, an enhanced difference of the wall shear stress between the two solution conditions in the impeller. In the vaneless region, the difference further increases. However, in the guide vane passage, the shear-thinning properties of the non-Newtonian fluid weaken, followed by the decline in the difference of the wall shear stress.

Figure 14.
Variation in average wall shear stress in the impeller and the guide vane.
The variation of pressure can reflect the energy loss during transportation. The variation in the average pressure resulting from the impeller inlet to the guide vane outlet is shown in Figure 15. For the whole passage, the pressure under the non-Newtonian fluid remains higher than the viscous Newtonian fluid, which indicates that the total energy loss is higher for the viscous Newtonian fluid. According to the above investigation, there is a higher reduction of friction loss in the impeller compared to the guide vane (Figure 14), but the tip leakage flow in the impeller is serious, which leads to the large volume loss and flow loss (Figure 13). In addition, compared to the guide vane, the pressure difference between the two types of solution in the impeller is relatively small. The above analysis points out that friction loss is the dominant part of the total loss in the axial flow pump, which is the same as in the Newtonian fluid conditions demonstrated in [36].
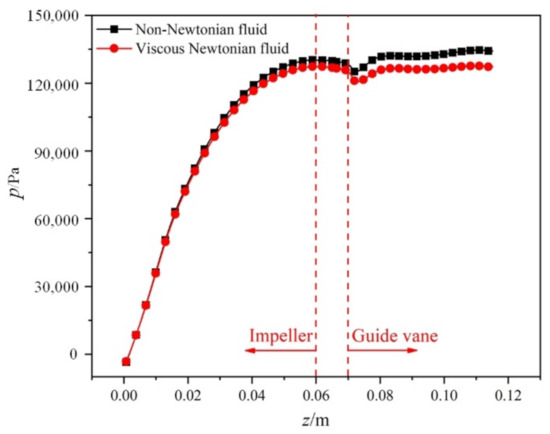
Figure 15.
Comparison of pressure variation.
3.2.3. Influence of Flow Rate
To investigate the influence of flow rate variation on the shear-thinning properties of non-Newtonian fluid, the flow field characteristics under different flow rate conditions (Q = 0.8Qd, 1.0Qd, 1.2Qd) handling non-Newtonian fluid (0.3% CMC solution) are analyzed in this section. The distributions of apparent viscosity, streamline, and TKE are depicted in the following pictures.
Figure 16 displays the distributions of apparent viscosity and streamline on the turbo-surface at 0.50 span under different flow rate conditions. While comparing the distributions of apparent viscosity in the impeller, it is determined that the apparent viscosity in the region near the PS is higher than the SS. Moreover, the difference becomes more visible with the increase in flow rate. This phenomenon is related to the higher velocity gradient near the PS, induced by the rotating effect of the impeller. The rise of the flow rate results in a more obvious velocity gradient in the region near the PS, so the effect of the shear-thinning properties is enhanced.
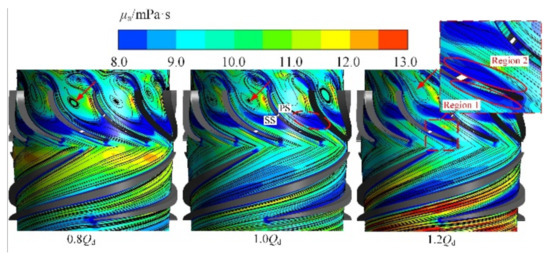
Figure 16.
Distributions of apparent viscosity and streamline.
Considering the guide vane passage, the higher velocity gradient occurs in the leading edge of the guide vane SS, which is caused by the fluid shock. Therefore, there exists a low apparent viscosity region (Region 1). The rising flow rate will lead to higher kinetic energy at the guide vane inlet, so the low apparent viscosity region is expanded accordingly. From the distribution of the streamline, flow separation exists at the leading edge of the PS, which is caused by the inconformity of the blade setting angle and the fluid flow angle. In addition, a larger velocity gradient exists in the flow separation region, resulting in enhanced shear-thinning properties and a low apparent viscosity region (Region 2). Moreover, the flow separation becomes more obvious with the increase in flow rate, so the low apparent viscosity region expands accordingly. It is also found that a larger low apparent viscosity area exists in the middle of the guide vane passage near the SS (marked by the red dashed circle), resulting from the interaction of the separation vortex and the mainstream. The separation vortex shifts downstream with the rise in flow rate (marked by the red arrows in Figure 16), leading to the downstream movement of the low apparent viscosity region.
Figure 17 illustrates the distributions of TKE on the same turbo-surface as previously shown in Figure 16 under different flow rates. While the degree of TKE in the impeller upstream passage decreased with the increase in flow rate, the TKE shows an adverse trend in the downstream passage. In addition, the high TKE region expands with the rise in flow rate, once the fluid starts flowing into the guide vane passage. However, according the previous investigation [35], the high TKE region shrinks as the flow rate rises under viscous Newtonian fluid conditions. The above analysis reveals that the internal flow fields of non-Newtonian fluid are quite different from the Newtonian fluid conditions, so some attention should be paid to this phenomenon in the design process.
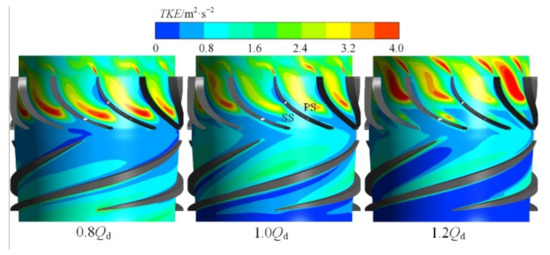
Figure 17.
Distribution of TKE on the turbo-surface (Span = 0.50).
Comparing the distributions of apparent viscosity (Figure 16) and TKE, it can be found that there is good agreement between the distributions of the high TKE region and the low apparent viscosity region. The reason could be attributed to the high TKE value, which results in an increased velocity gradient together with stronger shear-thinning properties. Moreover, the reduction in apparent viscosity results in a higher Reynolds number, and higher TKE at the corresponding position.
3.3. Pump Performance
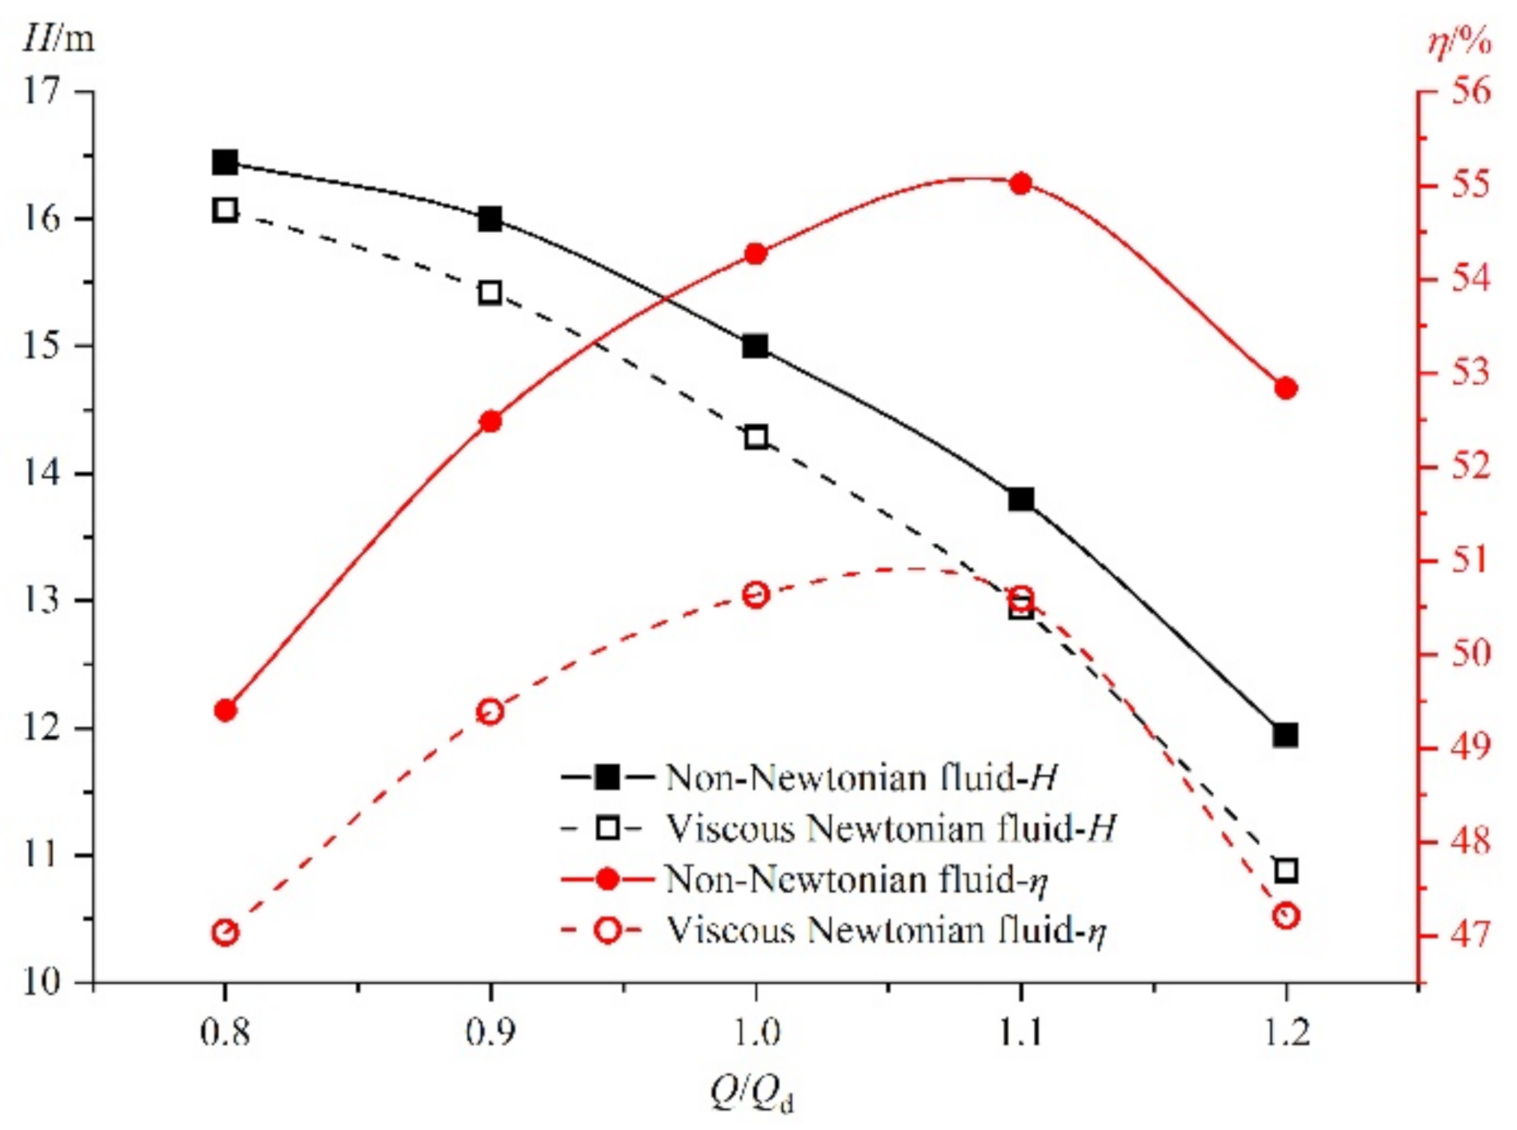
Figure 18 illustrates the pump efficiency and head under different flow rates while handling the non-Newtonian as well as the viscous Newtonian fluids. The results show that the pump performance for the non-Newtonian fluid is higher than the viscous Newtonian fluid. For example, under the design flow rate, the head and efficiency of the pump increased by 4.98% and 7.18%, respectively. According to the investigation in Section 3.2.2, the reduction of apparent viscosity for the non-Newtonian fluid results in increased volume loss (Figure 11) and flow loss induced by flow instability (Figure 13). However, the shear-thinning property also results in the reduction of friction loss (Figure 14). Combining the internal flow field and performance analysis with the two fluid conditions, it can be understood that the fraction loss is the dominant part of the total loss in the axial flow pump. Moreover, the efficiency difference increases with the rise in flow rate, which is caused by the increased relative increment in the tip leakage flow rate (Figure 11) and enhanced shear-thinning properties (Figure 16). It is noteworthy to mention that the pump efficiency varies significantly in the range near the best efficiency point (BEP) for the non-Newtonian fluid, which means that the flow rate range with high efficiency is relatively small. The above phenomenon also reveals that the operation stability weakens with the shear-thinning non-Newtonian fluid transportation.
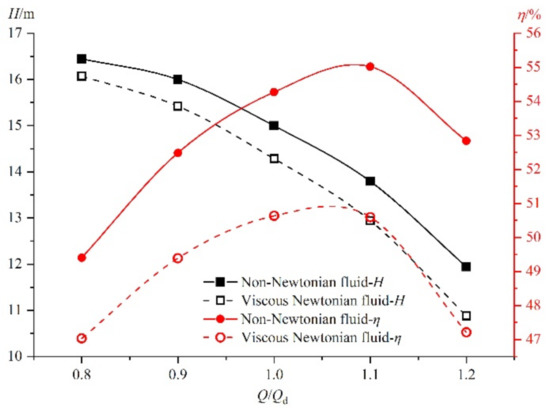
Figure 18.
Performance curves of the pump handling different fluids.
4. Conclusions
In the present work, the energy performance and internal flow field of an axial flow pump under shear-thinning non-Newtonian fluid and viscous Newtonian fluid conditions are studied numerically based on the experimental validation. The main conclusions are as follows:
- (1)
- For the shear-thinning non-Newtonian fluid, the reduction of apparent viscosity occurs mainly in the region of the impeller and guide vane inlets, vaneless area, guide vane outlet, and the near-wall region. In addition, a large velocity gradient is a common feature in these regions.
- (2)
- Shear-thinning properties lead to a higher flow loss and volume loss, but the friction loss is significantly reduced. In addition, friction loss is the main part of the total loss under shear-thinning solution conditions, which is the same with viscous Newtonian fluid conditions.
- (3)
- As the flow rate increases, the low apparent viscosity area near the leading edge of the suction side gradually expands, which is caused by the intensified solution shock. Due to the intensified flow separation, the low apparent viscosity area in the pressure side also shows an increasing trend.
- (4)
- Compared to the viscous Newtonian fluid, the pump head and efficiency could decrease sharply while the shear-thinning non-Newtonian fluid is handled. In addition, the reduction of efficiency is more obvious as the flow rate increases. It is noteworthy to mention that the shear-thinning properties lead to a relatively small flow rate range with high efficiency.
Author Contributions
Conceptualization, W.S.; methodology, W.S.; formal analysis, W.Z.; investigation, W.S.; resources, Z.Y.; writing—original draft preparation, W.S.; writing—review and editing, Z.Y.; supervision, W.Z. All authors have read and agreed to the published version of the manuscript.
Funding
This study was supported by Beijing Municipal Natural Science Foundation (3212021); the Open Research Fund Program of State Key Laboratory of Hydroscience and Engineering (sklhse-2021-E-01); the Open Research Subject of Key Laboratory of Fluid and Power Machinery (Xihua University), Ministry of Education (szjj2019-005); and the National Natural Science Foundation of China (52109107).
Institutional Review Board Statement
Not applicable.
Informed Consent Statement
Not applicable.
Conflicts of Interest
The authors declare no conflict of interest. The funders had no role in the design of the study, in the collection, analyses, or interpretation of data, in the writing of the manuscript, or in the decision to publish the results.
References
- Li, Y.J.; Yu, Z.Y. Distribution and motion characteristics of bubbles in a multiphase rotodynamic pump based on modified non-uniform bubble model. J. Petrol. Sci. Eng. 2020, 195, 107569. [Google Scholar] [CrossRef]
- Zhang, J.S.; Tan, L. Energy performance and pressure fluctuation of a multiphase pump with different gas volume fractions. Energies 2018, 11, 1216. [Google Scholar] [CrossRef] [Green Version]
- Liu, M.; Tan, L.; Xu, Y.; Cao, S.L. Optimization design method of multi-stage multiphase pump based on Oseen vortex. J. Petrol. Sci. Eng. 2020, 184, 106532. [Google Scholar] [CrossRef]
- Kim, J.H.; Lee, H.C.; Kim, J.W.; Choi, Y.S.; Yoon, J.; Yoo, I.; Choi, W. Improvement of hydrodynamic performance of a multiphase pump using design of experiment techniques. J. Fluid Eng.-ASME 2015, 137, 081301. [Google Scholar] [CrossRef]
- Suh, J.W.; Kim, J.W.; Choi, Y.S.; Kim, J.H.; Joo, W.G.; Lee, K.Y. Development of numerical Eulerian-Eulerian models for simulating multiphase pumps. J. Petrol. Sci. Eng. 2018, 162, 588–601. [Google Scholar] [CrossRef]
- Liu, M.; Tan, L.; Cao, S.L. Design method of controllable blade angle and orthogonal optimization of pressure rise for a multiphase pump. Energies 2018, 11, 1048. [Google Scholar] [CrossRef] [Green Version]
- Xu, Y.; Cao, S.L.; Sano, T.; Wakai, T.; Reclari, M. Experimental investigation on transient pressure characteristics in a helico-axial multiphase pump. Energies 2019, 12, 461. [Google Scholar] [CrossRef] [Green Version]
- Liu, N.; Wang, Y.; Zhang, G. The Pump Models Test of the South-to-North Water Diversion Project; China Water & Power Press: Beijing, China, 2006; p. 53. [Google Scholar]
- Bilal, S.; Rehman, M.; Noeiaghdam, S.; Ahmad, H.; Akgül, A. Numerical analysis of natural convection driven flow of a non-Newtonian power-law fluid in a trapezoidal enclosure with a U-Shaped constructal. Energies 2021, 14, 5355. [Google Scholar] [CrossRef]
- Xin, X.K.; Li, Y.Q.; Yu, G.M.; Wang, W.Y.; Zhang, Z.Z.; Zhang, M.L.; Ke, W.L.; Kong, D.B.; Wu, K.L.; Chen, Z.X. Non-Newtonian flow characteristics of heavy oil in the Bohai Bay oilfield: Experimental and simulation studies. Energies 2017, 10, 1698. [Google Scholar] [CrossRef]
- Anastasiou, A.D.; Passos, A.D.; Mouza, A.A. Bubble columns with fine pore sparger and non-Newtonian liquid phase: Prediction of gas holdup. Chem. Eng. Sci. 2013, 98, 331–338. [Google Scholar] [CrossRef]
- Buwa, V.V.; Ranade, V.V. Characterization of dynamics of gas-liquid flows in rectangular bubble columns. Aiche J. 2004, 50, 2394–2407. [Google Scholar] [CrossRef]
- Fan, W.Y.; Li, S.C.; Li, L.X.; Zhang, X.; Du, M.Q.; Yin, X.H. Hydrodynamics of gas/shear-thinning liquid two-phase flow in a co-flow mini-channel: Flow pattern and bubble length. Phys. Fluids 2020, 32, 092004. [Google Scholar] [CrossRef]
- Van Wyk, S.; Prahl Wittberg, L.; Bulusu, K.V.; Fuchs, L.; Plesniak, M.W. Non-Newtonian perspectives on pulsatile blood-analog flows in a 180° curved artery model. Phys. Fluids 2015, 27, 071901. [Google Scholar] [CrossRef]
- Picchi, D.; Correra, S.; Poesio, P. Flow pattern transition, pressure gradient, hold-up predictions in gas/non-Newtonian power-law fluid stratified flow. Int. J. Multiph. Flow 2014, 63, 105–115. [Google Scholar] [CrossRef]
- Gabelle, J.C.; Morchain, J.; Anne-Archard, D.; Augier, F.; Liné, A. Experimental determination of the shear rate in a stirred tank with a non-newtonian fluid: Carbopol. Aiche J. 2013, 59, 2251–2266. [Google Scholar] [CrossRef]
- Story, A.; Jaworski, Z.; Simmons, M.J.; Nowak, E. Comparative PIV and LDA studies of Newtonian and non-Newtonian flows in an agitated tank. Chem. Pap. 2018, 72, 593–602. [Google Scholar] [CrossRef] [PubMed] [Green Version]
- Cortada-Garcia, M.; Dore, V.; Mazzei, L.; Angeli, P. Experimental and CFD studies of power consumption in the agitation of highly viscous shear thinning fluids. Chem. Eng. Res. Des. 2017, 119, 171–182. [Google Scholar] [CrossRef]
- Wang, X.; Feng, X.; Yang, C.; Mao, Z.S. Energy Dissipation rates of Newtonian and Non-Newtonian fluids in a stirred vessel. Chem. Eng. Technol. 2014, 37, 1575–1582. [Google Scholar] [CrossRef]
- Torres, M.D.; Gadala-Maria, F.; Wilson, D.I. Comparison of the rheology of bubbly liquids prepared by whisking air into a viscous liquid (honey) and a shear-thinning liquid (guar gum solutions). J. Food Eng. 2013, 118, 213–228. [Google Scholar] [CrossRef]
- Sun, W.H.; Tan, L. Cavitation-vortex-pressure fluctuation interaction in a centrifugal pump using bubble rotation modified cavitation model under partial load. J. Fluids Eng.-ASME 2020, 142, 051206. [Google Scholar] [CrossRef]
- Li, Y.J.; Yu, Z.Y.; Sun, W.H. Drag coefficient modification for turbulent gas-liquid two-phase flow in a rotodynamic pump. Chem. Eng. J. 2021, 417, 128570. [Google Scholar] [CrossRef]
- Zhang, W.W.; Zhu, B.S.; Yu, Z.Y. Characteristics of bubble motion and distribution in a multiphase rotodynamic pump. J. Petrol. Sci. Eng. 2020, 193, 107435. [Google Scholar] [CrossRef]
- Aldi, N.; Buratto, C.; Pinelli, M.; Spina, P.R.; Suman, A.; Casari, N. CFD analysis of a non-Newtonian fluids processing pump. Energy Procedia 2016, 101, 742–749. [Google Scholar] [CrossRef]
- Donmez, M.; Yemenici, O. A numerical study on centrifugal pump performance with the influence of non-Newtonian fluids. Int. J. Sci. 2019, 8, 39–45. [Google Scholar] [CrossRef]
- Shi, Y.; Zhu, J.J.; Wang, H.Y.; Zhu, H.W.; Zhang, J.C.; Zhang, H.Q. Experiments and mechanistic modeling of viscosity effect on a multistage ESP performance under viscous fluid flow. Proc. Inst. Mech. Eng. Part A J. Power Energy 2021, 235, 1976–1991. [Google Scholar] [CrossRef]
- Li, W. Effects of viscosity of fluids on centrifugal pump performance and flow pattern in the impeller. Int. J. Heat Fluid Flow 2000, 21, 207–212. [Google Scholar] [CrossRef]
- Ofuchi, E.M.; Stel, H.; Sirino, T.; Vieira, T.S.; Ponce, F.J.; Chiva, S.; Morales, R.E.M. Numerical investigation of the effect of viscosity in a multistage electric submersible pump. Eng. Appl. Comp. Fluid 2017, 11, 258–272. [Google Scholar] [CrossRef] [Green Version]
- Valdés, J.P.; Becerra, D.; Rozo, D.; Cediel, A.; Torres, F.; Asuaje, M.; Ratko-vich, N. Comparative analysis of an electrical submersible pump’s performance handling viscous Newtonian and non-Newtonian fluids through experimental and CFD approaches. J. Petrol. Sci. Eng. 2020, 187, 106749. [Google Scholar] [CrossRef]
- Sun, W.H.; Yu, Z.Y.; Zhang, K.; Liu, Z. Analysis of tip clearance effect on the transportation characteristics of a multiphase rotodynamic pump based on the non-uniform bubble model. Fluids 2022, 7, 58. [Google Scholar] [CrossRef]
- Menter, F.R. Two-equation eddy-viscosity turbulence models for engineering applications. AIAA J. 1994, 32, 1598–1605. [Google Scholar] [CrossRef] [Green Version]
- Hajmohammadi, M.R.; Salman Nourazar, S.; Campo, A. Analytical solution for two-phase flow between two rotating cylinders filled with power law liquid and a micro layer of gas. J. Mech. Sci. Technol. 2014, 28, 1849–1854. [Google Scholar] [CrossRef]
- Liu, Y.B.; Tan, L. Theoretical prediction model of tip leakage vortex in a mixed flow pump with tip clearance. J. Fluid Eng.-ASME 2020, 142, 021203. [Google Scholar] [CrossRef]
- Yu, Z.Y.; Zhang, W.W.; Zhu, B.S.; Li, Y.J. Numerical analysis for the effect of tip clearance in a low specific speed mixed-flow pump. Adv. Mech. Eng. 2019, 11, 1–12. [Google Scholar] [CrossRef] [Green Version]
- Liu, M.; Tan, L.; Cao, S.L. Influence of viscosity on energy performance and flow field of a multiphase pump. Renew. Energy 2020, 162, 1151–1160. [Google Scholar] [CrossRef]
- Simão, M.; Pérez-Sánchez, M.; Carravetta, A.; Ramos, H. Flow conditions for PATs operating in parallel: Experimental and numerical analyses. Energies 2019, 12, 901. [Google Scholar] [CrossRef] [Green Version]


Publisher’s Note: MDPI stays neutral with regard to jurisdictional claims in published maps and institutional affiliations. |
© 2022 by the authors. Licensee MDPI, Basel, Switzerland. This article is an open access article distributed under the terms and conditions of the Creative Commons Attribution (CC BY) license (https://creativecommons.org/licenses/by/4.0/).