Article

Multi-Fidelity Combustor Design and Experimental Test for a Micro Gas Turbine System

by
Yize Liu
1,*,
Theoklis Nikolaidis
1,
Seyed Hossein Madani
2,
Mohammad Sarkandi
2,
Abdelaziz Gamil
1,
Muhamad Firdaus Sainal
2 and
Seyed Vahid Hosseini
3
1
Centre for Propulsion Engineering, School of Aerospace Transport and Manufacturing (SATM), Cranfield University, Cranfield MK43 0AL, UK
2
Samad Power Ltd., Milton Keynes MK11 3JB, UK
3
School of Engineering and Computer Science, University of Hertfordshire, Hatfield AL10 9AB, UK
*
Author to whom correspondence should be addressed.
Energies 2022, 15(7), 2342; https://doi.org/10.3390/en15072342
Submission received: 24 February 2022 / Revised: 18 March 2022 / Accepted: 21 March 2022 / Published: 23 March 2022
(This article belongs to the Section I2: Energy and Combustion Science)

Abstract

:
A multi-fidelity micro combustor design approach is developed for a small-scale combined heat and power CHP system. The approach is characterised by the coupling of the developed preliminary design model using the combined method of 3D high-fidelity modelling and experimental testing. The integrated multi-physics schemes and their underlying interactions are initially provided. During the preliminary design phase, the rapid design exploration is achieved by the coupled reduced-order models, where the details of the combustion chamber layout, flow distributions, and burner geometry are defined as well as basic combustor performance. The high-fidelity modelling approach is then followed to provide insights into detailed flow and emission physics, which explores the effect of design parameters and optimises the design. The combustor is then fabricated and assembled in the MGT test bench. The experimental test is performed and indicates that the designed combustor is successfully implemented in the MGT system. The multi-physics models are then verified and validated against the test data. The details of refinement on lower-order models are given based on the insights acquired by high-fidelity methods. The shortage of conventional fossil fuels and the continued demand for energy supplies have led to the development of a micro-turbine system running renewable fuels. Numerical analysis is then carried out to assess the potential operation of biogas in terms of emission and performance. It produces less NOx emission but presents a flame stabilisation design challenge at lower methane content. The details of the strategy to address the flame stabilisation are also provided.

1. Introduction

Availability of energy and electrical supplies are among the challenging issues in certain areas of the world. The development of efficient, flexible, and low-cost energy systems can contribute significantly to several social, industrial, and economical aspects in these regions. Microturbine MGT is a promising technology for small-scale combined heat and power CHP systems. It offers the advantages of high fuel flexibility, low operational costs, reduced vibration and noise levels, and clean emissions [1]. The combustor is a crucially important component, where the chemical energy of the fuel is converted to thermal energy for electric power generation and space heating [2].
The design of a microturbine combustor is a challenging task as it has to meet numerous performance and operational requirements in the compact space. Multi-fidelity combustor design tools are of great importance as they allow rapid design solutions exploration and avoid the “trial and error” that adds a great expense of time and cost to the product development process. In the public domain literature, the design tools have been developed for large aero combustors. Liu et al. developed a design tool for a lean-burn aero combustor. The tool combines with the genetic algorithm to enable multi-objective optimisations at the combustor early development stage [3]. Angersbach et al. presented a combustor design tool that combines the industrial in-house design rules with a CFD solver. The tool provides 1D design feature and up to 3D combustor flow field for a rich burn aero combustor [4]. Foust described the development of a twin-annular-premixing-swirler combustor. Design optimisation is performed using CFD analysis along with test validation to optimise pilot and main premixing for low NOx, and the mixer design to avoid autoignition and flashback [5]. Pegemanyfar et al. developed a design system for a rich-burn low-emissions aero combustor. The detailed postprocessing CFD analysis was conducted on flow distribution and liner configuration to optimise the combustor altitude relight performance and emissions [6]. Major engine manufacturers have developed proprietary design programs based on the tests and simulation data to assist their combustor development [7].
Compared to larger combustors, the MGT combustor has a low Reynolds number but with a higher surface to volume ratio. In addition, it has a more stringent requirement for the maximum allowable pressure loss. Ji presented a systematic design methodology for a micro-gas-turbine-based range extender and explored its feasibility for electric vehicles. The power of the MGT is close to 12 kW and the combustor is an annular type [8]. Visser et al. developed a recuperated MGT for micro-CHP applications. An aerodynamically stabilised flame combustor is designed to achieve high combustion completeness and low pressure loss. The common engineering method is used to conduct the preliminary design [9]. Ibrahim designed an MGT combustion chamber through software simulations. The swirlers are not used in the initial design and the flame is sustained by the jet through the liner holes [10]. Bazooyar presented a design procedure and conducted performance analysis for a trapped-vortex micro combustor. Empirical correlations are used in the MGT preliminary design [11]. CR Liu reveals the design and modelling details of a micro can combustor supplied with methane and syngas fuels. The modified combustor geometry resolves the flame stabilisation and cooling issues [12]. Abagnale et al. optimised the combustor configuration using a numerical method to control the NOx and CO emissions. The combustor is a reversed flow annular combustor [13]. Research and development have also led to different types of micro gas turbine combustors using various numerical and experimental approaches. Swirl-stabilised flame MGT combustors are developed based on numerical modelling and experimental testing to investigate the emission and flame characteristics [14,15,16]. There is another combustor concept: vaporiser-tube combustors used in MGT applications [17]. The premixing chamber dimension is determined using the correlation-based approach. Numerical modelling is also used to support the research by investigating the temperature distribution at the combustor outlet [18].
The shortage of conventional fossil fuels and the continued demand for energy supplies have led to the development of a micro-turbine system running renewable fuels. Nipey conducted the experimental test to evaluate MGT performance burning mixtures of biogas and natural gas. The test shows that the main MGT performances are not significantly changed with the biogas content in terms of power output and electric efficiency [19]. The performance analysis of a biogas-fuelled MGT system is conducted based on a validated thermodynamic model. The results showed the viability of the MGT in biogas application [20]. To realise a dual-fuel operation in MGT, a noninvasive and cost-effective approach was proposed to enable feeds of biogas to the premixed flames, and diffusion flames supplied with natural gas [21].
In comparison with the previous studies, the contributions and motivation of the present research are as follows:
  • Studies usually rely on empirical-based approaches during the MGT combustor preliminary design phase. In this research, a combined analytical, parameter-based, physics-based, and empirical-based approach was developed and integrated into the whole design framework, which aims to shorten the design cycle and improve the accuracy of the MGT combustor modelling at the early design stage.
  • In the process of the MGT combustor design utilising the multi-fidelity approach, the underlying interactions between different approaches are not explored in great detail in the public domain literature. Specifically, the refinement process of the reduced-order method through high-fidelity methods are not greatly revealed. This is to be investigated in the research.
In this paper, a multi-fidelity design is performed on an MGT system that generates 12 kW of power and 200 kW of heat simultaneously. The developed combustor is a swirl-stabilised, multi-point injection type. The overall methodology for the combustor design and modelling is initially presented. The main preliminary design involves the definitions of design parameters, combustion chamber layout, flow distributions, and burner geometries. Combined approaches, as well as design procedures and criteria, are provided in detail. The high-fidelity numerical methods are also integrated to provide detailed modelling and analysis, which produces the optimum solution. The designed combustor is then manufactured, and an MGT system is constructed to test and verify the design. The experimental test is conducted and confirms that the designed combustor is successfully implemented at the desired working conditions. The developed design and modelling approach are then validated against the test data. Suggestions of refinement for low-order models are provided. The shortage of fossil fuels and continuous demand for energy supplies has led to the development of a microturbine system operating renewable fuels. The effects of renewable fuel on combustor performance and emissions are also investigated by the verified numerical approaches. The design strategies to address the flame stabilisation issue are explored.

2. Design Framework Overview

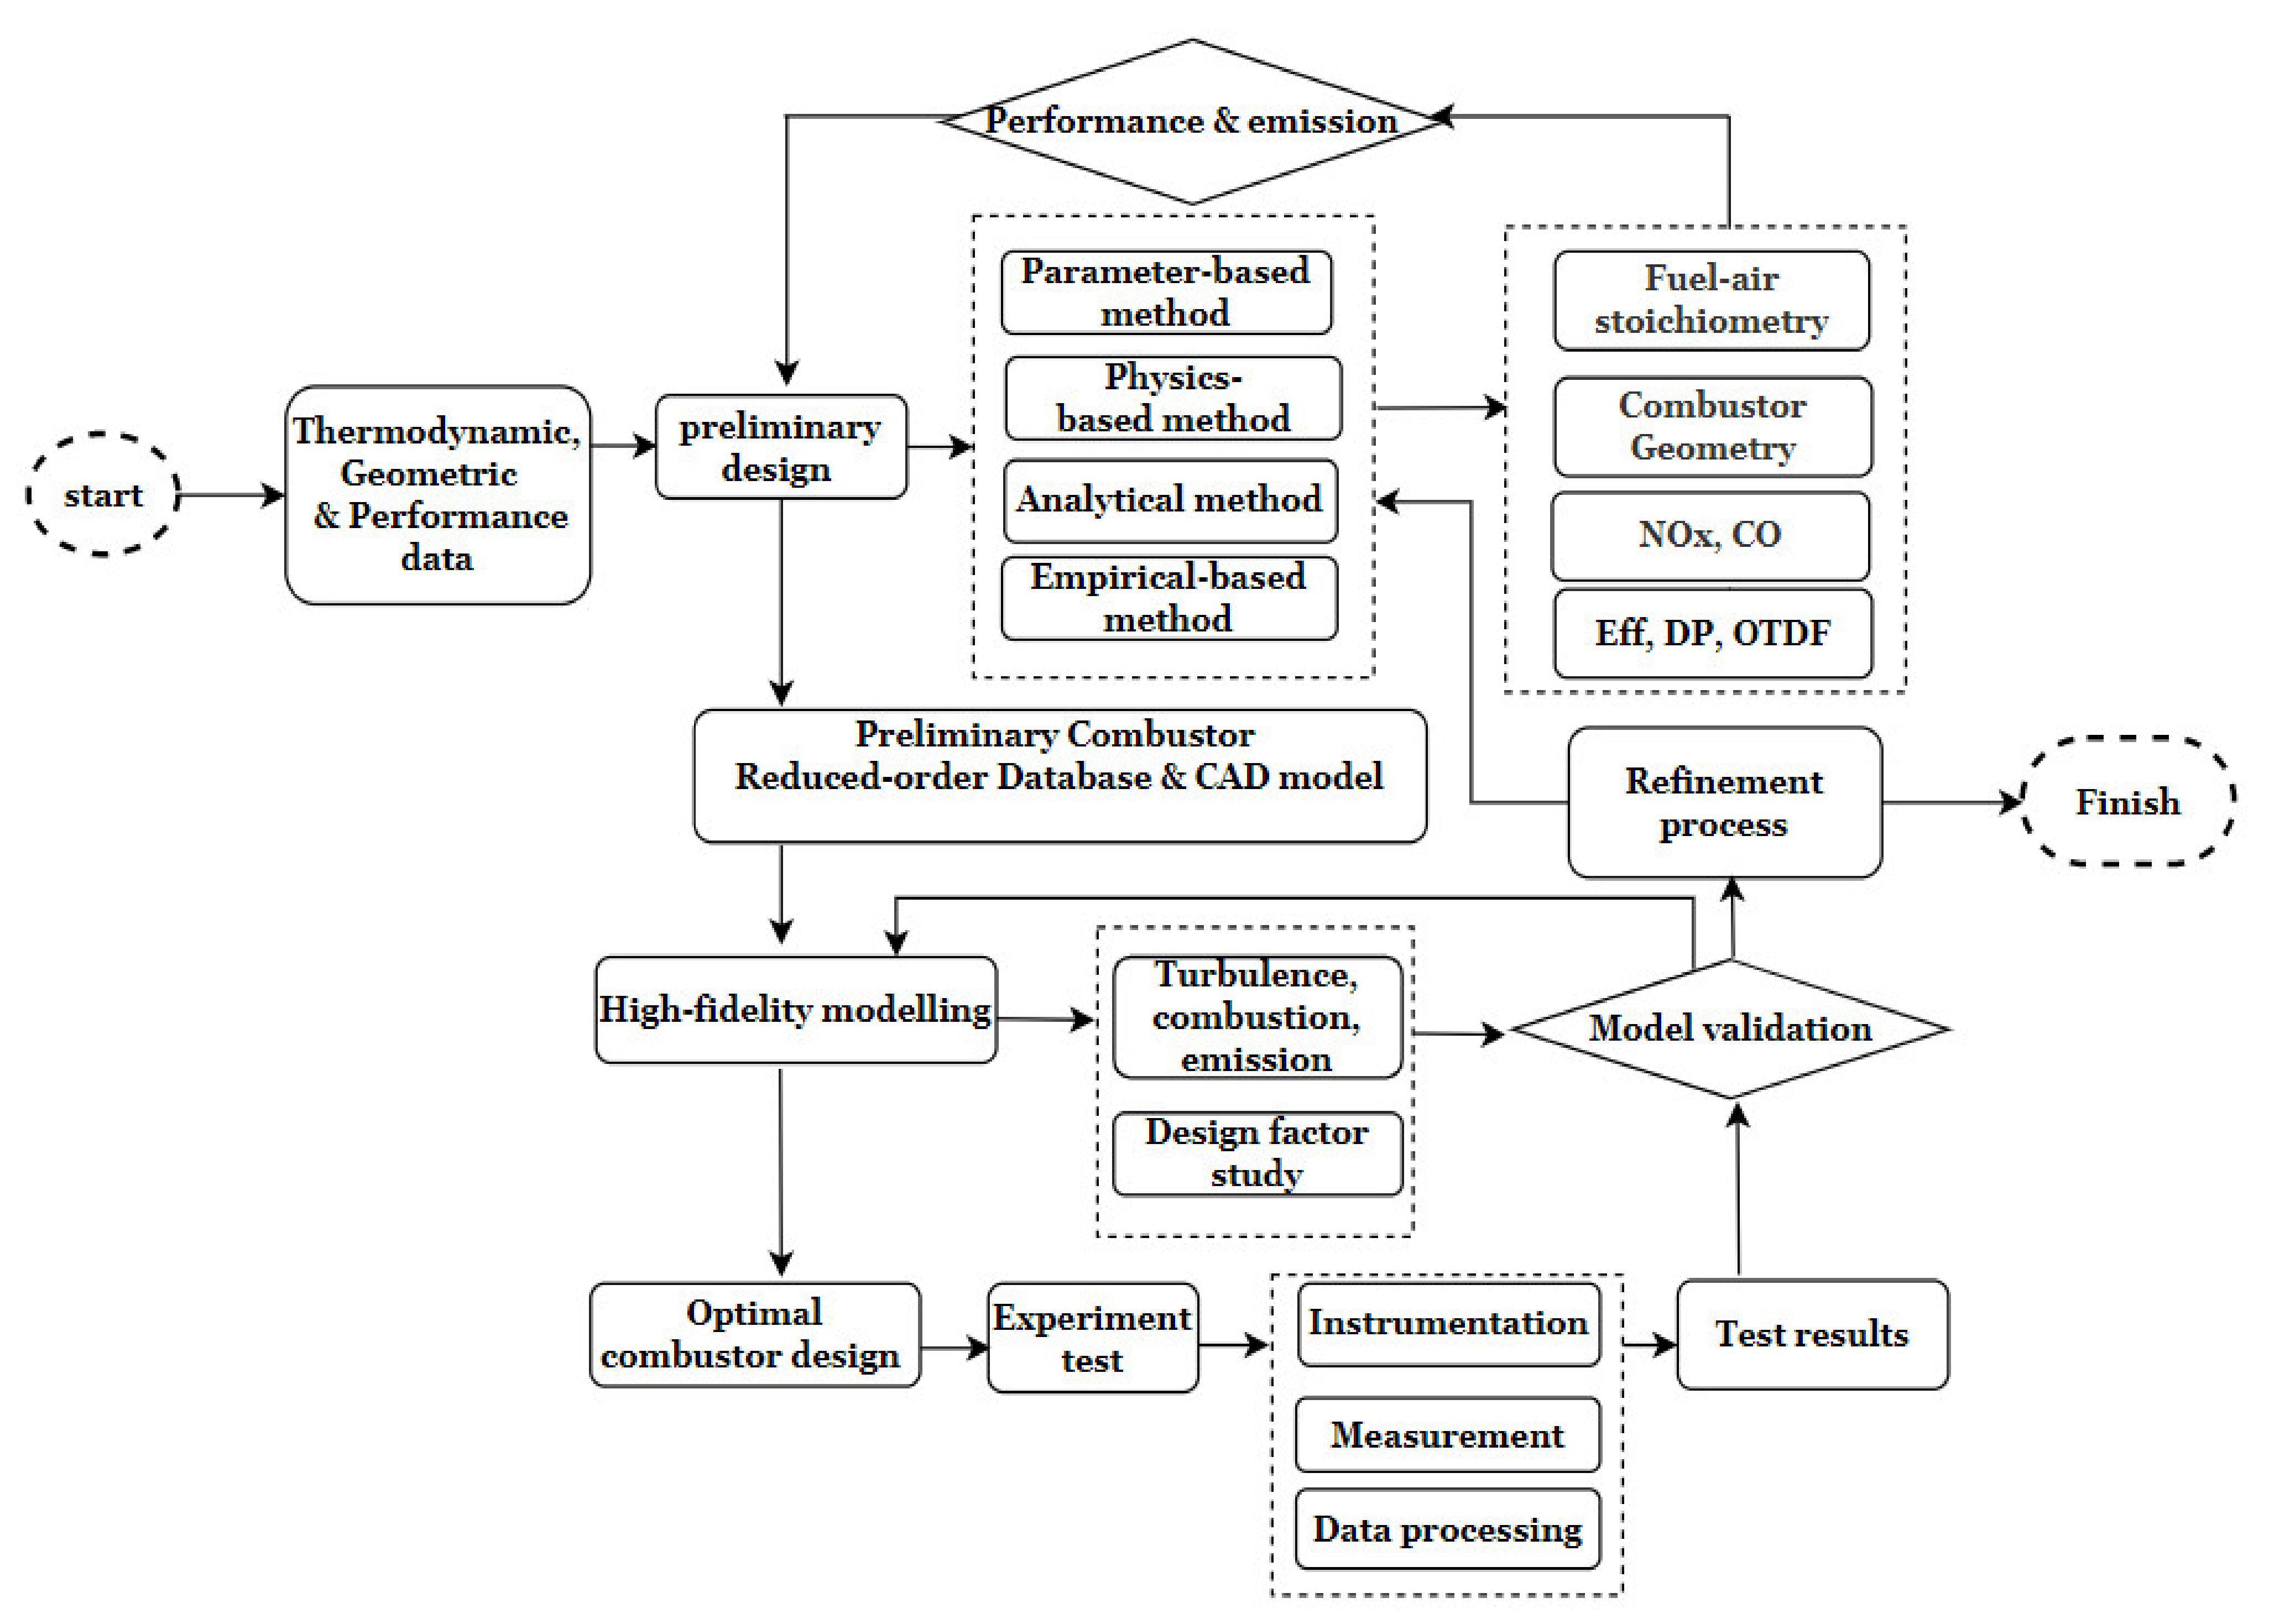
The overview of the multi-fidelity design and modelling approach is presented in Figure 1. Three sets of input data are required to initialise the design process based on MGT thermodynamic cycle analysis, design targets, and geometric limitations. It starts with the preliminary design phase. An in-house preliminary design tool was developed. It defines the initial details of MGT combustor layout, fuel–air stoichiometry, liner hole, and fuel burner. Moreover, the integrated in-house design system including a physics-based method, analytical, and empirical approaches are coupled to evaluate emission, combustion efficiency, pressure drop, and outlet temperature distribution factor based on the flow distribution and geometric data. Adjustment of the design variables is necessary to ensure that for the combustor, the basic performance targets are achieved. Furthermore, the computed combustor dimensions are checked against the geometric constraints imposed by the turbomachinery design.
Once the preliminary design is completed, the resulting design and geometric information restored in the reduced-order model database is transferred to the CAD tool where a three-dimensional geometry is generated. Moreover, the database is further transferred to ANSYS 19.1 Fluent solver for a comprehensive high-fidelity analysis. It comprises the modelling of turbulence flow, mixing characteristics, combustion reaction, and emission formation. Moreover, the design factors that are not fully modelled in the preliminary stage are identified, and their effects on combustor performance are investigated in detail. Volumetric grids are generated on the defined computational domain. The boundary conditions are imposed based on predetermined thermodynamic information in the preliminary design phase. The governing equations are defined to solve for energy and mass balances. The insight provided by the high-fidelity modelling explores the effect of design parameters on combustor performance and enables the combustor tunning process.
In the final phase, the combustor design is evaluated through experimental testing. The MGT test bench is designed to allow it to be conducted at full scale and real microturbine operating conditions. Moreover, the designed test bench is flexible to enable testing of different combustor geometries (if required). The instrumentation techniques are applied to measure the combustor and MGT performance. In this case, the mass flow, temperature, pressure, and emissions are thoroughly evaluated. The data generated from the rig test are used to verify and validate the multi-physics approaches. At the same time, the refinement process on reduced-order models can be realised based on the insights acquired by verified high-fidelity models, which increases the model robustness and allows the first-order accurate design of an MGT combustor system at the early stage of the whole design process.

3. MGT Combustor Preliminary Design

A dedicated in-house preliminary design tool for the MGT combustor was developed. The detailed preliminary design procedure is shown in Figure 2. Three categories of data are required to initialise the design process (Table 1): Thermodynamic parameters: combustor air inlet/outlet pressure, temperature, and the mass flow determined by the MGT cycle calculations based on the power output requirement. The fuel type is also defined. The current MGT is fed by natural gas. Renewable fuel is also investigated. Geometric parameters: The inlet and outlet geometric boundary generated by the turbomachinery design. Moreover, the geometric constraints of the combustor design space are imposed based on the MGT size limitations. Performance parameters: The designed combustion chamber is expected to satisfy certain performance targets, including high combustion efficiency, low pressure drop, emissions, and outlet temperature distribution factor.
The type of the combustor is a primary design concern for initialising the layout definition. In the present work, a single-can version is developed based on manufacturing simplicity, ease of access to components, simple thermal management, and reduced cost requirements.
The design begins with fuel–air stoichiometry calculations. The actual flow distribution is determined based on the zonal equivalence ratio φ i in (1). The dome flow is divided into swirling air, head cooling, and primary mixing jet. The remaining flow splits include secondary jet and dilution air. The determination process considers a trade-off between the high combustion completeness and maximum permitted flame temperature for NOx production.
w t = i = 1 i W f i F A R s φ i
where w t is the total air mass flow, W f i is fuel flow, F A R s is the stoichiometric fuel–air ratio, and φ i is the zonal equivalence ratio.
The main procedure used for obtaining the chamber dimension is a parameter-based approach: intensity factor (2) that takes account of combustor thermodynamic parameters and fuel information. The length of the zonal chamber is computed based on sufficient length for primary zone recirculation flow establishment, the length required for secondary hole mixing, and the low outlet temperature distribution factor.
I = W f   η   Q V c   P
where V c is the chamber volume and Q is the fuel lower heating value.
The next design procedure concerns the fuel burner. To mitigate the risks of flame flashback and dynamic issues, diffusion-based combustion is considered in this design. The flame aims to be stabilised via a fuel burner that consists of a fuel nozzle and a swirl generator. A multi-point gas nozzle is designed to improve the fuel–air mixing and minimise emissions. The fuel nozzle orifices are arranged circumferentially, and the total orifice dimension is determined based on the fuel flow rate and fuel pressure differential. In this case, the fuel pressure differential is 10% of the combustor inlet total pressure. The single orifice dimension is then obtained based on the assumed orifice number.
A radial-type swirl generator is considered in this design. Flat vane blades are used and circumferentially mounted on the injector head with equal spacings. The gap between the swirler hub and the fuel nozzle is 1.5 mm. The swirler outer diameter is around 75% of the combustor inlet diameter. The geometries of the swirler area and the axial swirler width are defined based on the precalculated swirling flow, swirler arrangement, and permitted pressure drop. The main design objective is to achieve sufficient swirling strength to establish central recirculation flow to sustain the flame as well as enhance rapid fuel–air mixing. The swirling strength is characterised by swirl number SN ((3) [22]), which is mainly dependent on flow Reynolds number, vane blade θ angle, and number N .
S N = C 1 R e 1 1 ψ t a n θ 1 + t a n θ t a n π / N
The liner holes design can be initiated as soon as the air and gas thermodynamic data become available. By specifying the hole type, the hole dimensions are determined based on the pressure drop and flow coefficient (4). For dilution holes design, the main design criteria are jet penetration and mixing that are governed by a crucial design parameter, momentum flux ratio, J [23]. The liner hole geometry is updated with a new iterated air mass.
A h = i = 1 i = n W i C D i 2 ρ Δ P 0.5
where W i is the zonal air mass flow and C D i is the flow coefficient.
For the MGT emission evaluation at the preliminary design phase, the correlation-based approaches are not applicable: empirical terms are specific to certain combustor applications, and parameters used in the semi-empirical are challenging to fully define. CFD simulations require a long computational time and high cost. Instead, the physics-based method is deemed to be the most suitable approach. The modelling algorithm is developed and integrated into the current preliminary design framework. The method concerns the influence of different levels of flow mixing on a chemical reaction within the prescribed volume. Different types of reactors are developed based on the flow mixing characteristics. In the developed model, the perfectly stirred reactor (PSR) regards the mixing as instantaneous, uniform, and ideal. Thus, the temperature and species mass/concentration are computed based on the gas mixture fraction f m and flow residence time inside the reactor.
f m = W f W m
The gas mixture fraction inside each reactor can be obtained from the flow distribution procedure defined in (1). W m is the gas mixture mass flow rate.
The partially stirred reactor (PaSR) assumes the mixing takes place at the micro-level with no intermixing between pockets and all fluid elements containing different speeds. Thus, this reactor is used to model the inhomogeneous mixing effect. Inside the PaSR, the mean quantities, including temperature and species mass/concentrations T ¯ , M ¯ i   , can be computed from the probability density functions as an average over all of the states:
T ¯ , M ¯ i = 0 1 p f m   ( T , M i )   ( f )   d f m
p is the probability density function that is derived from clipped Gaussian distribution. To fully define the probability profile, the deviation σ is required and obtained by an empirical mixing parameter S .
S = σ f m
The reactor is then formulated at each liner zone, and a two-dimensional network is generated to link each element to represent the physical features and chemical reaction of the combustion chamber.
To model NOx emissions, the governing mechanism ((8)–(10)) for thermal NOx formation is specified as follows:
N 2 + O N O + N  
N + O 2   N O + O
N + O H N O + H
and prompt NOx formations where the main reaction routes ((11)–(14)) are expressed as
N 2 + C H N + H C N
N + O 2   N O + O
H C N + O H C N + H 2 O
C N + O 2 N O + C O
The formation of CO is initially originated from the combustion of the fuel that reacts to CO and H2O. Then, the main reaction to govern the conversion rate of CO is given as
C O + O H C O 2 + H
During the preliminary design phase, empirical correlations are widely used to evaluate combustion efficiency [18,24]. However, these well-known correlations are not applicable in the analysis of MGT burners, as they were developed for large aero combustors. The study aims to improve the modelling accuracy by performing detailed gas composition analysis. In this analysis, the volumetric concentrations of incomplete and complete combustion products (i.e., CO and CO2) are computed at the combustor outlet using the physics-based method described above. CH4 is set to be the fuel in this analysis. Thus, the efficiency level is expressed as:
η = 1 Q c o C O + Q C H 4 C H 4 Q f u e l C O 2 + C O + C H 4 × 100 %
where Q c o   Q C H 4 , Q f u e l   are lower heating values in kJ/kmol.
The pressure loss analysis is conducted utilising the analytical approach. The overall combustor pressure loss consists of cold loss and fundamental loss due to combustion. In addition to the cold loss due to flow through the liner holes (17), in this MGT combustion chamber, a truncated divergent cone is added to accommodate the connections of combustor entry. Thus, the cold loss due to inlet duct geometric expansion is also taken into account (18). The fundamental loss is derived from the momentum considerations, and the density variation can be approximated by temperature variations (19). Therefore, the overall pressure loss is the sum of the losses specified as
Δ P L P 3 = R 2 w T 0.5 A h e P 3 2
where A h e is effective hole area.
Δ P i P 3 = 1 A i A c 2 1 ( 1 + γ 1 2 M i 2 ) γ γ 1
where M i is Mach number at the inlet section, A i , A c denotes inlet and casing area.
Δ P H P 3 = 1 2 ρ C 2 T 4 T 3 1 / P 3  
where ρ ,   C is flow density and velocity.
The uniformity of the temperature distribution at the outlet of the combustion chamber directly affects the durability of the turbine. The outlet temperature distribution factor (OTDF) is used to quantify the temperature distribution and is defined in (20): the ratio of the difference between the peak and mass flow weighted mean temperature at the combustor outlet plane to the combustor mean temperature rise. To estimate OTDF at the preliminary design stage, the two parameters in (20), liner dimensions and pressure drop [25], are utilized to estimate OTDF at the preliminary design stage.
O T D F = T m T o T o T i = f L D × Δ P L q r e f
where T m is maximum outlet temperature, T i and T o are inlet and outlet mass flow weighted mean temperatures, L is the liner length, D is liner diameter, Δ P L is liner pressure drop, and q r e f is the reference dynamic head.
Finally, the iteration loop is formed by adjusting the combustor geometric design variables and zonal fuel–air stoichiometry. The iterative process will proceed until the design meets the efficiency, pressure drop, emission, and OTDF requirements.

4. High-Fidelity Modelling

The detailed procedure for high-fidelity modelling is presented in Figure 3.
The initial step is to gain more physical insight into the performance of the designed MGT combustor through the modelling approach of turbulence, combustion, and emission. In this study, the details of turbulent flow pattern, flame shape, fuel–air mixing characteristics, temperature/pressure distribution, and emission characteristics are investigated.
The three-dimensional steady-state Reynolds averaged Navier–Stokes (RANS) simulations are performed for high-fidelity modelling using ANSYS Fluent 19.1 solver. For turbulence modelling, the two-equation model was implemented to determine turbulence length and time scale by resolving two separated transport equations. The k- ε model was considered since it is a robust and well-tested model that is widely applied in industrial flow simulations [26].
The realizable k- ε model was chosen as it provides superior performance to standard k- ε in modelling flow separation, strong streamline curvature, and secondary flow features [27]. Thus, the transport equations for k and ε in the model are expressed as:
t ρ k + x j ρ k u j = x j μ + μ t μ k k x j + G K + G b ρ ε Y M + S K
t ρ ε + x j ρ ε u j = x j μ + μ t σ ε ε x j + ρ C 1 S ε ρ C 2 ε 2 k + v ε + C 1 ε ε k C 3 ε G b + S ε
where G K , G b are the generation of turbulence kinetic energy due to mean velocity gradient and buoyancy, respectively. The definition of Y M ,   S K , C 1 ,     S ε can be found in Ref. [27].
For combustion modelling, a flamelet-generated manifold approach was implemented to model the chemistry in the reacting turbulent flow field. The chemistry is characterised by mixture fraction f and progress variable c [28]. Thus, the mean thermochemical quantities are computed from (23):
φ ¯ = φ c , f P c , f   d c   d f
where φ ¯   is the mean thermochemical quantities.
Therefore, governing equations are solved for mass, momentum, energy, mixture fraction, mixture fraction variance, reaction progress, and reaction progress variance. Non-adiabatic FGM was considered to take account of the heat loss effect. The GRImech 3.0 mechanism was used to initiate the flamelet generation and model the chemical reactions. The mechanism consists of 53 species and 352 reactions [29].
For emissions modelling, the main governing formation mechanisms for NOx (thermal and prompt NOx) and CO remain similar to the physics-based approach in the preliminary design. For NOx modelling, the method suggests that NOx forms more slowly than other high energy-releasing reactions. Thus, NOx calculations can be decoupled from the main reacting flow simulations. In this case, the post-processing technique is adopted via the use of the decoupled NOx model in the Fluent solver, and the temperature and species are obtained from the converged reacting flow simulations.
The next procedure for high-fidelity modelling is to identify the design factors that are not fully modelled in the preliminary stage. Chamber dimension, dome front configuration, number of fuel nozzle orifice, and dilution hole arrangement are identified and their effects on combustor performance are investigated in detail. In the preliminary design model, the chamber dimension is derived using the parameter-based approach. High-fidelity modelling is conducted to determine the optimum value of the parameter by analysing the combustion completeness at the design point through the gas composition analysis. Moreover, combustion at the off-design point is also assessed to confirm whether the determined chamber dimension is able to sustain the combustion at lower temperatures/pressures. In the preliminary design phase, the effect of the dome front configuration is not taken into account. The high-fidelity analysis considers the different dome configurations that consist of various dome shapes and primary zone mixing hole arrangements. Flow patterns and combustion characteristics are examined. In the preliminary design model, the fuel nozzle orifice dimension is obtained based on the assumed orifice number.
To investigate the effect of orifice number on fuel–air mixing, a new nondimensional parameter γ (24) is introduced to quantify the uniformity of the fuel distribution at defined surface locations. The higher the value of γ , the more enhanced the degree of uniform mixing that can be attained. By definition, when the fuel and air are perfectly mixed, the value can reach up to 1. The effect of the orifice number on emission characteristics is also studied.
γ = 1 i = 1 n V i V ¯ A i 2 V ¯ i = 1 n A i
V ¯ = i = 1 n V i A i i = 1 n A i
where V i is the species variable, and V ¯ is averaged value of V i at the entire surface i = 1 n A i .
In the preliminary design model, dilution hole designs are performed based on two main design criteria: mixing and jet penetration. The two resulting dilution hole arrangements are to be assessed via the temperature and emission analysis in the high-fidelity modelling.
Then, the procedure proceeds with the detailed modelling strategy phase where computational domain, grid generation, and boundary conditions are all defined.
The computational domain was established via the creation of a three-dimensional combustor geometry. The airflow enters the combustor through the inlet circular section specified as the domain inlet. A fraction of the air enters the injector-swirler assembly and the remaining air passes through the annulus between the liner and air casing. Combustion is formed inside the liner, and the hot burned gas exits the truncated convergent conical section (domain outlet) to drive the turbine wheel. The entire computational domain was set to be fluid in the simulations.
A hybrid grid-generation strategy was implemented to discretise the computational domain. The tetrahedral elements were created in the zones of fuel injectors, swirlers, and combustor holes where the geometries are relatively complex. For regular geometry such as inlet duct, casing passage, and liner, the hexahedra grids were dominant. Grid sensitivity analysis was performed by examining different numbers of the grid. No significant changes in the results of simulations were observed with a grid number of 8 million. Thus, the number was used in the subsequent analysis.
The defined boundary conditions are listed in Table 2. Mass flow inlet conditions were applied at air and fuel inlets. The mean mixture fraction at the fuel inlet is unity. The directions of inlet flow were set normal to the boundaries. At the combustor outlet, atmospheric static pressure was imposed. No-slip stationary wall condition was imposed at the walls.
The main performance criteria are then defined to determine the optimal combustor geometry. The details are listed below:
  • Combustion stability at design and off-design conditions; flame dynamic issues have to be controlled.
  • Low pressure loss to maintain the high MGT cycle efficiency.
  • Desired flow pattern (i.e., well-generated recirculation flow in the primary zone, etc.).
  • Desired flame shape (i.e., avoid direct flame contact to the liner wall to cause the liner cooling durability challenge).
  • Reduced emissions (NOx and CO).
  • Accepted outlet temperature distribution factor.
Based on the above criteria, the final optimal combustor design is produced. The validation of the modelling approach is then conducted by comparing the simulation results with the measured data obtained from the experimental test. The details of the rig setup are presented in Section 6.
In the final phase, the results from the validated high-fidelity modelling are then used to generate customised methods to refine the low-order model in the initial preliminary design. The details are presented in Section 7.2.

5. Design Outcome and Modelling Analysis

5.1. Preliminary Design Outcome

The combustor layout and overall sizing are initially generated based on the developed preliminary design model. As presented in Figure 4, the proposed layout consists of a fuel burner, a liner, and an external casing. Within the liner, the fuel burner head and the first row of jet mixing holes form the primary zone, PZ. Downstream of the PZ, it is further divided into the intermediate zone, IZ, and dilution zone, DZ. The geometric constraints are imposed at boundaries in terms of nondimensional limits in axial and radial directions. It reveals that the produced form and size are feasible to accommodate in the provided design space.
With available geometric and thermodynamic inputs, a 2D stirred-reactor network is constructed to allow a preliminary emission evaluation. The PZ is modelled by a PaSR and a PSR at the inner and outer regions, respectively. The SZ is modelled by a PSR near the wall and a PSRs is used to model the mainstream. The enhanced homogeneous mixture in the dilution zone is approximated by a single PSR. Because the current MGT features a small turn-down ratio, a staged-combustion process is not required, and hence fuel-staging mode is not implemented. The NOx and efficiency evaluations are reported in Figure 5. Combustion inefficiency is expressed to assess combustion completeness. An equivalence ratio close to 0.7 is noticed to provide an optimal trade-off for emission and efficiency. Therefore, the value is used for the subsequent calculations, and the resulting airflow fractions, expressed by percentages, are reported in Table 3.
The calculated geometric data are simultaneously transferred to the CAD tool and a three-dimensional geometry is generated, which provides the basis for high-fidelity modelling. The efficiency level, pressure drop, and OTDF are also included in the same table.

5.2. High-Fidelity Analysis

5.2.1. Chamber Dimension

During the preliminary design phase, the intensity factor I of 55 MW/atm m3 was estimated to derive the chamber dimension. High-fidelity modelling was then performed to analyse combustion completeness at the design point. The design-point intensity factors were investigated in the range of 35–60 MW/atm m3. The efficiency calculation was based on the gas composition analysis. The area weighted-average volumetric concentrations of CO and CO2 were extracted at the combustor outlet plane. CH4 was set to be the UHC in this analysis. Simulations were also conducted at lower pressure and temperature to assess whether combustion is sustained at off-design points.
Results are reported in Table 4. The chamber diameter is given in a nondimensional form. The referenced point is set when I = 60 MW/atm m3. It can be noted that a lower value of I results in a larger chamber dimension: chamber size is increased by 30% when I is reduced from 60 to 35 MW/atm m3. High combustion efficiency is attained when the value of I is below 50 MW/atm m3. It is noted that, when the value is 55 MW/atm m3 or higher, the combustion presents a challenge to sustain at low power. In particular, combustion is not formed despite an initial high temperature of 2100 K being imposed to start the ignition. Although further reduction of intensity factor produces superior combustion stability and efficiency, the resulting dimensions introduce extra weight and manufacturing costs. In addition, the extra surface area increases the thermal loading. Thus, I of 45 MW/atm m3 is believed to be sufficient to guarantee a high combustion efficiency while maintaining low power combustion stability.

5.2.2. Dome Head Configuration

The recirculation flow needs to be well established inside the combustor dome area to allow stable combustion. In this study, it concerns the dome shape and primary zone mixing hole arrangement. The four resulting dome configurations are generated, as summarised in Table 5. The dome plate consists of flat and conical-shaped layouts. For a single primary hole row, hole layout variation is achieved by modifying the hole numbers and diameters. In this case, hole layout 1 contains a larger hole size with smaller hole numbers compared to layout 2. The total hole areas for both hole layouts remain similar to fix the dome fuel–air ratio.
Flow characteristics are investigated by examining the reacting flow velocity streamlines along the combustor mid-plane, as illustrated in Figure 6. For all configurations, the recirculating flow patterns are well generated in the primary zone. In the case of flat dome heads (Figure 6a,c), the main recirculation zone (MRZ) is established close to the centre axis of the liner. The shear force resulting from high momentum swirling flow jet enhances the formation of the corner recirculation zone (CRZ). On the contrary, the size of the CRZ is minimised and the larger size of the MRZ is dominant in the case of conical-shaped configuration (Figure 6b,d), due to the presence of the divergent cone.
The combustion characteristics are compared by OH radical mass contours, as shown in Figure 7. In the case of flat dome configurations (Figure 7a,c), the high heat release is established inside the MRZ, which indicates that the flame is sustained in this area and a V-shaped flame zone is formed for both cases. In Figure 7a, increased reaction rate and heat release are noticed close to the liner wall, whereases for Figure 7c, the main heat release is entrained in the centre of MRZ. For both cases, the recirculation flow in CRZ provides no benefit in sustaining combustion but it causes further total pressure loss. Pressure analysis was also performed, and it was found that the total pressure loss observed was 10% higher than in Figure 7b,d. However, these corner wall swirls may help maintain relatively low temperatures at the front rows of the liner surfaces. For conical-shaped cases, the high OH concentration is noticed in the vicinity of the walls in Figure 7b. The high reaction at the locations is due primarily to the fact that the primary jet through the hole layout 1 increases the jet penetration and a larger amount of high momentum flow is recirculated in the dome region such that it pushes the recirculated hot products towards the liner. This possesses a potential challenge to limit the liner temperatures. In comparison with Figure 7b, the slightly reduced recirculated flow momentum in Figure 7d allows the majority of the hot products to be sustained in the MRZ so that the intense reaction is mainly formed in the centre of the dome.

5.2.3. Fuel Nozzle Orifice Number

To determine the optimal numbers of the injector orifice, numerical simulations are performed to analyse the fuel–air mixing and emission characteristics. Fuel nozzle numbers to be investigated are 4, 8, 12, and 16. The same numerical boundary conditions (Table 2) are applied. The total fuel mass flow is fixed for all cases to maintain the same global primary zone fuel–air equivalence s ratio (i.e., φ = 0.7). To analyse the local mixing characteristics inside the combustion chamber, a new parameter, γ (24), is adopted. Six cross-section planes are generated along the combustor axial direction, with the first plane located near the nozzle tip and the last plane set at the combustor primary zone outlet. The axial distances are expressed in a dimensionless format that is relative to the injector swirler hub radius, L / R s h . Nonreacting flow simulations are carried out. To determine γ at each plane, the mass fraction of CH4 is defined as the species variable, and area-weighted calculations of γ are performed.
The variation of γ along the axial planes is presented in Figure 8. In all cases, rapid mixing is seen when the mixture reaches the location at L / R s h = 2. The quality of fuel–air mixing is further improved downstream. At each location, as the number of fuel nozzles increases, a more uniform mixture is produced. The difference in γ becomes insignificant when the nozzle number increases from 12 to 16. At the primary zone outlet, γ reaches up to 0.96. Reacting flow simulations are conducted and Figure 9 shows the temperature distribution of different nozzle numbers at the same location (i.e., L / R s h = 6). A large fraction of nonuniform temperature fields are noticed in the case of nozzle no. 4 and 8. In comparison, a more uniform temperature distribution is gained with nozzle no. 12 and 16. Furthermore, the peak temperature is lower than that of nozzle no. 4 and 8. NOx emission calculations are also performed (Figure 10). Due to the presence of the hot-spots and higher local nonuniformity in fuel–air mixing, the reduced nozzle orifice number produces higher NOx. The emission can be reduced by 28% when the number increased from 4 to 12. A similar NOx level is obtained when the number increases from 12 to 16.

5.2.4. Dilution Hole Arrangement

The dilution hole configuration A, designed based on mixing criteria, is characterised by a larger number but a smaller hole size, compared to the configuration B, designed based on jet penetration. Both hole types are of round shape and total areas remain similar to allow for similar pressure drop levels. To visualise the temperature variation downstream of the dilution holes, three planes (Figure 11) are created along the combustor axial direction. As shown in Figure 12, at plane 1, the local high-temperature region moves towards the outer radius of the liner. A similar feature is also found in configuration B. At the further downstream location (i.e., plane 2), the circumferential mixing is enhanced between the dilution air through configuration A and burned gases. However, this mixing is limited in configuration B due to the reduced number of holes. As a result, configuration A yields a 15.4% lower level of OTDF against configuration B, which is believed to improve the turbine life. Furthermore, configuration A produces a slightly higher TIT level, which increases the overall microturbine cycle efficiency.
In terms of emissions (Figure 13), hole configuration A produces a lower NOx, but a slightly higher CO emission. Specifically, NOx is decreased by 14.3% and CO is increased by 16.4%. Based on the main performance criteria (i.e., combustion stability, low pressure loss, desired flow pattern and flame shape, low emissions, and OTDF), the final optimal combustor geometry produces the chamber dimension with I equals 45 at the design point, the dome configuration d, the 12 numbers of the fuel nozzle, and dilution hole configuration A. The final optimal geometry and mechanical engineering drawing were generated and prepared for manufacturing.

6. Experimental Test Rig

The combustor was fabricated and installed in the turbo-green MGT assembly designed by Samad Power Ltd. (Milton Keynes, UK). The MGT operates based on the Brayton cycle. It consists of a single-stage centrifugal air compressor/turbine, a combustion chamber, a heat exchanger, and an alternator. The system generates up to 12 kW of electricity and 200 kW of heat simultaneously.
The schematic drawing of the test rig setup is presented in Figure 14. The single-shaft MGT assembly is fixed on the test bench with the combustor placed vertically. A natural gas tank is installed to supply the gaseous fuel to the MGT through an orange-coloured pipeline (shown in Figure 15). For measurement of fuel mass flow rate, a gas mass flow controller is installed between the gas tank and the combustion chamber. To measure air mass flow rate, a flow duct is installed before the compressor inlet to ensure the inlet flow distortion effect is controlled to an acceptable level for reliable recording. The MAF sensor is placed between the duct and compressor inlet to monitor the airflow rate data. For temperature measurement, thermocouples are installed at the key locations, including compressor inlet and outlet, turbine inlet, and exhaust. Some additional thermocouples are also installed at other units, including the alternator, compressor, turbine housing, and bearing housing. The pressure sensors are also placed at the compressor outlet and turbine inlet to enable the combustor pressure drop measurement. A flue gas analyser probe is installed at the turbine outlet (Figure 15) to measure the MGT combustion product. The sensors inside the analyser are capable of detecting the emissions of NOx, CO, and CO2. To enable the ignition process, a full sequence automatic spark plug is placed near the combustor liner close to the primary zone. The tested MGT is expected to operate at various operating points. The test ambient pressure is 101.3 KPa, and the ambient temperature is 288 K. By finely tuning the gas valve setpoints, the turbine inlet temperature TIT level is maintained to be below the limit (i.e., <1200 K) to avoid damage to the turbine blade. In addition, other control parameters, such as turbine rotational speeds setpoints, during the test and all the measurement parameters are monitored using LabVIEW via connected hardware, datalogger, and relays.

7. Model Validations

7.1. Performance and Emissions

High-fidelity simulation and lower-order calculation results are compared against the experimental test data, in terms of overall pressure loss under various engine TIT conditions. The details are reported in Table 6. The results indicate that both methods provide good agreement with the test results. In particular, the trend of the increasing pressure loss with engine thermal ramp-up is well predicted. For the results produced by the low-order model, the maximum deviation is 9.7% and the mean percentage error is 5.3%. The discrepancy between CFD and test results is below 4.1%. Furthermore, during each test, combustion stability is also assessed, and it shows that combustion is sustained at each test point, which agrees with simulations.
Comparisons are also made in terms of NOx and CO emissions between the physics-based method, CFD approach, and test data. (Figure 16 and Figure 17). The measurement of emissions was conducted at similar turbine inlet temperature conditions as before. It can be observed that both reactor method and CFD model are capable of capturing the emission trends with the engine power settings: NOx emissions are increased with power, and CO emissions are decreased with an increase in power. For NOx prediction, the original reactor method produces the mean percentage error of 29.0% against experimental data. For CFD modelling, the mean percentage error is 17.1%. With regards to CO comparisons, the mean percentage error for the original reactor model is 16.7%, and the mean percentage error for the CFD approach is 8.5%. As mentioned before, the NOx model in the CFD Fluent solver calculates the emission using the post-processing technique, that is, the NOx computations are decoupled from the main reacting flow simulations. In practice, the concentrations of O atoms and OH radicals, etc., could be higher during reactions. As a result, based on the NOx formation mechanisms, the actual NOx level can be higher than the predicted level. However, this method is shown to produce reasonably accurate trend predictions, as confirmed by the experimental test. It also relatively reduces the computational time and cost compared to large-eddy simulations, which is beneficial in evaluating different designs in the early MGT combustor development.

7.2. Refinement of Reduced-Order Models

7.2.1. Combustor Sizing

The refined design rules are introduced in the preliminary design model based on the findings gained from the high-fidelity modelling. The details are presented as follows:
  • To refine the liner dimension, the value of the intensity factor at the design point should not exceed 50 MW/atm m3 to ensure high combustion completeness and stability, particularly at off-design conditions.
  • The dome head was not considered in the original model. In the refined model, the conical configuration is suggested as the primary layout for maintaining the lower pressure loss. For primary mixing hole layouts, on the basis of the successful generation of the central flow recirculation, the proper control of the recirculated flow momentum is required to allow hot products to be sustained in the MRZ, rather than pushing them towards the liner to increase the concern of liner durability. This is achieved by governing the number and diameter setting.
  • For fuel nozzle sizing, a sufficient orifice number is suggested to improve the fuel–air mixing quality, and thus effectively limit emissions. For an initial definition, a number similar to the swirler blade number is recommended.
  • In the case of the dilution hole design, the mixing criterion is shown to be more effective in obtaining lower OTDF and NOx emissions. Specifically, the number of holes is set to be sufficient to enhance the circumferential mixing process between the dilution jet and the hot burner gas. Thus, for this type of MGT combustor, the number is suggested to be similar or close to the number of nozzle orifices to control the local hot spots.

7.2.2. Emission

Sensitivity analysis is carried out on the low-order emission model to identify the most suitable parameters to be refined by high-fidelity models. In this study, the effects of reactor zonal dimensions and the mixing parameter on pressure, temperature, and emissions are reported, as listed in Table 7. Based on the differences between the new and original calculations, they are classified as small (<1%), moderate (1–5%), medium (5–10%), and notable deviations (>10%). It can be noted that all the modelling parameters have a small impact on pressure variation. The primary centre reactor zone geometry, V p z , the flow residence time, τ p z , and its mixing parameter, S p z , result in notable impacts on emission and temperature. CO is mainly affected by the downstream reactor zone geometry and, hence, residence time.
The flow streamlines are shown in Figure 18. In the originally developed model, to simplify the representation of the reactor zone geometry, the inlet and outlet reactor section remains constant. In the new model, customisation of zone setting is enabled to allow the full definition of zone layout. In such a way, the reaction space, and hence the flow residence time, is refined for more reliable chemical kinetic calculations. Further to this, the mixing characteristics are detailed and captured to fully define the parameter S without the reliance on the pure empirical term. In this case, the uniformity parameter γ defined in (26) is adopted, and the relation between γ and S is
S = 1 γ
Emissions are recalculated using the refined model, and the updated results are added in Figure 16 and Figure 17. The mean percentage error of the refined emission model is seen to reduce by 25.3% in NOx and 40.9% in CO predictions over the original model. By applying this CFD zooming technique, a higher accuracy level of the reduced-order model can be acquired, which enhances the reliability of emission evaluation at the early stage of the design process.

7.2.3. Pressure Loss

The total pressure loss is quantified using the analytical method in the preliminary design. To merge the cold loss due to liner holes (17) and inlet duct (18), a new expression for cold loss is specified (27) related to the combustor reference parameter. The term K in (28) is referred to as a pressure loss factor that is independent of the MGT working conditions and is a property of this MGT combustor.
Δ P c P 3 = K R 2 w T 0.5 A r e f P 3 2
where A r e f is reference area and K is the pressure loss factor.
The pressure loss factor is determined experimentally from the rig test. The typical value for this MGT combustor is 36. Thus, in the refined model, (27) can be used as a supplementary method to estimate the loss.

8. Renewable Fuel

The combustor is designed to be fuel-flexible to enable the operation of supplementary and renewable fuels. After the verification and validation of the models, CFD analysis is carried out on the same combustor feeding biogas. For a comparable case study, the biogas mass flow was calculated so that the thermal power was the same as in the case of natural gas. Therefore, apart from the fuel composition and the fuel mass flow, the same boundary conditions (Table 2) of the natural gas case are applied.
In the initial simulation, the biogas consists of 60% CH4 and 40% CO2. The fraction is given on a volumetric basis. The lower heating value of the fuel is 17.7 MJ/kg. For comparison purposes, the scale of temperature is presented in a nondimensional format, as indicated in Figure 19. The temperatures for natural gas are set as reference. The combustor burning the biomass yields a lower flame temperature. In particular, the maximum temperature is 13% lower compared to the case of natural gas. The reacting flow velocity streamlines are also generated in the same plot to indicate the flow structures. For the two reacting flow cases, similar flow characteristics are noticed: flow recirculation is also established in the primary zone in the case of biogas. A large fraction of recirculation flow is formed in MRZ. A small fraction of the recirculation is observed in the corner region, which establishes the corner recirculation zone (CRZ).
NOx and CO concentrations maps are given in Figure 20, with nondimensional scales applied for more visible comparisons. Due to the presence of CO2 in the fuel content of the biogas, the reaction temperature decreases. Since NOx production is highly affected by the temperature, the lower temperature decreases the NOx level. At the exit plane of the combustor, the biogas combustor features a 66.7% NOx reduction in comparison with natural gas. A higher concentration of CO is noticed at the primary reaction zone when firing biogas due to lower combustion temperature and, hence, the slower consumption rate of CO. As a result, the level of CO produced by biogas is twice higher than that of natural gas.
Biogas typically consists of 50–75% methane, and the main remaining content is CO2. The actual composition depends on the raw materials and production methods [30]. Thus, there is an interest to investigate the effect of methane concentration on emissions. The calculated results are summarised in Table 8. It can be observed that a significant NOx reduction is obtained in all cases. When the concentration of CH4 is decreased from 75% to 55%, NOx emission is reduced by 78.3%.
When the biogas system is burned with a lower methane content (i.e., 50%), the simulation study indicates that it possesses challenges in maintaining flame stabilisation and cannot attain the required TIT level. To address this issue, a number of design strategies are initially proposed, with the parameters suggested being modified. These include (a) chamber diameter, (b) liner axial length, (c) the number of primary mixing holes, (d) axial position of primary mixing hole, and (e) swirling intensity. Since the current MGT combustor has a stringent size requirement, in particular, the length and diameter limits are imposed, and modifications of parameters (a) and (b) would also add the extra cost and weight to the system, these solutions are not primarily considered. The adjustment of design parameters of (c), (d), and (e) will not compromise the overall size requirement; however, the change of parameter (c) leads to the modifications of the FAR and flow distribution across the combustor chamber. Therefore, the design strategy is carried out by studying the axial position of the primary mixing hole and the swirling intensity characterised by the swirler blade angle. The original axial position is set as the baseline. The four additional locations are defined relative to the reference point: −5 mm, 5 mm, 10 mm, and 15 mm. The investigated swirler blade angles θ are 40 ° , 45 ° , 50 ° , 55 ° , and 60 ° . Results are summarised in Figure 21. On the y axis, five axial positions of the primary mixing hole are marked, with point 1 referring to −5 mm relative to point 2 (reference point). Points 3–5 are 5, 10, and 15 mm, relative to point 2. The analysis starts with θ = 40 ° with axial position −5 mm relative to the reference point. Combustion is not sustained until θ = 55 ° with the axial position reaching 5 mm relative to the baseline. For the two parameters, the combustion stabilisation is mainly governed by the swirl intensity, through the modification of the blade angle. The increase in blade angle enhances the flame stabilisation. The most effective method to maintain the flame stability is observed by increasing the swirler angle as well as shifting the primary hole axial position toward the turbine outlet. As a result, satisfactory combustion efficiency of 99.9% is obtained at point 5 with θ = 60 ° . The design strategy is feasible to be adopted as it requires minor system modifications for dual fuel system operation.

9. Conclusions

The main conclusions are summarised as follows:
A multi-fidelity combustor design approach is developed for a micro gas turbine system. In the combustor preliminary design phase, rapid definitions of combustor layout and geometry, fuel–air ratio, emission, and performance are achieved by the combined method.
High-fidelity modelling is then conducted to gain more physical insights into the performance of the MGT combustor. The design factors that are not fully modelled in the preliminary stage are identified. These include chamber dimension, dome front configuration, number of fuel nozzle orifice, and dilution hole arrangement. Their effects on combustor performance are investigated in detail.
The designed combustor is fabricated, and the details of the test rig setup are described. The test measurement procedure is presented. The test indicates that the designed combustor is successfully implemented in the MGT, which confirms that the proposed method has the potential to develop a combustor towards a higher TRL level.
The details of refinement on the low-order models are also discussed. For combustor sizing, the refined design rules are introduced in the preliminary design model. For emission analysis, the reactor method is refined by improved definitions of the reactor layout and mixing. The experimentally determined pressure loss factor is used as a supplementary method for pressure loss estimation.
The combustor burning biogas produces lower NOx compared to natural gas. NOx emission can be further reduced as the content of methane is decreased. However, when methane is decreased to a lower concentration, a flame stability issue is noticed. To address this design challenge, a feasible strategy is proposed to implement a minor system modification and enable dual-fuel operation. This is achieved by increasing the swirling intensity via the modification of the swirler blade angle and adjustment of the primary mixing hole axial location.

Author Contributions

Investigation, S.H.M., M.S., A.G., M.F.S. and S.V.H.; Methodology, Y.L.; Supervision, T.N.; Writing—original draft, Y.L.; Writing—review and editing, Y.L. and T.N. All authors have read and agreed to the published version of the manuscript.

Funding

This research was funded by Engineering and Physical Sciences Research Council (EPSRC), under grant number EP/T004665/1.

Institutional Review Board Statement

Not applicable.

Informed Consent Statement

Not applicable.

Data Availability Statement

Not applicable.

Conflicts of Interest

The authors declare no conflict of interest.

Nomenclature

AArea
CADComputed Aided Design
CFDComputational Fluid Dynamics
CHPCombined Heat and Power
CRZCorner Recirculation Zone
DDiameter
DPDesign Point
DZDilution Zone
HHeight
IIntensity Factor
IZIntermediate Zone
LLength
MGTMicro Gas Turbine
MRZMain Recirculation Zone
NOxNitrogen Oxides
OTDFOutlet Temperature Distribution Factor
PPressure
PaSRPartially Stirred Reactor
PSRPerfectly Stirred Reactor
PZPrimary Zone
QLower Heating Value (MJ/kg/kJ/kmol)
RRadius
RANSReynolds Averaged Navier-Stokes
SMixing parameter
SNSwirl Number
TTotal temperature
TCThermocouple
TITTurbine Inlet Temperature
VVolume/Species Variable
WMass Flow
γ Nondimensional Uniformity Parameter
ε Turbulence dissipation
ηCombustion efficiency
θ Angle
ρ Density
τ Residence time
φ Equivalence Ratio
Subscripts
AAxial
AmAxial limit
cCombustion chamber
cmCasing limit
iznwIntermediate zone near wall
mmixture
nwNear Wall
refReference
shSwirler hub
3Combustor inlet
4Combustor outlet

References

  1. De Paepe, W.; Montero Carrero, M.; Bram, S.; Parente, A.; Contino, F. Towards higher micro Gas Turbine efficiency and flexibility: Humidified mGTs—A review. In Turbo Expo: Power for Land, Sea, and Air; American Society of Mechanical Engineers: New York, NY, USA, 2017; Volume 50831, p. V003T06A030. [Google Scholar]
  2. Udomsri, S.; Martin, A.R.; Martin, V. Thermally driven cooling coupled with municipal solid waste-fired power plant: Application of combined heat, cooling and power in tropical urban areas. Appl. Energy 2011, 88, 1532–1542. [Google Scholar] [CrossRef]
  3. Liu, Y.; Sun, X.; Sethi, V.; Li, Y.G.; Nalianda, D.; Abbott, D.; Wang, L. Development and application of a preliminary design methodology for modern low emissions aero combustors. Proc. Inst. Mech. Eng. Part A J. Power Energy 2021, 235, 783–806. [Google Scholar] [CrossRef]
  4. Angersbach, A.; Bestle, D.; Eggels, R. Automated Combustor Preliminary Design Using Tools of Different Fidelity. In Proceedings of the International Gas Turbine Institute, San Antonio, TX, USA, 3–7 June 2013. [Google Scholar] [CrossRef]
  5. Foust, M.; Thomsen, D.; Stickles, R.; Cooper, C.; Dodds, W. Development of the GE aviation low emissions TAPS combustor for next generation aircraft engines. In Proceedings of the 50th AIAA Aerospace Sciences Meeting Including the New Horizons Forum and Aerospace Exposition, Nashville, TN, USA, 9–12 January 2012. [Google Scholar]
  6. Pegemanyfar, N.; Pfitzner, M. State-of-the-Art Combustor Design Utilizing the Pre liminary Combustor Design System PRECODES. In Turbo Expo: Power for Land, Sea, and Air; American Society of Mechanical Engineers: New York, NY, USA, 2008; Volume 43130, pp. 465–475. [Google Scholar]
  7. Liu, Y.; Sun, X.; Sethi, V.; Nalianda, D.; Li, Y.G.; Wang, L. Review of modern low emissions combustion technologies for aero gas turbine engines. Prog. Aerosp. Sci. 2017, 94, 12–45. [Google Scholar] [CrossRef] [Green Version]
  8. Ji, F.; Zhang, X.; Du, F.; Ding, S.; Zhao, Y.; Xu, Z.; Wang, Y.; Zhou, Y. Experimental and numerical investigation on micro gas turbine as a range extender for electric vehicle. Appl. Therm. Eng. 2020, 173, 115236. [Google Scholar] [CrossRef]
  9. Visser, W.P.J.; Shakariyants, S.; de Later, M.T.L.; Ayed, A.H.; Kusterer, K. Performance Optimization of a 3 kW Microturbine for CHP Applications. In Turbo Expo: Power for Land, Sea, and Air; American Society of Mechanical Engineers: New York, NY, USA, 2012; pp. 619–628. [Google Scholar]
  10. Enagi, I.I.; Al-Attab, K.; Zainal, Z. Combustion chamber design and performance for micro gas turbine application. Fuel Process. Technol. 2017, 166, 258–268. [Google Scholar] [CrossRef]
  11. Bazooyar, B.; Darabkhani, H.G. Design procedure and performance analysis of a microturbine combustor working on biogas for power generation. In Turbo Expo: Power for Land, Sea, and Air; American Society of Mechanical Engineers: New York, NY, USA, 2019; Volume 58622, p. V04BT04A008. [Google Scholar]
  12. Liu, C.R.; Shih, H.Y. The Design and Model Simulation of a Micro Gas Turbine Combustor Supplied with Methane/Syngas Fuels. In Turbo Expo: Power for Land, Sea, and Air; American Society of Mechanical Engineers: New York, NY, USA, 2016; Volume 49750, p. V04AT04A028. [Google Scholar]
  13. Abagnale, C.; Cameretti, M.C.; De Robbio, R.; Tuccillo, R. CFD Study of a MGT Combustor supplied with Syngas. Energy Procedia 2016, 101, 933–940. [Google Scholar] [CrossRef]
  14. Okafor, E.C.; Somarathne, K.K.A.; Hayakawa, A.; Kudo, T.; Kurata, O.; Iki, N.; Kobayashi, H. Towards the development of an efficient low-NOx ammonia combustor for a micro gas turbine. Proc. Combust. Inst. 2019, 37, 4597–4606. [Google Scholar] [CrossRef]
  15. Monz, T.O.; Stöhr, M.; O’Loughlin, W.; Zanger, J.; Hohloch, M.; Aigner, M. Experimental characterization of a swirl stabilized MGT combustor. In Turbo Expo: Power for Land, Sea, and Air; American Society of Mechanical Engineers: New York, NY, USA, 2015; Volume 56680, p. V04AT04A033. [Google Scholar]
  16. Krieger, G.C.; de Campos, A.P.; Sacomano Filho, F.L.; Souza, R.C.D. A swirler stabilized combustion chamber for a micro-gas turbine fuelled with natural gas. J. Braz. Soc. Mech. Sci. Eng. 2012, 34, 441–449. [Google Scholar] [CrossRef] [Green Version]
  17. Liedtke, O.; Schulz, A.; Wittig, S. Design study of a lean premixed prevaporized counter flow combustor for a micro gas turbine. In Turbo Expo: Power for Land, Sea, and Air; American Society of Mechanical Engineers: New York, NY, USA, 2002; Volume 36061, pp. 405–412. [Google Scholar]
  18. Fuchs, F.; Meidinger, V.; Neuburger, N.; Reiter, T.; Zündel, M.; Hupfer, A. Challenges in designing very small jet engines-fuel distribution and atomization. In Proceedings of the 16th International Symposium on Transport Phenomena and Dynamics of Rotating Machinery, Honolulu, HI, USA, 10–15 April 2016. [Google Scholar]
  19. Nikpey, H.; Assadi, M.; Breuhaus, P.; Mørkved, P.T. Experimental evaluation and ANN modelling of a recuperative micro gas turbine burning mixtures of natural gas and biogas. Appl. Energy 2014, 117, 30–41. [Google Scholar] [CrossRef]
  20. Nikpey, H.; Majoumerd, M.M.; Breuhaus, P.; Assadi, M. Performance analysis of a biogas-fuelled micro gas turbine using a validated thermodynamic model. Appl. Therm. Eng. 2014, 66, 181–190. [Google Scholar] [CrossRef]
  21. Calabria, R.; Chiariello, F.; Massoli, P.; Reale, F. A Biogas Fuelled Micro Gas Turbine Using Dual-Fuel Approach. In Proceedings of the ASME Turbo Expo 2018: Turbomachinery Technical Conference and Exposition. Volume 8: Microturbines, Turbochargers, and Small Turbomachines, Oslo, Norway, 11–15 June 2018; p. V008T26A019. [Google Scholar]
  22. Sheen, H.J.; Chen, W.J.; Jeng, S.Y.; Huang, T.L. Correlation of Swirl Number for a Radial-Type Swirl Generator. Exp. Therm. Fluid Sci. 1996, 12, 444–451. [Google Scholar] [CrossRef]
  23. Holdeman, J.D.; Srinivasan, R.; Berenfeld, A. Experiments in dilution jet mixing. AIAA J. 1984, 22, 1436–1443. [Google Scholar] [CrossRef] [Green Version]
  24. Khandelwal, B.; Banjo, O.; Sethi, V. Design, evaluation and performance analysis of staged low emission combustors. J. Eng. Gas Turbines Power 2014, 136, 101501. [Google Scholar] [CrossRef]
  25. Chin, J.S.; Lefebvre, A.H. Effective values of evaporation constant for hydrocarbon fuel drops. In Proceedings of the 20th Automotive Technology Development Contractor Coordination Meeting, Warrendale, PA, USA, 1 March 1982; pp. 325–331. [Google Scholar]
  26. Launder, B.E.; Spalding, D.B. The Numerical Computation of Turbulent Flows. In Numerical Prediction of Flow, Heat Transfer, Turbulence and Combustion; Elsevier BV: Amsterdam, The Netherlands, 1983; pp. 96–116. [Google Scholar]
  27. Shih, T.H.; Liou, W.W.; Shabbir, A.; Yang, Z.; Zhu, J. A new Ke eddy viscosity model for high Reynolds number turbulent flows-Model development and validation. Comput. Fluids 1995, 24, 227–238. [Google Scholar] [CrossRef]
  28. Verma, I.; Yadav, R.; Nakod, P.; Sharkey, P.; Li, S.; Meeks, E. Flamelet Generated Manifold Simulation of Turbulent Non-Premixed Bluff Body Flames. In Proceedings of the Gas Turbine India Conference American Society of Mechanical Engineers, Chennai, India, 5–6 December 2019; p. V002T04A013. [Google Scholar]
  29. Smith, G.P.; Golden, D.M.; Frenklach, M.; Moriarty, N.W.; Eiteneer, B.; Goldenberg, M. GRImech 3.0 Reaction Mechanism, Berkeley. 2012. Available online: http://combustion.berkeley.edu/gri_mech/new21/abstracts/lisbon.pdf (accessed on 22 February 2022).
  30. Sangeetha, T.; Rajneesh, C.P.; Yan, W.M. Integration of microbial electrolysis cells with anaerobic digestion to treat beer industry wastewater. In Integrated Microbial Fuel Cells for Wastewater Treatment; Butterworth-Heinemann: Oxford, UK, 2020; pp. 313–346. [Google Scholar]
Figure 1. Overview of the design and modelling framework.
Energies 15 02342 g001
Figure 2. Preliminary design procedure.
Energies 15 02342 g002
Figure 3. High-fidelity modelling procedure.
Energies 15 02342 g003
Figure 4. Combustor preliminary design results, reactor network, and the 3D CAD model.
Energies 15 02342 g004
Figure 5. Emission and combustion inefficiency trade-off.
Energies 15 02342 g005
Figure 6. Reacting flow velocity contours with streamlines for various dome cases.
Energies 15 02342 g006
Figure 7. OH mass contours for various dome cases.
Energies 15 02342 g007
Figure 8. Variation of γ along the combustion chamber.
Energies 15 02342 g008
Figure 9. Temperature distribution for different fuel nozzle orifice numbers.
Energies 15 02342 g009
Figure 10. NOx comparisons for different nozzle orifice numbers.
Energies 15 02342 g010
Figure 11. The defined planes downstream of the dilution hole.
Energies 15 02342 g011
Figure 12. Temperature fields downstream of the dilution holes for Conf A (left) and Conf B (right) at different planes along the combustor axial direction.
Energies 15 02342 g012
Figure 13. TIT, OTDF, and emissions analysis.
Energies 15 02342 g013
Figure 14. The schematic drawing of the test rig setup.
Energies 15 02342 g014
Figure 15. Complete views of the test bench setup.
Energies 15 02342 g015
Figure 16. NOx results comparisons at different TIT.
Energies 15 02342 g016
Figure 17. CO results comparisons at different TIT.
Energies 15 02342 g017
Figure 18. Reactor layout refinement with variable area.
Energies 15 02342 g018
Figure 19. Temperature field with flow streamlines for natural gas (top) and biogas (bottom).
Energies 15 02342 g019
Figure 20. NOx and CO characteristics for natural gas (top) and biogas (bottom).
Energies 15 02342 g020
Figure 21. Combustion stabilisation analysis.
Energies 15 02342 g021
Table 1. Main design parameters.
Thermodynamic ParametersGeometric ParametersPerformance Parameters
Air inlet pressure P 3 Inlet section location, diameter D3/area A 3 Combustion efficiency η
Air Inlet temperature T 3 Outlet section location, diameter D4/area A 4 Pressure drop Δ P
Air mass flow W 3 Axial length limit L am Emission (NOx, CO)
Fuel type and
Mass flow W f
Turbine Inlet Temperature TIT
Casing Diameter/
Height limits D cm ,   H cm
Outlet Temperature Distribution OTDF
Table 2. Boundary condition setting.
BoundarySetting
Fuel inletFuel composition: 95.4% CH4, 2.6% C2H6, 0.2% CO2,
1.2% N2, 0.6% C3H8
Fuel temperature = 300 K
Fuel mass flow = 0.0012 kg/s
Air inletAir composition: 77% N2 and 23% O2
Air temperature = 450 K
Air mass flow = 0.075 kg/s
OutletAtmospheric static pressure
WallNo-slip, stationary condition
Table 3. Flow distribution and performance results.
ParameterResults
Swirling air fraction (%)24
Dome head cooling air fraction (%)6
Primary jet fraction (%)16
Secondary jet fraction (%)14
Dilution jet fraction (%)40
Combustion efficiency (%)99
Pressure drop (-)2.8
OTDF (-)0.2
Table 4. Combustion efficiency and stability evaluation for various intensity factors.
Intensity
MW/atm m3 at DP
Nondimensional Chamber Diameter D/DoCombustion Efficiency (%) at DPSustained Combustion at Low Power (Off-Design)
351.3199.9Y
401.2299.9Y
451.1599.7Y
501.199.4Y
551.0499.3N
60198.6N
Y: yes; N: no.
Table 5. Different dome configuration details.
Dome ConfigurationHead ShapePrimary Hole Layout
aFlat1
bConical1
cFlat2
dConical2
Table 6. Δ P comparisons against test measurement at various TIT conditions.
TIT/K Δ P/Pa (Test) Δ P/Pa
(CFD)
Deviation (%) * Δ P/Pa
(LOM)
Deviation (%) **
743240023024.122107.9
790283029132.931039.7
818387039040.936056.9
880495050061.153087.2
905670069173.265003.0
929800079250.976144.8
969890088111.086023.4
1033930094181.394922.1
115010,50010,2432.410,1863.0
* Difference between test and CFD results. ** Difference between test and lower order model results.
Table 7. Impact of reactor geometrical and mixing parameters on performance and emissions.
ParameterPTNOxCO
V p z n w ++
V p z
τ p z
S p z
V I z n w +
V I z +*
V d z +
τ d z +
−: below 1%; +: 1–5%; *: 5–10%; •: above 10%.
Table 8. Effect of methane content on NOx.
CH4 Content % volQ (MJ/kg)NOx (ppm)
5515.41.6
6017.75.2
6520.25.9
7023.36.3
7526.07.4
Publisher’s Note: MDPI stays neutral with regard to jurisdictional claims in published maps and institutional affiliations.

