Abstract
As an important energy base in China, Shanxi Province, in its economic development, has depended heavily on coal resources. However, enormous coal consumption produces a large amount of carbon dioxide and an aggravated ecological problem. In this paper, the super efficiency slack-based measure and data envelopment analysis (SBM-DEA) model and Malmquist index were used to calculate the energy consumption and carbon emission efficiency of 11 prefecture-level cities in Shanxi in the period from 2000 to 2020. The results were as follows: (1) The primary form of energy consumption in Shanxi Province is the burning of coal, and the carbon emission efficiencies of the 11 prefecture-level cities are quite different. The technical efficiency, technological progress, and total factor productivity of Taiyuan and Shuozhou were found to be greater than 1 compared to other cities in Shanxi. (2) On the whole, although the carbon emission rate of Shanxi Province has slowed down, it still faces the problems of a large total emission base, high carbon emission intensity, and low efficiency of the unit carbon emission output. Industrial structure is the key factor restricting improvements in the efficiency of carbon emissions in Shanxi Province. (3) From the spatial and temporal evolution of the carbon emission efficiency in Shanxi Province, we can see that the carbon emission efficiency of the whole province gradually dispersed and improved from the central and northern regions to the southern regions during the period of 2000–2020. In order to achieve a low-carbon economy, Shanxi Province must optimize its industrial structure, accelerate research and development in low-carbon technologies, adjust the energy structure, and promote the construction of an energy supply system with clean low-carbon energy as the main source.
1. Introduction
With continued economic and population growth, specifically the world population increasing sharply from 1 billion in 1900 to 7.6 billion at present, we are noticing conventional energy overdevelopment and environmental deterioration [1,2]. As a major global issue, sustainable development is heavily linked to the pattern of economic growth [3]. In this context, carbon emissions and global climate change have become increasingly serious global problems [3,4]. Correspondingly, a series of new concepts and policies such as “low-carbon economy”, “low-carbon development”, and “low-carbon lifestyle” have emerged in the public domain [5]. On 22 September 2020, Xi Jinping announced that “China will increase its national independent contribution, adopt more powerful policies and measures, strive to reach the peak of carbon dioxide emissions by 2030, and strive to achieve carbon neutrality by 2060” at the general debate of the 75th United Nations General Assembly [6].
Peak carbon dioxide emissions before 2030 and carbon neutrality before 2060 have multiple strategic significances, such as enhancing the resilience to climate change, leading global climate governance and promoting high-quality economic development. Zhuang and Jia et al. indicated in their studies that peak carbon dioxide emissions and carbon neutrality were both scientific and policy issues. Based on the sustainable development framework of ‘environment-society-economy’ inclusive relationship, peak carbon dioxide emissions and carbon neutrality are essentially the relationship between carbon dioxide emissions and economic development, which is affected by scale effect, structure effect, technology effect and factor substitution effect. Its realization will follow the path of controlling fossil energy consumption, developing renewable energy with a high proportion, developing negative emission technology and natural carbon sink, and taking reducing green premium and improving social governance efficiency as the necessary and sufficient conditions respectively [7,8]. Fang pointed out that the new era and new stage must vigorously promote the energy revolution and develop green energy as the core main line, and think about the strategic framework, strategic objectives, important measures and path selection of energy development [9]. On 22 February 2021, the State Council proposed that the basic strategies to solve the ecological problems regarding resources and the environment in China are to establish and improve the green low-carbon cycle development social economic system [10]. On 22 October 2021, at the symposium on promoting ecological protection and high-quality development in the Yellow River Basin, Xi Jinping stressed that it is urgent that green and low-carbon development be firmly improved [11]. There is no doubt that carbon emissions and low-carbon development has attracted attention from scholars nationally and abroad [12].
Chong et al. studied post-COVID-19 energy sustainability and carbon neutrality. The results showed that the advancement in energy efficiency modelling of components and energy systems has greatly facilitated the development of more complex and efficient energy systems. This review highlights that energy system efficiency and sustainability can be improved via innovations in smart energy systems, novel energy materials and low carbon technologies [13]. Bamadev et al. examined the asymmetric long-run and short-run impacts of energy efficiency on carbon emissions for 28 developed and 34 developing economies, covering the period of 1990–2017. The analysis accounted for nonlinear complexities in energy relations and heterogeneity between developed and developing economies [14]. Godil et al. examined the role of economic growth, technology innovation, and renewable energy in reducing transport sector CO2 emission in China by using the annual data of 1990–2018, finding that both renewable energy consumption and innovation showed negative impacts on emissions of CO2 with regard to transport [15]. Adeolu et al. examined the relationship between biomass energy consumption, economic growth, and carbon emissions in West Africa from 1980 to 2010. The results showed that energy-saving technologies and clean energy are critical for sustainable growth [16]. Ramanathan used the DEA model to study the relationship between carbon emissions, energy consumption, and GDP and analyzed the characteristics of global carbon emission efficiency by analyzing the fluctuation in carbon emission efficiency [17]. Ding et al. used the energy and carbon emission performance model in their study, finding that most provinces had certain inefficiency in economic output and that the central region had the worst score in terms of energy carbon emission performance index due to the rapidly growing secondary industry. Their study provides several valuable modeling directions and problems related to performance index measurement and energy pollution emission constraints that could be useful for future research [18]. Yang et al. analyzed the impact of economic globalization and population ageing on carbon emissions in Organization for Economic Cooperation and Development (OECD) countries. The results show that economic globalization and population aging decrease the long-term CO2 emissions. The inverted U-shaped relationship between economic growth and environmental pollution confirms the effectiveness of the Environmental Kuznets Curve (EKC) in OECD countries [19]. Wu et al. used the extended STIRPAT model to analyze the driving factors of carbon emission decline in developed countries. The results show that there exists a bi-directional long-run causal link between the renewable energy consumption share and CO2 emissions, and a unidirectional short-run causal association from industrial structure, GDP per capita and energy intensity to CO2 emissions. These findings highlight the importance of improved energy efficiency and the use of renewable energy in reducing CO2 emissions in the eighteen developed countries [20].
Zhang et al. used nuclear density estimation method to analyze the characteristics of the spatial and temporal evolution of the regional imbalance in the carbon emissions of rural energy consumption. They found that the driving effect and influence of various driving factors on the carbon emissions of rural energy consumption from the regional perspective had temporal and spatial differences. In this regard, they put forward that, in the process of carbon emission control in rural areas, the management idea of ‘national overall planning, regional coordination and regional governance’ should be clarified, and the classification management mode of ‘region, time and type’ should be adhered to, so as to realize the green coordinated and high-quality development of ‘ecological carrying-environmental protection-economic growth’ in rural areas [21]. Song et al. used the LMDI factor decomposition method and modified STIRPAT model based on ridge regression estimation in order to analyze the driving factors of the carbon emissions of energy consumption in the Yangtze River Delta region. The results showed that economic output and population size are positive feedback drivers, whereas energy intensity and energy structure are negative feedback drivers. They proposed accelerating the transformation of economic development mode to low-carbon intensive, accelerating the green transformation of new energy, and promoting the sustainable and high-quality development of the Yangtze River Delta region under the background of the new era of ecological civilization construction and the rise of regional integration development in the Yangtze River Delta region as a national strategy [22]. Yu et al. used the synthetic control method in order to study the impact of the resource-based economic transition pilot area policy on carbon emissions in Shanxi Province. It was found that the policy of the resource-based economic transformation comprehensive reform pilot area has contributed to the low-carbon development of Shanxi Province by strengthening regulations and industrial transformation [23]. On the basis of the CHRED-online carbon emission public database and socio-economic statistics of the counties and county-level cities, Wang et al. studied the spatial distribution characteristics and influencing factors of carbon emissions in county-level cities in China by using spatial autocorrelation analysis and the geographical detector method. The results show that China’s county-level cities have large spatial differences in carbon emissions, and differentiated carbon control path selection should be combined with high carbon emission regions and urbanization influence mechanism [24]. Liu et al. studied the influencing factors of carbon emissions in China on the basis of the fixed effect panel quantile regression model. The results show that per capita GDP, population and ‘Atmosphere ten‘ have a higher impact on carbon emissions in low carbon emission areas than in high carbon emission areas, and fixed asset investment and energy intensity have a stronger impact on carbon emissions in high carbon emission areas [25].
At present, many investigations have concluded that a large population and the growing economy have had a greater impact on total carbon emissions and that energy intensity has had a greater impact than energy structure [26]. Some studies used decoupling theory in order to find out this relationship between carbon emissions and economic growth [27,28]. Wang and Su found that developed countries mostly converged on stable weak decoupling and switched to a strong decoupling status, whereas most developing countries did not show a clear decoupling state, with the key offsetting effect of the decoupling process being the affluence level [27]. Yu et al. explored the decoupling relationship and its influencing factors between the growth of China’s civil aviation sector and carbon emissions, finding that total carbon emissions fluctuated on an overall upward trend and that the “energy consumption intensity” factor played a major role in inhibiting CO2 emissions [28]. However, although there are many studies that have focused on carbon emission characteristics and their influencing factors, relatively few studies have focused on carbon emission efficiency in the Yellow River Basin. As an important energy base of the Yellow River Basin, Shanxi shoulders an important historical mission of promoting the ecological protection and high-quality development of the area as well as the national mission of being a national resource-based economic transformation comprehensive reform pilot area and an energy revolution comprehensive reform pilot province [29]. It is thus necessary to scientifically evaluate the input–output characteristics and carbon emission efficiency of social and economic development in Shanxi Province. Therefore, this paper adopted the super efficiency SBM-DEA model and Malmquist index model while utilizing the carbon emission calculation data of energy consumption in Shanxi Province from 2000 to 2020 and analyzed the characteristics of changes in carbon emission efficiency on the basis of its energy consumption structure. The characteristics of the spatial and temporal evolution of carbon emission efficiency in 11 prefecture-level cities in Shanxi Province were studied using the natural discontinuity method in ArcGIS10.8.
2. Overview of the Study Area
Shanxi Province (34°34′~40°44′ N, 110°14′~114°33′ E), with a land area of 157,000 km2 (see Figure 1) and coal area of 57,000 km2, accounting for nearly 40% of the land area, is an important national energy base [30].
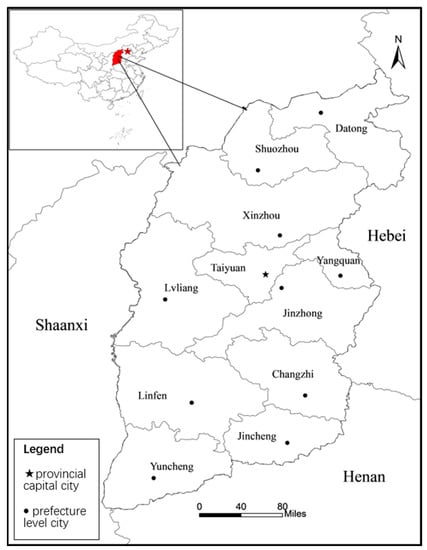
Figure 1.
Map of the study area.
In the past few decades, as China’s largest coal producing area, Shanxi has developed a large number of high energy-consuming projects such as coal power, coal chemical industry, iron and steel, and big data centers [31]. However, while Shanxi coal enterprises transport energy for other provinces in China, they also inevitably encounter high pollution problems caused by high energy consumption. Carbon emissions and carbon intensity as early as ten years ago in Shanxi per capita carbon emissions is one of the highest provinces. According to the current authoritative data, Shanxi is still one of the provinces with rapid growth in total emissions, emission intensity and emissions [23]. Under the “dual carbon target”, Shanxi will also become the province with the greatest pressure on emission reduction, the most arduous task of emission reduction and the most direct impact on economic growth.
On 29 May 2019, at the eighth meeting of the Central Committee on Comprehensively Deepening Reform, Shanxi Province, as the main coal producing area and energy base in China, officially became the first comprehensive reform pilot of energy revolution in China [32]. Therefore, the study of carbon emissions in Shanxi Province can also provide experience for reference to the same type of energy provinces in the country.
3. Research Methods
3.1. IPCC Method
The IPCC, an intergovernmental body jointly established by the World Meteorological Organization (WMO) and the United Nations Environment Programme (UNEP) in 1988, provides a detailed methodology for the calculation of greenhouse gases [33,34]. The main areas studied by the IPCC include agriculture, forestry, industry, land use, energy consumption, and waste emissions [35]. Their method of analysis provides a scientific basis for calculating carbon emissions and carbon footprint. At present, due to the different economic levels, industrial structures, social development abilities, and development modes of different regions, emission factors will also be different, and, therefore, the method may have errors in the calculation process.
3.2. DEA Model
Data envelopment analysis (DEA) was established by Charnes and Cooper in 1978, and it is a new field of cross-research among operational research, management science, and mathematical economics [36]. It is a quantitative analysis method that is used to evaluate the relative effectiveness of comparable units of the same type by using a linear programming method based on multiple input indicators and multiple output indicators. In 2002, Tone proposed a non-radial and slack-based super-efficiency SBM-DEA model [37]. This model directly adds slack variables to the objective function, and the result is not only the maximization of benefit ratio but also the optimization of the benefit ratio structure on the basis of actual profit maximization, so as to better distinguish the efficiency of different decision-making units and to evaluate the efficiency of the production sector under unexpected output. Through the SBM-DEA model, one can calculate the scale efficiency and pure technical efficiency of the production sector, and the comprehensive technical efficiency, namely, carbon emission efficiency, can be obtained. When it is assumed that there are n decision-making units, each decision-making unit consists of three parts: input—, expected output—, and unexpected output—; the super-efficiency SBM model with unexpected output is as follows:
In Equation (1), is the target carbon emission efficiency value; , , and are input, expected output, and undesirable output, respectively; and vectors , , and are input slack, expected output slack, and unexpected output slack, respectively.
3.3. Malmquist Index Model
The Malmquist productivity index is an analytical tool that is constructed using nonparametric linear programming methods [38,39]. This study used it to measure the dynamic change of total factor carbon emission efficiency from 2000 to 2019 as well as to analyze the technical efficiency and technological progress of regional production in Shanxi Province. The technical efficiency index reflects the correctness of decision making and the advantages and disadvantages of management methods and management structures, whereas the technical progress index reflects the technical progress of energy conservation and emission reduction. The calculation formula is as follows:
In Equation (2), Dt(xt, yt) and Dt+1(xt, yt) denote the distance function of and year decision making units, respectively, with t year technical level as reference.
4. Results
4.1. Energy Consumption in Shanxi Province
4.1.1. Energy Consumption Structure
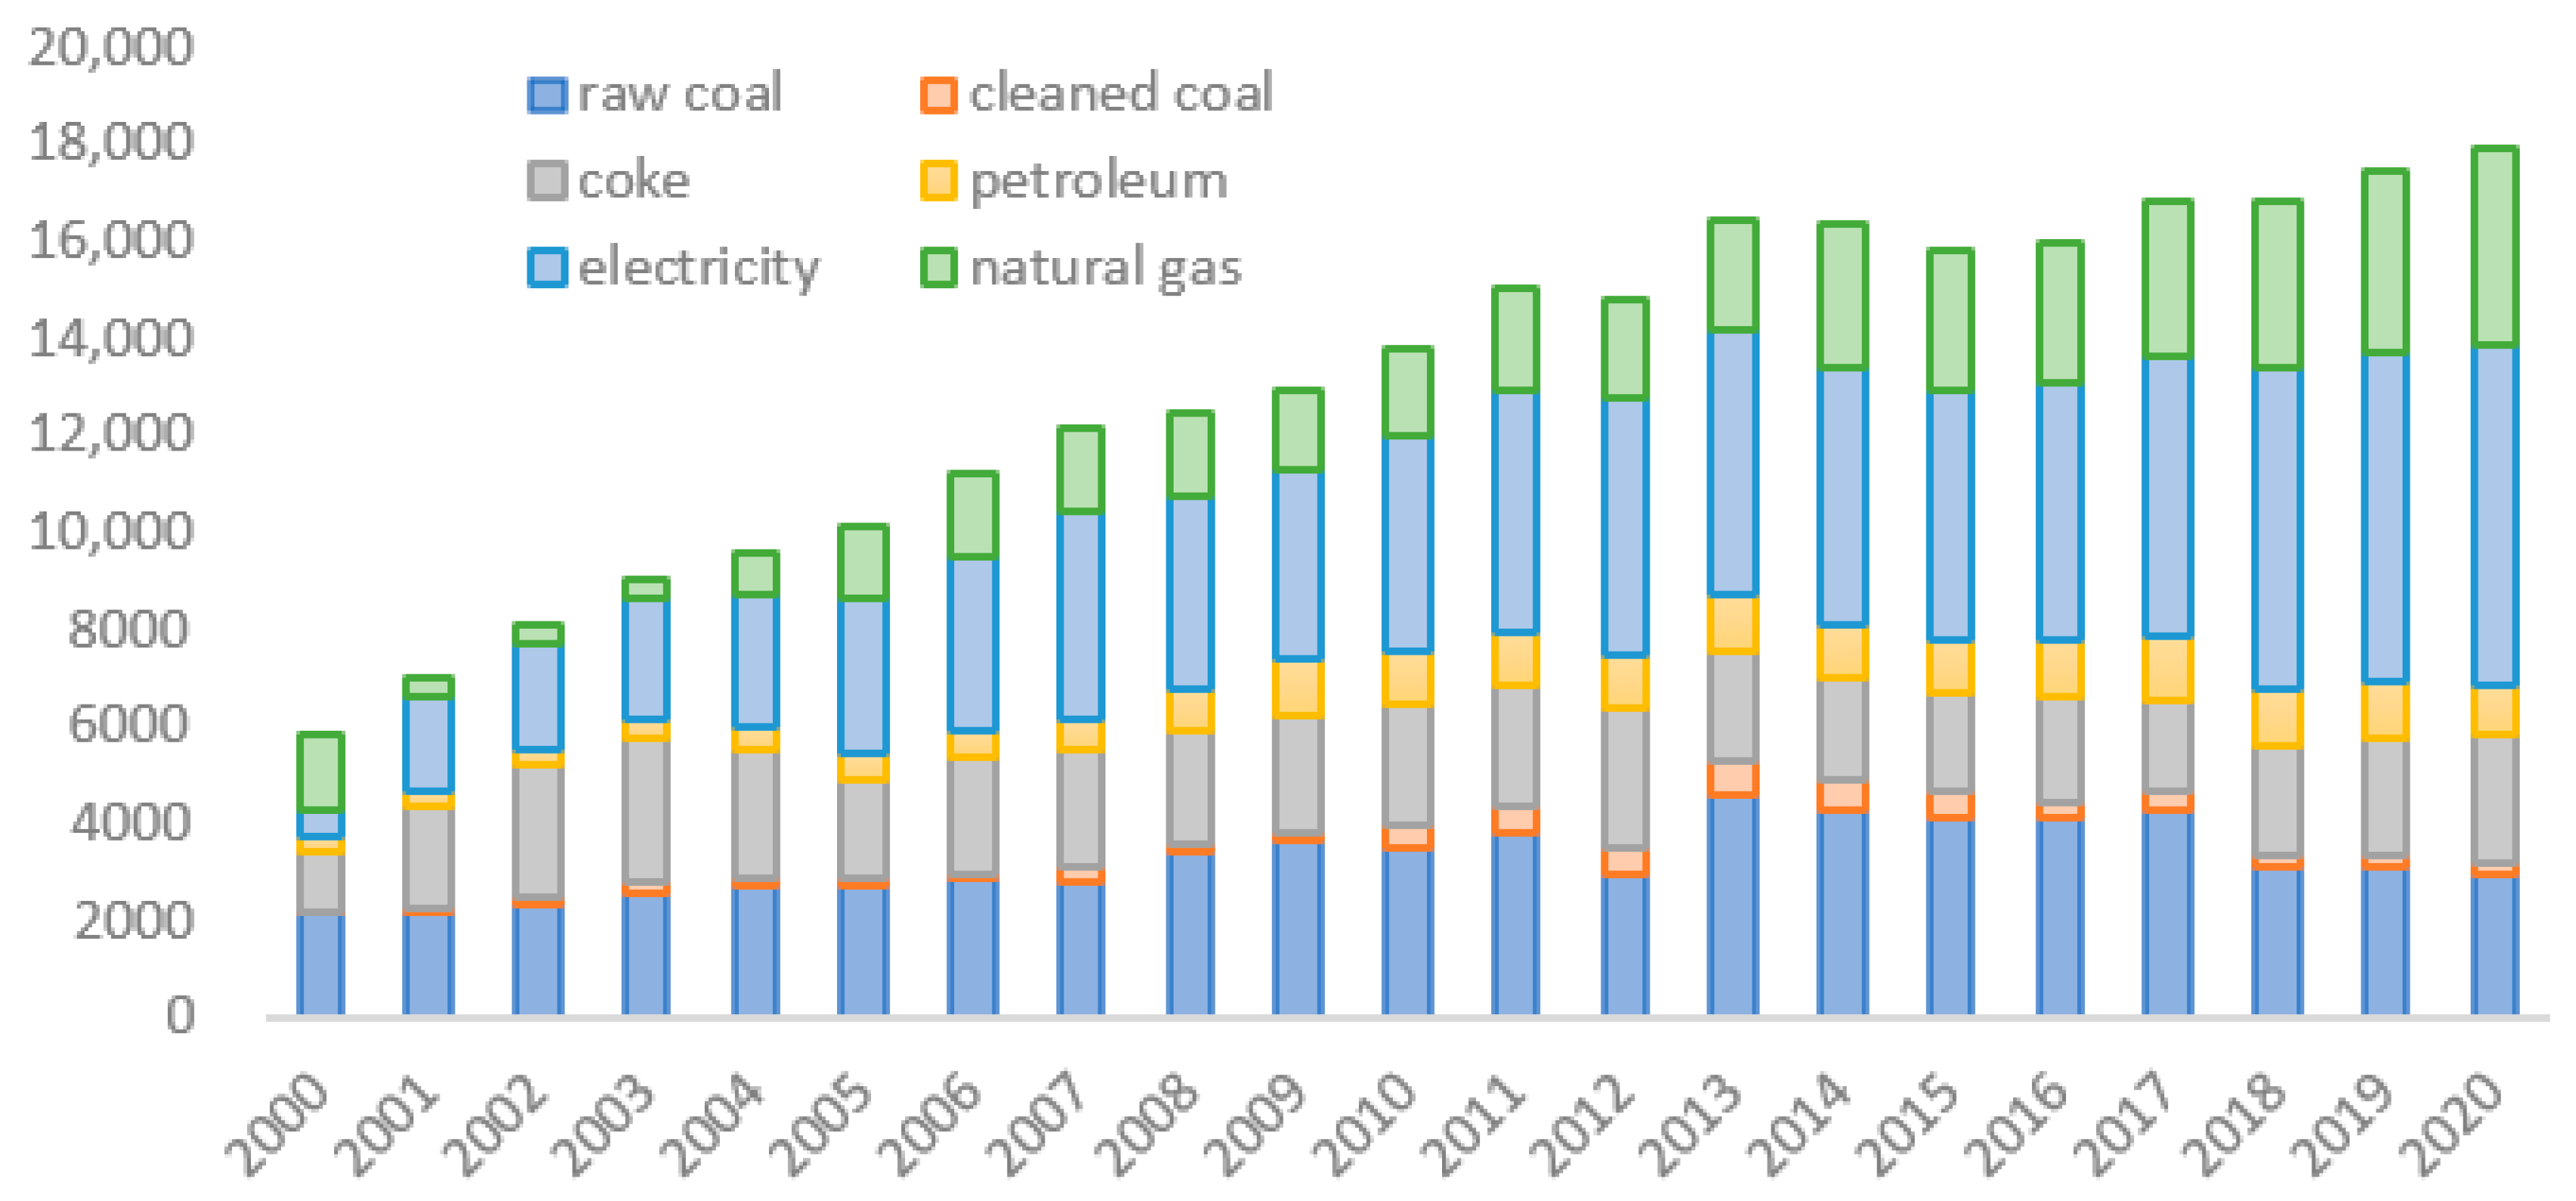
As shown in Figure 2, the primary forms of energy consumption of Shanxi Province are the burning of coal, oil, and natural gas and the use of electricity. In these four categories with six forms of energy, the consumption and proportion of various forms of energy are represented by standard coal after conversion. Shanxi Province is a typical coal resource-based area, and its primary form of energy consumption is the burning of coal. In the early days of the founding of the People’s Republic of China, coal consumption in Shanxi Province accounted for more than 90% of all energy consumption. In recent years, with further improvements in the natural gas and hydropower industries, coal consumption has decreased. In 2010, coal consumption in Shanxi Province increased by 10% compared with previous years, and the use of natural gas increased by 20.4%. By 2020, the use of natural gas in Shanxi Province increased nearly twofold compared with 2010, whereas the use of coal decreased by 16% in comparison with 2010.

Figure 2.
Energy consumption structure of Shanxi Province (2000–2020).
There are a large number of sedimentary rocks in Shanxi Province, and a large number of basins are distributed on the continental facies, possibly having good natural conditions for the formation of natural gas. According to the relevant data analysis, the reserves of natural gas resources in Shanxi Province could potentially be between 4.5 trillion and 5.5 trillion cubic meters. Through the statistical analysis of the data in 2013, one finds that the storage of natural gas in Shanxi Province could be up to 0.5 trillion cubic meters, and its proven degree is more than 20%. However, the exploration of natural gas is still in the primary stage, and much natural gas still needs to be uncovered; therefore, the natural gas resources in Shanxi Province are still quite rich.
4.1.2. Changes in Energy Consumption
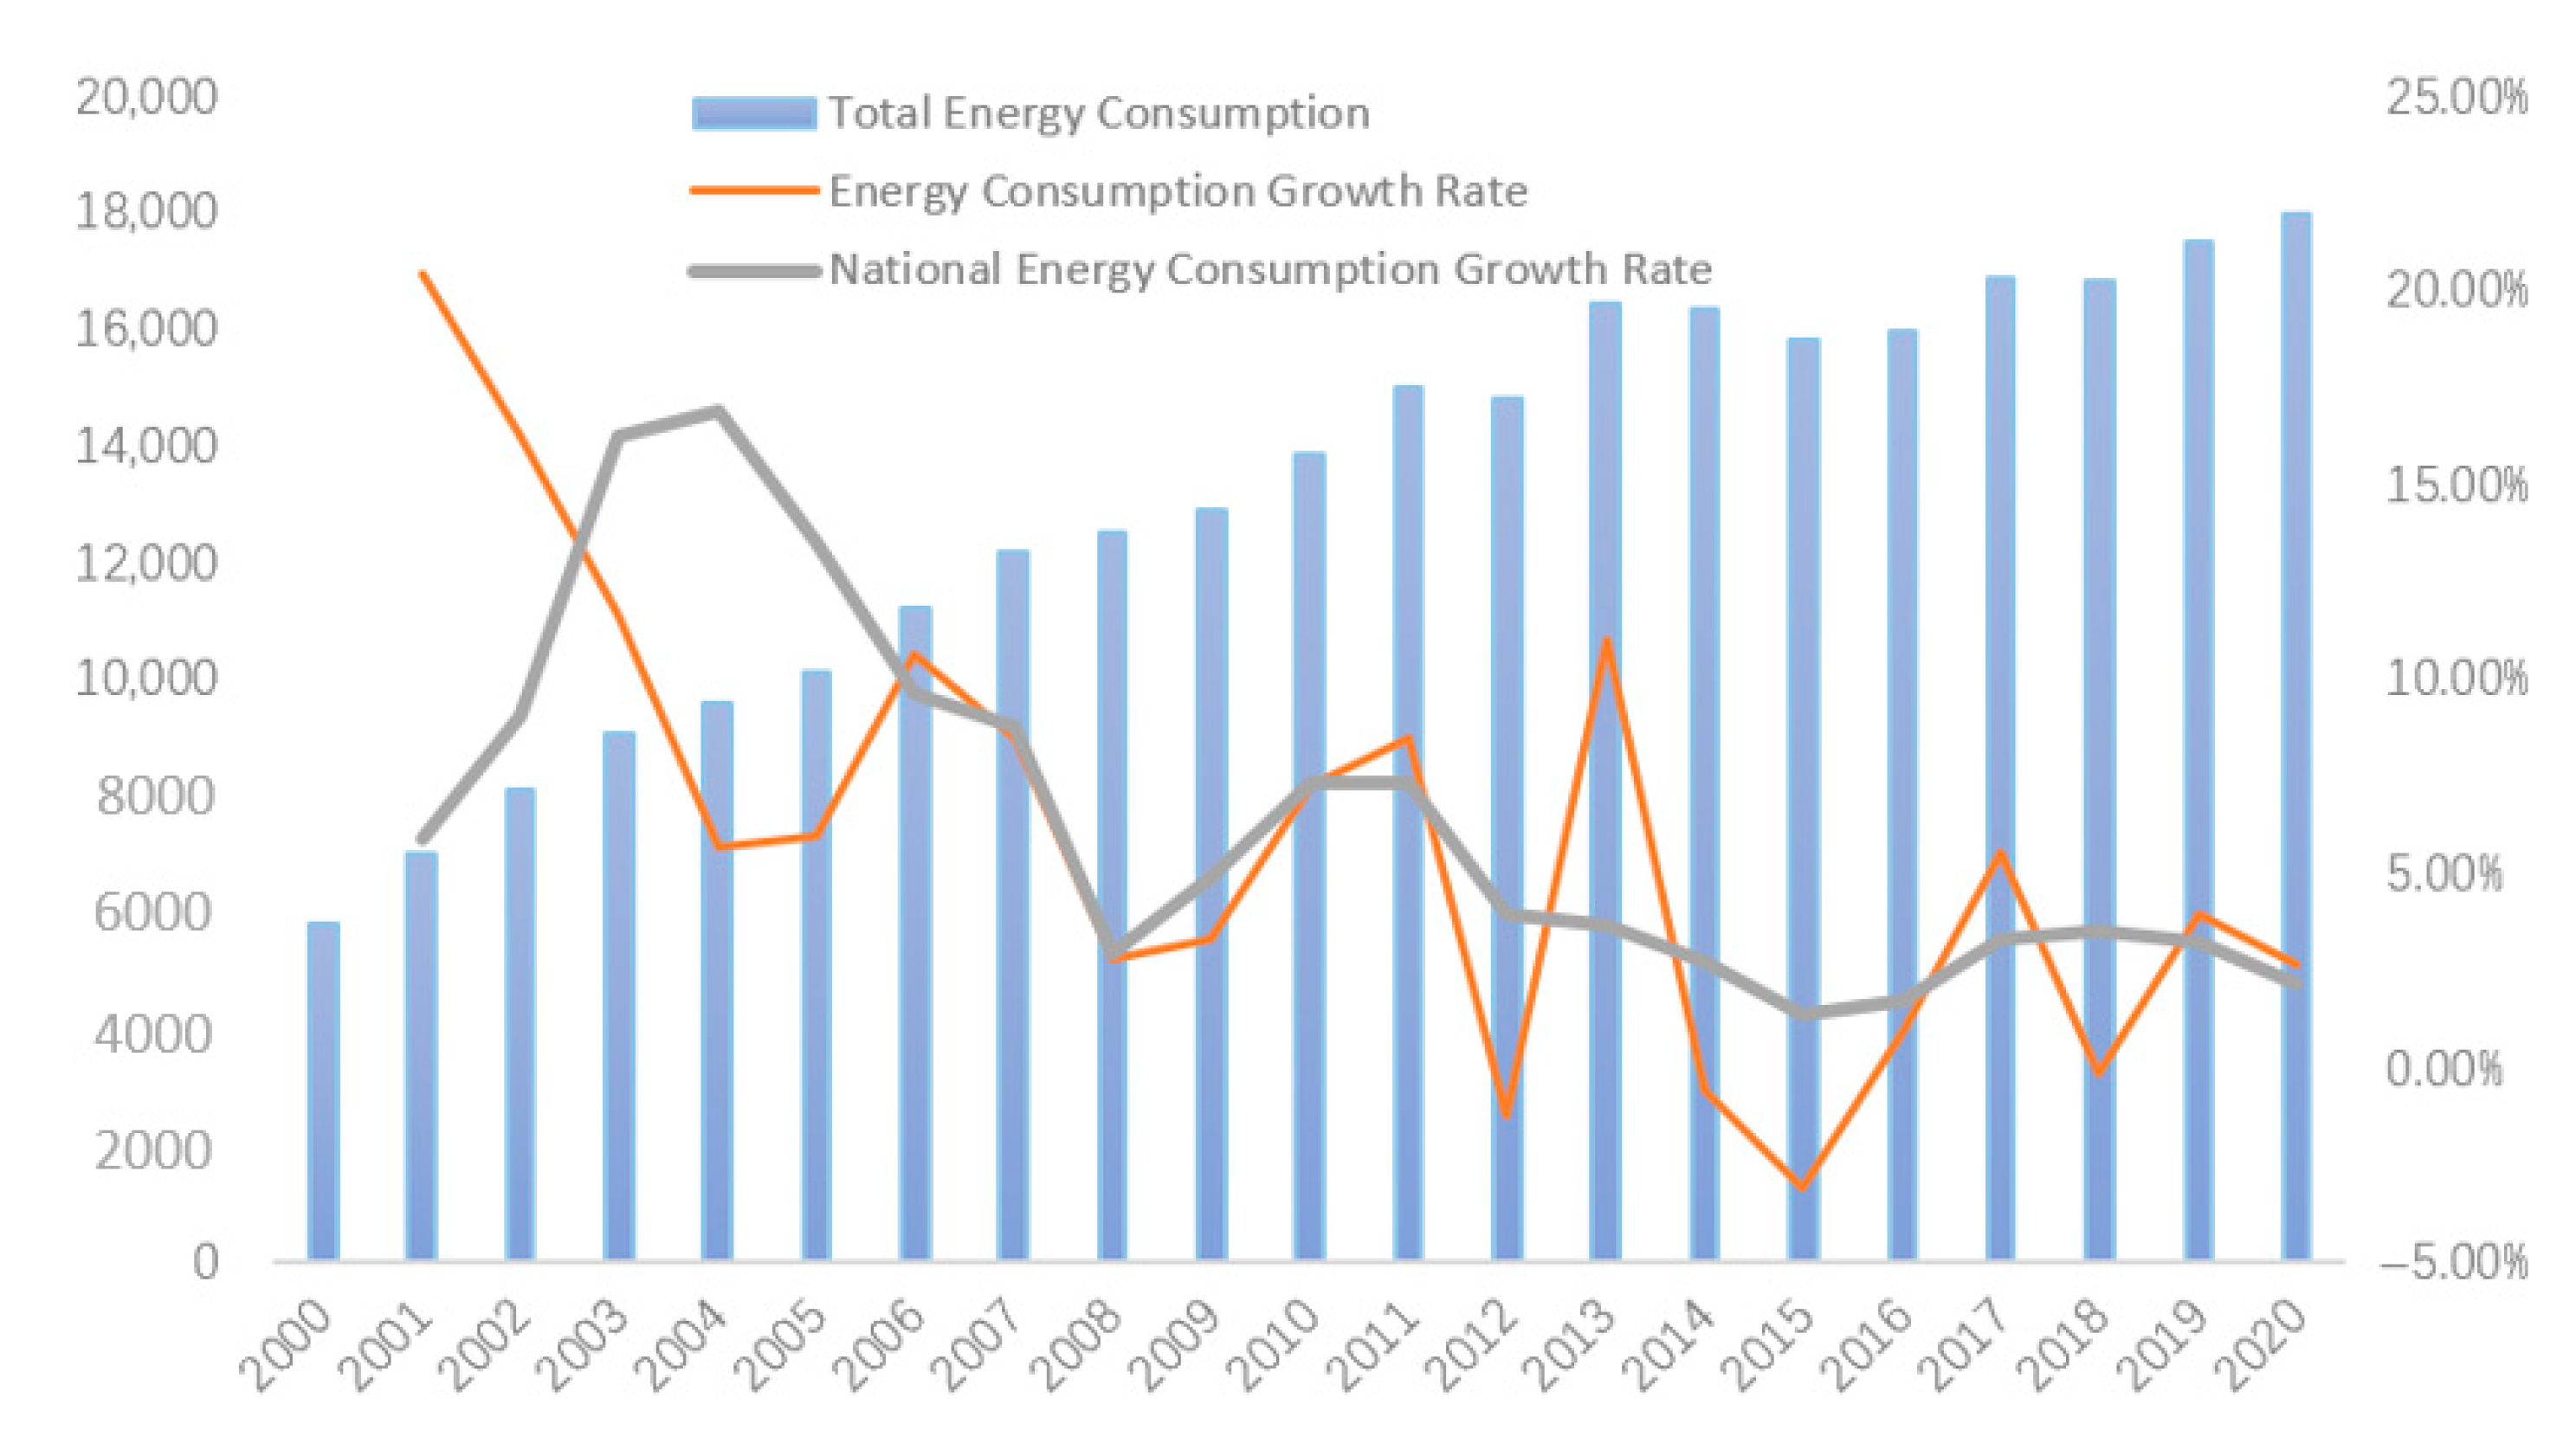
It can be seen from Figure 3 that the growth rate of energy consumption in Shanxi Province continued to decline from 2001 to 2004, whereas the growth rate of national energy consumption continued to rise. However, the growth rate of energy consumption in Shanxi Province was always higher than the national energy consumption growth rate in the period from 2001 to 2003. This was probably due to the impact of the financial crisis in Southeast Asia, wherein China’s economy experienced a depression from 2000 to 2003. In order to cope with the financial crisis in Southeast Asia, China continuously adjusted its economic structure. In 2001, China’s stock market crashed, and the overall economic structure faced many uncertainties. Therefore, due to slow economic regrowth, its energy consumption decreased. However, in terms of Shanxi, 2000 was the first year that the province implemented the third-step strategic goal of modernization, which was also an important period for strategic adjustment of the economic structure. Although it was affected by the financial crisis, energy consumption growth decreased but has still been maintained at over 5%, and thus, the total amount of energy consumption is still roughly increasing.

Figure 3.
Total energy consumption and growth rate in Shanxi Province (2000–2020).
From 2006 to 2011, the growth rate of energy consumption in Shanxi Province fluctuated greatly, but it was generally consistent with that of the national level. In 2011, the State Council issued the “National Environmental Protection 12th Five-Year Plan”, clearly implementing the units of gross domestic product energy consumption and carbon dioxide emissions reduction, involving the total emission of major pollutants in order to reduce the binding target, which was aimed at accelerating resource-saving and the development of an environmentally friendly society, wherein Shanxi’s energy consumption growth rate slowed down. However, due to the energy consumption in Shanxi Province entering a new round of growth in 2013 with the increase in fixed asset investment, the province mainly developed its heavy industry, and therefore it consumed large amounts of steel, construction materials, and other resources, making its energy consumption even faster than the speed of economic growth.
In order to ensure the full completion of the 12th five-year energy saving and emission reduction targets, the State Council issued the “2014–2015 Energy Saving and Emission Reduction Low-Carbon Development Action Plan” in 2014. Hence, in order to adjust and optimize the energy consumption structure, Shanxi Province implemented a management plan for responsible coal consumption, aimed at strictly controlling the total amount of coal consumption and reducing the proportion of coal consumption. Therefore, the total energy consumption in Shanxi Province decreased in the period of 2014–2015.
4.2. Analysis of Carbon Emissions in Shanxi Province
4.2.1. Index System
The super-efficiency SBM-DEA model is used to study carbon emission efficiency, and the input–output index system of carbon emission efficiency shows as Table 1. Here, the selected input variables generally include energy consumption, capital stock, and labor quantity; gross regional product (GDP) is generally selected as the expected output and carbon emissions is generally selected as the undesirable output [40,41].

Table 1.
Input–output index system of carbon emission efficiency.
Energy consumption in Shanxi Province involves the burning of coal, oil, and natural gas, among other forms. Labor is replaced by employment of the whole society, capital refers to the capital stock of the whole society with new increments, and carbon emissions is the consumption of various energy carbon emission coefficients. The energy carbon emission coefficient reference IPCC published the National Greenhouse Gas Emission Inventory Guidelines. The data used in this paper come from the Shanxi Statistical Yearbooks and the China Urban Statistical Yearbooks from 2001 to 2021.
4.2.2. Carbon Emissions Efficiency of Shanxi Province
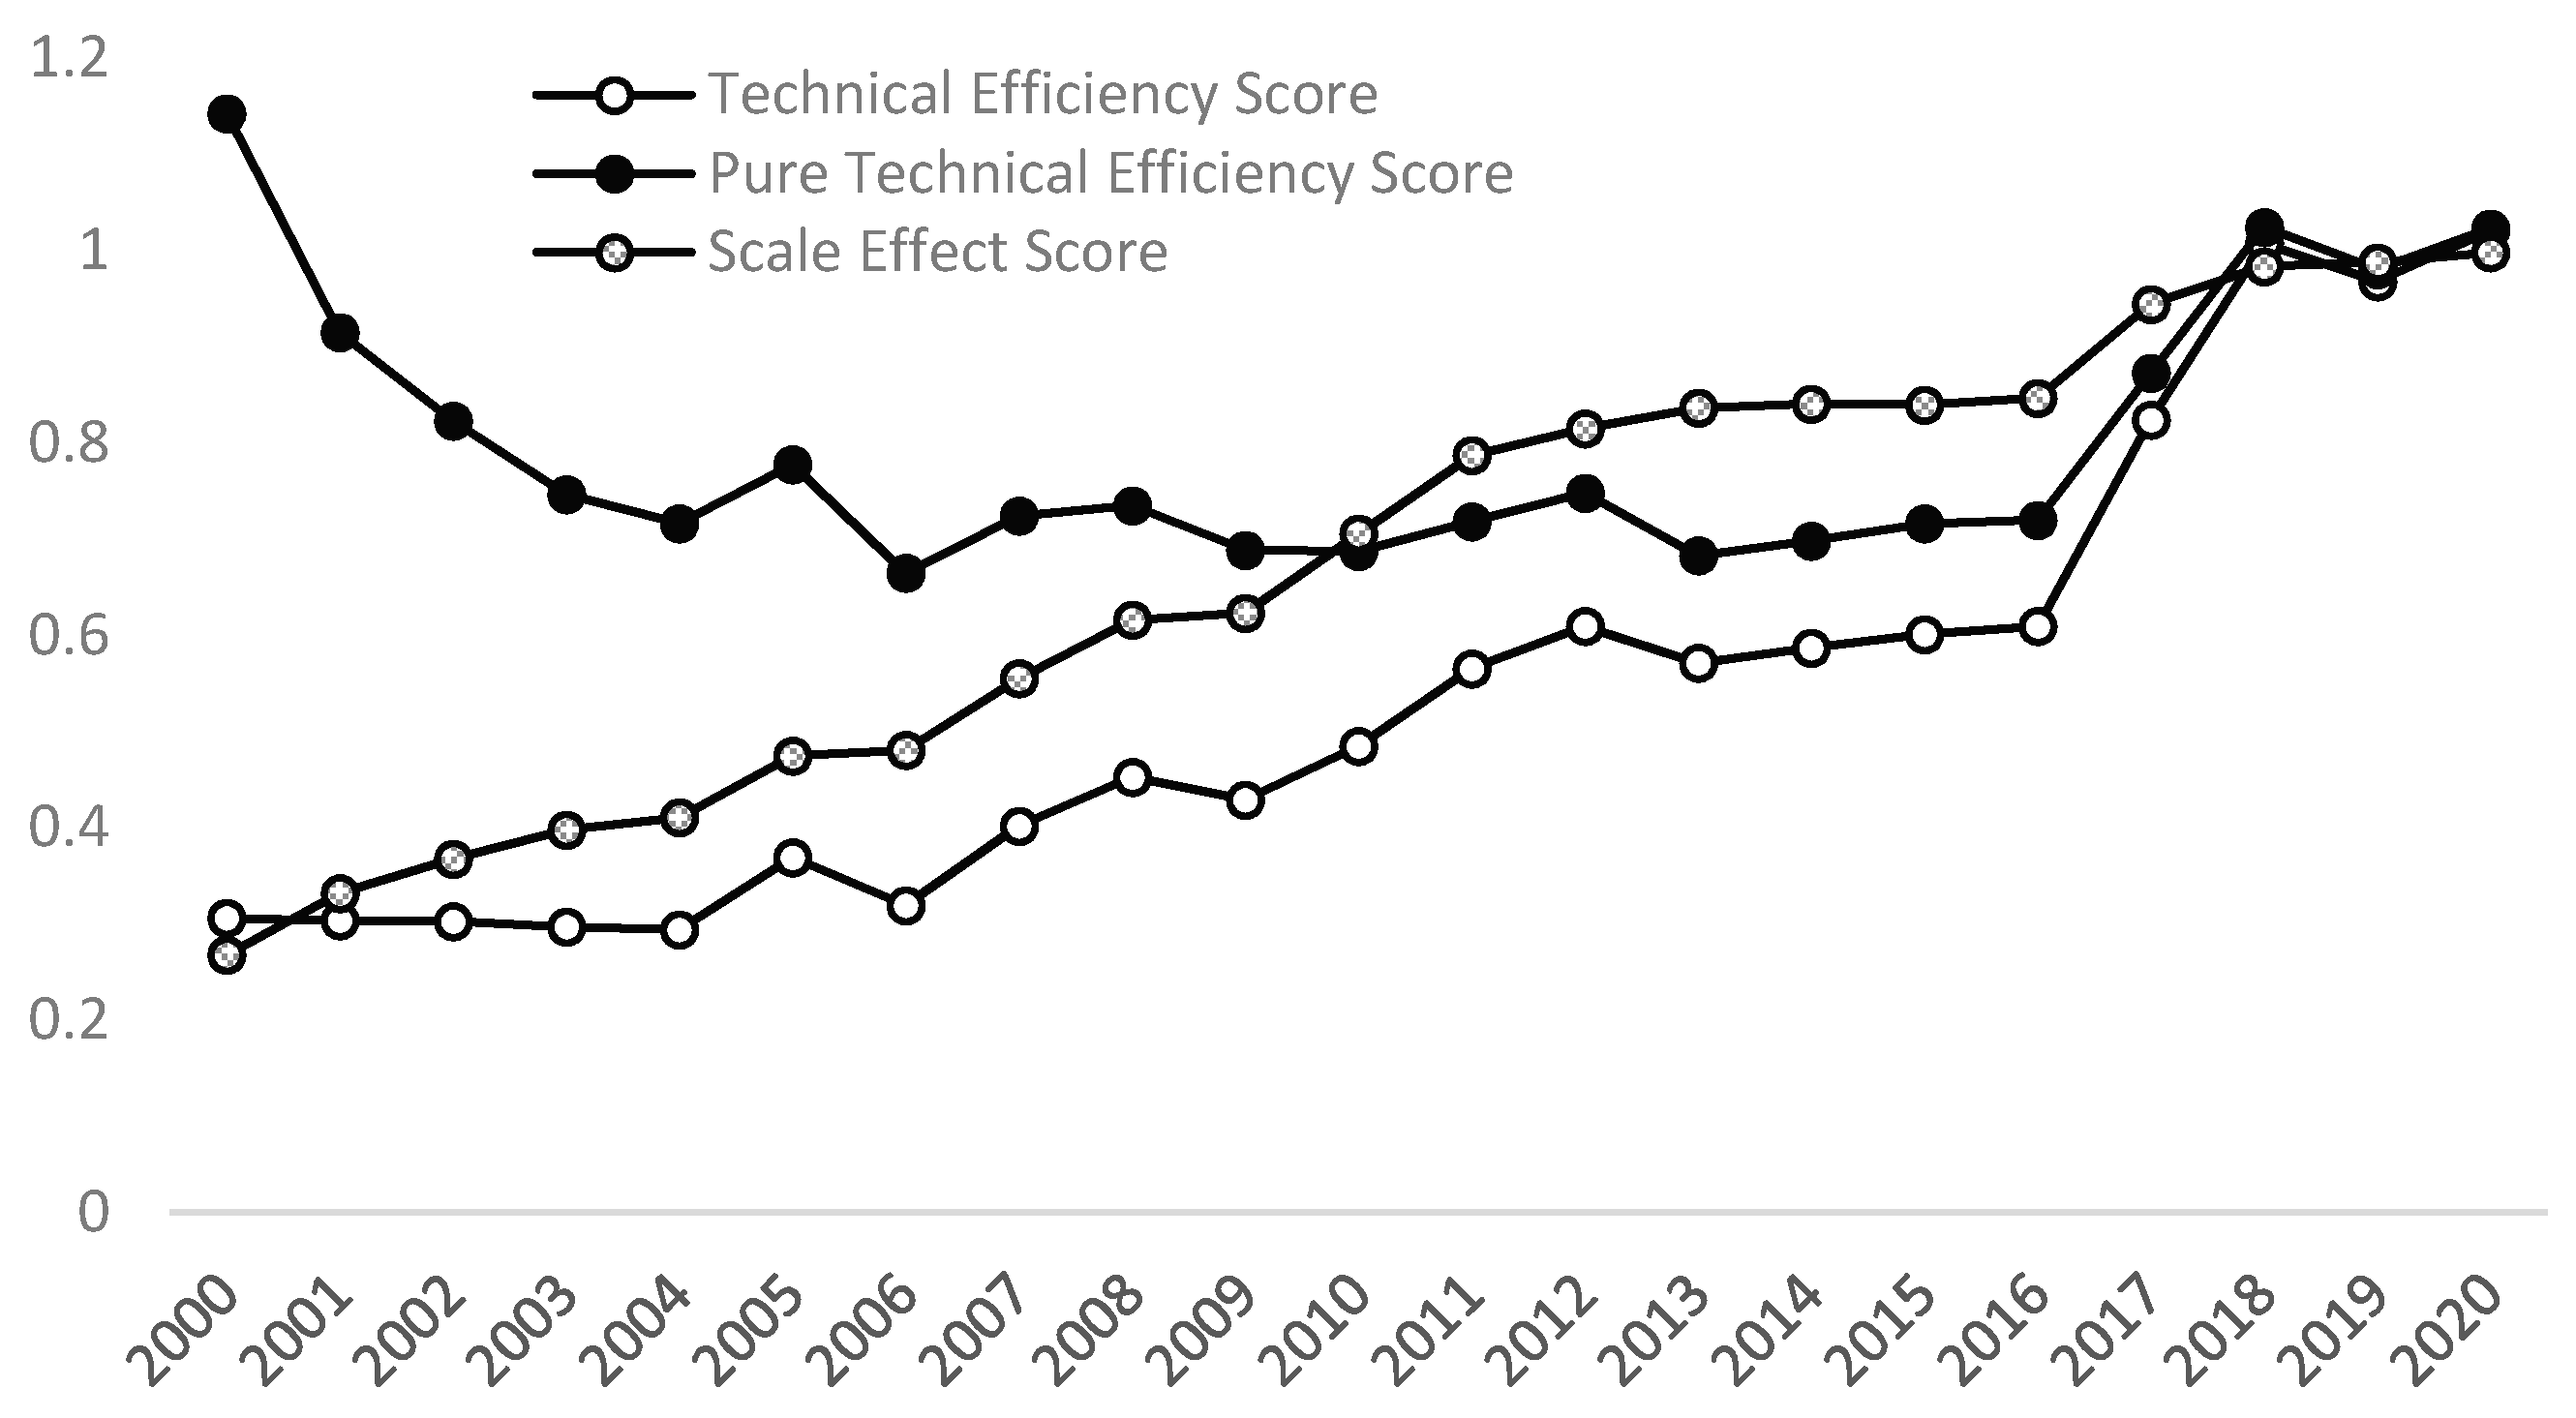
Utilizing the super-efficiency SBM-DEA model and MAXDEA software, one can calculate the carbon emission efficiency of Shanxi Province, as shown in Figure 4. From 2000 to 2020, the comprehensive technical efficiency and scale efficiency of carbon emission in Shanxi Province were basically consistent and showed an upward trend. Pure technical efficiency showed a downward trend from 2000 to 2003 and decreased rapidly, which has been consistent with the overall comprehensive technical efficiency since 2003. The average values of comprehensive technical efficiency, pure technical efficiency, and scale efficiency of carbon emissions in Shanxi Province from 2000 to 2020 were 0.54, 0.80, and 0.67, respectively. The comprehensive technical efficiency, pure technical efficiency, and scale efficiency of carbon emissions have not yet reached the production frontier, indicating that in the current situation, Shanxi Province has a large space for carbon emission reduction. Carbon efficiency rose from 0.31 to 1.02, with an average annual growth rate of 6.9%.

Figure 4.
Changes in carbon emission efficiency in Shanxi Province (2000–2020).
Under the guidance of relevant national policies, Shanxi Province has effectively slowed down carbon dioxide emissions by accelerating industrial restructuring, promoting industrial transformation, and upgrading, as well as by forcing traditional industries to improve quality and efficiency. The growth rate of total carbon dioxide emissions generated by energy consumption has gradually slowed down, and the carbon dioxide emission intensity per unit of GDP has decreased year by year. However, according to the current coal-based industrial structure and energy consumption structure, the province’s high carbon emission situation has not fundamentally changed, and it still faces the problems of a large total carbon emission base, high carbon emission intensity, and low efficiency of unit carbon emission output. In May 2020, Xi Jinping visited Shanxi, once again stressing that Shanxi should implement the pilot requirements of the comprehensive reform of the energy revolution; continuously promote the adjustment and optimization of its industrial structure; implement a number of transformative, inclusive, and symbolic measures; and fundamentally abandon the extensive development mode.
4.2.3. Carbon Emission Efficiency of 11 Prefecture-Level Cities
It can be seen from Table 2 that the cities with a total factor productivity index (MI) greater than 1 were Taiyuan, Changzhi, Shuozhou, Yuncheng, Xinzhou, Linfen, and Lvliang and that the carbon emission efficiency of these cities is continuing to improve. Taiyuan and Shuozhou have doubled their improvements in management level and technological progress. Lvliang showed a high management level—its level of technological progress did not achieve continuous improvement, but the overall level reached continuous improvement. Changzhi, Yuncheng, Xinzhou, and Linfen showed improvements at the technical level, but their development at the management level was found to be weak.
Table 2.
Carbon emission efficiency in 11 prefecture-level cities in Shanxi.
The technical efficiency (EC), technological progress (TC), and total factor productivity (MI) of Shuozhou and Taiyuan were found to be greater than 1, revealing that the level of regional carbon emission efficiency has been continuously strengthened. The carbon emission intensity of Shuozhou decreased by 80% from 2000 to 2020 due to the development of new materials, new energy, and other forms of green industry; the agricultural structure gradually being optimized; clean and efficient use of coal; and the rise in ecological tourism. Taiyuan is the capital city of Shanxi Province, having a high level of economic and technological development. In order for the carbon emission reduction targets issued by the province to be completed, the ability of Taiyuan to cope with climate change must be enhanced, an industrial system and consumption mode characterized by low emissions must be built, and the transformation and leapfrog development of Taiyuan must be accelerated.
The technical efficiency of Lvliang was found to be greater than 1, and the management and decision-making level of regional carbon emissions continues to progress; however, the technical progress was found to be less than 1, meaning that the improvement in total factor productivity is restricted. From 2000 to 2020, the carbon emission intensity of Lvliang decreased by 91%, but the carbon emission increased by 90.7%, indicating that carbon emission has not reached the peak and that carbon emission reduction has a certain impact on total factor productivity. The total factor productivity of Lvliang is mainly restricted by its technical efficiency. Similarly, Wei and Yu et al. found that the progress in energy conservation and emission reduction technology has led to a decline in the carbon emission intensity on a year-by-year basis, thus promoting the sustainable economic development of Shanxi [23,42]. Hence, technical progress has played an extremely key role and has an important function in enhancing carbon emission reduction. It is essential to strengthen scientific and technological research and development (R&D) investments and to introduce advanced production technology in order to improve local production technology and energy efficiency [43].
Technical efficiency and technological progress in Datong and Yangquan were found to be less than 1, and total factor productivity showed a downward trend. The negative impact of carbon emissions on total factor productivity in these cities is relatively obvious. The technical efficiency index of Jincheng was found to be greater than 1, whereas the technical progress index was less than 1, and total factor productivity was found to be affected by technical progress. The coal industry has been dominant in the secondary industry of Jincheng City. The heavy-duty characteristics of the industrial structure are obvious, and the scientific and technological foundation of Jincheng City is weak. There are deficiencies in the utilization efficiency of new energy, the popularization and application of green low-carbon technology, and the construction of the systematic ability of related technological innovation. The technical efficiency index of Jinzhong City was found to be less than 1, and the technical progress index was found to be greater than 1. Total factor productivity was restricted by technical efficiency. In 2000–2020, carbon emissions in Jinzhong City nearly doubled, mainly due to its vigorous development of the heavy chemical industry, indicating that the industrial structure has a significant impact on carbon emissions and carbon emission efficiency.
4.2.4. Spatial-Temporal Differentiation of Carbon Emission Efficiency in Shanxi Province
Technical efficiency takes into account the impact of technological progress and scale change to a certain extent and is often used as a form of comprehensive efficiency or carbon emission efficiency [44,45]. Therefore, this paper took technical efficiency as a carbon emission efficiency index in order to analyze the spatial and temporal differences of carbon emission efficiency in Shanxi Province from 2000 to 2020.
In this paper, the years 2000, 2005, 2010, 2015, and 2020 were selected as time periods of interest, and the technical efficiency was divided into five categories using the ArcGIS10.8 natural discontinuity method. From the spatial and temporal evolution of carbon emission efficiency in Shanxi Province (see Figure 5), we found that the carbon emission efficiency of the whole province gradually dispersed and improved from the central and northern regions to the southern regions in the period of 2000–2020.
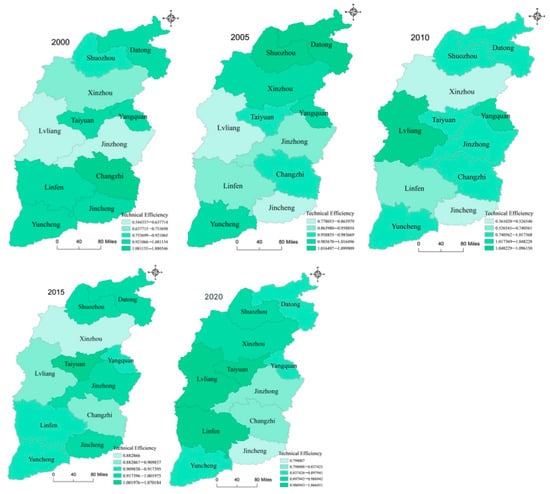
Figure 5.
Distribution pattern of carbon emission efficiency in Shanxi Province.
From the carbon emission efficiency of Shanxi Province in 2000, we found that the carbon emission efficiency of the southern region was better and that the carbon emission efficiency of the central region was quite different. Taking the high efficiency level of Taiyuan City and Yangquan City and the low efficiency level of Lvliang City and Jinzhong City as representatives, we found that the carbon emission efficiency of Datong City, Shuozhou City, and Xinzhou City in the northern region showed a ladder-like change. In 2005, the regions with low carbon emission efficiency in Shanxi Province shifted significantly to the south, and the carbon emission efficiency of Shuozhou City and Xinzhou City improved. In 2010, the carbon emission efficiency of Shanxi Province decreased significantly in the northern region. In 2015, the carbon emission efficiency of Shanxi Province improved in the northern and central regions. By 2020, the carbon emission efficiency of Shanxi Province was at a high level, except in the three cities in the southeast.
5. Conclusions and Suggestions
This paper analyzed the energy consumption of Shanxi Province from 2000 to 2020. The results show that the primary source of energy consumption of Shanxi Province has come from the burning of coal, and its economic development has been dependent on the resource industry. In order for energy conservation and emission reduction to be achieved, it is necessary for the development of emerging industries to be accelerated, for the transformation and upgrading of traditional industries to be promoted, and for the optimization of energy structures to be encouraged [43,44]. The Malmquis index of the super-efficiency SBM-DEA model was used to measure the carbon emission efficiency of Shanxi Province and its 11 prefecture-level cities. The results show that, although the carbon emission speed of Shanxi Province has slowed down, it still faces the problems of a large base of total emission, high carbon emission intensity, and low output benefit per unit of carbon emission. There are great differences in the carbon emission efficiencies among the 11 prefecture-level cities. Only the technical efficiency, technological progress, and total factor productivity of Taiyuan and Shuozhou were found to be greater than 1. Overall, the industrial structure was found to be the key factor restricting the efficiency of carbon emissions in Shanxi Province, and carbon reduction potential was found to be high.
Through the analysis of energy consumption and carbon emissions in Shanxi Province, we argue that, during the development of a low-carbon economy in Shanxi Province, stakeholders need to pay attention to the following points: (1) the utilization of coal should become a more green process; clean energy should be vigorously developed; the coordinated and orderly development of new energy growth, consumption, and energy storage should be promoted; multi-energy complementary development should be promoted; and a green multi-energy supply system should be formed. (2) The proportion of coal consumption should be reduced, fossil energy consumption should be controlled, non-fossil energy should be vigorously developed, the development of renewable energy should be accelerated, low-carbon transportation should be vigorously developed, green buildings should be actively developed, green low-carbon technological innovations should be promoted, green low-carbon production and lifestyle should be implemented, and a system conducive to energy conservation and green energy consumption should be established and improved. (3) The ecological carbon sink capacity should be actively improved; key projects such as natural forest protection, conversion of cropland to forest, artificial afforestation, and wetland vegetation restoration should be scientifically promoted; and large-scale land-greening activities should be carried out in the province to create a green and low-carbon life. (4) For cities with different carbon emission efficiency levels, different emission reduction policies should be adopted according to the actual situation of their technical progress index and technical efficiency index. For regions with serious and inefficient carbon emissions, adequate financial and policy support should be provided. For regions with leading carbon emission levels, it is only necessary to guide them in continuing their development in accordance with the current trends. For cities with mid-range carbon emission efficiency levels, especially cities with a significant innate carbon emission reduction potential, attention should be paid to the research and development of low-carbon technologies and the optimization of energy structures, which are helpful in the realization of the carbon emission reduction goals.
The conclusions of this study have made important contributions to theory and practice. Based on the use of super efficiency slack-based measure and data envelopment analysis (SBM-DEA) model to study the carbon emission efficiency of Shanxi Province, this paper uses the Malmquist index model and the natural discontinuity method in ArcGIS to study the carbon emission efficiency and its spatial and temporal differentiation of 11 prefecture-level cities in Shanxi Province. The research results of carbon emission efficiency in Shanxi Province show that, although the carbon emission rate in Shanxi Province has slowed down, it still faces the problems of a large total emission base, high carbon emission intensity, and low efficiency of the unit carbon emission output. Therefore, Shanxi Province must optimize its industrial structure, accelerate research and development in low-carbon technologies, and adjust the energy structure. The results of the study on the carbon emission efficiency and spatial-temporal differentiation of 11 prefecture-level cities in Shanxi Province show that cities with different carbon emission efficiency levels and different emission reduction policies should be adopted according to the actual situation of their technical progress index and technical efficiency index.
The Chinese National Bureau of Statistics reports that, as the world’s largest coal consumer and greenhouse gas emission countries, concerning China’s coal consumption in recent years, although the proportion has decreased, the overall coal consumption is still increasing. Shanxi Province is a comprehensive reform pilot area of energy revolution. Its research results have reference significance for the same type of regions in the country. Recommendations include: (1) Change the method of coal mining to fit the green intelligent era. Green intelligence is the development trend of the world’s coal industry, and it is also a major proposition that China’s coal industry must solve. (2) Innovate coal utilization methods to improve the level of clean and efficient utilization. (3) Promote changes in energy consumption patterns, build clean low-carbon consumption models, etc.
Although the aim of this study was realized, it nevertheless needs to be observed that our study also has certain limitations. For example, other provinces and cities in the Yellow River Basin were not analyzed. In the future, the research area could be expanded to these regions. Moreover, the data collection channels were relatively limited, and only 21 years of observations were analyzed. In the future, research can be conducted from the 1980s in order to find the impact of the China reform and opening-up policy, as well as the family planning policy on carbon emissions. Finally, the selection of influential factors in carbon emission efficiency was based on the availability of data, and the selection range was narrow; therefore, the selection of these factors and indicators needs to be studied further, which will make the research more comprehensive and more thorough.
Author Contributions
X.G.: conceptualization, funding acquisition, review and editing. X.W. (Xueling Wu): data curation, writing—original draft. X.W. (Xin Wang) and Y.L.: review and editing. X.C.: supervision, review and editing. All authors have read and agreed to the published version of the manuscript.
Funding
This research was funded by Ministry of Education Humanities and Social Sciences Research Youth Fund Project (20YJC630032).
Institutional Review Board Statement
Not applicable.
Informed Consent Statement
Not applicable.
Data Availability Statement
Not applicable.
Conflicts of Interest
The authors declare no conflict of interest.
References
- Kisielińska, J.; Roman, M.; Pietrzak, P.; Roman, M.; Łukasiewicz, K.; Kacperska, E. Utilization of Renewable Energy Sources in Road Transport in EU Countries—TOPSIS Results. Energies 2021, 14, 7457. [Google Scholar] [CrossRef]
- Lee, R. The outlook for population growth. Science 2011, 333, 569–573. [Google Scholar] [CrossRef] [PubMed] [Green Version]
- Sharif, A.; Godil, D.I.; Xu, B.; Sinha, A.; Khan, S.A.R.; Jermsittiparsert, K. Revisiting the role of tourism and globalization in environmental degradation in China: Fresh insights from the quantile ARDL approach. J. Clean. Prod. 2020, 272, 122906. [Google Scholar] [CrossRef]
- Nerini, F.F.; Sovacool, B.; Hughes, N.; Cozzi, L.; Cosgrave, E.; Howells, M.; Tavoni, M.; Tomei, J.; Zerriffi, H.; Milligan, B. Connecting climate action with other Sustainable Development Goals. Nat. Sustain. 2019, 2, 674–680. [Google Scholar] [CrossRef]
- Alam, M.M.; Murad, M.W.; Noman, A.H.M.; Ozturk, I. Relationships among carbon emissions, economic growth, energy consumption and population growth: Testing Environmental Kuznets Curve hypothesis for Brazil, China, India and Indonesia. Ecol. Indic. 2016, 70, 466–479. [Google Scholar] [CrossRef]
- Liu, C.L. Definition, connotation and related concepts of low carbon economy. Commer. Times 2011, 21, 10–11. [Google Scholar]
- Zhuang, G.Y.; Dou, X.M.; Wei, M.X. Theoretical Interpretation and Path Analysis of Carbon Neutralization in Carbon Peaks. J. Lanzhou Univ. 2022, 50, 57–68. [Google Scholar]
- Jia, K. Carbon peak and carbon neutrality: The inevitable choice and problem solving of high-quality development. J. Int. Financ. 2021, 11, 3–6. [Google Scholar]
- Fang, S.J.; Zhu, Y.F. Analysis of energy economic development from the perspective of ’carbon peak’ and ’carbon neutralization’. J/OL. Xinjiang Norm. Univ. 2022, 3, 1–10. [Google Scholar]
- Opinions of the Central Committee of the Communist Party of China and the State Council on the Complete and Accurate Implementation of the New Development Concept to Do a Good Job of Carbon Peak Carbon Neutralization Released. Available online: https://kns.cnki.net/kcms/detail/detail.aspx?dbcode=CJFD&dbname=CJFDLAST2022&filename=GTJJ202111005&uniplatform=NZKPT&v=nxtAgOdjGvFcTO2tvUhbAPyebzot5tZ4YSpeI8R3UGVZ9x-CLOYd1tLvLRQL03nH (accessed on 1 January 2022).
- Guidance on Accelerating the Establishment and Improvement of a Green and Low-Carbon Cycle economic System. Available online: http://www.gov.cn/zhengce/content/2021-02/22/content_5588274.htm (accessed on 1 January 2022).
- Wang, B. The era requirements, strategic objectives and international governance experience of the national strategy for ecological protection and high-quality development in the Yellow River Basin. J. Yunnan Adm. Coll. 2021, 6, 149–161. [Google Scholar]
- Chong, C.T.; Van, F.Y.; Tin, L.C.; Jaromír, K.J. Post COVID-19 ENERGY sustainability and carbon emissions neutrality. Energy 2022, 241, 122801. [Google Scholar] [CrossRef]
- Bamadev, M.; Mohd, I. Asymmetric impacts of energy efficiency on carbon emissions: A comparative analysis between developed and developing economies. Energy 2021, 227, 120485. [Google Scholar] [CrossRef]
- Godil, D.I.; Yu, Z.; Sharif, A.; Usman, R.; Khan, S.A.R. Investigate the role of technology innovation and renewable energy in reducing transport sector CO2 emission in China: A path toward sustainable development. Sustain. Dev. 2021, 29, 694–707. [Google Scholar] [CrossRef]
- Adeolu, O.; Adewuyi, O.B. Awodumi. Biomass energy consumption, economic growth and carbon emissions: Fresh evidence from West Africa using a simultaneous equation model. Energy 2017, 119, 453–471. [Google Scholar] [CrossRef]
- Ramanathan, R. A multi-factor efficiency perspective to the relationships among world GDP, energy consumption and carbon dioxide emissions. Technol. Forecast. Soc. Chang. 2005, 73, 483–494. [Google Scholar] [CrossRef]
- Ding, L.L.; Lei, L.; Zhao, X.; Calin, A.C. Modelling energy and carbon emission performance: A constrained performance index measure. Energy 2020, 197, 117274. [Google Scholar] [CrossRef]
- Yang, X.Y.; Li, N.; Mu, H.L.; Pang, J.R.; Zhao, H.; Mahmood, A. Study on the long-term impact of economic globalization and population aging on CO2 emissions in OECD countries. Sci. Total Environ. 2021, 787, 147625. [Google Scholar] [CrossRef]
- Wu, R.; Wang, J.Y.; Wang, S.J.; Feng, K.H. The drivers of declining CO2 emissions trends in developed nations using an extended STIRPAT model: A historical and prospective analysis. Renew. Sustain. Energy Rev. 2021, 149, 111328. [Google Scholar] [CrossRef]
- Zhang, H.S.; Li, S.P.; Peng, M. Dynamic Identification of Regional Imbalance and Driving Factors of Carbon Emissions from Rural Energy Consumption in China. J/OL. Chin. Rural. Econ. 2022, 1, 112–134. [Google Scholar]
- Song, F.L.; Han, C.F.; Teng, M.M. Driving Factors Analysis and Optimization Strategy of Carbon Emissions from Energy Consumption in Yangtze River Delta Region. J/OL. Ecol. Econ. 2022, 1–16. Available online: http://kns.cnki.net/kcms/detail/53.1193.F.20220106.1556.004.html (accessed on 1 January 2022).
- Yu, Z.H.; Fang, D.; Yang, J. Evaluation of the impact of policies on carbon emissions in resource-based economic transition pilot areas—Taking Shanxi Province as an example. Resour. Sci. 2021, 43, 1178–1192. [Google Scholar]
- Wang, R.; Zhang, H.; Qiang, W.L.; Li, F.; Peng, J.Y. Spatial distribution characteristics and influencing factors of carbon emissions in county-level cities in China based on urbanization. Prog. Geogr. 2021, 40, 1999–2010. [Google Scholar]
- Liu, Y.X.; Deng, X.R. Empirical Study on Influencing Factors of Carbon Emissions in China Based on Fixed Effect Panel Quantile Regression Model. J. Shanxi Univ. 2021, 44, 86–96. [Google Scholar]
- Han, Y.Y.; Liao, J.Y.; Zhang, W.; Pi, H.J. Calculation and prediction of carbon emission from industrial scale energy consumption in Changsha. Territ. Nat. Resour. Study 2017, 5, 46–50. [Google Scholar]
- Wang, Q.; Su, M. Drivers of decoupling economic growth from carbon emission—An empirical analysis of 192 countries using decoupling model and decomposition method. Environ. Impact Assess. 2020, 81, 106356. [Google Scholar] [CrossRef]
- Yu, J.L.; Shao, C.; Xue, C.F.; Hu, H.Q. China’s aircraft-related CO2 emissions: Decomposition analysis, decoupling status, and future trends. Energy Policy 2020, 138, 111215. [Google Scholar] [CrossRef]
- Dong, Y.N.; Fan, B.K.; Li, S.P.; Monocyanine. Research on ecological protection and high-quality development of the Yellow River Basin from the perspective of ecological civilization. Ecol. Econ. 2022, 38, 217–222. [Google Scholar]
- Niu, L.; Wang, K. Research on safety supervision model of Shanxi group coal enterprises. Procedia Eng. 2012, 43, 499–505. [Google Scholar] [CrossRef] [Green Version]
- Wang, S.Z. Review and Prospect of Shanxi Coal Industry for 70 Years. China’s Coal Ind. 2020, 1, 14–18. [Google Scholar]
- Wang, Y.Q. Construction of Performance Evaluation System for Comprehensive Reform of Shanxi Energy Revolution—Taking Datong City as an Example. Econ. Issues 2021, 1, 106–111. [Google Scholar]
- Sharek, A.S.; Shah, K.U. Tracking the quality of scientific knowledge inputs in reports generated by the Intergovernmental Panel on Climate Change (IPCC). Environ. Stud. Sci. 2021, 11, 586–594. [Google Scholar] [CrossRef]
- Tomas, M.; Ernest, A. The Evolution of Communicating the Uncertainty of Climate Change to Policymakers: A Study of IPCC Synthesis Reports. Sustainability 2021, 13, 2466. [Google Scholar] [CrossRef]
- Zhu, S.L.; Cai, B.F.; Zhu, J.H.; Gao, Q.X.; Zhang, Z.Y.; Yu, S.M.; Fang, S.X.; Pan, X.B. The main content and enlightenment of IPCC national greenhouse gas inventory guidelines refinement. Clim. Chang. Res. Prog. 2018, 14, 86–94. [Google Scholar]
- Sun, X.M.; Zhang, H.; Wang, G. Research on regional carbon emission efficiency based on super-efficiency SBM model—taking 17 prefecture-level cities in Shandong Province as an example. Ecol. Econ. 2016, 32, 68–73. [Google Scholar]
- Kaoru, T. A Slacks-based Measure of Efficiency in Data Envelopment Analysis. Eur. J. Oper. Res. 2002, 143, 32–41. [Google Scholar] [CrossRef] [Green Version]
- Mika, K. Dynamic environmental performance analysis: A Malmquist index approach. Ecol. Econ. 2008, 64, 701–715. [Google Scholar] [CrossRef]
- Zhou, P.; Ang, B.W.; Han, J.Y. Total Factor Carbon Emission Performance: A Malmquist Index Analysis. Energy Econ. 2010, 32, 194–201. [Google Scholar] [CrossRef]
- Zhou, Q.; Zou, Y.J.; Qiao, G.M.; Bai, X.; Mei, S.Y. Spatial Differentiation and Spatial Autocorrelation of Tourism Development Efficiency in Yangtze River Delta Region: Explanation Based on Panel Data. J. Ningbo Univ. 2020, 33, 100–106. [Google Scholar]
- Wegener, M.; Amin, G.R. Minimizing greenhouse gas emissions using inverse DEA with an application in oil and gas. Expert Syst. Appl. 2019, 122, 369–375. [Google Scholar] [CrossRef]
- Wei, X. Analysis and prediction of energy consumption and carbon emissions in Shanxi Province. In Proceedings of the 2021 Annual Conference of Science and Technology of the Chinese Academy of Environmental Sciences (I), Tianjin, China, 19 October 2021. [Google Scholar]
- Wang, L.; Wu, L.; Chen, Y.; Ma, X.; Du, M. Peak time and peak level of carbon in relevant provinces of the Yellow River Basin under steady economic growth. Resour. Sci. 2021, 43, 2331–2341. [Google Scholar]
- Ma, Y.Y.; Lu, Y.W.; Sun, Y.T. Technological Progress, Structural Adjustment and Carbon Emission Intensity-An Empirical Study Based on China’s Provincial Spatial Panel Data Model. RD Manag. 2016, 28, 23–33. [Google Scholar]
- Lu, X.; Xu, C.X. Study on water resources utilization efficiency of the Yangtze River Economic Belt based on three-stage DEA and Malmquist index decomposition. Resour. Environ. Yangtze Basin 2017, 26, 7–14. [Google Scholar]


Publisher’s Note: MDPI stays neutral with regard to jurisdictional claims in published maps and institutional affiliations. |
© 2022 by the authors. Licensee MDPI, Basel, Switzerland. This article is an open access article distributed under the terms and conditions of the Creative Commons Attribution (CC BY) license (https://creativecommons.org/licenses/by/4.0/).