1. Introduction
The purpose of this analysis is to solve the problem of simultaneous occurrence of rotor overload due to excitation current and rotor overload due [
1] to the inverse component of the stator current [
2,
3]. We considered world-leading producers of electrical protection and the results were the same [
4,
5,
6]. They are using the same or similar principle for the protected object.
The concept of classical electromechanical electrical protections is mainly copied to the digital concept. The development of digital protection with a high possibility of integration and interoperability between protection devices is not proportional to the development of new physical models [
7].
To prove our thesis, we decided to use the article [
8] where the thermal processes in generators are well described. It is the result of many people working on it for a long time.
The main reason for including this analysis was the results of the measured “hot spot” points on the generator, which are important for generator protection and parameterization of electrical protections. An air-cooled 350 MVA turbogenerator with self- excitation was used for the test, and simulations confirmed the measurements of temperatures and airflow.
The presentation of these results is followed by the analysis of the simultaneous occurrence and mutual interaction of the rotor current with the inverse component of the stator current. The rotor is the part of the machine that is subjected to the highest mechanical stresses, and due to the rotation, it is more difficult to obtain data on the state of electrical parameters and, accordingly, timely shutdown from an operation. The article encloses an excerpt of the thermodynamic analysis of rotor heating from the point of view of electrical protection and describes the thermodynamic interaction of stator and rotor windings.
The specific numeric relay considers the action of protection against negative sequence protection 46I2 which protects the winding and magnetic sheets of the rotor from heating compared to the relatively new protection 49R, which appeared in the latest versions, based on measuring the current of the excitation transformer and protecting rotor against overheating.
The protections are designed to operate independently of each other, and therefore the residual thermal capacity of the copper windings as a function of the sheet metal temperature is not known.
2. Material and Methods
2.1. Temperature Distribution in the Stator of NOVEL 350MVA Generator
An important request for generators is to have continuous and in-range temperatures of stator and rotor during service without big differences inside the construction. This fact influences the quality of thermal protection. Temperature is an important physical value in this part of engineering. It is responsible for the compression or expansion of all mechanical and electrical parts that can be affected by temperature changes. A generator can be affected by factors such as the following:
The results described in [
8] will show the effects of the stator during operation and, accordingly, give good input for creating a new rotor thermal model.
Air-cooled turbogenerators are suitable for combined dual-cycle gas–steam systems due to advantages such as effortless operation and convenient maintenance. The analysed air-cooled turbogenerator has an installed capacity of 350 MW (
Figure 1) and is the largest air-cooled turbogenerator in China and one of the largest air-cooled turbogenerators in the world. The performance of ventilation and cooling of such a large generator is a great challenge, and a description of this issue can rarely be found in the literature and reports.
The stator temperature field was calculated by the multiple reference frame method (MRF method), and the cooling conditions were determined by flow-field analysis. The highest temperature rise of the stator gaps was 76.1 °C, which is below the limit for the insulation level F. The focal point of the groove location was in the centre of the first chamber. The increase in temperature at the upper edges was higher than the increase at the lower edges of the core by 4–7 °C in the same section. The temperature rise of the insulation layer was lower than the average rise by 10 °C, and the highest value was 63.5 °C. The peak temperature was higher than the temperature in other areas of the final winding, but the temperatures generally did not exceed the limits for the degree of insulation F (
Figure 2).
2.2. Temperature Distribution in the Rotor of NOVEL 350MVA Generator
The rotor also requests uniform temperature distribution during service without differences inside the construction. This also influences the quality of rotor thermal protection. The hot spot of the rotor is a critical point for preventing the faults and the results described in [
8] gives a good input for creating a new rotor thermal model.
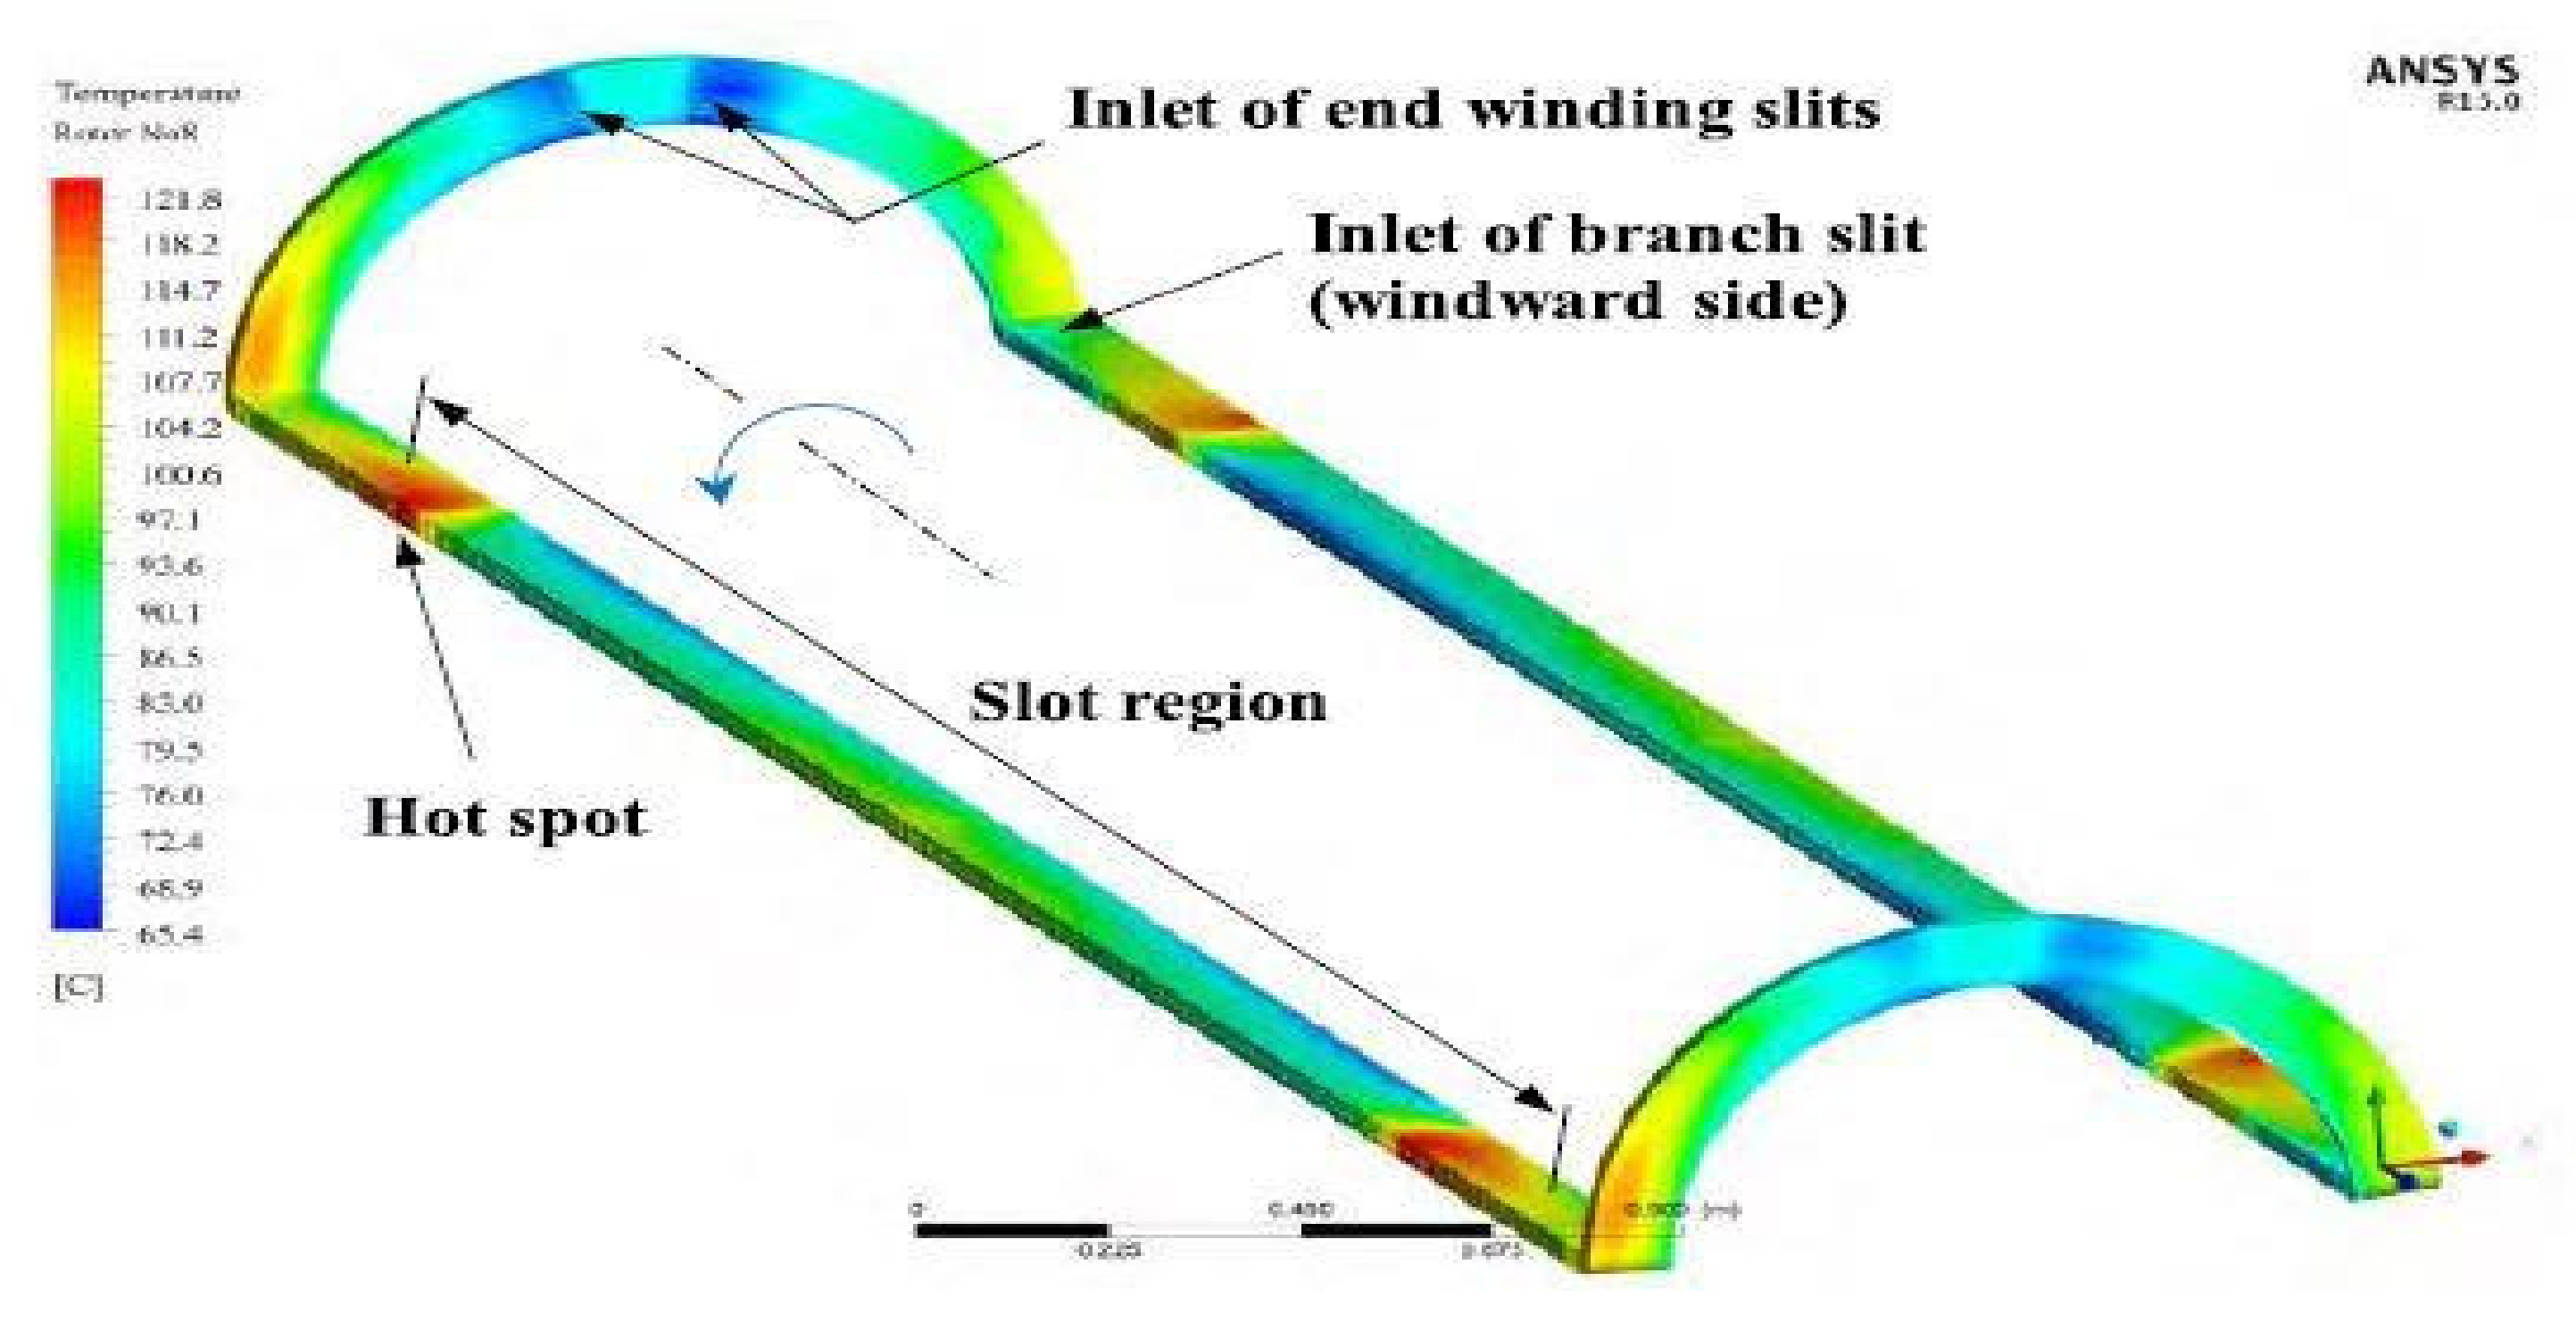
Rotor of a turbogenerator has two fans, with oppositely oriented blades, which drive air toward the centre of the rotor. The holes in the grooves that are part of the cooling system enable cold air enters the groove
Figure 3 shows the temperature of the rotor windings as a function of the distance from the end of the rotor. For nominal conditions, there is a maximum rotor surface temperature at the position of 20% of the rotor length from the beginning, at the height of the first chamber with the amount of 84 °C. This proves the discontinuity of the rotor temperature for even such a well-designed cooling system. By comparing the results from
Table 1, where the measured mean rotor temperature of 64.5 °C is highlighted, a deviation of 19.5 °C can be determined. These data can be used as a correction factor for parameterizing relay protection functions.
Figure 4 shows the red ed areas of the parts of the excitation winding that are on the limit of the allowed temperature or exceed it. These parts have a high risk of potential faults.
3. Results with Theoretical Background
3.1. Analysis of the Physical Effects Which Cool down the Rotor
Before the analyses, it should be pointed out that we have analysed the turbogenerator, not the silent pole generator. For the silent pole generator, the geometry of the system has a greater influence on the thermal distribution within the machine and is currently not the focus of our research.
If we consider the NOVEL 350MVA generator in the case of an overheated rotor, two ways for rotor heat loss can be noticed [
10].
The first way is contact between the surface of the rotor and the ventilation air. This air has a constant temperature (
Figure 2) after it passes through the stator gaps. This is described by the convection heat transfer formula for fluids and solid materials:
= heat transfer coefficient (Wm−2K−1);
—density of the convection heat transfer (W/m2);
—the rotor temperature;
—the ventilation air temperature.
The next way for the heat loss of the rotor is the blackbody radiation effect according to the Stefan–Boltzmann law. The surfaces of the rotor and the stator can be treated as blackbodies. Their surfaces are close to each other and are made of the same materials. In this case, the formula for the specific radiation is as shown in
Figure 5. Both surfaces emit energy:
1004, σ = 5.67 W/(m2K4), σ = Stefan–Boltzmann constant;
—density of the radiation heat transfer (W/m2);
—the rotor temperature;
—the stator temperature.
Each surface emits energy to the other, which results in the differences in radiation from the hot to the colder material (
Figure 5).
By summation of a convection expression (1) and a radiation expression (2) amount, we obtain an expression for cooling, which depends on rotor, stator and ventilation temperature:
Simplification of Formula (3) is possible by including the results of temperature measurement of stator chambers (
Figure 2). These results display small differences between ventilation air and the temperature of stator insulation layers. It is possible to equalize
=
and limit expression (3) on two variables
and
.
3.2. Comparison of a Cooling Model (3) with Actual Principles of the Thermal Electrical Protections
We can consider generator protection in numerical relays applied on two models of machine protection.
These are the expression for the 46I2 protection:
and the expression for the 49R protection (5):
Both of these two formulas have expression or top which is directly in corelation with accumulated thermal energy, Eth. This energy must be limited for time “top” in the protected object.
On the opposite side, the cooling process is determined with expression (3).
We can use (3) and write the following:
“Ece”—the cooling energy (J);
“A”—a surface of the rotor (m2);
“tcool”—the time of cooling (s).
Then, we can put these equations in the following relations:
These equations are important for the service of the machine and the temperature regulation. Then, Tvent, Trotor and Tstator in (3) are key variables for normal service of the generator considering 49R and 46I2 protection. Otherwise, numerical protection should trip.
3.3. Application Measurement Results of the NOVEL 350MVA Generator to Numerical Relays of Rotor Thermal Protection 49R
The numerical relay is used to protect the rotor winding from excessive temperature caused by excessive current. In general, if one of the generator components exceeds the designed temperature, it can be damaged. Damage to an individual generator component can result in serious consequences, depending on the duration of the impermissible temperature. Elevated temperature can cause undesirable expansion of the material. There are particularly sensitive rotor components such as guide rails and mechanical and protective rings.
The function in the numerical relay calculates the direct current in the rotor winding based on the measurement of the RMS value of the excitation transformer current (
Figure 6) [
4,
7].
Figure 6.
Single-pole scheme of excitation current measurement system the temperature of the rotor winding increases with current, so the inverse characteristic as in
Figure 7 is suitable for protection.
Figure 6.
Single-pole scheme of excitation current measurement system the temperature of the rotor winding increases with current, so the inverse characteristic as in
Figure 7 is suitable for protection.
The activation time of the thermal protection of the rotor is defined by the following expression:
in which
I represent the measured rotor’s current,
Ibase is the rated rotor current and
k1 is a constant factor.
The description of the variables and values in
Table 2 according to standard IEEE-C5013 is as follows:
top—operating time in seconds;
k1—a multiplier (it will have a value of 33.8 to obtain the operating points prescribed by the standard);
I—the current measured by the function;
I base—a base current (rotor winding rated current DC current is used as measured current).
The elaboration of expression (9) shows the remaining amount of thermal capacity of the excitation winding caused by the appearance of the inverse component I2 and the intensity of additional ventilation.
Expression (9) can be written as follows:
Multiplying both sides of the equation by the square of the rotor current
and the resistance of the rotor winding
R, we obtain the following expression:
The power loss of the rotor winding is as follows (
represents actual losses in the copper of the rotor winding):
If we add to the losses due to the rotor current, the contribution of heating due to the inverse component of the stator current and the contribution of additional ventilation, we can write the following:
where the expression
represents the contribution to rotor heating due to the inverse component of the stator current (
can be shown in the range from 0 to 1) and the expression
represents the contribution of rotor cooling due to ventilation (
can be shown in the range from 0 to 1). In this consideration, the fact is considered that part of the heat of the rotor iron is removed by ventilation and part is taken over by the rotor winding. From expression (13), we obtain the following:
This is a new mathematical model that calculates the tripping time of thermal rotor protection including the effect of the inverse current heating and additional ventilation as an option.
Existing variable description is as follows:
top—operating time in seconds;
k1—a multiplier (it shall have a value of 33.8 in order to obtain the operating points prescribed by the standard);
I—the current measured by the function;
I base—the base current.
New variable description is as follows:
R—ohmic resistance of the rotor;
Prot—actual rotor copper losses;
Pinv—rotor losses in the iron caused by inverse current I2;
Pvent—additional power of cooling;
a1—power factor transfer efficiency caused by inverse current;
b1—additional cooling transfer efficiency factor, Pvent.
The variable Pvent was used as an additional power to the existing cooling to cancel the heating power of the inverse stator component Pinv regarding expression a1·Pinv − b1·Pvent = 0. If this equation is 0, thermal protection of rotor circuit returns to basic, as in expression (9).
Expression (14) provides a mathematical model for regulated ventilation that measures the inverse component of the stator current I2 or Pinv. The aim of this regulation is to keep top independent of I2 or Pinv. Additional power Pvent can be achieved by a certain oversizing of the cooling system.
3.4. Change of Equivalent Rotor Current DIrot with Inverse Component I2
The previous consideration was dedicated to the calculation of the time top, i.e., the trip time that takes into account the contribution of the inverse component. The dependence of the amount of currents of the two variables, i.e., the rotor currents and the inverse component of the generator currents, is given below.
Let us equalize the times for the rotor current and the inverse component because these times are equal by definition of the rotor protection. Ibase is the rated current of the rotor.
The trip time for rotor current overload is given as follows [
4,
5,
6]:
The trip time for rotor overload from inverse component
I2 is given as follows [
4,
5,
6]:
The expression (17) is defined in standard IEEE C50.13.
Here, variable description is as follows:
I2—negative sequence current expressed per unit of the rated generator current;
t—operating time in seconds;
K—constant which depends on the size and design of the generator;
In—the nominal current.
These times are equal by definition; thus,
Let us consider the expression for rotor current
I = Ir + DIrot, where
Irot is the real rotor current and
DIrot is the contribution generated by the inverse component
I2. The aim is to express the influence of the inverse component
I2 through the increase in the equivalent current of the rotor
DIrot. By transformation, we obtain the following:
After normalization and equalization with
Ir = Ibase, we obtain the following:
Variable description is as follows:
k1—rotor thermal constant, depends on generator type;
K—inverse thermal constant, depends on generator type;
DIrot—an increase in rotor current;
Ibase—nominal rotor current;
In—nominal generator current;
I2—inverse current of the generator.
Expression (21) displays the dependence of the equivalent increase in DIrot on the inverse component for the rated current of the Ibase rotor. The graph shows the values for the generator listed at the beginning, i.e., k1 = 33.8 and K = 10.
Figure 8 shows the increase in rotor current for the given coefficients
k1 and
K with a change in the inverse component of the stator current. The parameters
k1 and
K in Equation (21) give a group of curves, each of which has its own sensitivity to the change of the variable
I2. The sensitivity to changes in current
I2 depends on the power and type of generator, i.e., the parameters
k1 and
K. Furthermore, a higher sensitivity to rotor heating can be observed with the increasing inverse current. Equation (21) can also be a control equation for determining the allowable maximum change in rotor current.
3.5. Vector Analysis of Magnetic Flux in the Generator
This analysis describes the physical process that causes heat inside the rotor during operation. It is important to analyze vectors that cause iron losses in the rotor. To obtain a physical model, a simplified representation of the flux in a three-phase generator is presented below. For turbogenerators, the flux vector
Θ1 is due to the direct current component
I1 and the flux
Θ2 is due to the inverse current component
I2 of the magnetic flux, while
w1 and
w2 are their angular velocities that are opposite in direction and equal amounts. In
Figure 9, the initial position of the vector is on the
A-axis, while the angles of the vectors are
Θ1 = 40° and
Θ2 = −40°, and the resulting flux
Θ’ = 19°. In the case of generators with salient poles, there is a phase shift of the flux
Θ’, i.e., induction
B (T), with the current causing them
I’. This model will not be analysed here.
According to
Figure 10 follows a diagram of the elliptical magnetic flux [
2] whose causes may be different. It occurs under the following conditions:
When current amplitudes are not the same amount per phase;
When the phase angle between the currents is not the same;
When the angle between the axis of the windings is not the same;
When the number of turns is not the same.
Such a system is asymmetric. Adding the vectors of direct and inverse flux will give a flux whose trajectory is an ellipse. The diagram in
Figure 10 was made for the ratio of current components
I2/I1 = 0.2.
The sum of the total flux for an asymmetric system gives the equation of an ellipse in a radial system (coordinates
Θ,
α) [
2]:
Variable description is as follows (
Figure 9):
Θ1—flux direct component;
Θ2—flux inverse component;
Θ’—flux resultant component;
α—angle of flux direct component Θ1.
Equation (22) refers to
Figure 10. The angle π/2, i.e., in degrees 90°, is the starting point of the analysis, i.e., the place where the ellipse is widest. Vectors
I1 and
I2 have the same circular speed but opposite directions, so the angle
α has a “-” argument. The diagram in
Figure 10 is made for the ratio of current components
I2/I1 = 0.2.
If
α = ω ∗ t is taken into the equation, the amplitude diagram in the time domain shown in
Figure 10 is obtained.
Let us look at the amplitude of the elliptical flux vector from
Figure 11 in real time.
Asymmetry produces oscillations in the amplitude of the magnetic flux in the generator, both in the stator and in the rotor. Oscillations of the amplitude cause an increase in hysteresis losses in the rotor.
Figure 12 shows the difference between the angles of the resultant flux vector
Θ’ and the same vector when
I2/I1 = 0, i.e., a system without asymmetry. The diagram in
Figure 12 is made for the ratio of current components
I2/I1 = 0.2. It can be seen that in the case of asymmetry, the flux oscillates with a frequency of 100 Hz and an amplitude of an angle of ±12° around the reference speed of rotation of the flux, i.e., around a rotor that rotates synchronously. Equation (23) is derived from Equation (22), showing the angle of
Θ’ during elliptical flux:
The angle of
Θ1 during elliptical flux is as follows:
The difference of the flux angles α’ − α
1 = Δα is shown in
Figure 12.
Oscillation of the flux angle causes eddy currents in the rotor iron, raises the overall temperature of the rotor and causes additional mechanical stress on bearing construction.
4. Discussion
The article offers the derivation of an equation for a new model of rotor thermal protection that includes influences of negative sequence protection 46I2 and, as an option, additional influence of ventilation Pvent.
The result is the new trip time of 49R protection:
Simplified and written in the fundamental form without added ventilation, i.e.,
Pvent = 0, the result is as follows:
In the beginning, we described physical processes regarding temperature distribution in the stator and the rotor of turbogenerator NOVEL 350MVA using measurement results of [
8]. After these considerations, we displayed magnetic relations in the generator during asymmetrical load. We used vector calculation to create the next new variables:
Pinv—losses in the rotor, caused by inverse current I2, depends on geometry and type of the rotor, should be calculated or measured;
Pvent—additional power of cooling, should be determined;
a1—power transfer efficiency caused by inverse current, should be calculated or measured;
b1—additional cooling transfer efficiency factor of Pvent, should be calculated or measured.
Variable a1 is the power transfer efficiency factor caused by existing ventilation. It means that all Pinv power is not absorbed by the rotor because some parts are absorbed by the stator and some parts are blown out by ventilation.
Variable b1 is the additional cooling transfer efficiency factor of Pvent. It means that all additional Pvent power is not used for cooling because some parts are lost inside the generator’s ventilation system and some parts pass through the ventilation system with a decreased amount of temperature.
The previous consideration will depend on the design and geometry of the rotor and stator.
Resistance of the rotor R should not be ignored and should be included in the calculation because the temperature deviations can be exceptionally large for copper windings during start-up after a long-lasting shutdown.
Amount
Pinv is the sum of two losses, hysteresis loss and eddy current losses, both caused by vector
Θ’. Changes of amplitude
Θ’ (
Figure 11) cause hysteresis loss in the rotor (
PH), and changes of angle
Θ’ (
Figure 12) cause eddy current losses in the rotor (
PFE).
This formula does not apply standard calculation of total losses when the flux is parallel with layers in the iron core.
Vector
Θ’ oscillates around vector
Θ1 with frequency 100 Hz with deviation angle (
Figure 12) and amplitude ± (
Θ’ −
Θ1) (
Figure 11).
It is assumed that
PH in rotor depends on frequency “
f”, induction “
B”, width of rotor’s plates “
d”, total length of rotor “
L”, actual excitation current “
I”, inverse component “
I2” and geometrical cross of rotor defined by a function of the section of radius and angle
f (r,a).
PFE is a function of the following:
To calculate function Pinv, it is necessary to know the type of the generator and all variables in (28). This work demands a greater effort to obtain the correct expression, and it could be the topic of the next paper.
Another solution is to obtain the experimental amount of Pinv with the “in time” measurement temperature of the rotor and compare it with the “in time” measurement of I2 for a specific generator.
5. Conclusions
The article presents the examples of measurements and the analysis of the operation of the NOVEL 350 MVA turbogenerator [
8] and the same measurements and conclusions used to comply with the new rotor thermal protection 49R on a specific numerical relay. The possibility of simultaneous exceeding of the allowed constant amounts of excitation currents and inverse components are considered, and it is presented that the described situation is not foreseen in the protection device. The consequence of the described case is an uncontrolled overheating of the machine drive parts, with missing input data and loss of control over the temperature model. Namely, the protection relay uses mathematical process models while the input variables are current and voltages of the generator. In addition, the parameters used to describe ventilation (
a1,
b1) should be known for each machine, calculated and experimentally determined. The development of a definitive expression for
Pinv is a job to be done in the next papers, and then the model can be used for the exact determination of
top.
Author Contributions
Con-ceptualization, D.B. and S.N.; methodology, D.B.; software, D.B.; validation, D.B. and S.N.; formal analysis, D.B.; investigation, D.B.; resources, D.B.; data curation, D.B.; writing original draft preparation, D.B.; writing, review and editing, S.N; visualization, D.B.; supervision, S.N.; project administration, D.B.; funding acquisition, D.B. All authors have read and agreed to the published version of the manuscript.
Funding
This research received no external funding.
Institutional Review Board Statement
Not applicable.
Informed Consent Statement
Not applicable.
Conflicts of Interest
The authors declare no conflict of interest.
References
- Gajić, Z.; Trišić, D.; Roxenborg, S. Rotor DC Current Measurement by Utilizing Current Transformers. In Proceedings of the 12th IET International Conference on Developments in Power System Protection, Copenhagen, Denmark, 31 March–3 April 2014; pp. 1–3. [Google Scholar]
- Wolf, R. Osnove Električnih Strojeva; Školska knjiga: Zagreb, Croatia, 1995; p. 118. [Google Scholar]
- Mandić, I.; Tomljenović, V.; Pužar, M. Sinkroni i Asinkroni Električni Strojevi; Tehničko Veleučilište u Zagrebu/Elektrotehnički Odjel: Zagreb, Croatia, 2012; pp. 2–171. [Google Scholar]
- Generator protection REG670. In Application Manual 1MRK502052; ABB AB Substation Automation Products: Vasteras, Sweden, 2016; pp. 463–475.
- Multifunctional Machine Protection 7UM85, V8.40, Manual C53000-G5040-C027-8, 11th ed.; SIEMENS: Nurnberg, Germany, 2020; pp. 1398–1409.
- General Electric. 869 Motor Protection System—Instruction Manual; General Electric: Boston, MA, USA, 2016; pp. 4/121–4/130. [Google Scholar]
- Nikolovski, S. Zaštita u Elektroenergetskom Sustavu; FERIT: Osijek, Croatia, 2007; pp. 72, 208, 210–211. [Google Scholar]
- Zhou, G.-H.; Han, L.; Fan, Z.-N.; Zhang, H.-B.; Dong, X.-C.; Wang, J.; Sun, Z.; Zhang, B.-D. Ventilation Cooling Design for a Novel 350-MW Air-Cooled Turbo Generator. IEEE Access 2018, 6, 62184–62191. [Google Scholar]
- Srb, N. Magnetski Monitoring Električnih Rotacijskih Strojeva; Graphis: Zagreb, Croatia, 2004; pp. 15–25. [Google Scholar]
- Simeon, V. Termodinamika; Školska knjiga: Zagreb, Croatia, 1980. [Google Scholar]
- C50.13-2014; IEEE Standard for Cylindrical Rotor Synchronous Generators Rated 10 MVA and Above. IEEE: New York, NY, USA, 2014.
| Publisher’s Note: MDPI stays neutral with regard to jurisdictional claims in published maps and institutional affiliations. |
© 2022 by the authors. Licensee MDPI, Basel, Switzerland. This article is an open access article distributed under the terms and conditions of the Creative Commons Attribution (CC BY) license (https://creativecommons.org/licenses/by/4.0/).


