Abstract
The use of renewable energies, such as Photovoltaic (PV) solar power, is necessary to meet the growing energy consumption. PV solar power generation has intrinsic characteristics related to the climatic variables that cause intermittence during the generation process, promoting instabilities and insecurity in the electrical system. One of the solutions for this problem uses methods for the Prediction of Solar Photovoltaic Power Generation (PSPPG). In this context, the aim of this study is to develop and compare the prediction accuracy of solar irradiance between Artificial Neural Network (ANN) and Long-Term Short Memory (LSTM) network models, from a comprehensive analysis that simultaneously considers two distinct sets of exogenous meteorological input variables and three short-term prediction horizons (1, 15 and 60 min), in a controlled experimental environment. The results indicate that there is a significant difference (p < 0.001) in the prediction accuracy between the ANN and LSTM models, with better overall prediction accuracy skill for the LSTM models (MAPE = 19.5%), except for the 60 min prediction horizon. Furthermore, the accuracy difference between the ANN and LSTM models decreased as the prediction horizon increased, and no significant influence was observed on the accuracy of the prediction with both sets of evaluated meteorological input variables.
1. Introduction
The energy sector segment has an important role for the maintenance of life and the economy. Specifically in Brazil, renewable sources account for 82.7% of the energy matrix, with hydroelectric generation alone being responsible for 60.9% of this total [1]. However, in order to supply the growth of energy consumption that has been occurring in the country, and to decrease the use of non-renewable energy, investments in the photovoltaic sector have broken records and, according to the Brazilian Photovoltaic Solar Energy Association (ABSOLAR), Brazil was predicted to reach the historic mark of 10 Gigawatts (GW) of operational power from the photovoltaic solar source in 2021 [2]. Globally, the solar photovoltaic generation represented 60% of all renewable energy added in 2021 [3].
Photovoltaic (PV) solar energy depends primarily on solar irradiance, i.e., the incidence of solar rays on photovoltaic cell panels. However, this energy production process is subject to oscillations of variables that are not controllable, such as the climatic conditions of the location, winds, clouds, temperatures, intensity and duration of solar irradiance, among others. These oscillations in energy generation promote intermittencies in the power generated by photovoltaic systems [4], and this can result in power flow inversion with variations in voltage and frequency in the transmission system [5].
Considering the problems caused by intermittencies arising from the solar photovoltaic generation energy process, the research topic of Prediction of Solar Photovoltaic Power Generation (PSPPG) has been widely studied in the scientific literature in the last decade [6,7,8,9,10,11], with few studies observed in Brazil and Latin American countries, possibly due to the very recent investment in this type of energy matrix [12]. The proposition of methods and devices for PSPPG enables the development of solutions to mitigate the variation in solar energy production within acceptable limits, as well as to compensate for power variability during the PV generation process, and to anticipate energy production and market demand [6]. One of the solutions to solve the generation intermittency problem is the use of intelligent systems and/or battery energy storage to operate a reserve [13,14,15]. However, this approach requires forecast information about future power generation, which is used as input to enable safe and efficient generation within acceptable limits in electric and photovoltaic systems. This makes the study of PSPPG methods relevant, mainly due to the increase in photovoltaic solar energy generation in the global energy matrix.
Among the several classes of methods applied to PSPPG [11], Artificial Intelligence (AI) has shown the best results, being widely studied nowadays through Machine Learning (ML) algorithms [16,17] and, more recently, Deep Learning (DL) algorithms [18,19]. The literature review described in [11] analyzed the prediction accuracy of 1705 scientific studies about PSPPG methods. This study has significant and important contributions regarding a model’s accuracy, prediction horizons and classes of prediction methods. However, it is found that these comparative accuracy studies are usually conducted with different datasets and experimental setups, such as different input variables, origin of data, prediction horizons and model structure and configurations. These comparative analyses regarding input variables, models, horizons and prediction accuracy are relevant in PSPPG to evaluate the use of applications of photovoltaic energy generation in solar plants and photovoltaic modules, considering their characteristics, such as the availability, or not, of locally captured exogenous meteorological variables (e.g., temperature, humidity, etc.).
In this context, considering that ML and DL models are the ones that show high prediction accuracy in PSPPG [11,12], the main objective of this study is to evaluate and compare the accuracy of two prediction models of the artificial intelligence applied in PSPPG: the Machine Learning (ML) model most applied in PSPPG through Artificial Neural Networks (ANNs) [20] and Deep Learning (DL) models with Long-Short Term Memory (LSTM) networks [21], which are a type of Recurrent Neural Network (RNN) [22]. To analyze which of these prediction models is most suitable for the short-term PSPPG, this study aims to present, simultaneously, a statistical analysis of the influence of different meteorological variables and prediction horizons in the accuracy of these models. This also compounds the originality of this study and allows the design and development of PSPPG devices based on ANNs and LSTMs with the use of different types and quantities of input meteorological variables.
In the proposed evaluation, a single database (dataset), two distinct sets of input variables and three short-term prediction horizons were adopted, allowing prediction accuracy comparisons from a homogeneous and controlled experimental environment. Thus, the following specific objectives were defined for this study: (1) to compare the overall prediction accuracy of the ANN and LSTM models with similar configuration structure in a homogeneous and controlled experimental environment; (2) to evaluate the accuracy among ANN and LSTM models in three short-term prediction horizons (1, 15 and 30 min) and (3) to investigate the influence of using distinct exogenous input variables in the prediction performance of ANN and LSTM models. In order to facilitate the comparison of the ANN and LSTM models developed in this study with the literature, the accuracy of a baseline model [23] applied in time series prediction, including in PPSPG [24], is presented as a reference model.
It is highlighted that the motivation for this study originated from previous studies [25,26,27] and by the fact that, to date, no research has been identified in the scientific literature comparing ANN and LSTM models in the PSPPG context, specifically considering the following simultaneous characteristics of controlled experimental configuration, a single dataset with exogenous meteorological input variables and three short-term prediction horizons. Although works have compared these models in other application areas, no study evaluating both models with the exogenous meteorological and solar irradiance data used in this study was observed in the literature.
Therefore, in this sense additional information about the relevance, originality and motivation of this study is described in the next section, including the essential concepts about PSPPG and the main scientific papers related to this study. Section 2 describes the experimental evaluation method and the ANN and LSTM models adopted in this study. Section 3 shows the results, analysis and comparative statistics and, finally, Section 4 presents the conclusions, the contributions to the PSPPG literature and future work.
1.1. Background and Related Works
The methods for PSPPG can be classified into two modes: indirect prediction, which indirectly uses the solar irradiance to predict the photovoltaic generated power, and direct prediction, which tries to directly predict the future power generation of the photovoltaic system or plant [6]. The indirect PSPPG method is widely used because it uses solar irradiance, which is often available and captured by pyranometers, and is also being applied in several other study areas. In addition, solar irradiance has high correlation values with the PV power generated (correlation coefficient (R2) > 0.98) [9].
Another classification of prediction methods is related to the source of the input data. While prediction methods with endogenous data use current or historical Time Series (TS), methods with exogenous data originate from local or remote measurements, which include total sky images, temperature, solar irradiation, humidity, cloud and wind data and others [6]. Finally, the last important concept in PSPPG consists in the existence of several prediction horizons that vary between seconds, minutes, hours, days, etc. The selection of the horizon depends on its application, ranging from real-time intermittency monitoring for use of power smoothing systems, to planning and operation of power generation and consumption demand [6,28]. It is important to emphasize that there is no literature consensus on the exact delimitation or classification of the prediction horizons in PSPPG [6,9]. Therefore, in this study’s context a short-term prediction horizon with the prediction intervals of 1, 15 and 60 min was adopted.
A variety of prediction method classes have been studied in PSPPG over the last decade [12,29], with an increase in accuracy rates over time [11]. Examples of these classes are persistence, statistical, cloud motion and tracking, numeric weather prediction, Machine Learning (ML), Deep Learning (DL) and hybrid models [9,11,19,30]. Besides these classes, new approaches based on meta-heuristics [31] have been proposed for the prediction of (indirect) solar irradiance in PSPPG. The PSPPG review in [11] evaluated the prediction accuracy of 1705 studies organized into these classes of methods and identified that machine learning-based models [16,17,32] showed the best prediction accuracies.
Historically, the most used ML method in PSPPG is Artificial Neural Networks (ANNs) [11,12,17], mainly for providing a self-adaptive and generalized approach for non-linear data, being widely used in time series prediction [11,33]. In [34], it is shown that ANN and MLP cannot solve the problem of unstable PV power in cloudy conditions, and LSTM outperformed other evaluated methods. However, only the prediction horizon of 1 h ahead was considered in the study.
The goods results of ML methods [11] may have motivated the increasing application of DL methods in PSPPG [18,19,30,35], which constitute the state of the art of artificial intelligence [36] and are facilitated by technological advances in computational power, such as the use of Graphics Processing Units (GPUs). Deep learning as an advancement of ANNs, making the structure more complex and deep, enhanced the ability to solve complicated problems [37]. Deep learning is a term that is currently quite common in the literature, but it is not new [36].
Since 2017, a growth has been observed in publications with Deep Learning (DL) models in PSPPG [18,19,30], with emphasis on the application of Long Short-Term Memory (LSTM) networks [22,38,39], Convolutional Neural Networks (CNNs) [40,41,42] and combinations of these models [43,44,45,46,47]. A review reported in [18] demonstrates that deep learning-based models are currently suitable for indirect (solar irradiance) and direct (photovoltaic power generated) predictions. They also reported that the meteorological variables (exogenous) most used with DL methods are temperature, humidity, wind speed and direction. However, there are fewer studies applying exogenous input variables as compared to endogenous ones [19]. More recently, it was reported that the DL models employed most frequently in PSPPG are LSTM, RNN and Deep Neural Networks (DNNs) [30,35].
The PSPPG scientific reviews, in general, analyze a set of selected papers by a selection criterion, mainly regarding the prediction accuracy of the proposed methods [10,11,17,19], among other features. For this reason, the accuracy of these methods is, sometimes, compared regardless of the type and amount of input data, with different datasets, experimental execution environments or prediction horizons.
Considering that ANNs have historically been the most used in short-term PSPPG and currently LSTMs are being widely applied for their ability to capture patterns in the data with their long-term temporal memory, we have not observed comparative studies of these two methods including: (i) several types of exogenous meteorological input data (from a database); (ii) similar structures of ANN and LSTM models; (iii) three equal short-term prediction horizons and (iv) a homogeneous and controlled experimental evaluation method. Thus, the results of this study promote contributions to PSPPG by providing details on the prediction accuracy profile of ANN and LSTM models regarding the simultaneous use of different endogenous weather input variables and the use of both models for the three different short-term horizons.
Regarding the literature studies that jointly compare ANN and RNN or LSTM models, Table 1 summarizes main features of these works in the PSPPG context, including the specific features that distinguish this study from others. It must be noted which literature shown in Table 1 was selected according to the criterion of presenting comparisons of accuracy between ANN and LSTM or RNN models, considering the short-term PSPPG context. In [48,49], it was found that LSTM networks have the ability to capture the temporal changes of the generated power or solar irradiance due to the existence of its long-term temporal memory, and thus improve the accuracy predictions. However, these studies considered only the 1 h prediction horizon and no meteorological data were used [48]. The interesting study in [34] evaluated the accuracy of ANN, LSTM and other prediction models in complex weather conditions, especially on cloudy and mixed days, the determination coefficient (R2) obtained is about 0.85 and LSTM is still very effective in improving RNN and is more accurate than other models [34]. However, the study analyzed the models’ accuracy at the prediction horizon of 1 h ahead, and the current study presents an additional analysis with the prediction horizons of 1 and 15 min.
In the study in [50], the results showed better prediction accuracy for the RNNs (nMBE = 47% and RMSE = 26%) when compared to ANN MLP-type. Nevertheless, although it considered three distinct prediction horizons, it did not analyze the accuracy of the LSTM model. Therefore, the present study fills this gap with a comprehensive analysis of the prediction of both models at short-term horizons. It is worth noting here that RNNs are a generalization of LSTMs, and do not have the LSTM ability to handle problems where there are long-term data dependencies well [21].

Table 1.
Literature studies with simultaneous comparison between ANN and RNN or LSTM models.
Table 1.
Literature studies with simultaneous comparison between ANN and RNN or LSTM models.
| Horizon | Forecasting Methods | Data Time Step | Error Metric | Input Variables | Output Variable | Dataset | Pub. Year | Ref. | |
|---|---|---|---|---|---|---|---|---|---|
| 1 h | MLR, BRT, ANN, LSTM | 1 h | RMSE | PV power | PV power | Two sites’ databases with one year’s data: 70% for training and 30% for test | 2017 | [48] | |
| 1 h, 1 day | ANN, ELM, LSTM, | 1 h | MAPE, RMSE, MAE | Irradiance, temperature, humidity, wind speed, PV power generated, day of year | PV power | One year’s data: 6 November 2016 to 28 October 2017. Ten-fold cross validation | 2018 | [49] | |
| 1 h, 1 day | ANN, ARIMA, BPNN, SVR, RNN, LSTM | 1 h | R2, RMSE, MAE | GHI, clear-sky GHI, cloud type, dew point, temperature, precipitable water, relative humidity, solarzenith angle, wind speed, wind direction | GHI | Three databases from different locations, five years’ data: 4 for training and 1 for test | 2019 | [34] | |
| 10 min, 30 min, 1 h | MLP, RNN | 10 min. 30 min. 1 h | R2, RMSE, cvRMSE, nMBE | Hour, dry bulb air temperature | GHI | One week’s data: 22 May to 29 May 2016 | 2020 | [50] | |
| 1 h | ANN, WPD-LSTM, LSTM, GRU, RNN | 5 min | MBE, MAPE, RMSE | PV power, GHI, DHI, temperature, wind speed, relative humidity | PV power | One dataset with two years’ data: 1 June 2014 to 31 May 2015 used for training and 1 June 2015 to 12 June 2016 for test | 2020 | [51] | |
| 1 h | ANN RNN, RF, SVM, LSTM, LSTM-MLP | 1 h | RMSE, nRMSE, MAE, MBE, r | Wind speed, atmospheric pressure, precipitation, relative air humidity, air temperature | GHI | One dataset with four years’ data: three years for training and one year for test | 2020 | [52] | |
| 10 min to 4 h | Persistence, MLP, LSTM, LS-SVR, GPR | 10 min. | nRMSE, DMAE, CWC | GHI | GHI | Two years’ data: one year’s data for training and one year’s data for test | 2021 | [53] | |
| 10 min | Persistence, MLP, LSTM CNN, SCNN-LSTM | 10 min. | r, fs, nRMSE, nMBE, nMAE | DNI, solar zenith angle, relative humidity, air mass | DNI | Two years’ data: ten months for training, two for validation and 12 months for test | 2021 | [54] | |
| 1 min, 15 min, 1 h | Persistence, ANN, LSTM | 1 min 15 min 1 h | RMSE nRMSE, MAPE, R² | (Complete Set) Air temperature, relative humidity, atmospheric pressure, wind speed, wind direction, maximum wind speed, precipitation (rain), month, hour, minute | (Reduced Set) Air temperature wind speed, wind direction month, hour, minute | GHI | Three years’ data: two years for training and one year’s data for test | 2022 | This work |
The complete abbreviation definitions are provided at the end of this study.
Another two studies described in [51,52] proposed hybrid models and evaluated accuracy of photovoltaic potential prediction with other methods, including ANN and LSTM. However, these studies considered only a single 1 h prediction horizon, and both irradiances (GHI and DNI) were also used as input to the prediction method presented in [51]. More recently, several ML methods were evaluated and it was found that Multi-Layer Perceptron (MLP)-type ANNs demonstrate lower accuracy than LSTMs [53]. However, they considered only the use of the endogenous variable Global Horizontal Irradiance (GHI), and no exogenous meteorological variables were employed in the evaluated models.
Another recent study proposed and evaluated the hybrid SCNN-LSTM method for the prediction horizon 10 min ahead [54]. Although it is not the focus of the present investigation to use total sky images, the authors compared the accuracy of the proposed method with several other methods that include ANN and LSTM. It is relevant to note that in the study described in [54], although a single horizon (10 min) is considered, the prediction accuracies of ANN and LSTM models exhibit quite similar values, and it is not possible to state which model is more suitable for the prediction horizon analyzed. As an example, nRMSE = 29.92% for ANN and nRMSE = 29.69% for LSTM were obtained on cloudy days [54]. This study, besides considering a single prediction horizon, uses the Direct Normal Irradiance (DNI) as a target, which is less common information in PSPPG.
Finally, a recent and interesting study complementary to short-term forecasting evaluated, with several ML and DP algorithms, the influence of exogenous meteorological variables on solar irradiance [55]. The results showed that temperature and cloud amount are determinant impact factors affecting solar irradiance. Finally, considering the characteristics of studies comparing the accuracy between ANN and LSTM models for short-term prediction, detailed in Table 1, there is a lack of a complete study that uses different exogenous meteorological input variables, some of them being determinants of solar irradiance [55], and also including different short-term prediction horizons that influence the model’s accuracy [25,56].
Therefore, in this context, it is important to have a comparative study based on statistical analysis to compare ANN and LSTM models under controlled experimental conditions, with different prediction horizons and evaluating the influence of distinct meteorological input variables. Two sets of meteorological and exogenous variables and three prediction horizons were adopted (1, 15 and 60 min), making it possible to measure the performance and suitability of ANN and LSTM models in the PSPPG context for short-term predictions. Thus, this study’s contributions and originality are due to, according to Table 1, the absence of previous works directly comparing similar structures of ANN and LSTM models with the same exogenous meteorological data and three short-term prediction horizons from a controlled experimental environment. Therefore, the next section presents the theoretical concepts, materials and experimental method of this study.
2. Materials and Method
This study’s experiments were conducted in a controlled experimental environment to provide an adequate comparative analysis of the ANN and LSTM models’ prediction accuracy. Using a single training and testing dataset, the method was designed to evaluate the predictions of these models at three different short-term horizons (1, 15 and 60 min), two sets of input variables and two different models (ANN and LSTM). The next sections detail the dataset, the input variables, the architecture of the ANN and LSTM models and the experimental protocol of this study. Finally, the tools and technologies used in the development of this study are described.
2.1. Dataset Description
The database (or dataset) is an important component for building and evaluating machine learning models [20]. This study employed the dataset described in [57], composed of endogenous and exogenous data regarding meteorological information, solar irradiation and local sky images. This information corresponds to the full three-year period (2014–2016) and is standardized and quality-controlled, with samples collected and available at the 1 min time scale. Table 2 presents the variables employed in the ANN and LSTM models evaluated in this study, as well as the number of samples used in each prediction horizon analyzed.
Table 2.
Folsom dataset variables and details used in this study.
The data and information presented in Table 2 were captured in Folsom City, California, United States of America, and are available in [57].
2.2. Evaluated Models
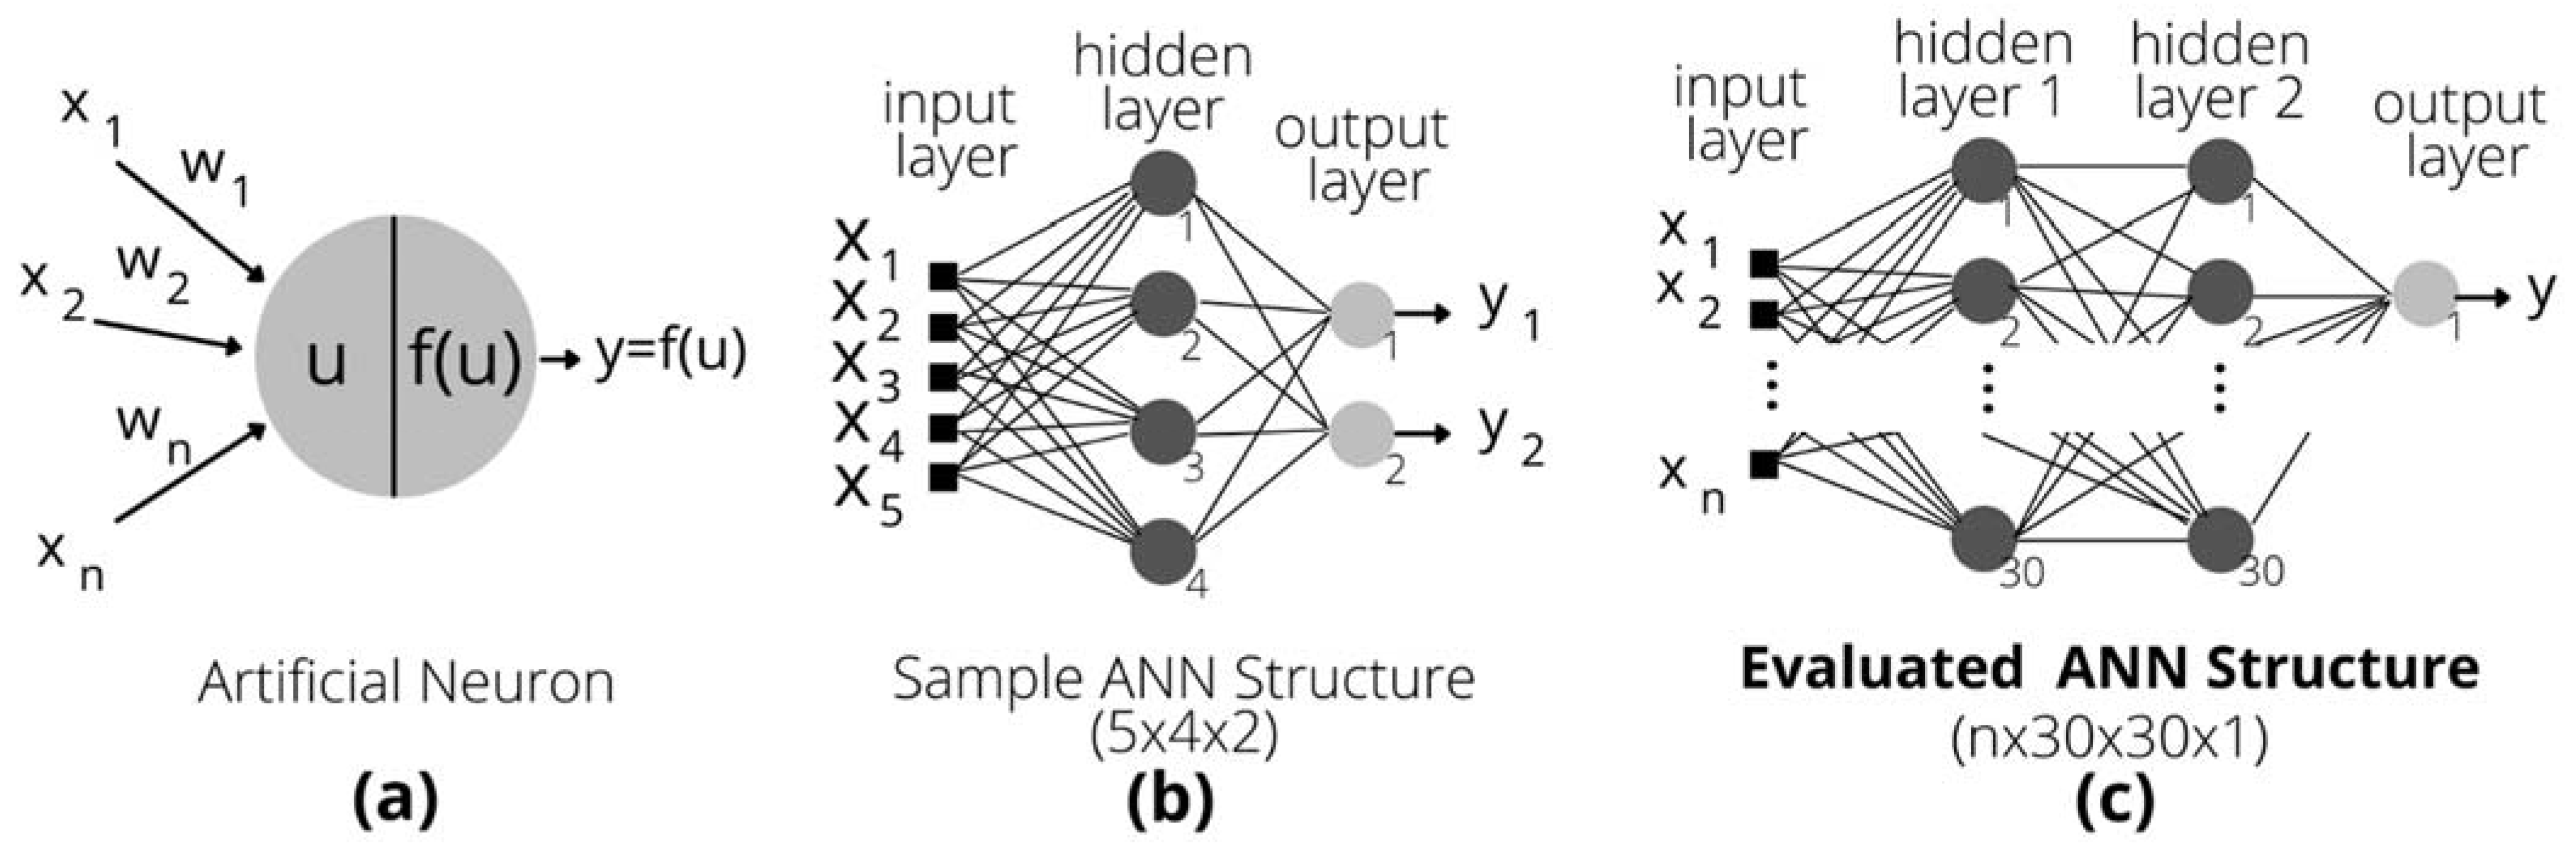
In this section, we describe the main concepts about ANN and LSTM models and the structures of these networks which were adopted and evaluated in this study. In order to understand the Machine Learning (ML) process with an ANN, it is necessary to understand how it works. An ANN works similarly to the neurons of the human brain, capable of solving approximation, classification, standardization, optimization and prediction problems [58]. Figure 1 schematically presents (a) an artificial neuron, where x1, x2, …, xn correspond to the inputs. For each input xi there is a weight wi in input of neuron. The sum of the inputs xi balanced by the weight wi, resulting in the linear output u, where u = ∑i wixi. The activation output y of the neuron is obtained by applying a function f to the linear output u, denoted by y = f(u). The f function is known as the activation function and can assume several non-linear forms [58].
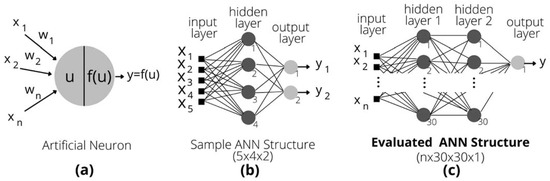
Figure 1.
ANN model: (a) an artificial neuron, (b) example of ANN structure and (c) the ANN structure applied in this study.
Figure 1b depicts the example of an ANN composed of 5 inputs and a single hidden layer with 4 neurons and two outputs (y1 and y2). However, considering the results of the research previously published in [22,23] where the accuracies of ANN models in PSPPG were evaluated, this study employed the ANN model whose structure is depicted in Figure 1c. Therefore, the ANN model used in this study is composed of n inputs, two hidden layers with 30 neurons each and a single output neuron y, corresponding to the GHI variable. It is important to highlight that n can assume, in this study, two values (6 or 10) corresponding to the quantity of input variables, as shown in Table 2. In this study, Multi-Layer Perceptron (MLP)-type ANNs with the activation function ReLU and the backpropagation training algorithm [20] were employed, as shown in Figure 1c.
It should be pointed out that the prediction accuracy of ANN models can still be studied and can be increased with the use of hybrid and optimized methods, such as using the hybrid Adaptive Network-Based Fuzzy Inference System (ANFIS), or a hybrid Multi-Layer Perceptron with Grey Wolf Optimizer (MLP-GWO) [59]. However, this study focuses on simple MLP-type ANN models.
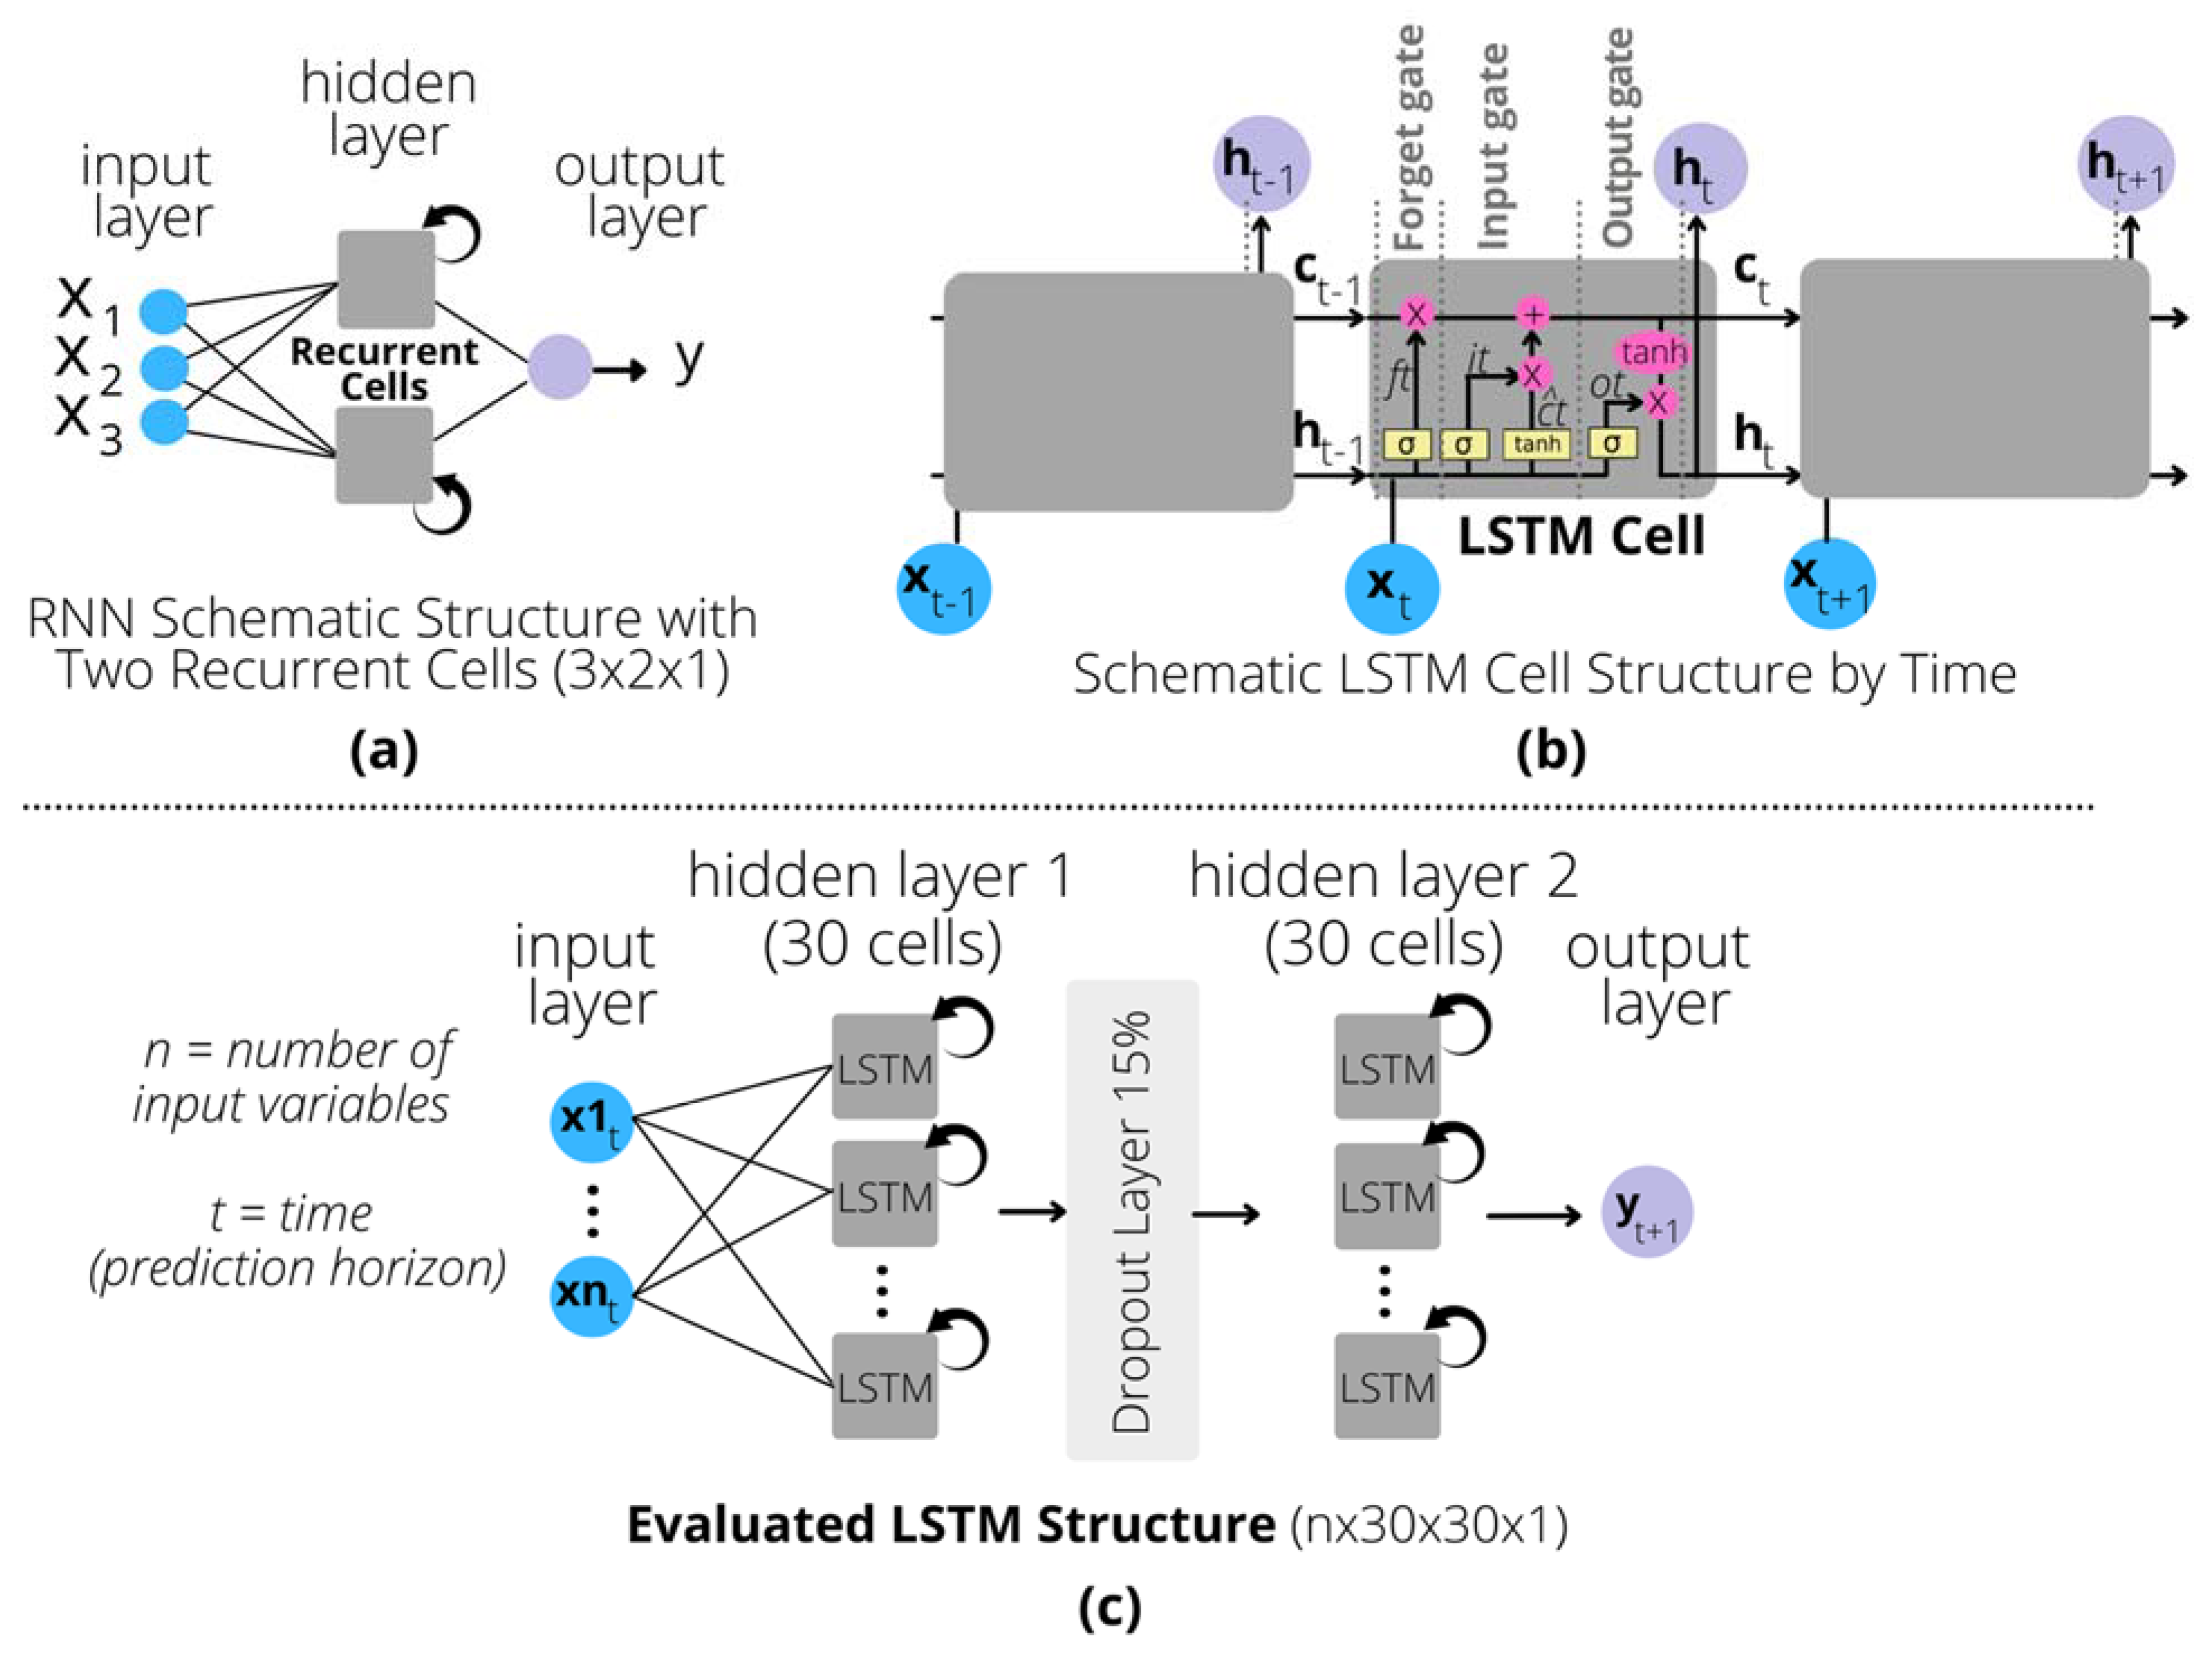
Alternatively, the increase in computational power has enabled the use of deep learning algorithms and Recurrent Neural Networks (RNNs) in many areas, including PSPPG [22]. RNNs are a class of ANNs known to have “memory”, i.e., a cyclic feedback connection in which the output returns to the previous layer, as depicted in Figure 2a. ANNs specialize in sequential data such as text, video and time series due to their internal memory, being able to “remember” relevant dynamic patterns about the input data, except when the gap between these patterns is very large [60]. For this reason, the concept of the Long Short-Term Memory (LSTM)-type RNN was introduced in 1997 [21], and it is widely used for presenting interesting results due to its good ability to deal with the problem of long-term data dependency [60], which increases the prediction accuracy [61].

Figure 2.
LSTM model: (a) an RNN with two recurrent cells, (b) an LSTM cell structure with forget gate and (c) the LSTM structure adopted in this study (for clarity, the temporal recurrent and enrolled structure is not shown).
A number of architectural variations of LSTM cells and networks have been proposed and applied in the literature [60]. The internal schematic diagram of an LSTM cell used in this study is shown in Figure 2b. Considering that W represents a weight and t is the current time, we have:
In the equations presented in (1), is current input, represents the scaling of information, is the added information, is the sigmoid function, is the hyperbolic tangent function, is the output of the last LSTM cell, is the new updated memory, is the current output and are the forget, input and output gates, respectively. Additional details of these equations (1) can be found in [60].
The main idea focuses on the state of the memory cell flowing through time t¸ with data being received from the previous cell and passed on to the next cell. The first step of processing occurs with the function which is the output of the previous time and which is the current value. These two pieces of information are submitted to a sigmoid function at the forget gate () to decide what will be discarded. When the value is 1, the information is kept, and discarded when it is 0. The next step is to decide what will be stored, using the hyperbolic tangent function (), to then add or delete the input gate () and forget gate () values of the cell. In the output gate (), the data are received through the sigmoid function and it is decided what is important through the hyperbolic tangent function, returning the value in the output [60,62].
Finally, Figure 2c presents the architectural diagram of the LSTM network evaluated in this study. For clarity, details of the recursion structure/temporal memory of the LSTM cells have been omitted. The LSTM model has an input layer with variables, where can assume the value 6 (Reduced Input Set) or 10 (Complete Input Set), as described in Table 1 and Table 3. Then, there are two hidden layers with 30 LSTM cells each, which are interconnected by a dropout layer (15%) that randomly disables connections and prevents overfitting to the data during the training process [63]. At the end, we have the predicted output layer of the model with a neuron corresponding to the GHI for prediction horizon t + 1. To facilitate the reproducibility of this study, the main hyperparameter values used in the ANN and LSTM models are presented in Table 4. Dataset split used in three-fold (3-fold) cross-validation for each ANN and LSTM model is presented in Table 5.
Table 3.
Experimental configuration of the ANN models, variables and predictions horizons.
Table 4.
Configuration parameters of the ANN and LSTM models of this study.
Table 5.
Dataset split used in three-fold (3-fold) cross-validation for each ANN and LSTM model.
Table 4 exhibits the values for the activation function, dropout, epoch number, learn rate, layer numbers, neurons and LSTM cells used in this study. It is important to note that the structure and parameter values used in the ANN model were defined based on previous studies [25,26]. With the intention of performing the comparative analysis between ANN and LSTM models, the settings of the number of hidden layers, cells and parameters of LSTM models were defined similarly to the previously mentioned ANN models.
2.3. Experimental Configuration and Execution
The experimental setup of this study was designed to evaluate the prediction accuracy between the ANN (Figure 1c) and LSTM (Figure 2c) models, which are supervised learning algorithms and require prior iterative training to obtain the optimal weights and biases [20,21]. The overview of the experimental method, components, flow and execution steps is presented in Figure 3.
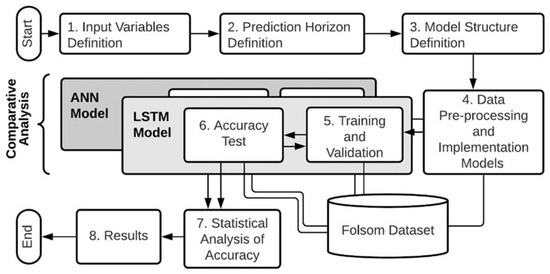
Figure 3.
Experimental method execution: components, flow and steps.
Initially, the input variables (1), the temporal resolution horizons of the predictions (2) and the ANN and LSTM model configurations (3) are selected. Then, the database pre-processing [26] and the implementation of the models are performed (4). After that, in step (5) the models are trained and validated using three-fold (3-fold) cross validation (Table 5), where twenty-three months are used for training and one month for validation, avoiding model overfitting. If the error value does not decrease in five epochs, the training is terminated. In step (6), the model is tested with one year’s complete data considering the 3-fold cross-validation in Table 5. Then, the prediction accuracy of the synthetic models relative to the original data is calculated and analyzed (7). Finally, the results are presented and discussed in step (8).
The experimental evaluation flow (Figure 3) was run two times for each ANN (Figure 1c) and LSTM (Figure 2c) model considering the two input variables sets (Table 3). All configurations regarding the set of input variables, output variable and prediction horizons are displayed in Table 3 for each evaluated model. It is important to note that the input variable sets are distinct: the first set is broader and used all seven available meteorological variables (Complete Input Set), while the second set (Reduced Input Set) is less extensive and contains only the three common meteorological variables. In this study, three short-term prediction horizons (1, 15 and 60 min) were evaluated and the output variable Global Horizon Irradiance (GHI) was considered.
According to Figure 3 and Table 2, a total of 6 ANN models and 6 LSTM models, with similar structure and configurations, were defined, developed and analyzed. The prediction accuracy of these models can be evaluated with different statistical measures in the PSPPG [64]. This study provides and applied the following statistical measures to compare the developed models: coefficient of determination (R2), Mean Absolute Percentage Error (MAPE) and Root Mean Square Error (RMSE), detailed in Equations (2)–(4), respectively.
In these error metrics, N represents the number of data points in the distribution, refers to the mean of the observed distribution, refers to the predicted point and represents the observed point [64]. Comparisons of accuracy of models with different sample sizes can be performed by normalizing the RMSE metric with reference to the mean of the observed data, where n [11].
2.4. Materials, Tools and Technologies
Nowadays, several computational tools implement machine and deep learning models. In this work, we used the Python programming language [65], scikit-learn package [66] and Keras [67], an open-source library which provides programming packages for ANNs and LSTM which facilitate the manipulation of training, testing and analysis of the models. The development and execution of ANN models were conducted in the collaborative open-source programming environment Google Colab [68]. A virtual machine with the NVIDIA K80s graphics processing unit with 24 GB memory was employed. Finally, the analyses of descriptive statistics and hypothesis test of the results were performed with the help of JASP statistical software [69,70].
3. Experimental Results and Discussion
This study compared the prediction accuracy of ANN and LSTM models with the configurations, structures, horizons and data described in Figure 3 and Table 3. The adopted method provided control and homogeneity of the experimental environment, and thus the comparison of the prediction error distributions (accuracy) of the synthetic models. The average time for training and testing the models ranged from 20 min to 70 min, according to the prediction horizon.
The results of the evaluations make it possible to determine which ANN and LSTM models have significantly better prediction performance in the three different short-term horizons (1, 15 and 60 min). In addition, it is analyzed if there is a significant influence of the models’ performance regarding the different sets of exogenous meteorological input variables. In addition to this information, which is relevant for PSPPG, the absence of solar irradiance (GHI) in the model inputs can guide the construction of a prediction system without the need to capture information such as solar irradiance with pyranometers. Thus, the model accuracy results and the comparative analysis are presented and discussed in the next sections.
3.1. Forecasting Accuracy Results
This section presents the results from the performed experimental method defined in Figure 3. The results regarding the prediction accuracy and errors of all ANN, LSTM and baseline models are summarized in Table 6. The experimental method (Figure 3) was performed twice for the two input sets with different exogenous meteorological variables: the Complete Input Set has 10 inputs (seven exogenous) and the Reduced Input Set has six inputs (three exogenous). For each input set, the prediction accuracies of ANN and LSTM at the 1, 15 and 60 min horizons were evaluated.
Table 6.
Model accuracy metrics for all configurations of input set variables and horizon predictions.
The three statistical metrics (nRMSE, MAPE and R2) are considered to represent the prediction errors and facilitate the analysis of the distribution error characteristics, including allowing future comparisons with other studies. The R2 metric expresses the fit of the predicted model data to the original data, and the closer to 1, the smaller the error and the higher the accuracy of the predicted model. The normalized RMSE (or nRMSE) is the most widely used metric because it is sensitive to the variability of large individual errors. Finally, the MAPE metric quantifies the overall prediction error based on mean percentage error [64]. For each input set’s configuration and prediction horizon configuration, the Mean () and Standard Deviation () values of each error metric are presented in Table 6.
The statistical comparisons of the prediction accuracy between ANN and LSTM models (Table 6) were performed with hypothesis tests, which provide tools that allow us to reject or not reject a determined statistical hypothesis through the evidence provided by the sample [71]. In this study, using the statistical comparisons between the ANN and LSTM models, the three prediction horizons and two input variable sets, it was established that the Null Hypothesis (H0) refers to the statistical equality of the prediction accuracy between pairs of models. Alternatively, the existence of a significant difference in accuracy comparisons between pairs of models was established as an Alternative Hypothesis (H1). It should be mentioned that in this study, all statistical hypothesis tests were conducted considering a significance level of α = 0.05 (95%) [72].
3.2. Analysis and Discussion
This section presents the analysis and discussion of the results exhibited in Table 6. These analyses are described in the three next subsections according the specific objectives of this study (Section 1).
3.2.1. Prediction Model Accuracy
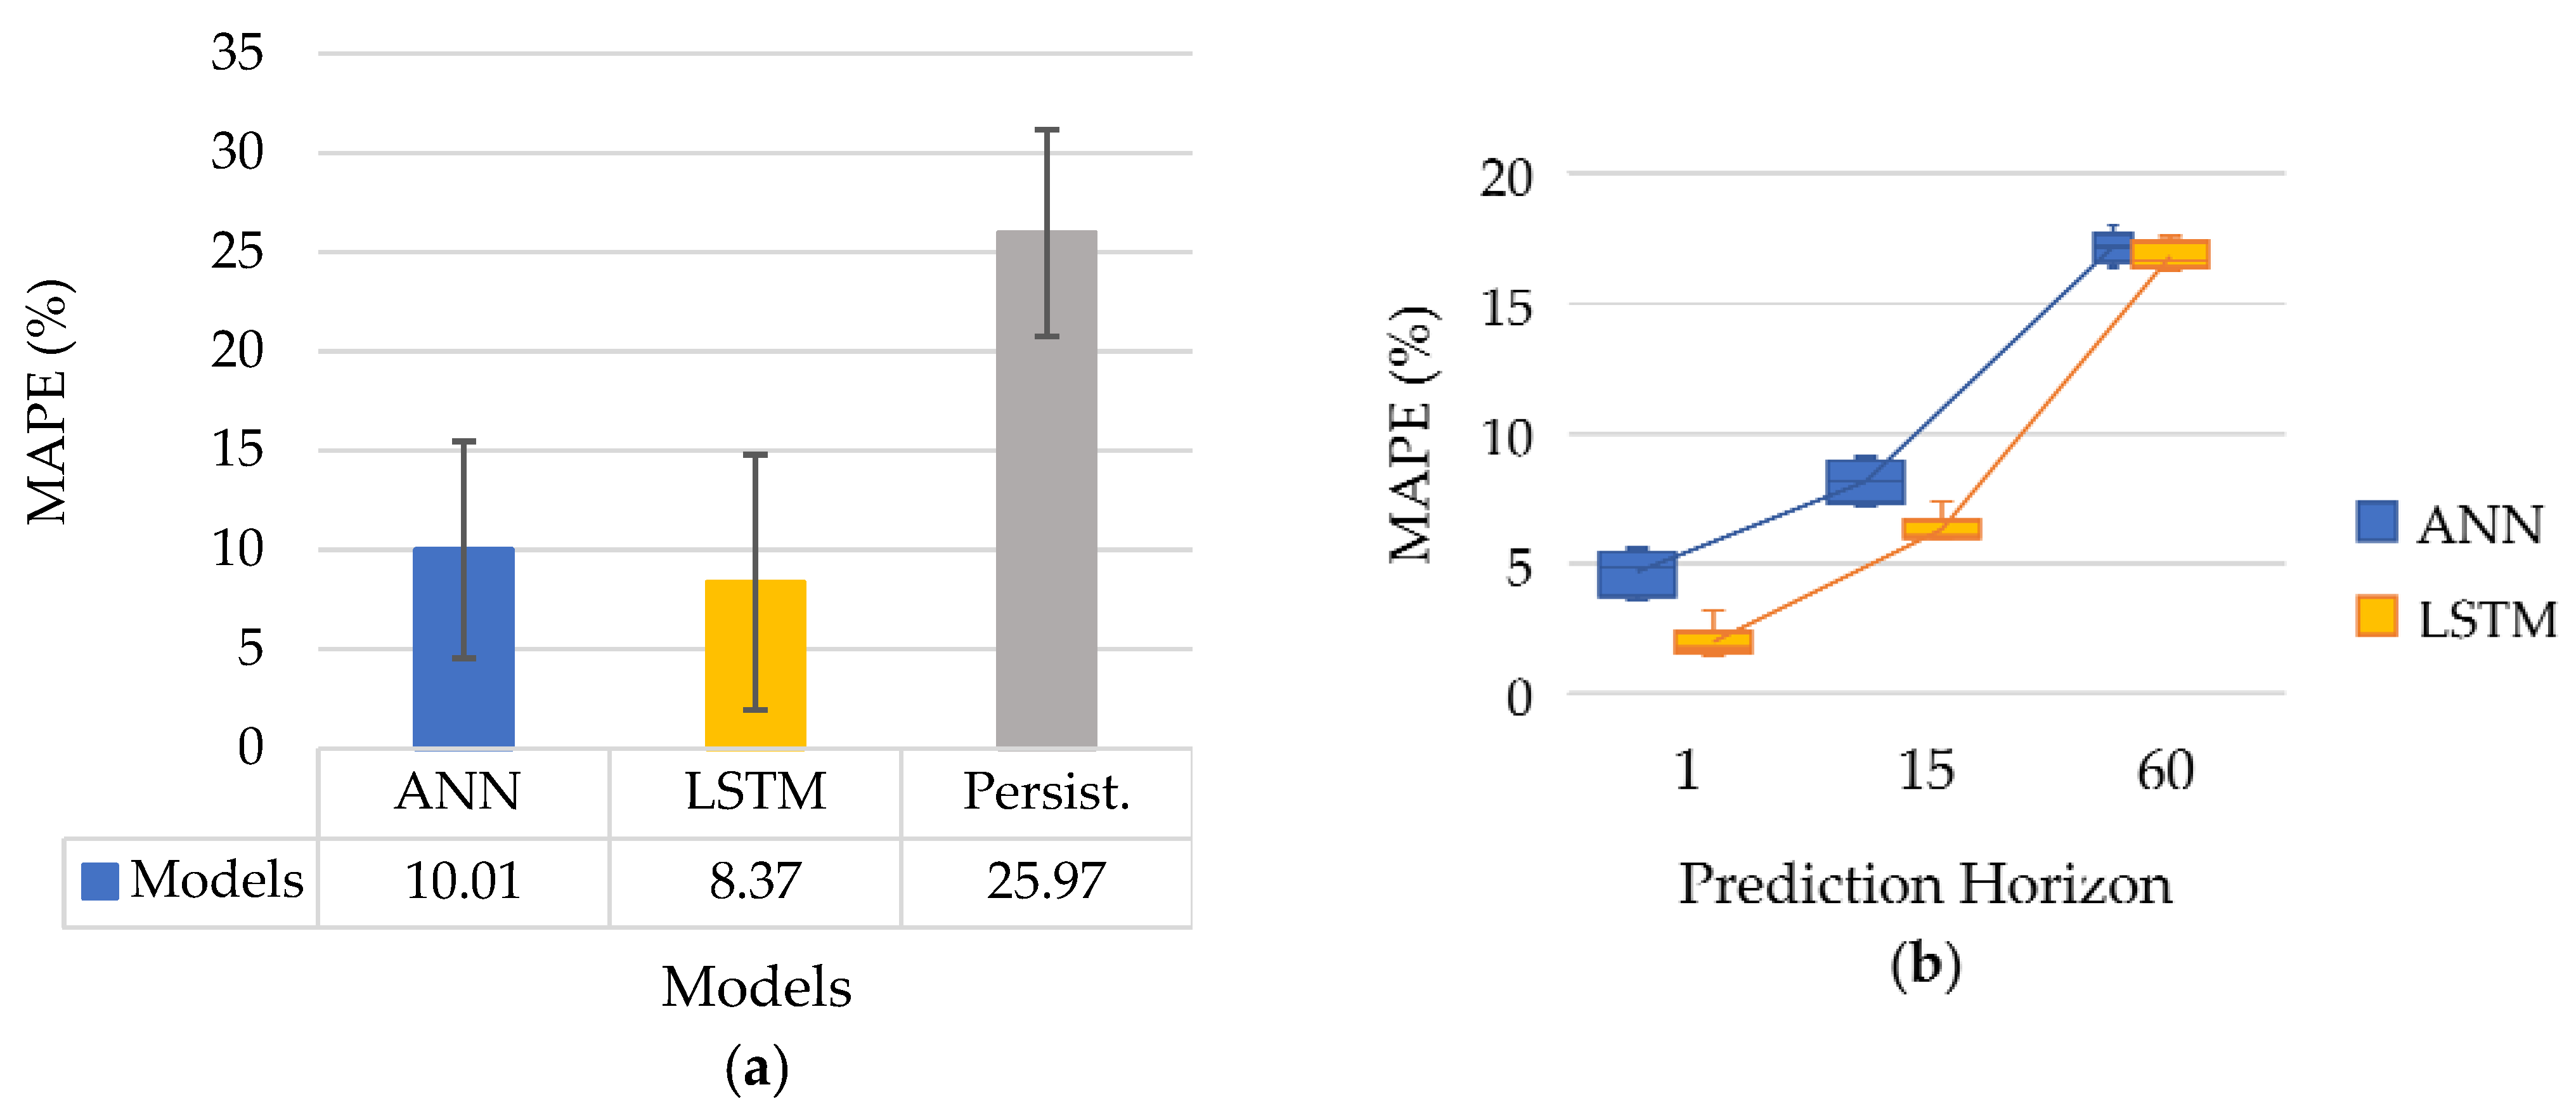
To identify the prediction model with the best overall accuracy, the mean and standard deviation values of the prediction accuracy were grouped by ANN (Figure 1c) and LSTM (Figure 2c) and persistence models. The overall average prediction accuracy performance (MAPE) of all models is displayed in Figure 4. The ANN and LSTM models outperformed the baseline persistence model. Therefore, the comparative analyses are mainly focused on both ANN and LSTM models. When comparing all samples for each ANN and LSTM model, it is observed that, overall, LSTM demonstrated better accuracy compared to ANN, having a difference in the MAPE average of 19.50%, which was therefore lower for the LSTM model (Figure 4a).
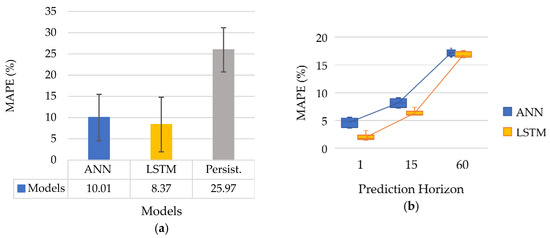
Figure 4.
Prediction accuracy of ANN and LSTM models: (a) mean overall accuracy for all samples of each model, and (b) mean model accuracy by prediction horizon.
Another result seen in Figure 4b is that the difference in average predictions between ANN and LSTM models is greater and more evident for the shorter horizons, i.e., LSTM outperformed ANN with the average RMSE percentage differences being 136.13%, 29.02% and 2.18% for the 1, 15 and 60 min horizons, respectively. Note that the smaller the MAPE value, the better the model’s prediction accuracy.
The statistical comparisons of the predictions between pairs of models were validated using hypothesis tests. In the analysis between two models groups, ANN and LSTM, the comparisons of prediction accuracy performance between pairs of models were performed with MAPE by applying the paired samples t-test [72]. The pairing of the samples for the two groups (ANN and LSTM) made it possible to perform the accuracy comparisons considering equal prediction horizons and the same input variable set. Thus, this analysis aimed to verify the following Null Hypothesis (H0): the prediction accuracy between pairs of ANN and LSTM models was equal. After applying the test, H0 was rejected (t = 6.02 and p-value < 0.001), so it is possible to state that there is a significant comparative difference between the two groups of models. Therefore, it is possible to affirm that although the absolute difference is small, LSTMs have lower MAPE (19.50%) compared to ANN models.
The present study used the ANN structure (neurons and layers) with higher accuracy reported in [22]. This same structure was employed as the basis for defining the simple LSTM model evaluated in this study. This approach was adopted in order to allow comparison of the appropriate accuracy of both models with similar structures, inputs and prediction horizons. Therefore, this study did not seek to optimize the LSTM model, or its parameters, to obtain the best prediction accuracy rates, but rather to compare ANN and LSTM models with similar structures and configurations. The difference between these evaluated models consists in the recurrence capacity (memory) of LSTM, which enables the memorization of patterns and dependencies in data with long-term memory [45]. This characteristic of LSTM is relevant when choosing one of these models, because LSTM models have better performance and also demand more computational resources than ANN models.
3.2.2. Prediction Horizon
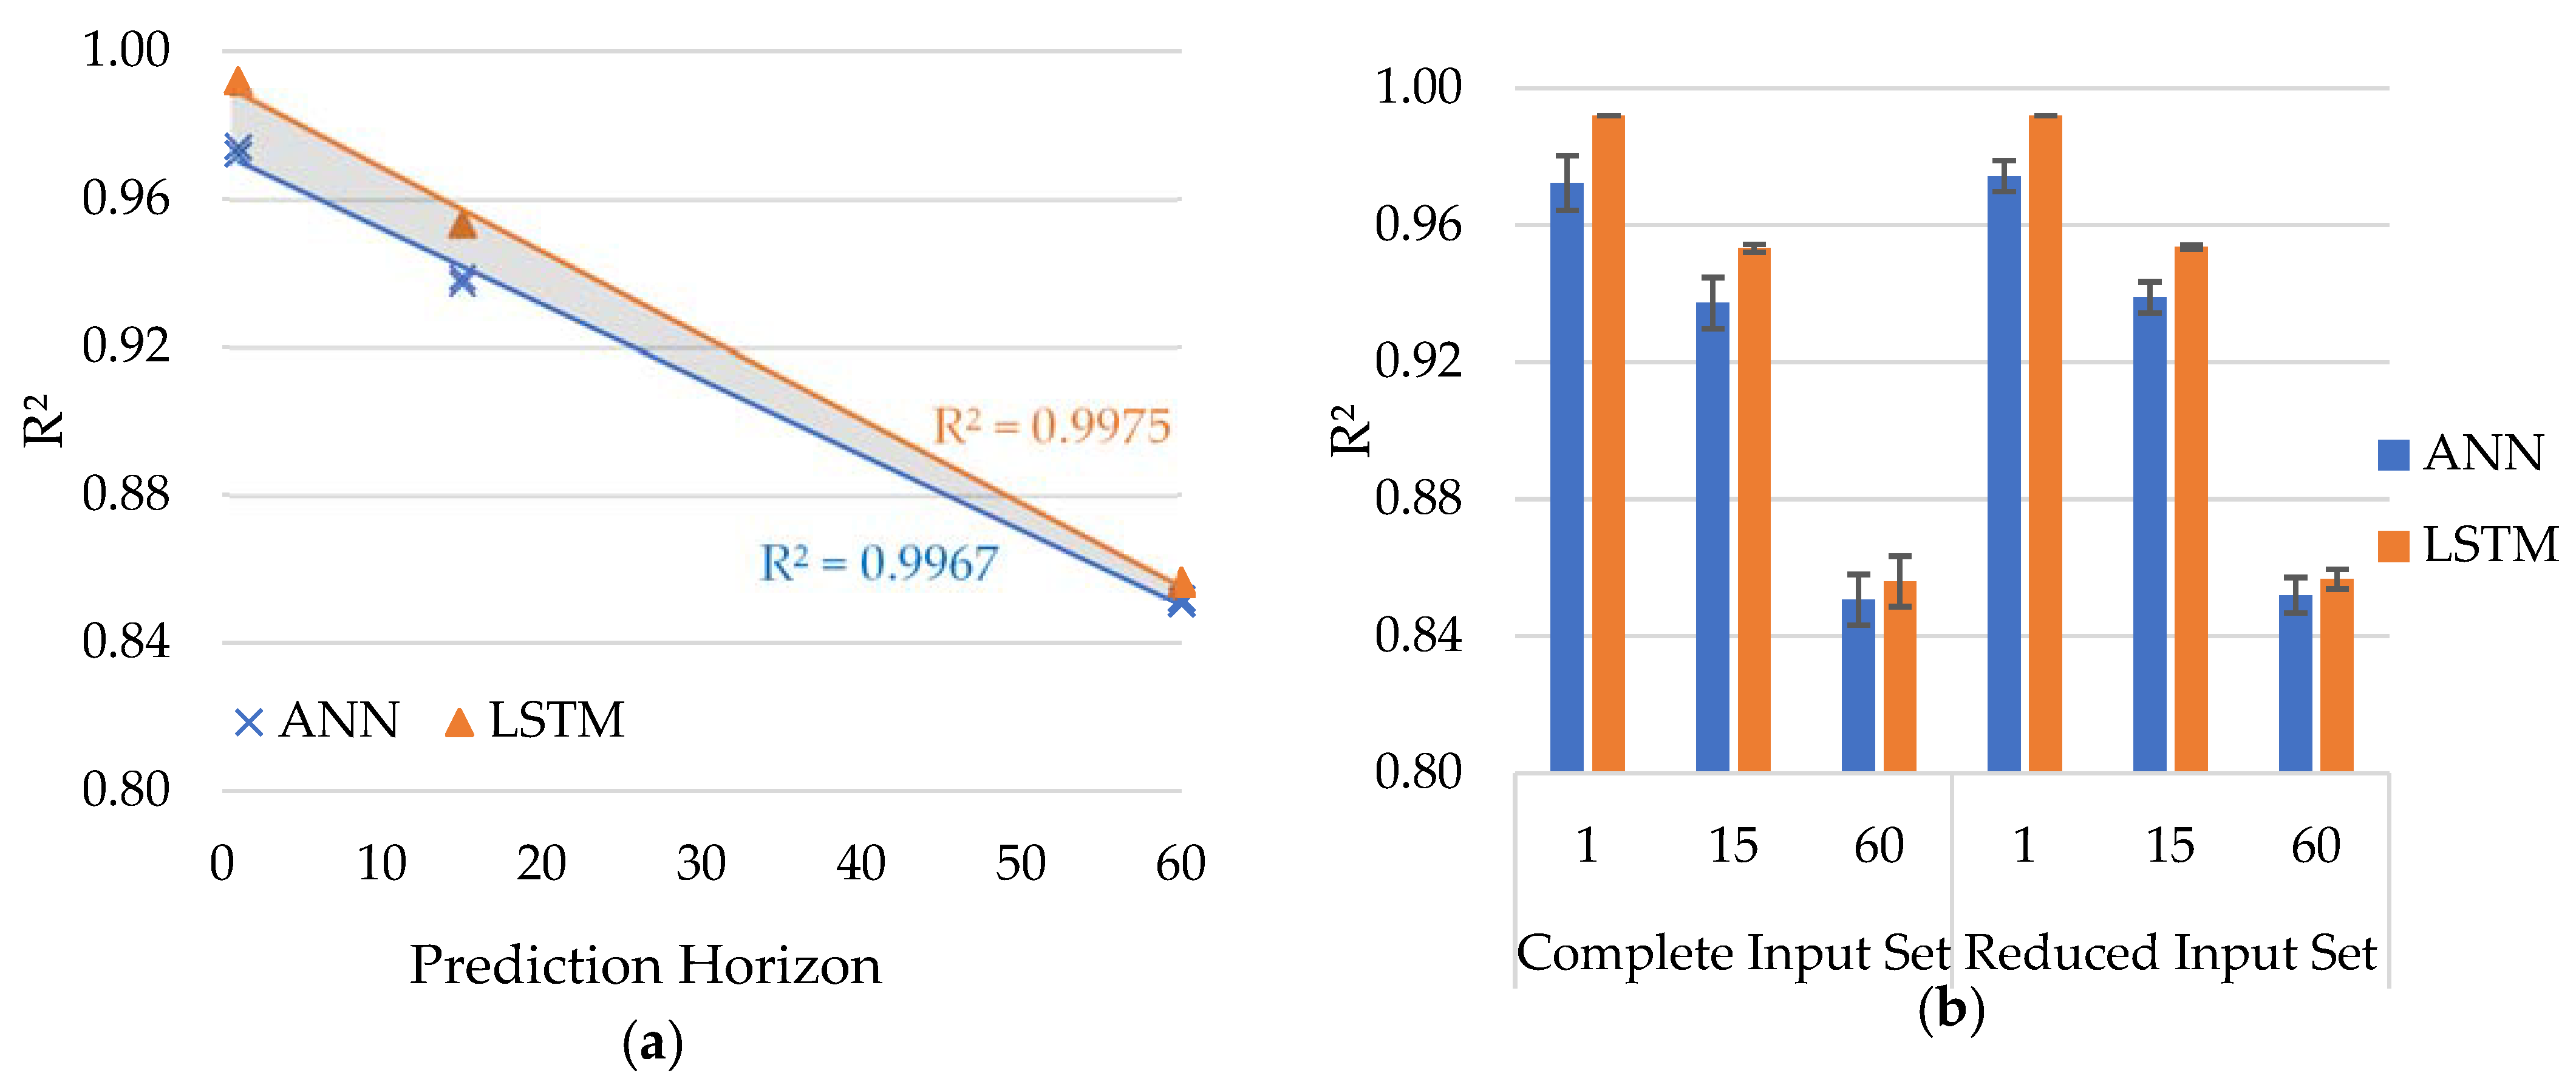
The mean accuracy of the ANN and LSTM models for each prediction horizon can be observed by means of the coefficient of determination (R²) (Figure 5). The ANN and LSTM models present similar results, with the accuracy decreasing as the prediction horizon increases (Figure 5a). Furthermore, the regression lines of the ANN and LSTM models show that the difference in accuracy between the two models decreases as the horizon increases, that is, there is a greater absolute difference between the models for the 1 min horizon. This result was similarly observed in the two input variable sets presented in Figure 5b.
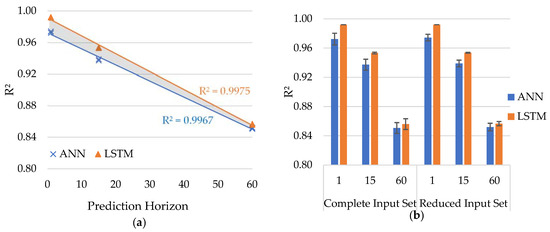
Figure 5.
Prediction accuracy by prediction horizon of all ANN and LSTM models: (a) mean R2 accuracy and linear fit of models by prediction horizon and (b) R2 accuracy by input set and horizon prediction.
In order to validate the results and comparisons between all pairs of models and prediction horizons, it was established as a Null Hypothesis (H0) that the performances of ANN and LSTM models are equal, in terms of accuracy, considering the nRMSE metric. Therefore, the repeated measures ANOVA statistical test [72] was employed to validate H0. It should be noted that the repeated measures ANOVA statistical test was applied because the means are composed of the results of three-fold (3-fold) cross-validation.
Considering the nRMSE accuracy performance of the models for the three prediction horizons, H0 was rejected (F(2, 15) = 1180.12 and p-value < 0.001). Then, the Bonferroni post-test [72] was applied to identify the differences between groups of the models and horizons. Table 7 presents the statistical differences observed in the nRMSE comparisons for all pairs of ANN and LSTM models and prediction horizons.
Table 7.
Statistical difference in prediction accuracy (nRMSE) by model and horizon.
Therefore, based on the hypothesis test in Table 7, it can be stated that the ANN and LSTM models performed predictions without significant difference only at the 60 min horizon. This is also observed in the slightly lower R2 absolute value of the LSTM model at the 60 min horizon (Figure 5b). The decrease in prediction accuracy as the prediction horizon increases is a known result from the PSPPG literature [11,25,27]. However, this study quantifies and statistically validates this result. Moreover, an additional result identified here is the decrease in the accuracy absolute difference between the ANN and LSTM models as the prediction horizon increases (Figure 5a).
Although LTSM-based models have the capability to memorize patterns and can manage the problem of long-term data dependencies relatively well [60], it is found that their accuracy was significantly higher than in ANN models only at horizons of 1 and 15 min. Possibly, the structure of the LSTM used did not enable the model to adequately capture data patterns at the greatest horizon analyzed (60 min). In this horizon, the models need to capture patterns and dependence among the data for a period three times greater than in the 15 min horizon. Therefore, the LSTM models with the structure employed in this study, even having the capacity of long-term memory, were not capable of performing more accurate predictions than the ANNs in 60 min horizon prediction. This result is particularly interesting in the construction of prediction systems, since at longer horizons the LSTM has similar accuracy to ANN models. Thus, to take advantage of the LSTM’s ability, it is necessary to define and use denser layers and a complex LSTM structure.
3.2.3. Sets of Input Variables
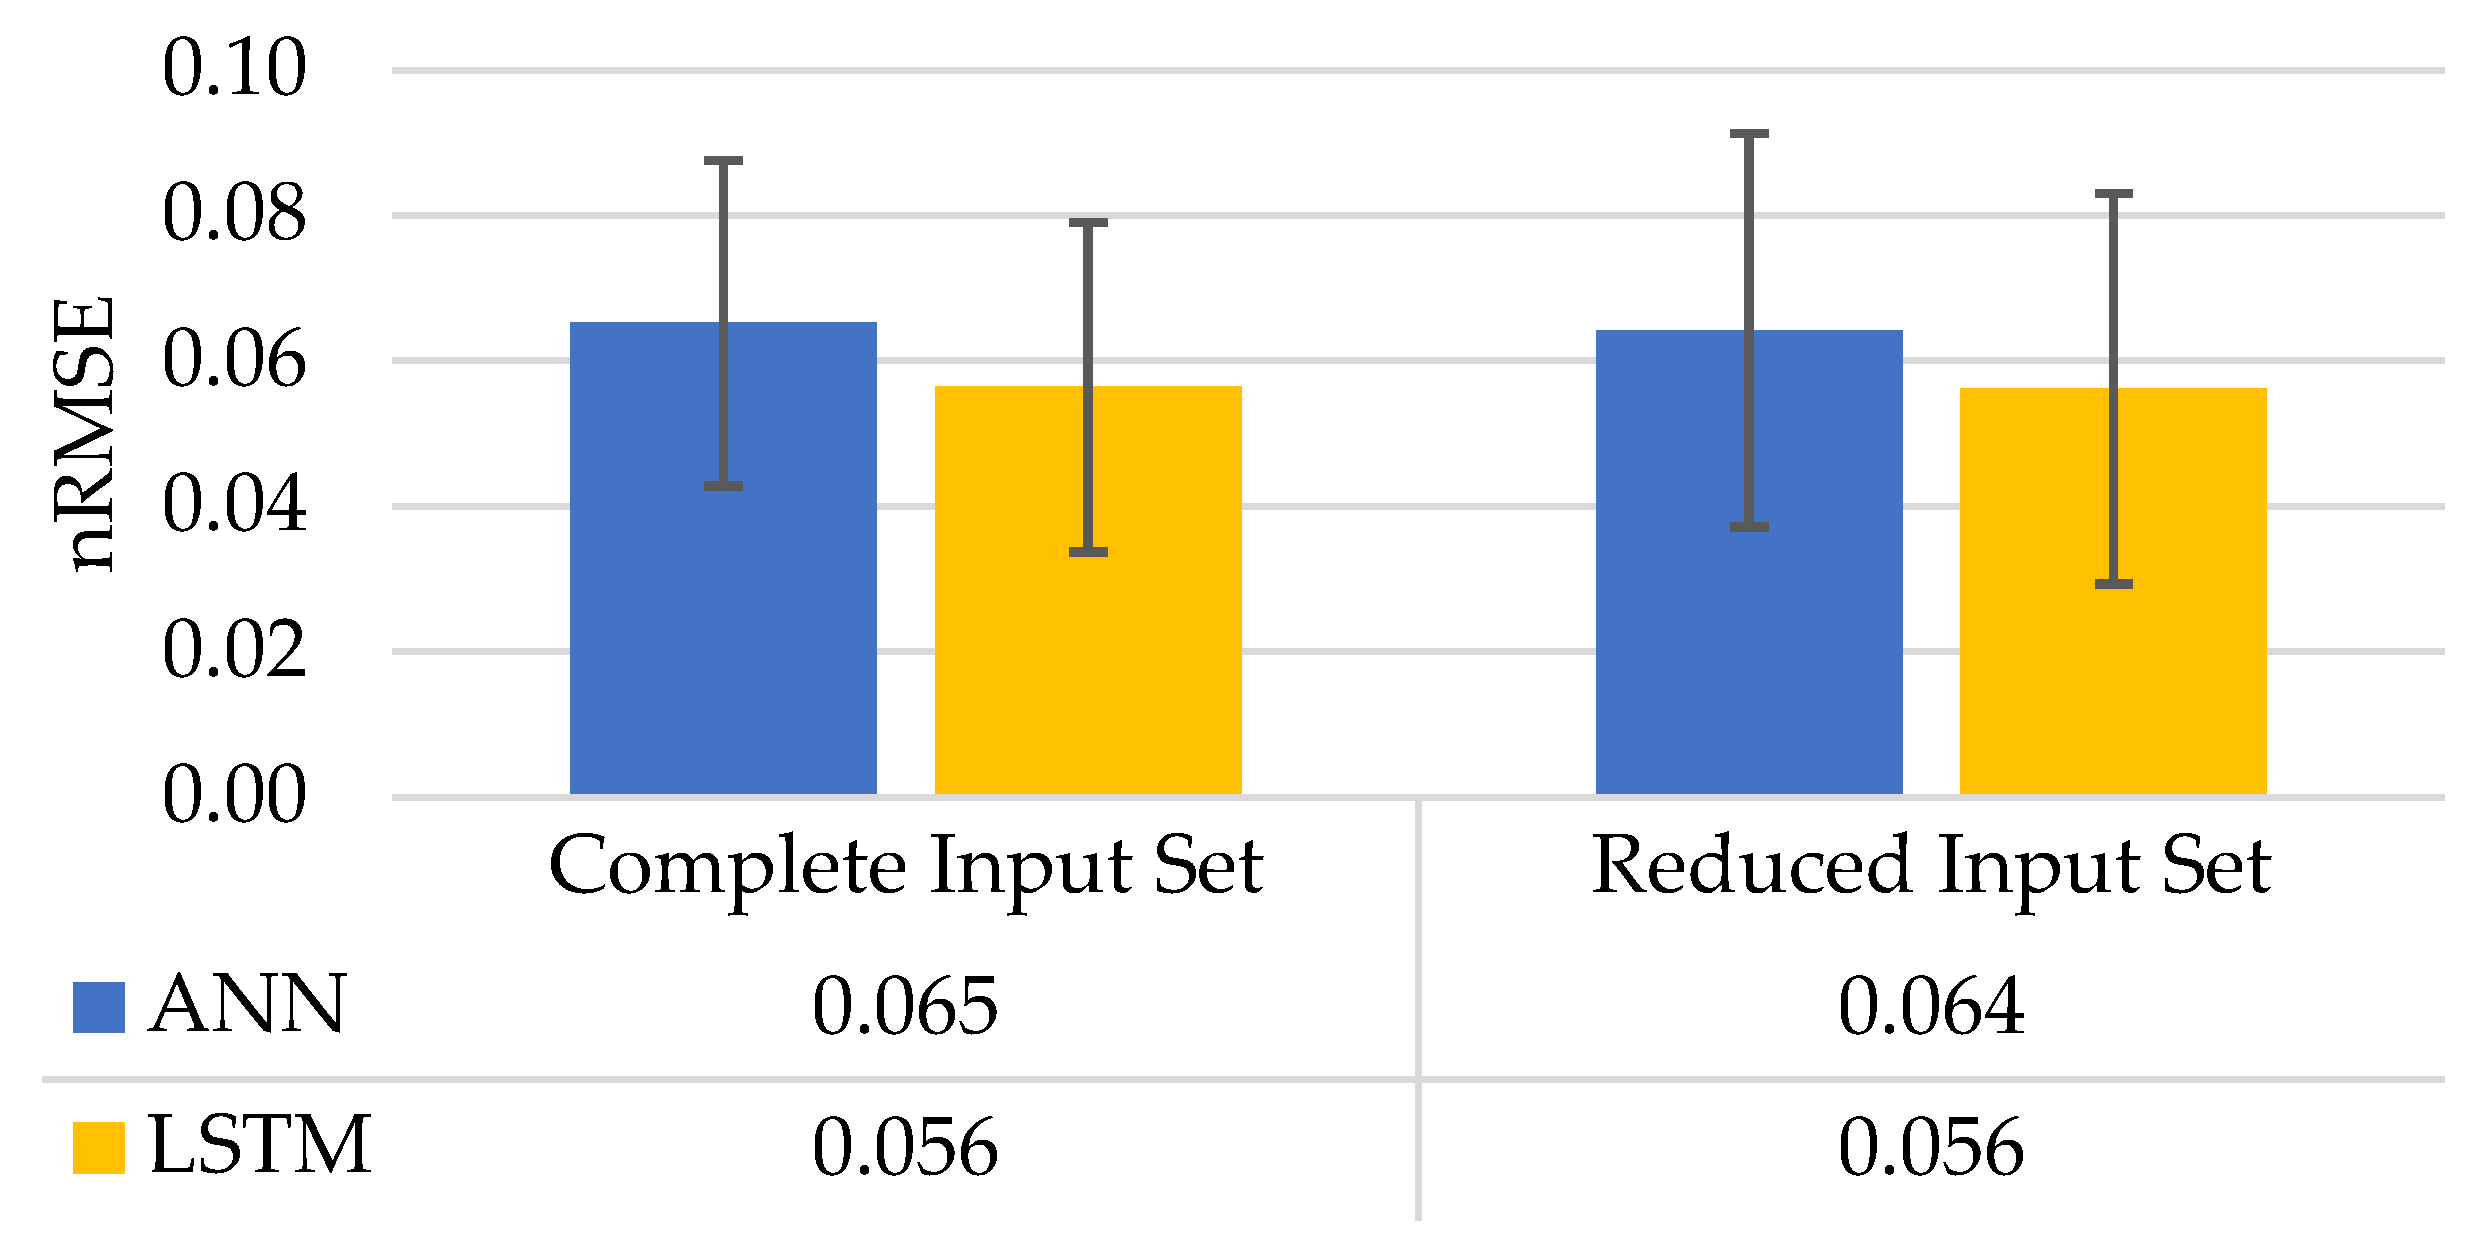
The prediction performance of ANN and LSTM models was evaluated using two different sets of input meteorological variables: Complete Input Set with 10 variables (seven exogenous) and Reduced Input Set with six variables (three exogenous), as can be seen in Table 3. The present analysis sought to verify the influence of using these two input sets with different meteorological variables on the models’ accuracy. In this sense, it was established as the Null Hypothesis (H0) that the prediction performances (nRMSE accuracy) of the models are equal for both sets of input data: Complete Input Set and Reduced Input Set. Thus, the ANOVA with repeated measures statistical test was applied considering the two sets of input variables and the ANN and LSTM models.
The hypothesis test results demonstrated that H0 cannot be rejected (F(1,16) = 0.002 and p-value = 0.967). Therefore, it is possible to affirm that there is no significant difference in the accuracies between ANN and LSTM models considering both sets of input variables (Complete Input Set and Reduced Input Set). The mean value of nRMSE and standard deviation for each model and set of input variables are represented in Figure 6, where similar values are observed between ANN and LSTM models. Similarly, this can be seen for the R² values shown in Figure 5b. Although the LSTM has a lower mean absolute value of nRMSE than the ANN, this small difference is not significant.
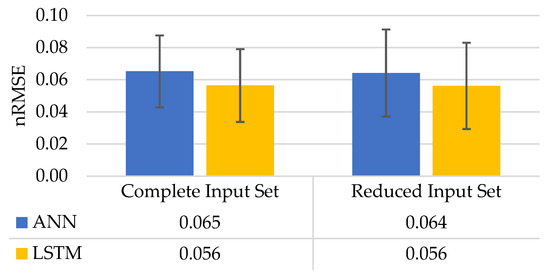
Figure 6.
Prediction accuracy between Complete Input Set and Reduced Input Set by model.
Based on the results of this analysis, it can be stated that ANN and LSTM models have the same performance in prediction accuracy (nRMSE) with 10 (Complete Input Set) or six (Reduced Input Set) input variables. More specifically, this analysis regarding the use of two different sets of exogenous weather input variables is important for PSPPG for two reasons. First, based on the literature review, this is the first study that evaluates the use of these two sets of exogenous meteorological input variables with ANNs, LSTMs and at three distinct short-term horizons. Second, the Reduced Input Set, which has the fewest exogenous meteorological variables (temperature, wind speed and direction), demonstrated similar prediction accuracy with ANNs and LSTMs compared to using the seven meteorological variables from the Complete Input Set (air temperature, relative humidity, atmospheric pressure, wind speed, wind direction, maximum wind speed and precipitation).
As mentioned in Section 1.1, the variables in the Reduced Input Set were selected because they have a greater impact on solar irradiance, complementing and validating the results of previous studies [55], from experimental analysis with ANN and LSTM models. Thus, in particular, these results contribute to PSPPG by validating and adding new and relevant information about the use of meteorological variables in short-term predictions with ANN and LSTM.
Finally, a prediction example for ANN and LSTM models with two sets of input variables is depicted in Figure 7. The predictions for the 1 min horizon are presented for a partially cloudy day (2 June 2014). Although visually similar, ANN and LSTM model prediction accuracies showed significant differences for all horizons, except for the 60 min horizon.
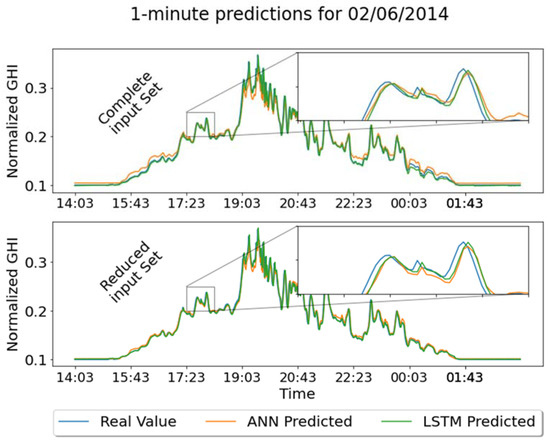
Figure 7.
Examples of ANN and LSTM forecasting for 1 min prediction horizon with Complete Input Set and Reduced Input Set.
4. Conclusions
In this study, the ANN and LSTM models’ accuracies for short-term prediction of solar photovoltaic energy generation were developed and evaluated. The tools, environment and methodology were designed to enable a controlled and homogeneous experimental configuration and, hence, provide an adequate comparison between ANN and LSTM prediction models’ accuracy. In general, both ANN and LSTM models outperformed the persistence model and, thus, the analyses were focused on both models.
The analysis performed in the present study differs from the literature by considering comparisons simultaneously including the three following characteristics of the PSPPG: prediction models (ANN and LSTM), meteorological and exogenous input variables (Complete Input Set and Reduced Input Set) and three shot-term prediction horizons (1, 15 and 60 min). Although ANN models have been most used in the PSPPG in the last decade [10], several recent works with LSTMs have been reported in the PSPPG literature. This allowed identifying the originality and purpose of this study, as detailed in Table 1. Although there are other studies in various areas of knowledge that evaluate ANN and LSTM models, no study including all the characteristics evaluated here has been observed in the PSPPG literature.
In this context, the main results and contributions of this study for the evaluated model configurations, inputs and prediction horizons are summarized below:
- A.
- The prediction performances between the two groups of ANN and LTSM models are significantly different (p < 0.001). LSTM models showed better average accuracy in predictions, with MAPE 1.63% lower compared to ANN models. This difference exhibits higher amplitude for the smallest prediction horizons evaluated. Therefore, the LSTM networks evaluated in this study are better suited for short-term predictions, especially when considering the smallest prediction horizons evaluated. It should be noted that the aim of the study is to compare ANN and LSTM models with similar structure and, thus, to measure the ability of LSTMs to memorize the temporal dependencies of long-term data in the PSPPG context.
- B.
- The ANN and LSTM models’ accuracy was evaluated in the three prediction horizons of 1, 15 and 60 min. Both models showed similar behavior, with R² values tending to decrease as the prediction horizon increases. Although this result is known in the PSPPG literature [11], this study provides additional information about the accuracy of ANN and LSTM models at the horizons evaluated. The statistical analysis of accuracy at the prediction horizons indicated a significant difference (p < 0.001) in the nRMSE, except for the ANN and LSTM accuracy predictions at the 60 min horizon, where the hypothesis test showed no significant difference. Therefore, it is concluded that the choice of the LSTM model, evaluated in this study, is adequate and provides better accuracy at the 1 and 15 min horizons. The results indicate that the LSTM model, in this study, was not able to adequately capture the variability and patterns of the existing data at the 60 min horizon. This may possibly be due to the simplicity of the LSTM structure used or the limited amount of training data. Furthermore, a denser and complex layer structure may enhance the ability of LSTMs to capture solar irradiance patterns at horizons of 60 min or more.
- C.
- Each ANN and LSTM model was evaluated with two different sets of input exogenous variables: Complete Input Set and Reduced Input Set. The statistical result indicated no significant difference in accuracy between the evaluated input variables sets. Therefore, the use of more exogenous meteorological variables did not significantly influence the prediction accuracy of the models evaluated. In other words, the ANN and LSTM models using the Reduced Input Set (with three meteorological variables) demonstrated the same prediction accuracy as compared to the seven exogenous variables in the Complete Input Set. This information is particularly relevant in the prediction system design, because there are additional costs in the acquisition of sensors to capture meteorological information and, with this study, it is possible to choose, or not, their use.
- D.
- The study results concerning short-term PSPPG with ANN and LSTM models suggest that prediction systems can be designed without the need for installation and maintenance of solar irradiance sensors, permitting cost reduction.
This study did not aim to improve the ANN and LSTM models’ accuracy, but is limited to evaluating and comparing those with similar structures with different exogenous input variables, and short-term prediction horizons, in order to contribute to future research in the context of the PSPPG. In addition, a standardized database [57] was selected to perform experiments with controlled and quality data.
Another contribution of this study is the fact that prediction models based on LSTM networks should be carefully designed and evaluated in the PSPPG context. Several studies consider the prediction horizon of one hour (60 min) ahead [73] or else analyze only one ANN or LSTM model [74]. The present study differs by evaluating two additional short-term horizons (1 and 15 min) and both models. The variability of this type of problem is dynamically accentuated as the prediction horizon increases and this requires a more complex structure of the predictive LSTM model in order to capture the long-term patterns and dependencies in the data. In addition, it requires a larger amount of training data and, consequently, higher computational cost and training time for the models [61]. Finally, the results and conclusions of this study suggest further analysis, such as the use of other structures and parameter optimization, as well the application of hybrid machine learning and deep learning models. On the other hand, there are efforts in the community to optimize the prediction performance of the ANN [31,59] and LSTM [44,75,76] models, making it possible to improve the accuracy rates of these models.
Author Contributions
Conceptualization: V.H.W. and O.H.A.J., investigation and simulation: V.H.W. and J.N.M., writing and final editing: V.H.W., J.N.M., J.J.G.L. and O.H.A.J. All authors have read and agreed to the published version of the manuscript.
Funding
This research was funded by PRPPG of the Federal University of Latin America Integration (UNILA). O.H.A.J. was funded by the Brazilian National Council for Scientific and Technological Development (CNPq), grant number 407531/2018-1 and 303293/2020-9.
Acknowledgments
The authors would like to thank the Federal University of Latin American Integration (UNILA) for financial support and facilities, Coordination for the Improvement of Higher Education Personnel (CAPES) and the Brazilian Council for Scientific and Technological Development (CNPq) for financial support.
Conflicts of Interest
The authors declare no conflict of interest.
Nomenclature
| ANN | Artificial Neural Network |
| BRT | Bagged Regression Trees |
| CNN | Convolutional Neural Networks |
| cvRMSE | Coefficient of Variation–Root Mean Square Error |
| CWC | Coverage Width-Based Criterion |
| BPNN | Back Propagation Neural Network |
| WPD-LSTM | Wavelet Packet-Decomposition Long Short-Term Memory |
| DL | Deep Learning |
| DMAE | Dynamic Mean Absolute Error |
| GHI | Global Horizontal Irradiance |
| GPR | Gaussian Process Regression |
| SCNN-LSTM | Siamese Convolutional Neural Network–Long Short-Term Memory |
| ELM | Extreme Learning Machine |
| GW | Gigawatt |
| IRENA | International Renewable Energy Agency |
| LS-SVR | Least-Squares Support Vector Regression |
| LSTM | Long Short-Term Memory |
| MBE | Mean Bias Error |
| ML | Machine Learning |
| MLR | Multiple Linear Regression |
| nRMSE | Normalized Root Mean Square Error |
| PSPPG | Prediction of Photovoltaic Solar Energy Generation |
| PV | Photovoltaic |
| R2 | Coefficient of Determination |
| RMSE | Root Mean Square Error |
| r | Correlation Coefficient |
| fs | Forecast Skill |
References
- ANEEL. Sistema de Informações de Geração da ANEEL-SIGA. Available online: https://bit.ly/2IGf4Q0 (accessed on 27 October 2021).
- ABSOLAR. Energia Solar Atinge Marca Histórica e Brasil Entra Para Grupo dos 15 Países Com Maior Geração. Available online: https://www.absolar.org.br/noticia/energia-solar-atinge-marca-historica-e-brasil-entra-para-grupo-dos-15-paises-com-maior-geracao/ (accessed on 27 October 2021).
- IEA. Renewables 2021-Analysis and Forecast to 2026. Available online: https://www.iea.org/reports/renewables-2021 (accessed on 10 January 2022).
- Lappalainen, K.; Valkealahti, S. Photovoltaic mismatch losses caused by moving clouds. Sol. Energy 2017, 158, 455–461. [Google Scholar] [CrossRef]
- Lucchese, F.C.; Anselmini, F.; Martins, C.C.; Sperandio, M. Análise do Impacto da Geração Distribuida Fotovoltaica na Rede Elétrica da Universidade Federal de Santa Maria. In Proceedings of the VII Congresso Brasileiro de Energia Solar, Gramado, RS, Brazil, 17–20 April 2018; pp. 1–10. [Google Scholar]
- Antonanzas, J.; Osorio, N.; Escobar, R.; Urraca, R.; Martinez-de-Pison, F.J.; Antonanzas-Torres, F. Review of photovoltaic power forecasting. Sol. Energy 2016, 136, 78–111. [Google Scholar] [CrossRef]
- Li, P.; Zhou, K.; Yang, S. Photovoltaic Power Forecasting: Models and Methods. In Proceedings of the 2nd IEEE Conference on Energy Internet and Energy System Integration, EI2 2018-Proceedings, Beijing, China, 20–22 October 2018; IEEE: Piscataway, NJ, USA, 2018; pp. 1–6. [Google Scholar]
- Yang, D.; Kleissl, J.; Gueymard, C.A.; Pedro, H.T.C.; Coimbra, C.F.M. History and trends in solar irradiance and PV power forecasting: A preliminary assessment and review using text mining. Sol. Energy 2018, 168, 60–101. [Google Scholar] [CrossRef]
- Das, U.K.; Tey, K.S.; Seyedmahmoudian, M.; Mekhilef, S.; Idris, M.Y.I.; Van Deventer, W.; Horan, B.; Stojcevski, A. Forecasting of photovoltaic power generation and model optimization: A review. Renew. Sustain. Energy Rev. 2018, 81, 912–928. [Google Scholar] [CrossRef]
- Sobri, S.; Koohi-Kamali, S.; Rahim, N.A. Solar photovoltaic generation forecasting methods: A review. Energy Convers. Manag. 2018, 156, 459–497. [Google Scholar] [CrossRef]
- Blaga, R.; Sabadus, A.; Stefu, N.; Dughir, C.; Paulescu, M.; Badescu, V. A current perspective on the accuracy of incoming solar energy forecasting. Prog. Energy Combust. Sci. 2019, 70, 119–144. [Google Scholar] [CrossRef]
- Maciel, J.N.; Javier Gimenez Ledesma, J.; Hideo Ando Junior, O. Forecasting Solar Power Output Generation: A Systematic Review with the Proknow-C. IEEE Lat. Am. Trans. 2021, 19, 612–624. [Google Scholar] [CrossRef]
- Jayadevan, V.T.; Rodriguez, J.J.; Lonij, V.P.A.; Cronin, A.D. Forecasting solar power intermittency using ground-based cloud imaging. In Proceedings of the World Renewable Energy Forum, WREF 2012, Including World Renewable Energy Congress XII and Colorado Renewable Energy Society (CRES) Annual Conferen, Department of Electrical and Computer Engineering, University of Arizona, Tucson, AZ, USA, 13–17 May 2012; Volume 3, pp. 2100–2106. [Google Scholar]
- Diaz, V.S. Avaliação de Desempenho das Estratégias de Controle Para Suavização da Potência Ativa de Sistemas Fotovoltaicos com Armazenamento de Energia. Master’s Dissertation, Universidade Estadual do Oeste do Paraná (UNIOESTE), Foz do Iguaçu, Brazil, 2019. [Google Scholar]
- Liu, Z.; Mohammadzadeh, A.; Turabieh, H.; Mafarja, M.; Band, S.S.; Mosavi, A. A New Online Learned Interval Type-3 Fuzzy Control System for Solar Energy Management Systems. IEEE Access 2021, 9, 10498–10508. [Google Scholar] [CrossRef]
- Obando, E.D.; Carvajal, S.X.; Pineda Agudelo, J. Solar Radiation Prediction Using Machine Learning Techniques: A Review. IEEE Lat. Am. Trans. 2019, 17, 684–697. [Google Scholar] [CrossRef]
- Voyant, C.; Notton, G.; Kalogirou, S.; Nivet, M.L.; Paoli, C.; Motte, F.; Fouilloy, A. Machine learning methods for solar radiation forecasting: A review. Renew. Energy 2017, 105, 569–582. [Google Scholar] [CrossRef]
- Wang, H.; Lei, Z.; Zhang, X.; Zhou, B.; Peng, J. A review of deep learning for renewable energy forecasting. Energy Convers. Manag. 2019, 198, 111799. [Google Scholar] [CrossRef]
- Rajagukguk, R.A.; Ramadhan, R.A.A.; Lee, H.J. A review on deep learning models for forecasting time series data of solar irradiance and photovoltaic power. Energies 2020, 13, 6623. [Google Scholar] [CrossRef]
- Russell, S.; Norvig, P. Artificial Intelligence: A Modern Approach, 3rd ed.; Pearson Education India: Delhi, India, 2015. [Google Scholar]
- Hochreiter, S.; Schmidhuber, J. Long Short-Term Memory. Neural Comput. 1997, 9, 1735–1780. [Google Scholar] [CrossRef] [PubMed]
- Sherstinsky, A. Fundamentals of Recurrent Neural Network (RNN) and Long Short-Term Memory (LSTM) network. Phys. D Nonlinear Phenom. 2020, 404, 132306. [Google Scholar] [CrossRef] [Green Version]
- Taylor, S.J.; Letham, B. Forecasting at Scale. Am. Stat. 2018, 72, 37–45. [Google Scholar] [CrossRef]
- Bendiek, P.; Taha, A.; Abbasi, Q.H.; Barakat, B. Solar Irradiance Forecasting Using a Data-Driven Algorithm and Contextual Optimisation. Appl. Sci. 2021, 12, 134. [Google Scholar] [CrossRef]
- Maciel, J.N.; Wentz, V.H.; Ledesma, J.J.G.; Ando Junior, O.H. Analysis of Artificial Neural Networks for Forecasting Photovoltaic Energy Generation with Solar Irradiance. Brazilian Arch. Biol. Technol. 2021, 64. [Google Scholar] [CrossRef]
- Wentz, V.H.; Maciel, J.N.; Kapp, M.N.; Ledesma, J.J.G.; Ando Junior, O.H.; Junior, O.H.A. Comparação de Modelos de Redes Neurais Artificiais para a Predição da Irradiância Solar na Geração de Energia Fotovoltaica. In Proceedings of the Anais do I Congresso Brasileiro Interdisciplinar em Ciência e Tecnologia, Even3 Publicações, Online, 4 September 2020; p. 8. [Google Scholar]
- Serrano Ardila, V.M.; Maciel, J.N.; Ledesma, J.J.G.; Ando Junior, O.H. Fuzzy Time Series Methods Applied to (In)Direct Short-Term Photovoltaic Power Forecasting. Energies 2022, 15, 845. [Google Scholar] [CrossRef]
- Zafar, R.; Vu, B.H.; Husein, M.; Chung, I.-Y. Day-Ahead Solar Irradiance Forecasting Using Hybrid Recurrent Neural Network with Weather Classification for Power System Scheduling. Appl. Sci. 2021, 11, 6738. [Google Scholar] [CrossRef]
- Sreekumar, S.; Bhakar, R. Solar Power Prediction Models: Classification Based on Time Horizon, Input, Output and Application. In Proceedings of the International Conference on Inventive Research in Computing Applications, ICIRCA 2018, Coimbatore, India, 11–12 July 2018; pp. 67–71. [Google Scholar]
- Kumari, P.; Toshniwal, D. Deep learning models for solar irradiance forecasting: A comprehensive review. J. Clean. Prod. 2021, 318, 128566. [Google Scholar] [CrossRef]
- Moayedi, H.; Mosavi, A. An Innovative Metaheuristic Strategy for Solar Energy Management through a Neural Networks Framework. Energies 2021, 14, 1196. [Google Scholar] [CrossRef]
- Kotsiantis, S.B.; Zaharakis, I.D.; Pintelas, P.E. Machine learning: A review of classification and combining techniques. Artif. Intell. Rev. 2006, 26, 159–190. [Google Scholar] [CrossRef]
- Zhang, G.P. Neural Networks for Time-Series Forecasting. In Handbook of Natural Computing; Rozenberg, G., Bäck, T., Kok, J.N., Eds.; Springer: Berlin/Heidelberg, Germany, 2012. [Google Scholar]
- Yu, Y.; Cao, J.; Zhu, J. An LSTM Short-Term Solar Irradiance Forecasting Under Complicated Weather Conditions. IEEE Access 2019, 7, 145651–145666. [Google Scholar] [CrossRef]
- Tina, G.M.; Ventura, C.; Ferlito, S.; De Vito, S. A State-of-Art-Review on Machine-Learning Based Methods for PV. Appl. Sci. 2021, 11, 7550. [Google Scholar] [CrossRef]
- Kotu, V.; Deshpande, B. Deep Learning; MIT Press: Cambridge, MA, USA, 2019. [Google Scholar]
- Gamboa, J.C.B. Deep Learning for Time-Series Analysis. Computing Research Repository (CoRR). arXiv 2017, arXiv:1701.01887. [Google Scholar]
- Konstantinou, M.; Peratikou, S.; Charalambides, A.G. Solar Photovoltaic Forecasting of Power Output Using LSTM Networks. Atmosphere 2021, 12, 124. [Google Scholar] [CrossRef]
- Halpern-Wight, N.; Konstantinou, M.; Charalambides, A.G.; Reinders, A. Training and Testing of a Single-Layer LSTM Network for Near-Future Solar Forecasting. Appl. Sci. 2020, 10, 5873. [Google Scholar] [CrossRef]
- Huang, C.J.; Kuo, P.H. Multiple-Input Deep Convolutional Neural Network Model for Short-Term Photovoltaic Power Forecasting. IEEE Access 2019, 7, 74822–74834. [Google Scholar] [CrossRef]
- Wen, H.; Du, Y.; Chen, X.; Lim, E.; Wen, H.; Jiang, L.; Xiang, W. Deep Learning Based Multistep Solar Forecasting for PV Ramp-Rate Control Using Sky Images. IEEE Trans. Ind. Inform. 2021, 17, 1397–1406. [Google Scholar] [CrossRef]
- Malof, J.M.; Collins, L.M.; Bradbury, K. A deep convolutional neural network, with pre-training, for solar photovoltaic array detection in aerial imagery. Int. Geosci. Remote Sens. Symp. 2017, 2017, 874–877. [Google Scholar] [CrossRef]
- Wojtkiewicz, J.; Hosseini, M.; Gottumukkala, R.; Chambers, T.L. Hour-Ahead Solar Irradiance Forecasting Using Multivariate Gated Recurrent Units. Energies 2019, 12, 4055. [Google Scholar] [CrossRef] [Green Version]
- Wang, Y.; Feng, B.; Hua, Q.S.; Sun, L. Short-term solar power forecasting: A combined long short-term memory and gaussian process regression method. Sustainability 2021, 13, 3665. [Google Scholar] [CrossRef]
- Suresh, V.; Janik, P.; Rezmer, J.; Leonowicz, Z. Forecasting solar PV output using convolutional neural networks with a sliding window algorithm. Energies 2020, 13, 723. [Google Scholar] [CrossRef] [Green Version]
- Wang, F.; Yu, Y.; Zhang, Z.; Li, J.; Zhen, Z.; Li, K. Wavelet decomposition and convolutional LSTM networks based improved deep learning model for solar irradiance forecasting. Appl. Sci. 2018, 8, 1286. [Google Scholar] [CrossRef] [Green Version]
- Tovar, M.; Robles, M.; Rashid, F. PV Power Prediction, Using CNN-LSTM Hybrid Neural Network Model. Case of Study: Temixco-Morelos, México. Energies 2020, 13, 6512. [Google Scholar] [CrossRef]
- Abdel-Nasser, M.; Mahmoud, K. Accurate photovoltaic power forecasting models using deep LSTM-RNN. Neural Comput. Appl. 2017, 31, 2727–2740. [Google Scholar] [CrossRef]
- He, H.; Hu, R.; Zhang, Y.; Zhang, Y.; Jiao, R. A Power Forecasting Approach for PV Plant based on Irradiance Index and LSTM. In Proceedings of the 2018 37th Chinese Control Conference (CCC), Wuhan, China, 25–27 July 2018; IEEE: Piscataway, NJ, USA, 2018; pp. 9404–9409. [Google Scholar]
- Pang, Z.; Niu, F.; O’Neill, Z. Solar radiation prediction using recurrent neural network and artificial neural network: A case study with comparisons. Renew. Energy 2020, 156, 279–289. [Google Scholar] [CrossRef]
- Li, P.; Zhou, K.; Lu, X.; Yang, S. A hybrid deep learning model for short-term PV power forecasting. Appl. Energy 2020, 259, 114216. [Google Scholar] [CrossRef]
- Huang, X.; Zhang, C.; Li, Q.; Tai, Y.; Gao, B.; Shi, J. A Comparison of Hour-Ahead Solar Irradiance Forecasting Models Based on LSTM Network. Math. Probl. Eng. 2020, 2020, 4251517. [Google Scholar] [CrossRef]
- Gbémou, S.; Eynard, J.; Thil, S.; Guillot, E.; Grieu, S. A Comparative Study of Machine Learning-Based Methods for Global Horizontal Irradiance Forecasting. Energies 2021, 14, 3192. [Google Scholar] [CrossRef]
- Zhu, T.; Guo, Y.; Li, Z.; Wang, C. Solar Radiation Prediction Based on Convolution Neural Network and Long Short-Term Memory. Energies 2021, 14, 8498. [Google Scholar] [CrossRef]
- Cha, J.; Kim, M.K.; Lee, S.; Kim, K.S. Investigation of applicability of impact factors to estimate solar irradiance: Comparative analysis using machine learning algorithms. Appl. Sci. 2021, 11, 8533. [Google Scholar] [CrossRef]
- Chu, Y.; Urquhart, B.; Gohari, S.M.I.; Pedro, H.T.C.; Kleissl, J.; Coimbra, C.F.M. Short-term reforecasting of power output from a 48 MWe solar PV plant. Sol. Energy 2015, 112, 68–77. [Google Scholar] [CrossRef]
- Pedro, H.T.C.; Larson, D.P.; Coimbra, C.F.M. A comprehensive dataset for the accelerated development and benchmarking of solar forecasting methods. J. Renew. Sustain. Energy 2019, 11, 036102. [Google Scholar] [CrossRef] [Green Version]
- Rezende, S.O. Sistemas Inteligentes, 1st ed.; Manole: São Paulo, Brazil, 2003; Volume 2013, ISBN 9788520416839. [Google Scholar]
- Claywell, R.; Nadai, L.; Felde, I.; Ardabili, S.; Mosavi, A. Adaptive Neuro-Fuzzy Inference System and a Multilayer Perceptron Model Trained with Grey Wolf Optimizer for Predicting Solar Diffuse Fraction. Entropy 2020, 22, 1192. [Google Scholar] [CrossRef]
- Yu, Y.; Si, X.; Hu, C.; Zhang, J. A Review of Recurrent Neural Networks: LSTM Cells and Network Architectures. Neural Comput. 2019, 31, 1235–1270. [Google Scholar] [CrossRef] [PubMed]
- Haviv, D.; Rivkind, A.; Barak, O. Understanding and Controlling Memory in Recurrent Neural Networks. In Proceedings of the 36th International Conference on Machine Learning, ICML, Long Beach, CA, USA, 10–15 June 2019; pp. 4733–4741. [Google Scholar]
- Lee, D.; Kim, K. Recurrent neural network-based hourly prediction of photovoltaic power output using meteorological information. Energies 2019, 12, 215. [Google Scholar] [CrossRef] [Green Version]
- Srivastava, N.; Hinton, G.; Krizhevsky, A.; Sutskever, I.; Salakhutdinov, R. Dropout: A Simple Way to Prevent Neural Networks from Overfitting. J. Mach. Learn. Res. 2014, 15, 1929–1958. [Google Scholar]
- Gueymard, C.A. A review of validation methodologies and statistical performance indicators for modeled solar radiation data: Towards a better bankability of solar projects. Renew. Sustain. Energy Rev. 2014, 39, 1024–1034. [Google Scholar] [CrossRef]
- Mining, E. Python Machine Learning: Understand Python Libraries (Keras, NumPy, Scikit-Lear, TensorFlow) for Implementing Machine Learning Models in Order to Build Intelligent Systems; Amazon Digital Services LLC-KDP Print US: Brentford, UK, 2019; ISBN 9781671257900. [Google Scholar]
- Pedregosa, F.; Varoquaux, G.; Gramfort, A.; Michel, V.; Thirion, B.; Grisel, O.; Blondel, M.; Prettenhofer, P.; Weiss, R.; Dubourg, V.; et al. Scikit-learn: Machine Learning in Python. J. Mach. Learn. Res. 2011, 12, 2825–2830. [Google Scholar]
- Dürr, O.; Sick, B.; Murina, E. Probabilistic Deep Learning: With Python, Keras and Tensorflow Probability; Manning Publications: Shelter Island, NY, USA, 2020; ISBN 9781617296079. [Google Scholar]
- Bisong, E. Google Colaboratory. In Building Machine Learning and Deep Learning Models on Google Cloud Platform; Apress: Berkeley, CA, USA, 2019; pp. 59–64. [Google Scholar]
- JASP Team JASP (Version 0.16) [Computer Software]. Available online: https://jasp-stats.org/ (accessed on 7 January 2022).
- Goss-Sampson, M.A. Statistical Analysis in JASP 0.12: A Guide for Students; University of Greenwich: London, UK, 2020. [Google Scholar]
- Morettin, P.A.; de Bussab, W.O. Estatística Básica, 9th ed.; Saraivauni: São Paulo, Brazil, 2017; ISBN 978-8547220228. [Google Scholar]
- Lehmann, E.L.; Romano, J.P. Testing Statistical Hypotheses, 3rd ed.; Springer: New York, NY, USA, 2005; ISBN 0-387-98864-5. [Google Scholar]
- Bamisile, O.; Oluwasanmi, A.; Ejiyi, C.; Yimen, N.; Obiora, S.; Huang, Q. Comparison of machine learning and deep learning algorithms for hourly global/diffuse solar radiation predictions. Int. J. Energy Res. 2021, 1–22. [Google Scholar] [CrossRef]
- Zhang, J.; Chi, Y.; Xiao, L. Solar Power Generation Forecast Based on LSTM. In Proceedings of the 2018 IEEE 9th International Conference on Software Engineering and Service Science (ICSESS), Beijing, China, 23–25 November 2018; IEEE: Piscataway, NJ, USA, 2018; pp. 1–5. [Google Scholar]
- Pombo, D.V.; Bindner, H.W.; Spataru, S.V.; Sørensen, P.E.; Bacher, P. Increasing the Accuracy of Hourly Multi-Output Solar Power Forecast with Physics-Informed Machine Learning. Sensors 2022, 22, 749. [Google Scholar] [CrossRef] [PubMed]
- Sabri, M.; El Hassouni, M. A Novel Deep Learning Approach for Short Term Photovoltaic Power Forecasting Based on GRU-CNN Model. E3S Web Conf. 2022, 336, 00064. [Google Scholar] [CrossRef]


Publisher’s Note: MDPI stays neutral with regard to jurisdictional claims in published maps and institutional affiliations. |
© 2022 by the authors. Licensee MDPI, Basel, Switzerland. This article is an open access article distributed under the terms and conditions of the Creative Commons Attribution (CC BY) license (https://creativecommons.org/licenses/by/4.0/).