Abstract
Green façades with an active water regime and the water flowing through the substrate itself are not common. This system reduces the temperatures and incorporates the evapotranspiration, which could be more effective than by the regular green façades. The use of a double-skin façade with a ventilated air cavity can reduce the heat load, but the evapotranspiration can reduce it even more with additional benefits. Green façades could also serve as a key element for reducing the surface temperatures of the insulated metal panels (IMP), which are mostly used as a façade system for production facilities or factories. In this paper, a prototype of a double-skin façade, which consisted of vegetation board from recycled materials and IMP, is tested in a climate chamber to evaluate the function and benefits of such a combination. The outdoor skin is made from board, the surface of which is covered by the rooted succulent plants. Measurement results are represented as a direct comparison of single sunny day surface temperatures with and without a double-skin (green) façade. The use of the green façade reduces the indoor surface temperature of IMP by 2.8 °C in this measurement. The use of water circulation through the outdoor skin reduces the temperature of the vegetation board by 28 °C. This could have a great impact on the microclimate around the façade. Because of the controlled environment and ventilation system in a climate chamber, it is not possible to investigate the airflow and solar chimney effect within the ventilated cavity. In addition, it is complicated to show the potential of microclimate change caused by the wet vegetation surface. For the mentioned reasons, the need to carry out “in situ” tests on a model wall under the real conditions was indicated.
Keywords:
vegetation; air cavity; overheating; experimental; recycling; irrigation; evapotranspiration 1. Introduction
The greenery systems consisting of mainly green roofs and façades have long been researched. Their main focus is to mitigate the climate change, reduce the urban heat island, and to influence the microclimate around the building. Green roof research is nowadays a priority topic in many areas, from heat–air moisture simulations [1] and energy balance [2] to complex simulation of street canyons [3]. The great state of the art is in reviews [4,5]. It could be stated that the roofing area is well covered by the research teams and benefits are quantified in most countries, because it depends on the location [6]. In Slovakia, these are nowadays known to research [7,8]. In the area of façades, the situation is not so clear.
Green façades are another step in the evolution of building envelopes. Development in the world is summarized in [4,9,10]. Basic differences among used types are described in [11] and are as follows:
- -
- Green façade, where plants are rooted on the ground in soil and climb on a façade (supporting structure with fence) and form living wall;
- -
- Living wall, pre-vegetated sheets that are attached to a structural wall or frame [12].
Other authors used the terms direct green façade and double-skin façade [12]. Benefits of façade greenery systems are divided into the following parts: environmental, economic, and social [13]. The biggest benefit of the green façades in contrast to the roofs could be that walls usually cover a bigger area than roofs (depending on the façade type and amount of windows). Buildings with a full-scale green façade exist worldwide. In addition, measurements are made on these full-scale buildings [14,15] or with smaller models [16].
Despite the ventilated air cavity between the vegetation and wall, the system reduces the thermal loss in winter [14].
One of the problems with double-skin façades is that they mostly consist of some raster with flower pots or planting boxes and vegetation hanging down from there or rising up on some type of fence. Another problem is watering or irrigation [17,18,19]. Simulated and measured results of living wall from Vienna showed and summarized possible benefits in a Central European climate [14]. Another approach of climate mitigation could be wetting the surfaces or adding plants within the urban areas [3,20].
Green façades with an active water regime, similar to the water wall but with the water flowing through the substrate itself, are not common. Reducing the temperatures and incorporating the evapotranspiration could be more effective than by the regular green façades. Green façades could also serve as a key element for reducing the surface temperatures of the insulated metal panels (IMP) of production facilities or factories. These lightweight building envelopes have low U-values and are energy-efficient in winter, but, in summer, often require HVAC systems. The use of a double-skin façade with a ventilated air cavity can reduce the heat load, but the evapotranspiration can reduce it even more, with additional benefits of adiabatic cooling.
Similar to the green roofs, part of the research is now focused to the combination of green roofs with photovoltaic (PV) or the solar thermal collectors (STC). The efficiency of PV systems is influenced by their temperature; therefore, the cooling potential of the roof is used. In the area of façades, there are several attempts, such as STC with air instead of liquid medium [21], for a combined system of PV and STC [22]. Within the area of building-integrated PV (BiPV), there are implementations of phase change materials (PCM) to cool down the PV panel temperatures to achieve higher efficiency and to preheat the ventilation air [23]. A similar application of PCM is also carried out with STC to make façade-integrated STC work [24]. The state of the art in this area is, e.g., [25].
This paper describes the measurement of such a double-skin façade prototype that is developed with IMP and special vegetation board (VB). This prototype is tested in a climate chamber to evaluate the potential of such a combination. This potential can be defined by the influence on the temperatures, humidity, airflow, ability to keep the lower temperatures regarding the watering, and some complex overview. The outdoor skin is made from board whose surface is covered by the rooted succulent plants, creating the full cover in front of a load-carrying façade. This VB is unique because it is not known to the authors that there is somewhere that such a solution is used. The solution with these VBs can be used on the full façade, e.g., the factories only with skylights or on regular buildings with a different façade/windows ratio. Methods and test setup in the climate chamber are explained in Section 2. The results and discussion are presented in Section 3. Section 4 highlights the pros and cons of the measurement based on conclusions and future objectives.
2. Test Setup and Methods
The measurement was conducted in the climate chamber Weiss WK 7,2′/30–80 (outdoor) and WK 6,6′/10–50 (indoor). The measurement was taken using the sun simulation system (SS) G-WUT 1523, which is part of the chamber (usable irradiance 500–1000 W/m2) in the outdoor chamber and the hotbox in the indoor. It was not inserted for its regular use, but to show how the air in the hotbox was heated up by the warmed surface of the IMP.
The lamps used in the SS were OSRAM HQI 2000W D/S and spectral power distribution can be found in the datasheet [26], but it is not as important in this case.
2.1. Façade Sample
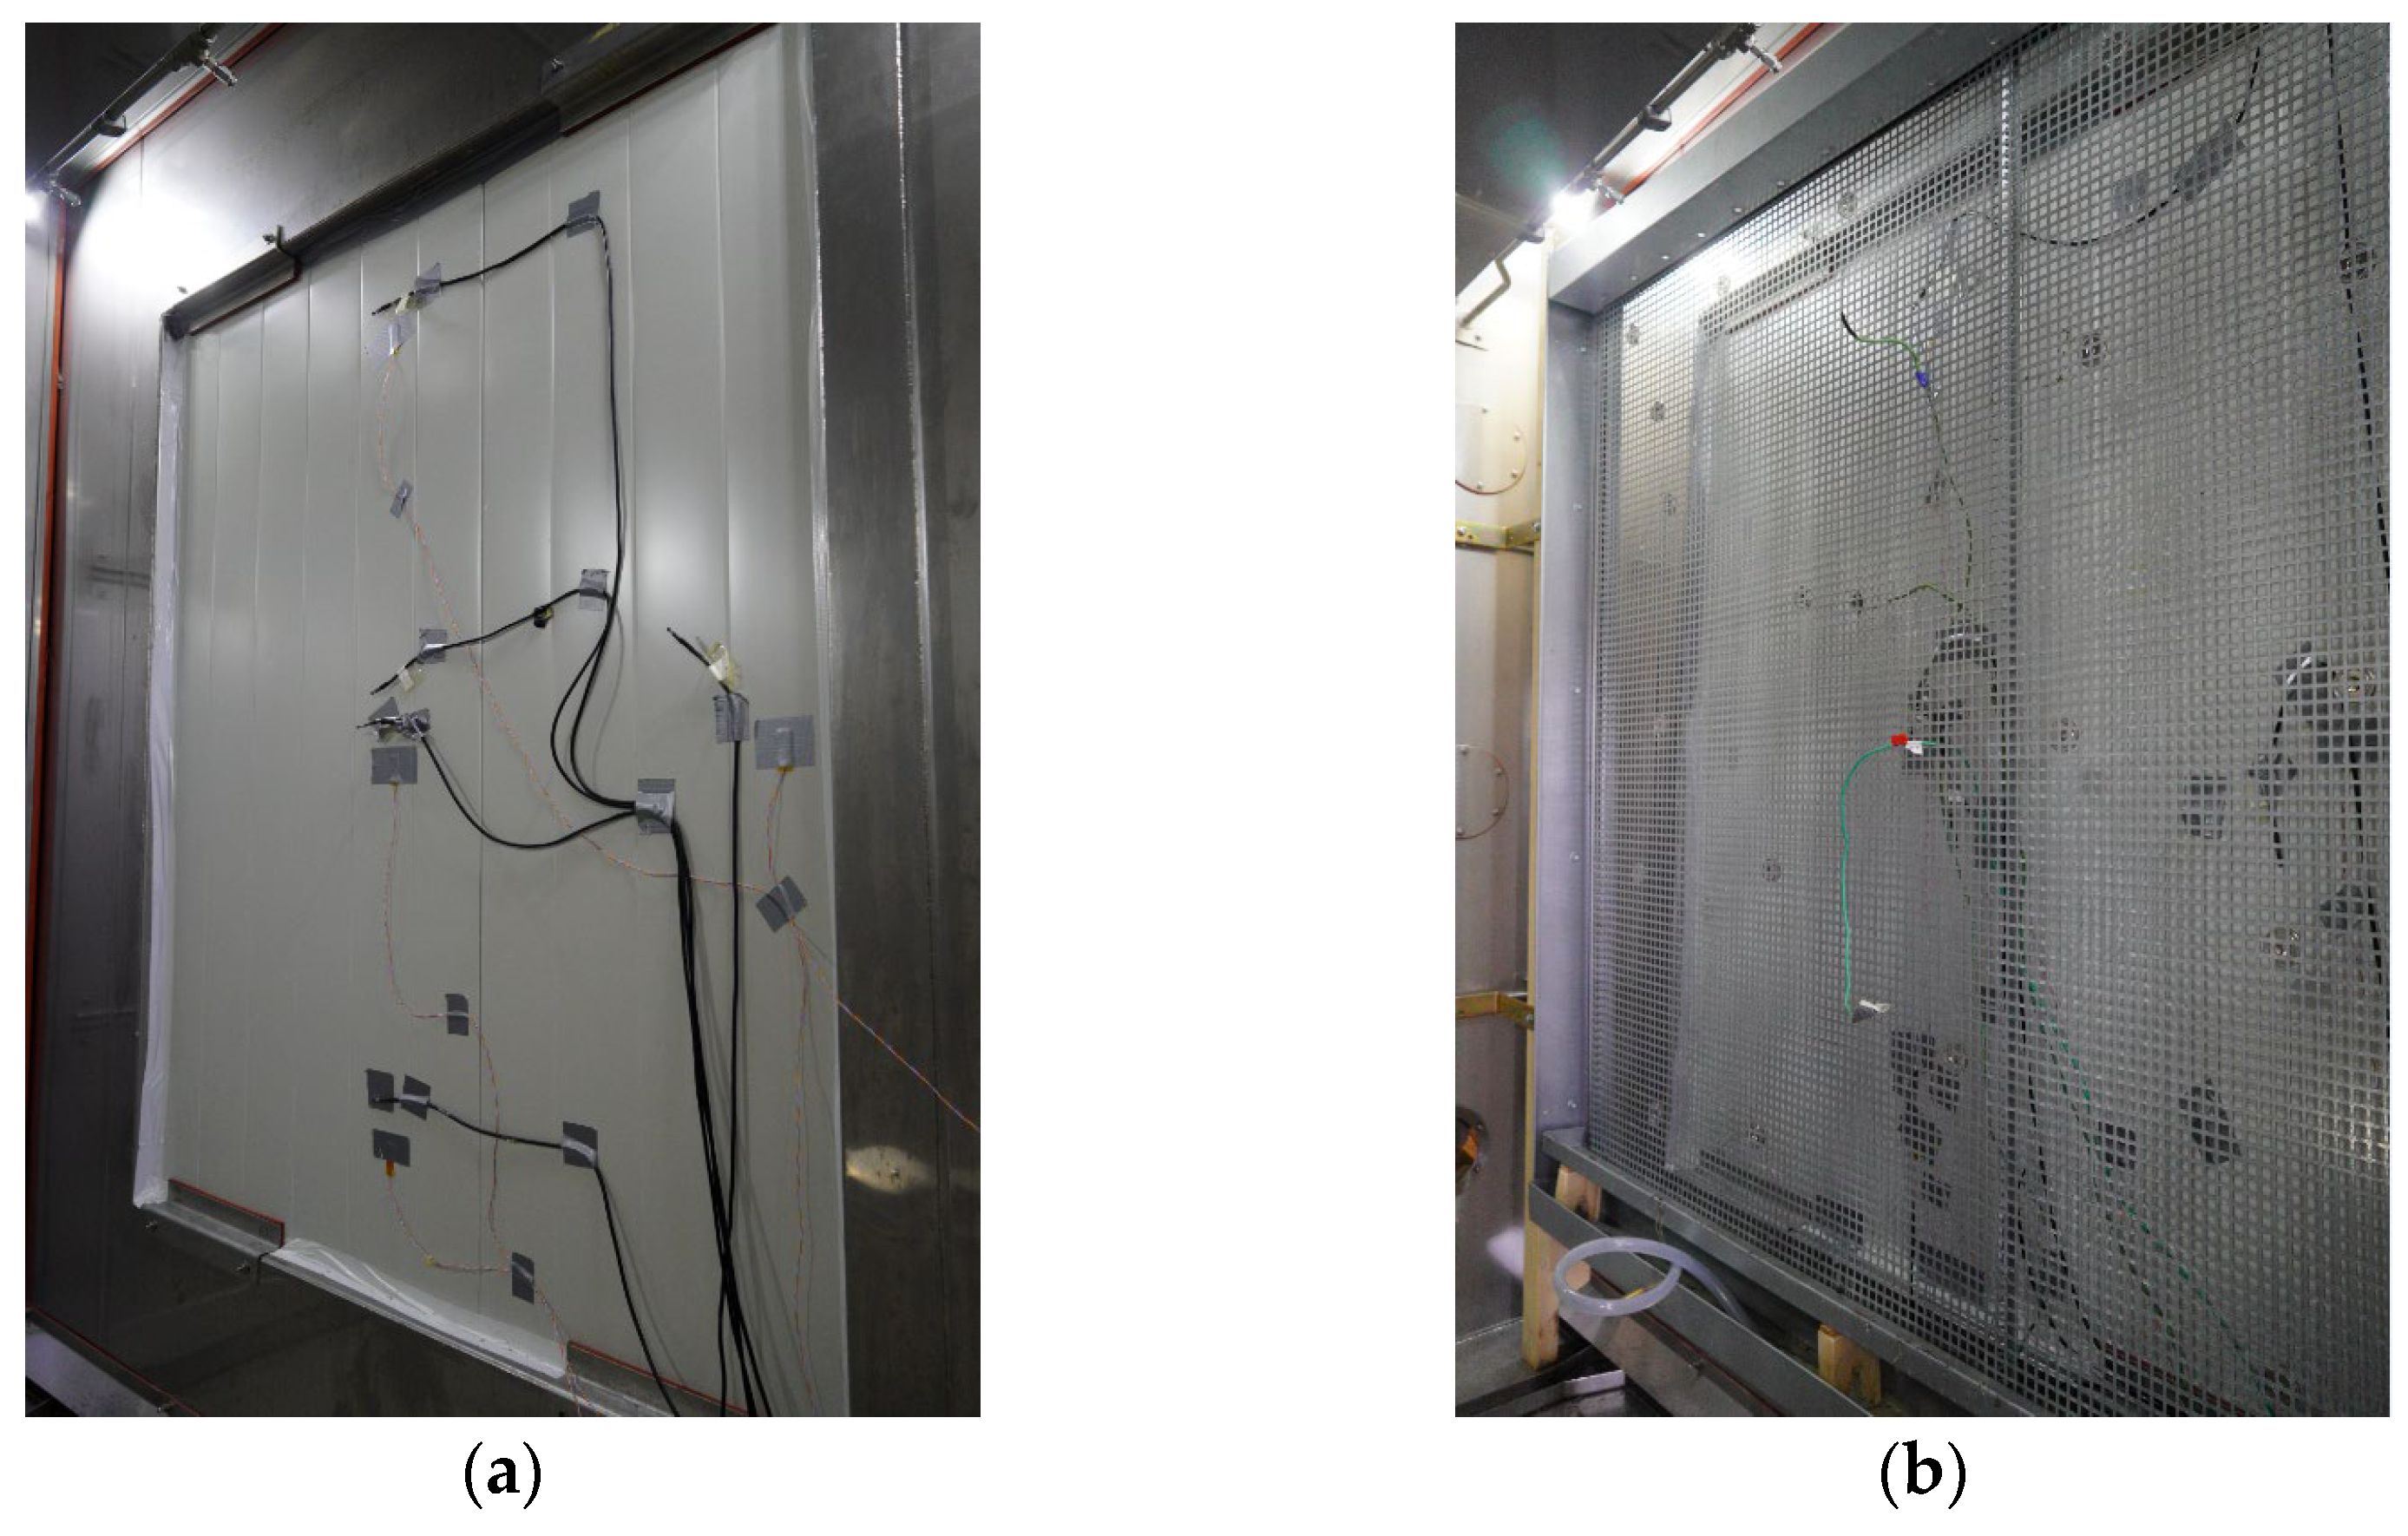
In the opening of a masking panel (dimensions of the aperture: 1.25 × 1.45 m), an insulated metal panel (IMP) Brucha Paneel PIR WP100 (Figure 1) was used with a thickness of 100 mm, declared U-value = 0.199 W/(m2·K). It consists of bright-colored metal and insulation is from polyisocyanurate (PIR). The outdoor skin of the façade (which totally covered the IMP—clear dimensions: 1.5 × 1.5 m) was created by the vegetation boards (Figure 2 and Figure 3). Regular dimensions of the VB are 1.2 × 0.6 m. Technology and exact composition of the VB has not been published yet, but it consists of recycled materials. The method and machine for producing it is patented [27]. Its unique ability consists in the extensive plants, such as Sedum succulents, growing and rooting directly on the surface of the VB (Figure 2). The thickness of the VB used in this setup was 50 mm; the ventilated air gap was also 50 mm. At the bottom of the skin, there was a container for water retention placed to pump the water into the gutter at the top, from which water flows due to the gravitational force within the board and sometimes on the surfaces (Figure 3). The capacity of the retention container was approximately 40 L; the pump flow was about 5 L/min.
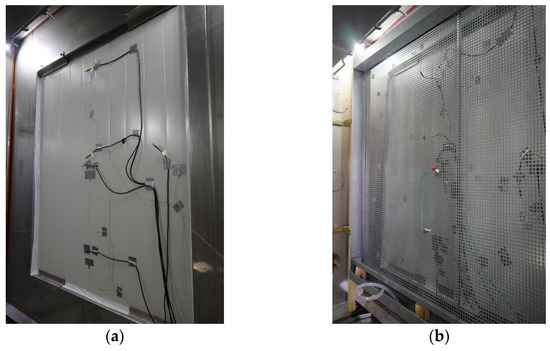
Figure 1.
View of the insulated metal panel with the sensor on the exterior surface (a) and supporting structure for the outside skin with the top and bottom water gutter (b). The top gutter has holes for drainage of water into the vegetation boards.

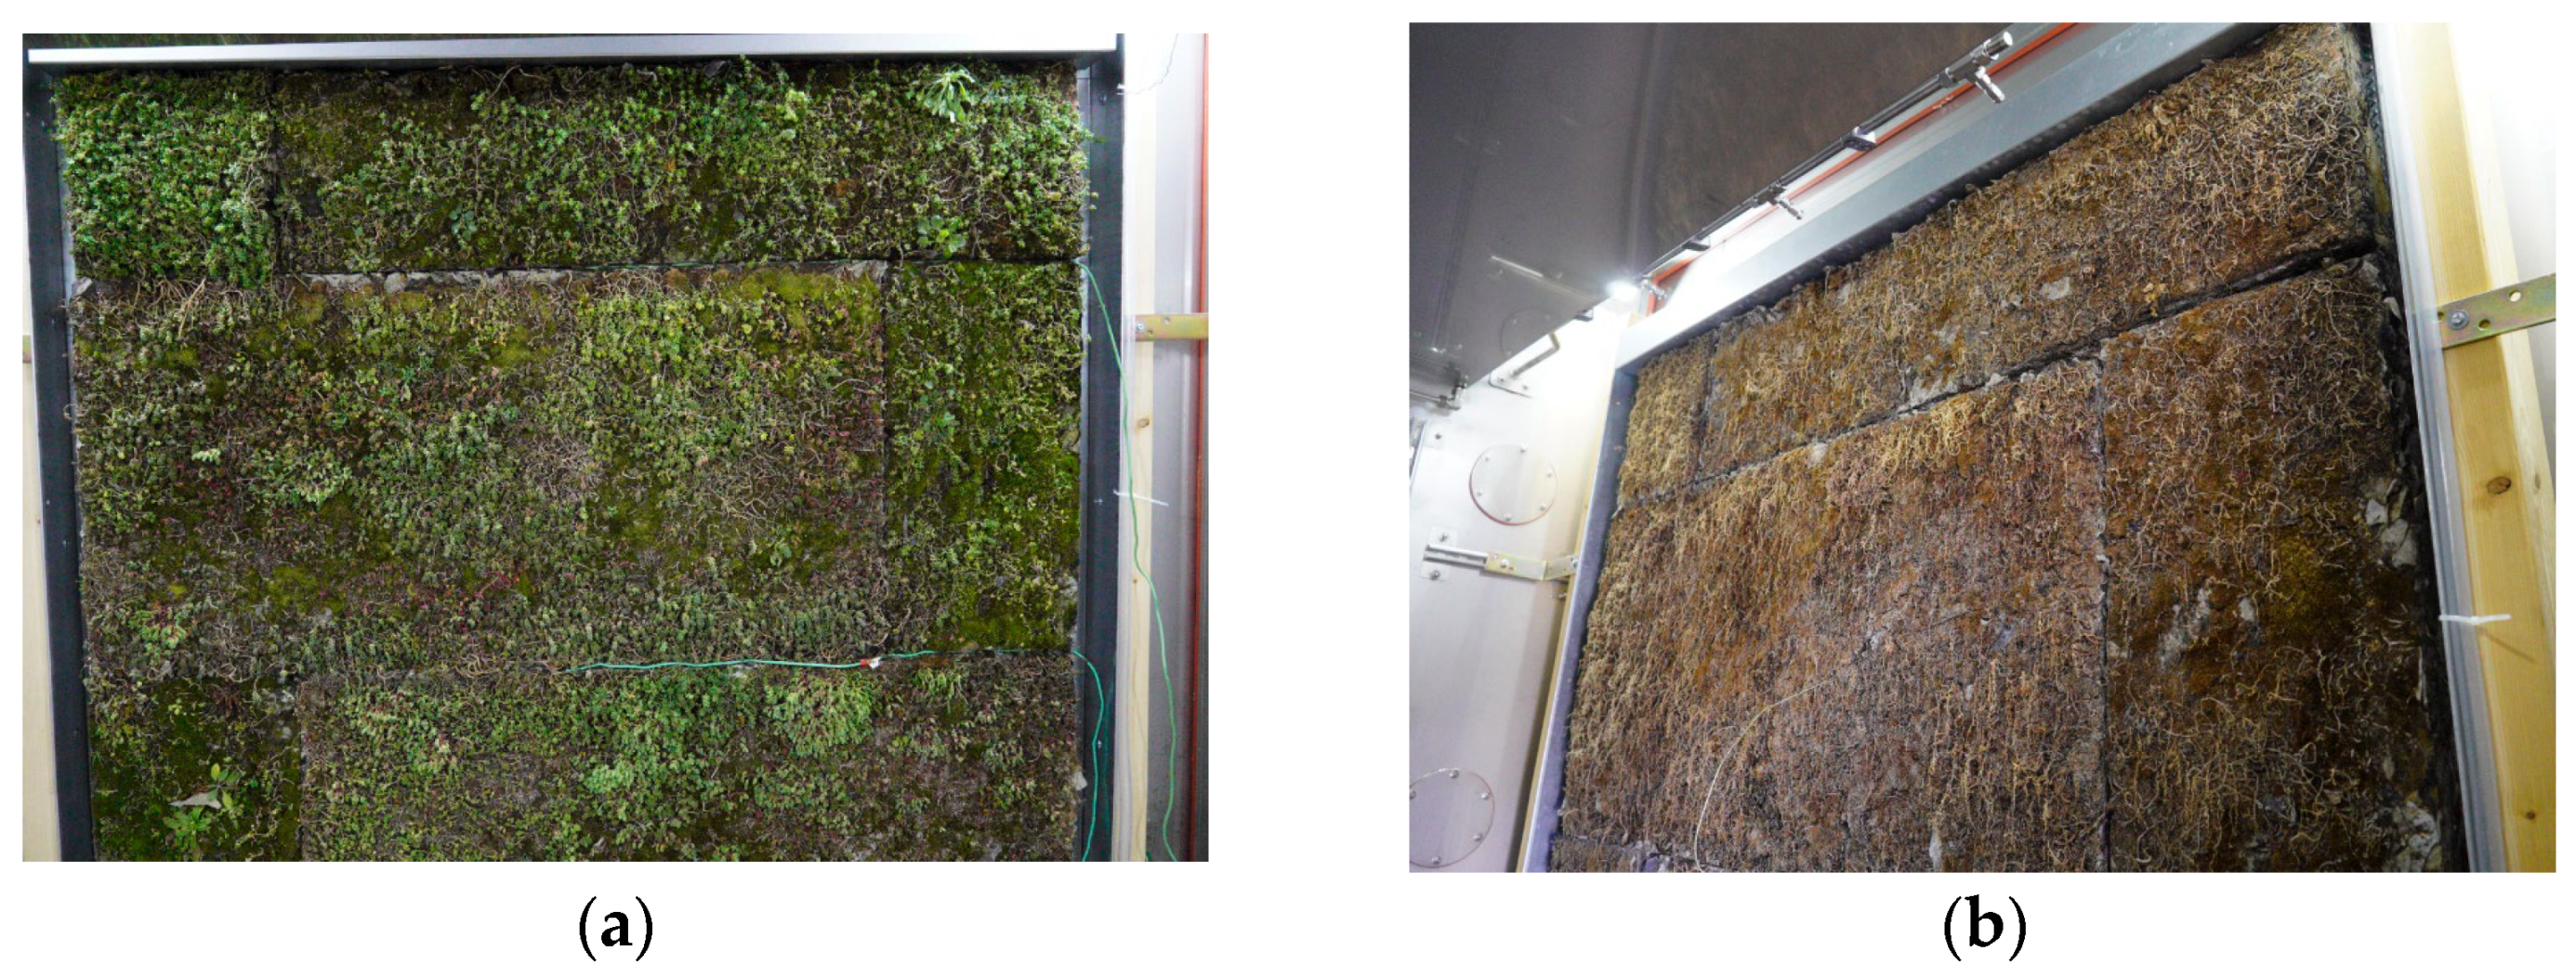
Figure 2.
View of the outer skin before (a) and after the measurement (b). Despite heavy watering at the end, the vegetation was very dry, which was caused by the simulated solar radiation (simulated steady-state test, which is not presented in this paper) and water pump failure.

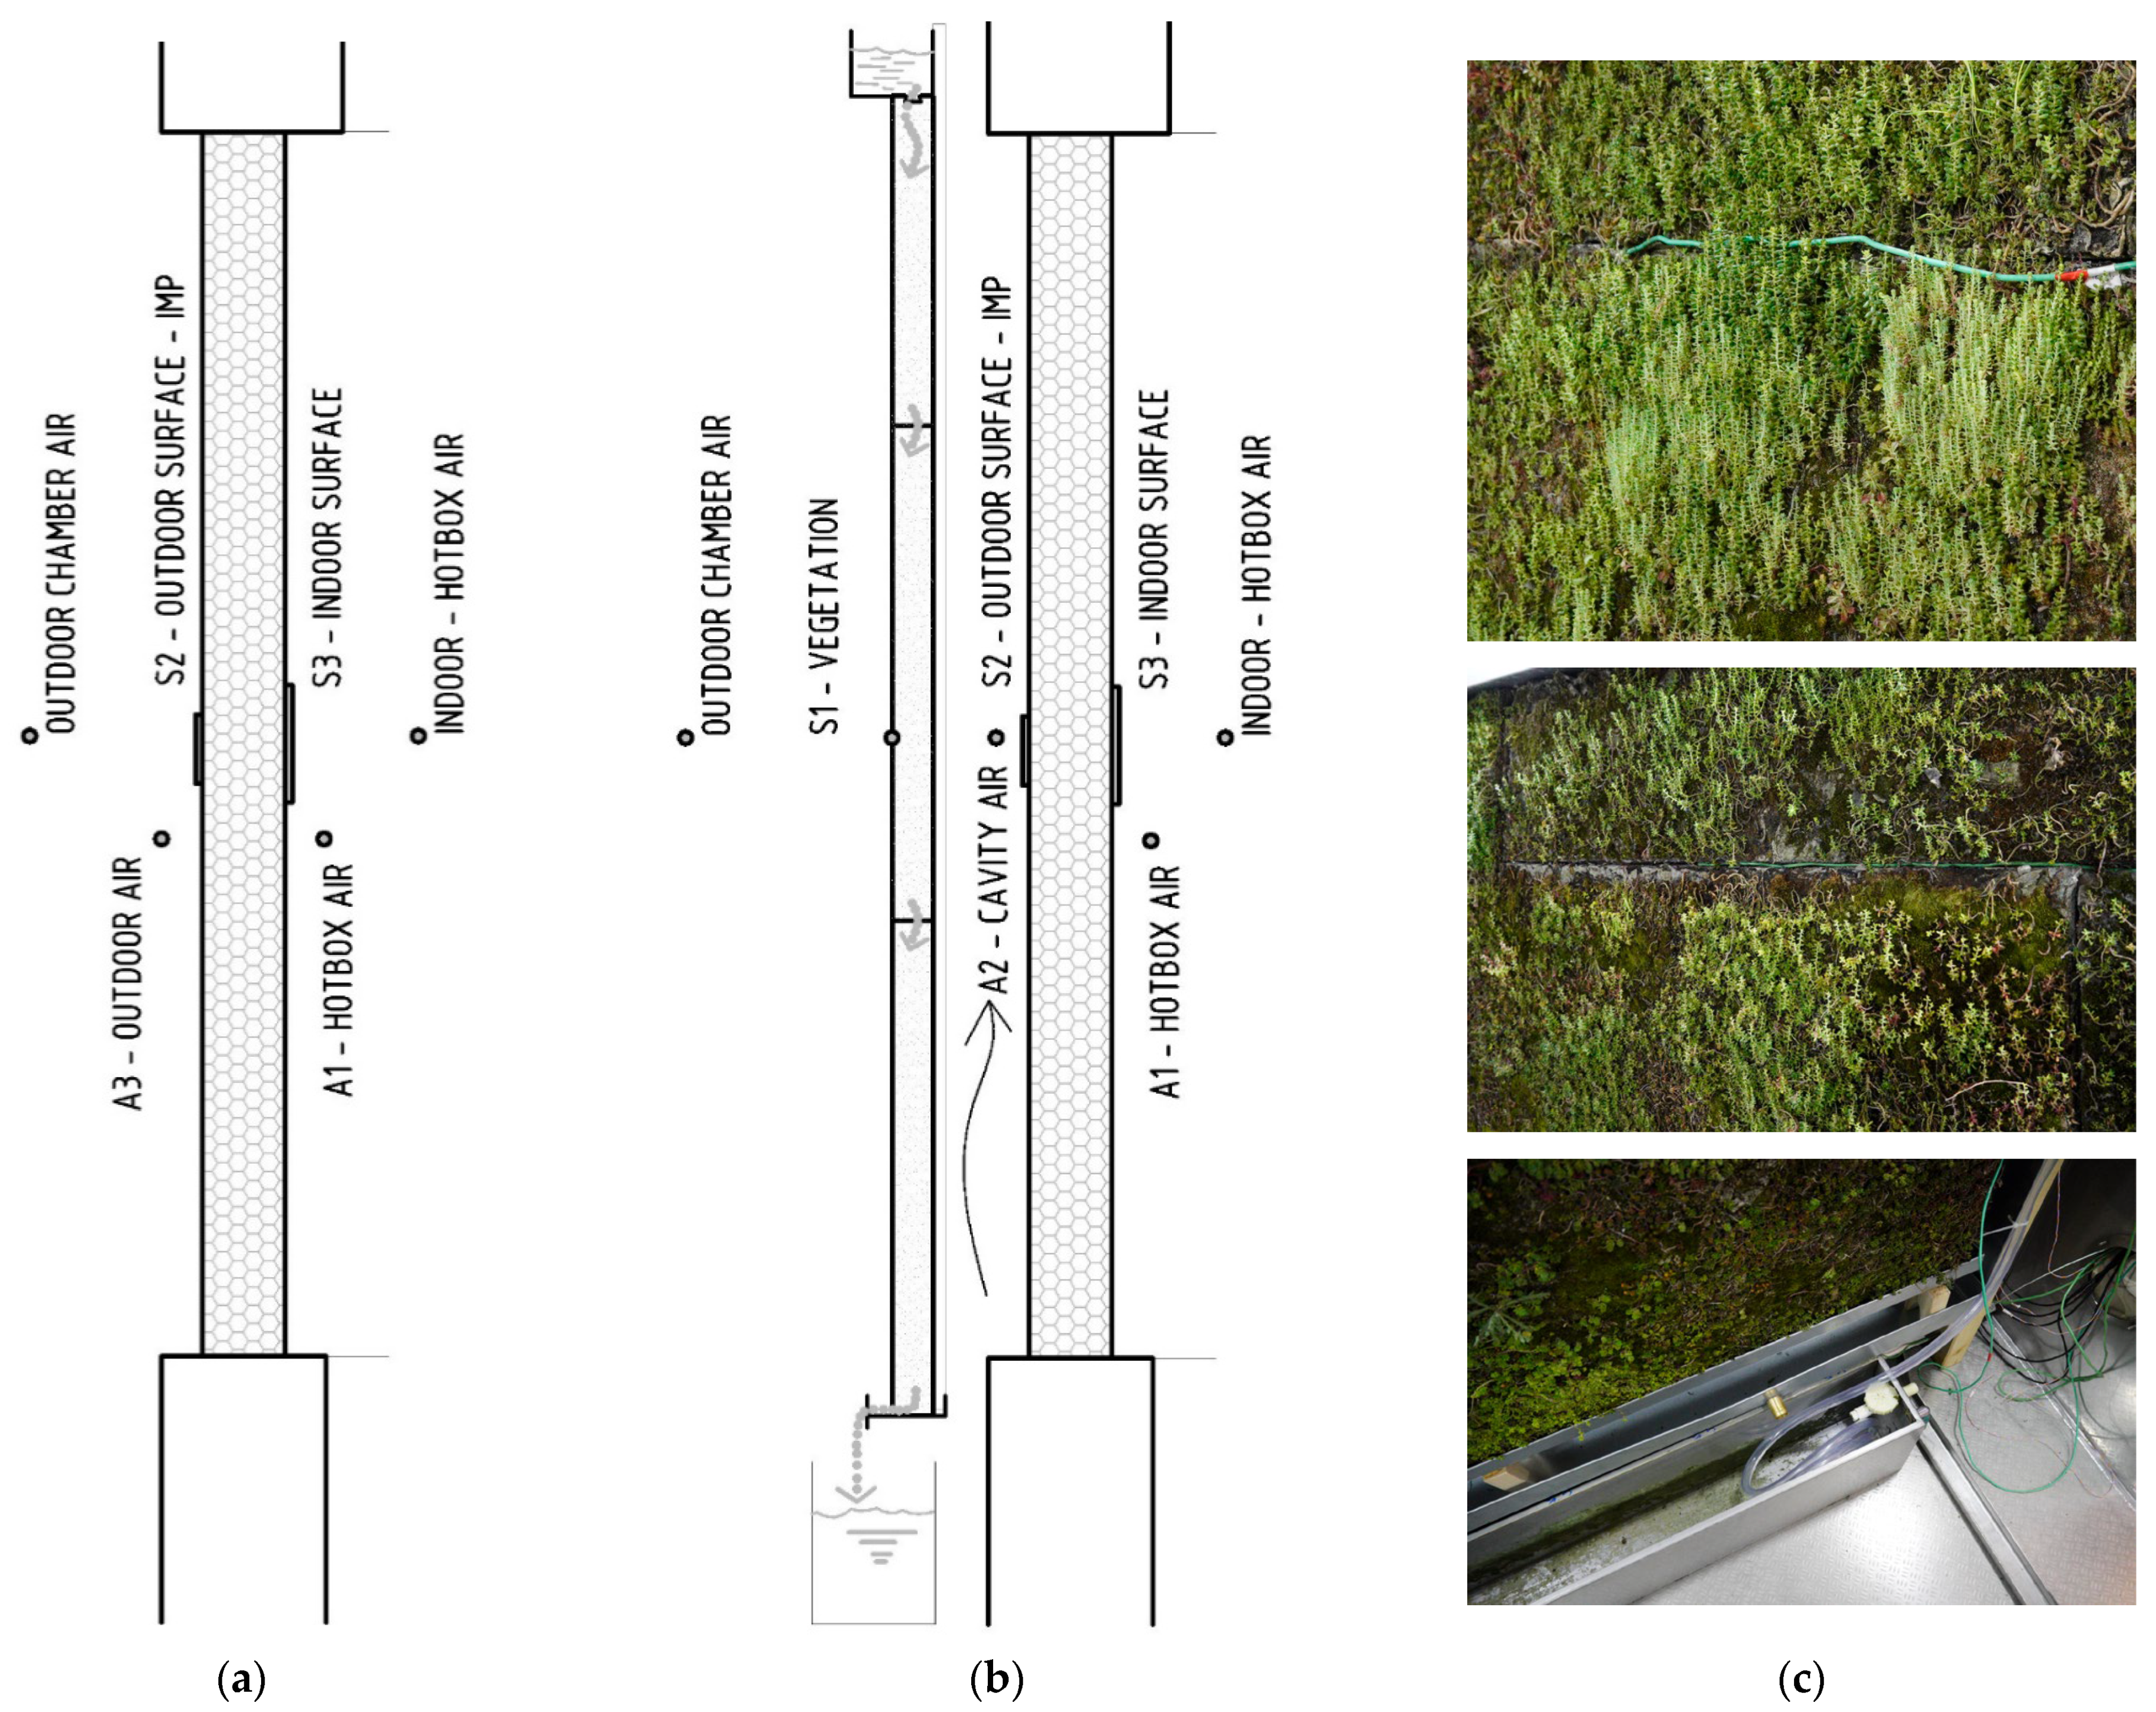
Figure 3.
Scheme of the tested façade sample: (a) IMP-only setup, (b) VB setup, and (c) vegetation adopted to the upward orientation after vertical placement of the board, visible thermocouple cable for S1 position, bottom drainage gutter, and water tank.
Several types of sensors were used for measuring: for the temperatures, PT100 sensors were used for surface application, digital combined temperature and relative humidity sensors for the measurement near the surface (30 mm or in the middle of the air cavity), and a heat flux plate from the indoor side of the panel. The temperature of the vegetation board surface was measured with a thermocouple placed just under the plants. All sensors and the datalogger used are from Ahlborn. The recording interval was one minute. The position scheme of individual sensors is shown in Figure 3 with additional pictures.
2.2. Boundary Conditions
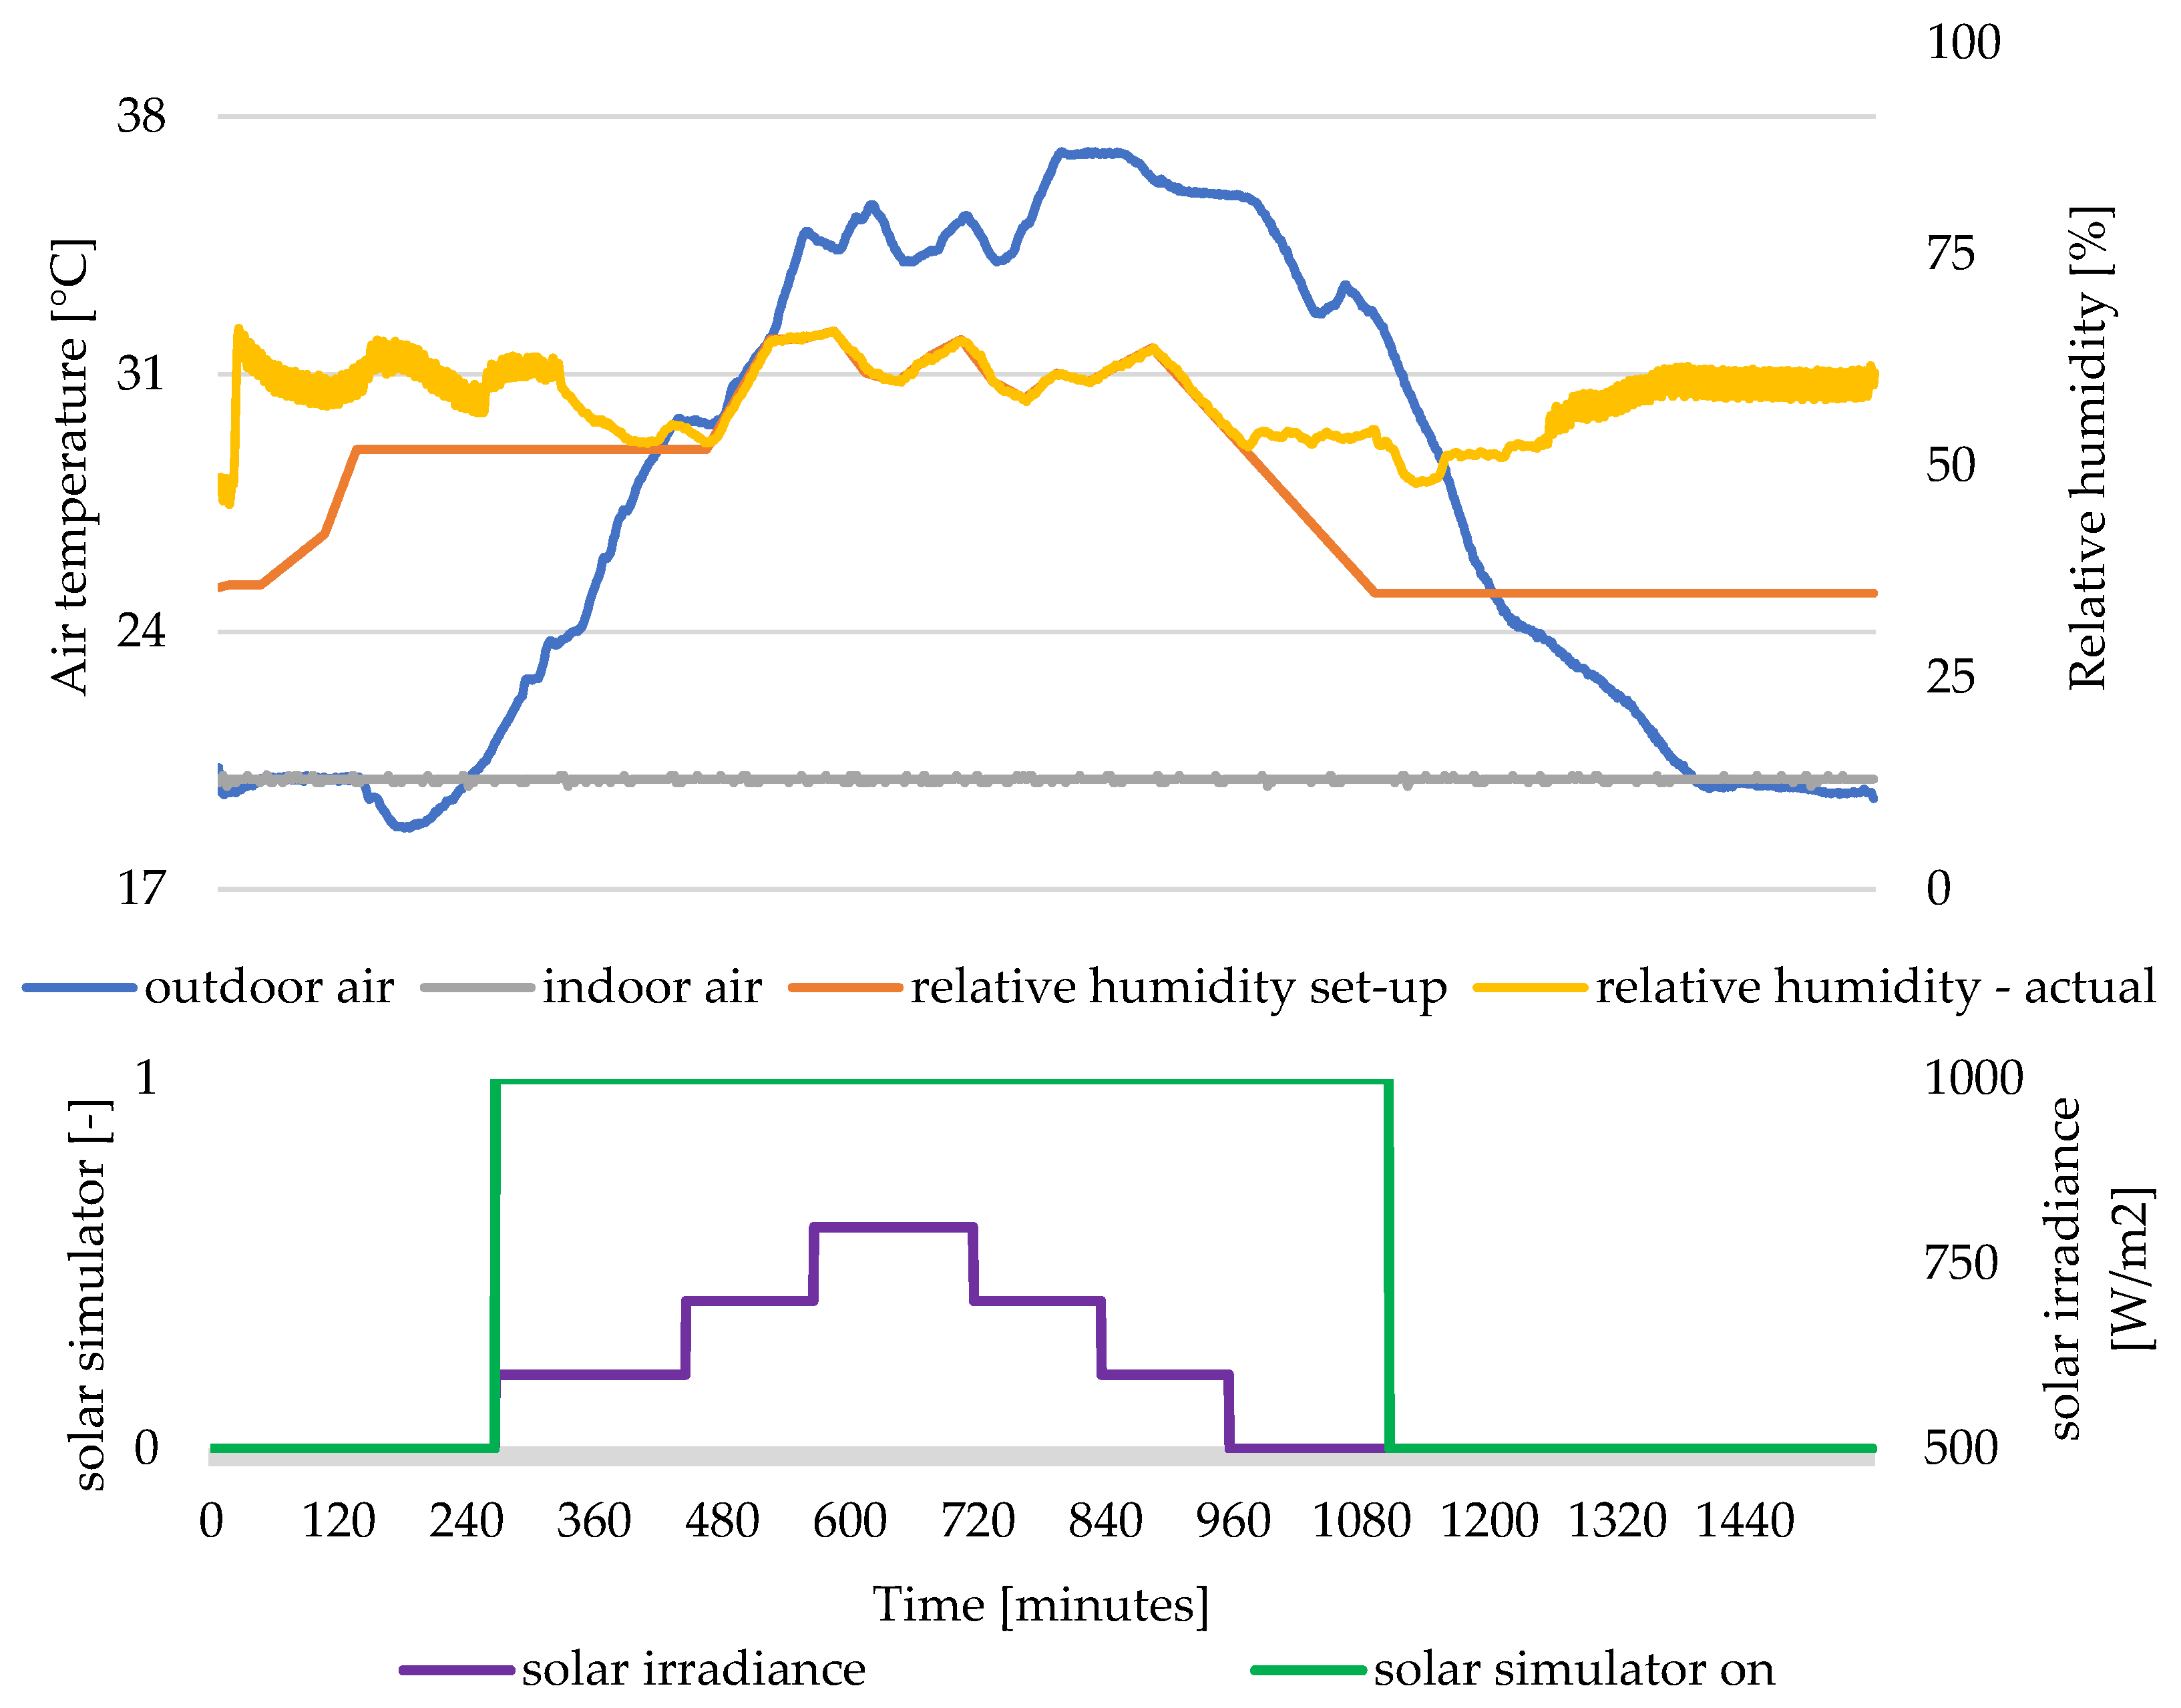
The simulated day was based on the real measured values by the department’s weather station on the site used for other experimental measurements [28]. A sunny summer day was chosen, with the night temperature close to 20 °C to avoid the possibility of night cooling and a daily maximum near 37 °C. In the indoor chamber, 20 °C was set up and uncontrolled temperature in the hotbox to observe the increase in temperature by the convection from the surface. Relative air humidity in the outdoor chamber is also based on the measured outdoor climate. During the simulated cycle without the VB, it was maintained by the chamber well, but, with the addition of the VB and use of watering the HVAC system of the chamber, it was unable to reach the setup values (Figure 4). The simulated cycle has the length of 27 h. The cycle consists of one day (24 h) and a 3-h period for better stabilization at the end of the measurement (constant temperature 19.5 °C for 210 min) and to have similar starting temperatures because of several measurement cycles. The SS was on for 14 h with different irradiance regarding the usual day (Figure 4). The possibility of using different intensities is very limited because even the lowest value is too high in the beginning. The incidence angle between the simulator and the surface was not taken into account. It can be considered as the worst scenario with such high irradiance. A graphical representation of the boundary conditions is shown in Figure 4.
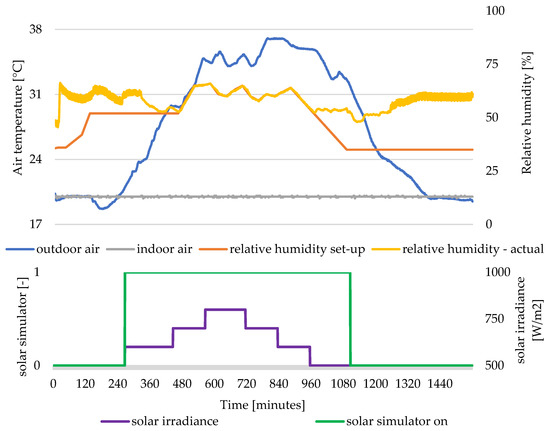
Figure 4.
Boundary conditions for measurement in the climate chamber: air temperatures, outdoor humidity (setup and actual with watering of VB), and the irradiance. Outdoor air temperature from 18.6 up to 36.9 °C. Solar simulator on between minutes 270 and 1110.
2.3. Measured Regimes Based on Watering
Three different regimes were measured:
- -
- Without the water with dry VB;
- -
- One watering with the whole container volume during the measurement (after 700 min from start);
- -
- Hourly (every 60 min) watering.
The water was added regularly into the container. The evaporation and evapotranspiration caused the container volume to last hardly for two simulated cycles (days) by the hourly watering.
The volume of water for one-time watering was the volume of about 35 L (full tank). Cyclic watering with a step of one hour had a changeable volume. It also started with a full tank but, later, it was reduced because part of the water remained within the board/vegetation and some also evaporated. The water discharge function of the board was reduced, with the rest of the water within the board, and it was influenced by the water content and the gravity. The water pump works for 5 min and sucks all available water from tank. After the simulated period, the tank was filled again.
The methodology of the experiment was to measure firstly only the façade consisting of IMP without the outer vegetation skin. Later, the additional skin was added and several repeated cycles with different watering regimes were simulated. To obtain the results with a dry board, the first measurements do not consider watering (handling with the boards is better when they are dry or almost dry).
3. Results and Discussion
Results from measurements in the climate chamber are presented in the following figures. Figure 5 shows measurements of the façade without a vegetation board, i.e., of IMP itself. Figure 6 presents the double-skin setup with the vegetation board and ventilated air gap without watering of the VB. Figure 7 shows the courses for the same setup with one-time watering; hourly watering is shown in Figure 8. The difference in vegetation board surface and comparison to the surface temperature of IMP in the case without a cover of VB is shown in Figure 9. The measured temperatures for selected times and their distribution within the façade are shown in Figure 10. Lastly, only temperature courses on the indoor surface, which are crucial, are shown in Figure 11. Measured temperatures and min/max values are summarized in Table 1. The results of temperature courses for selected sensors are supplemented with heat flow measured on the inside surface of IMP. Comparison of these heat fluxes on the indoor surface of the IMP for the setup with and without VB is shown in Figure 12.

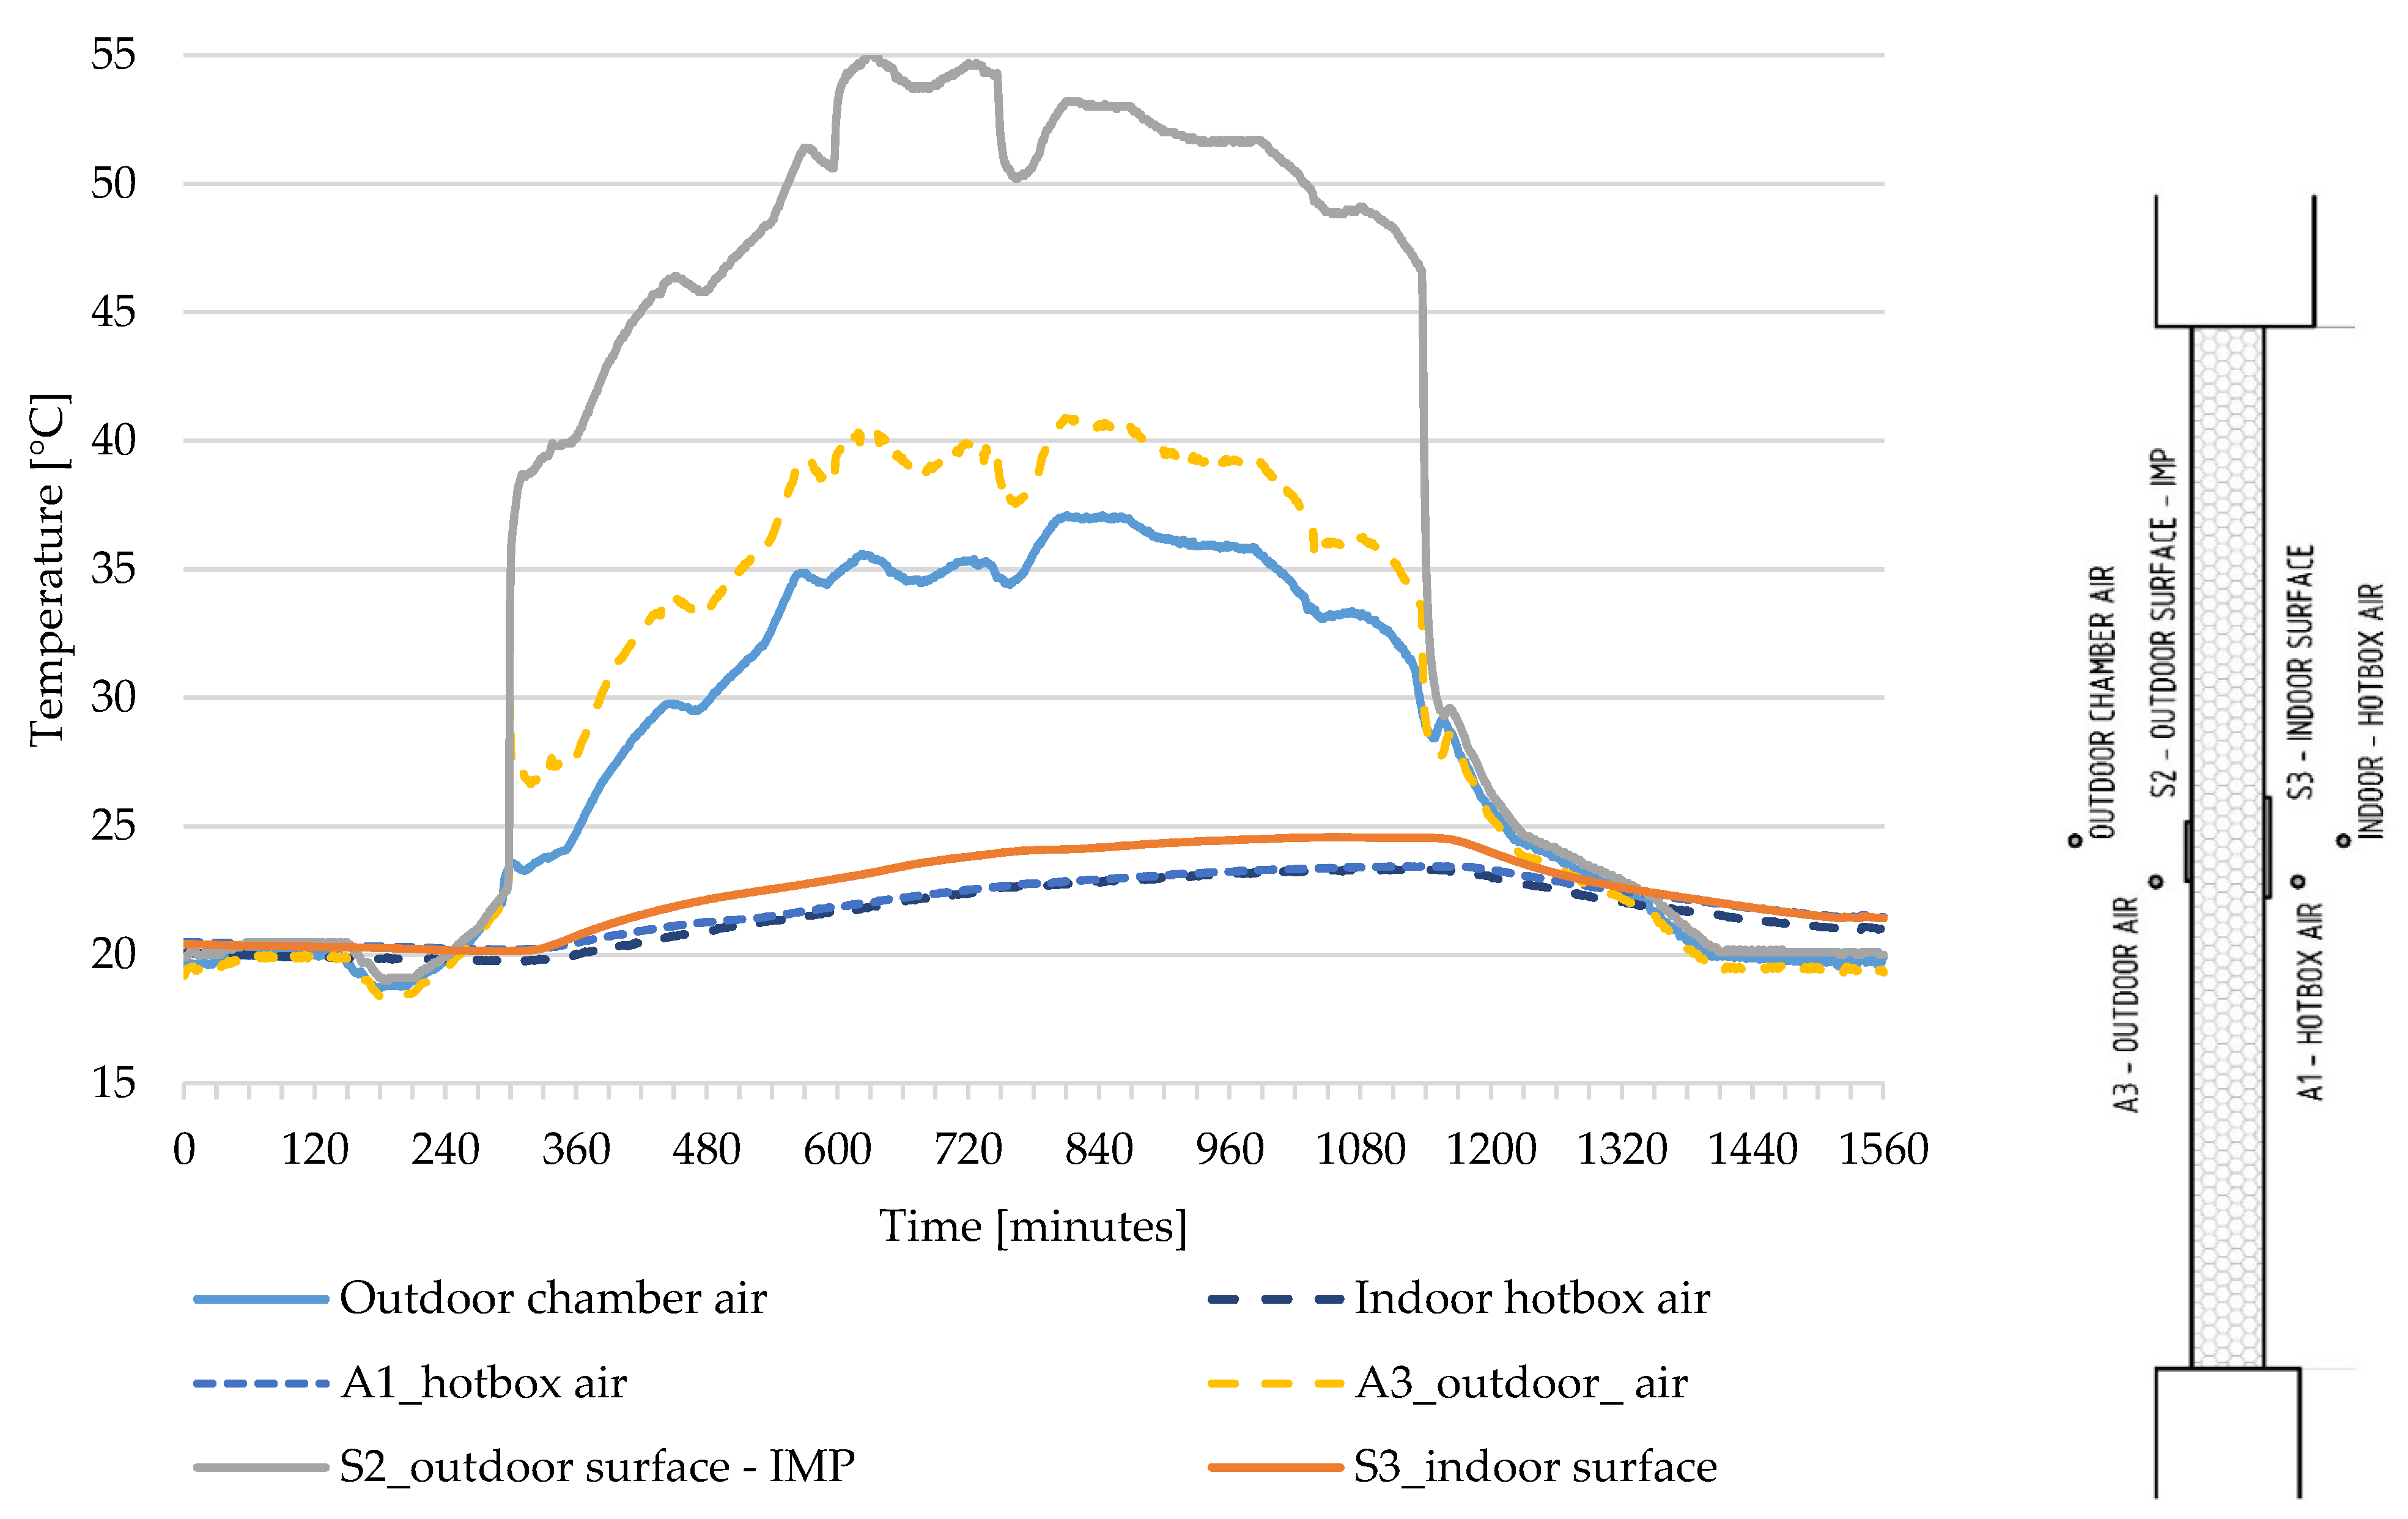
Figure 5.
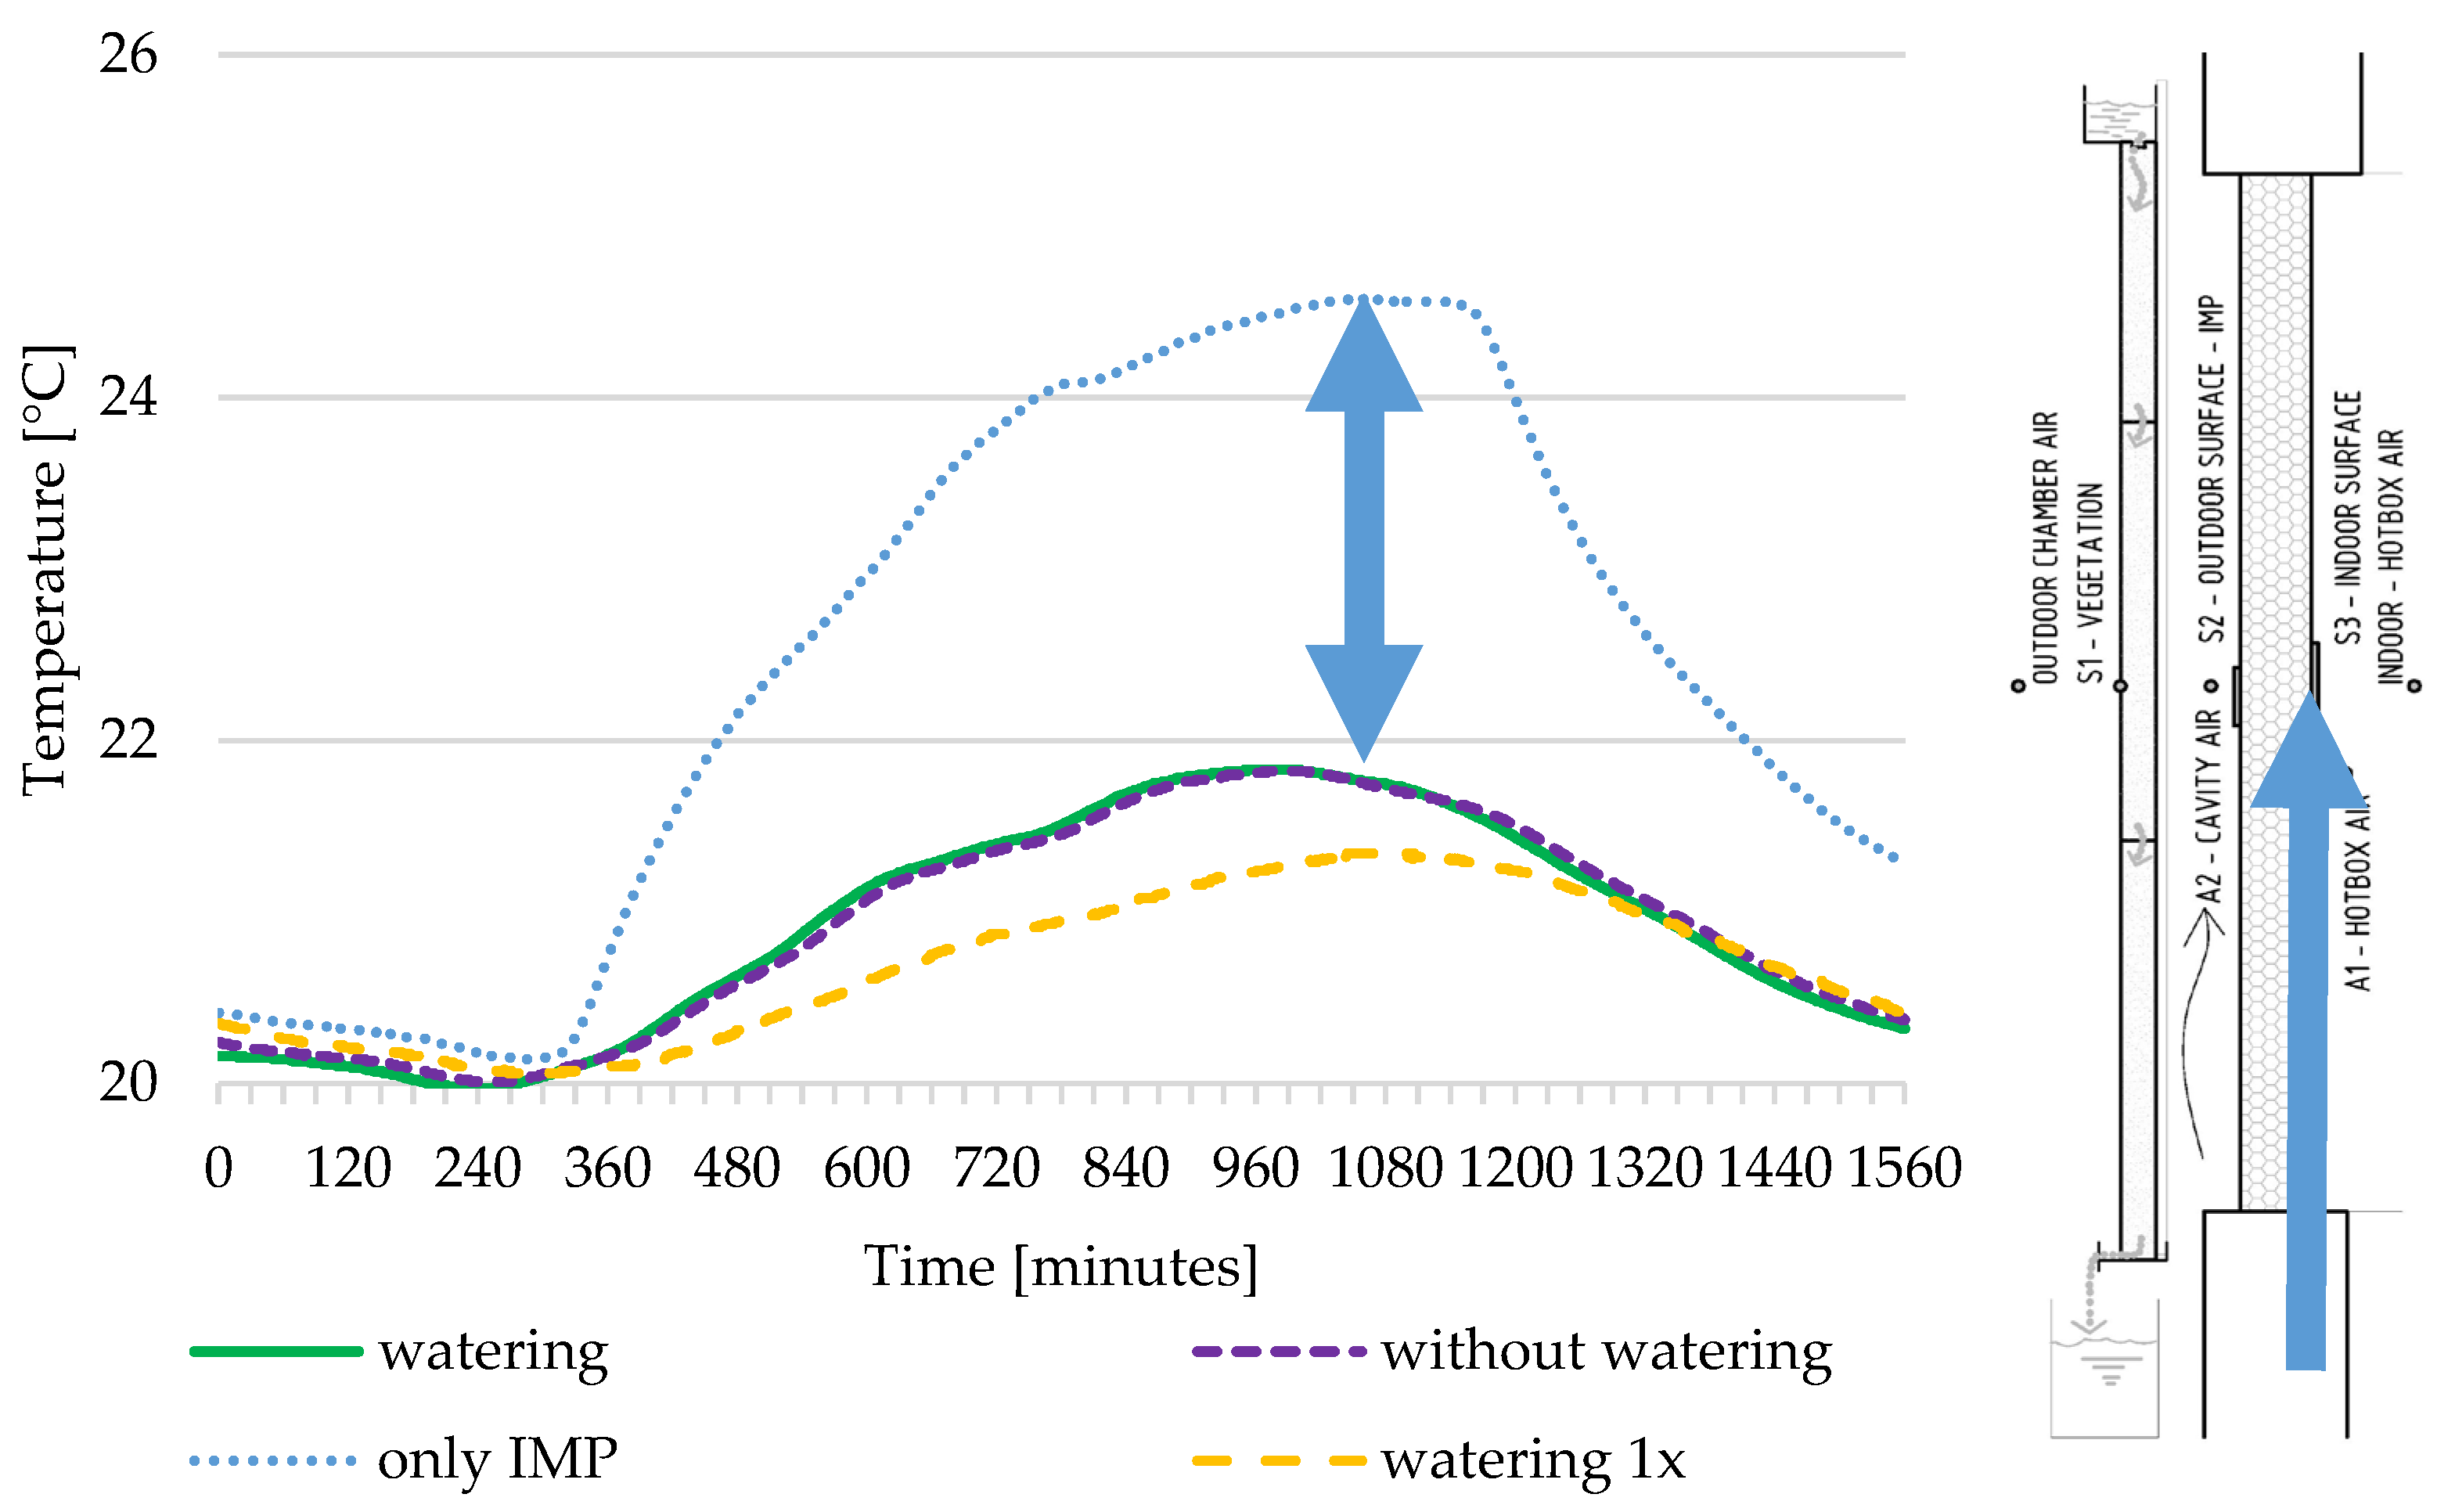
The temperature course for the setup without the vegetation board. Increase in S3 indoor surface temperature from 20.1 to 24.6 °C (temperature difference Δθsi = 4.5 K).
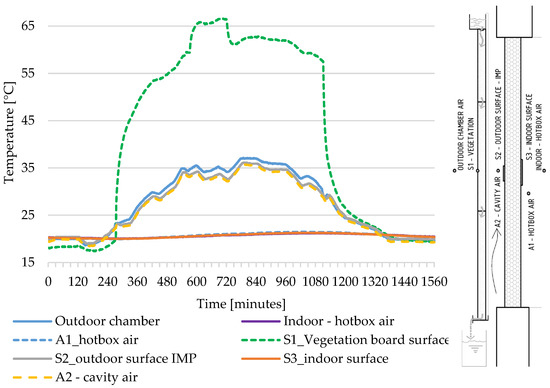
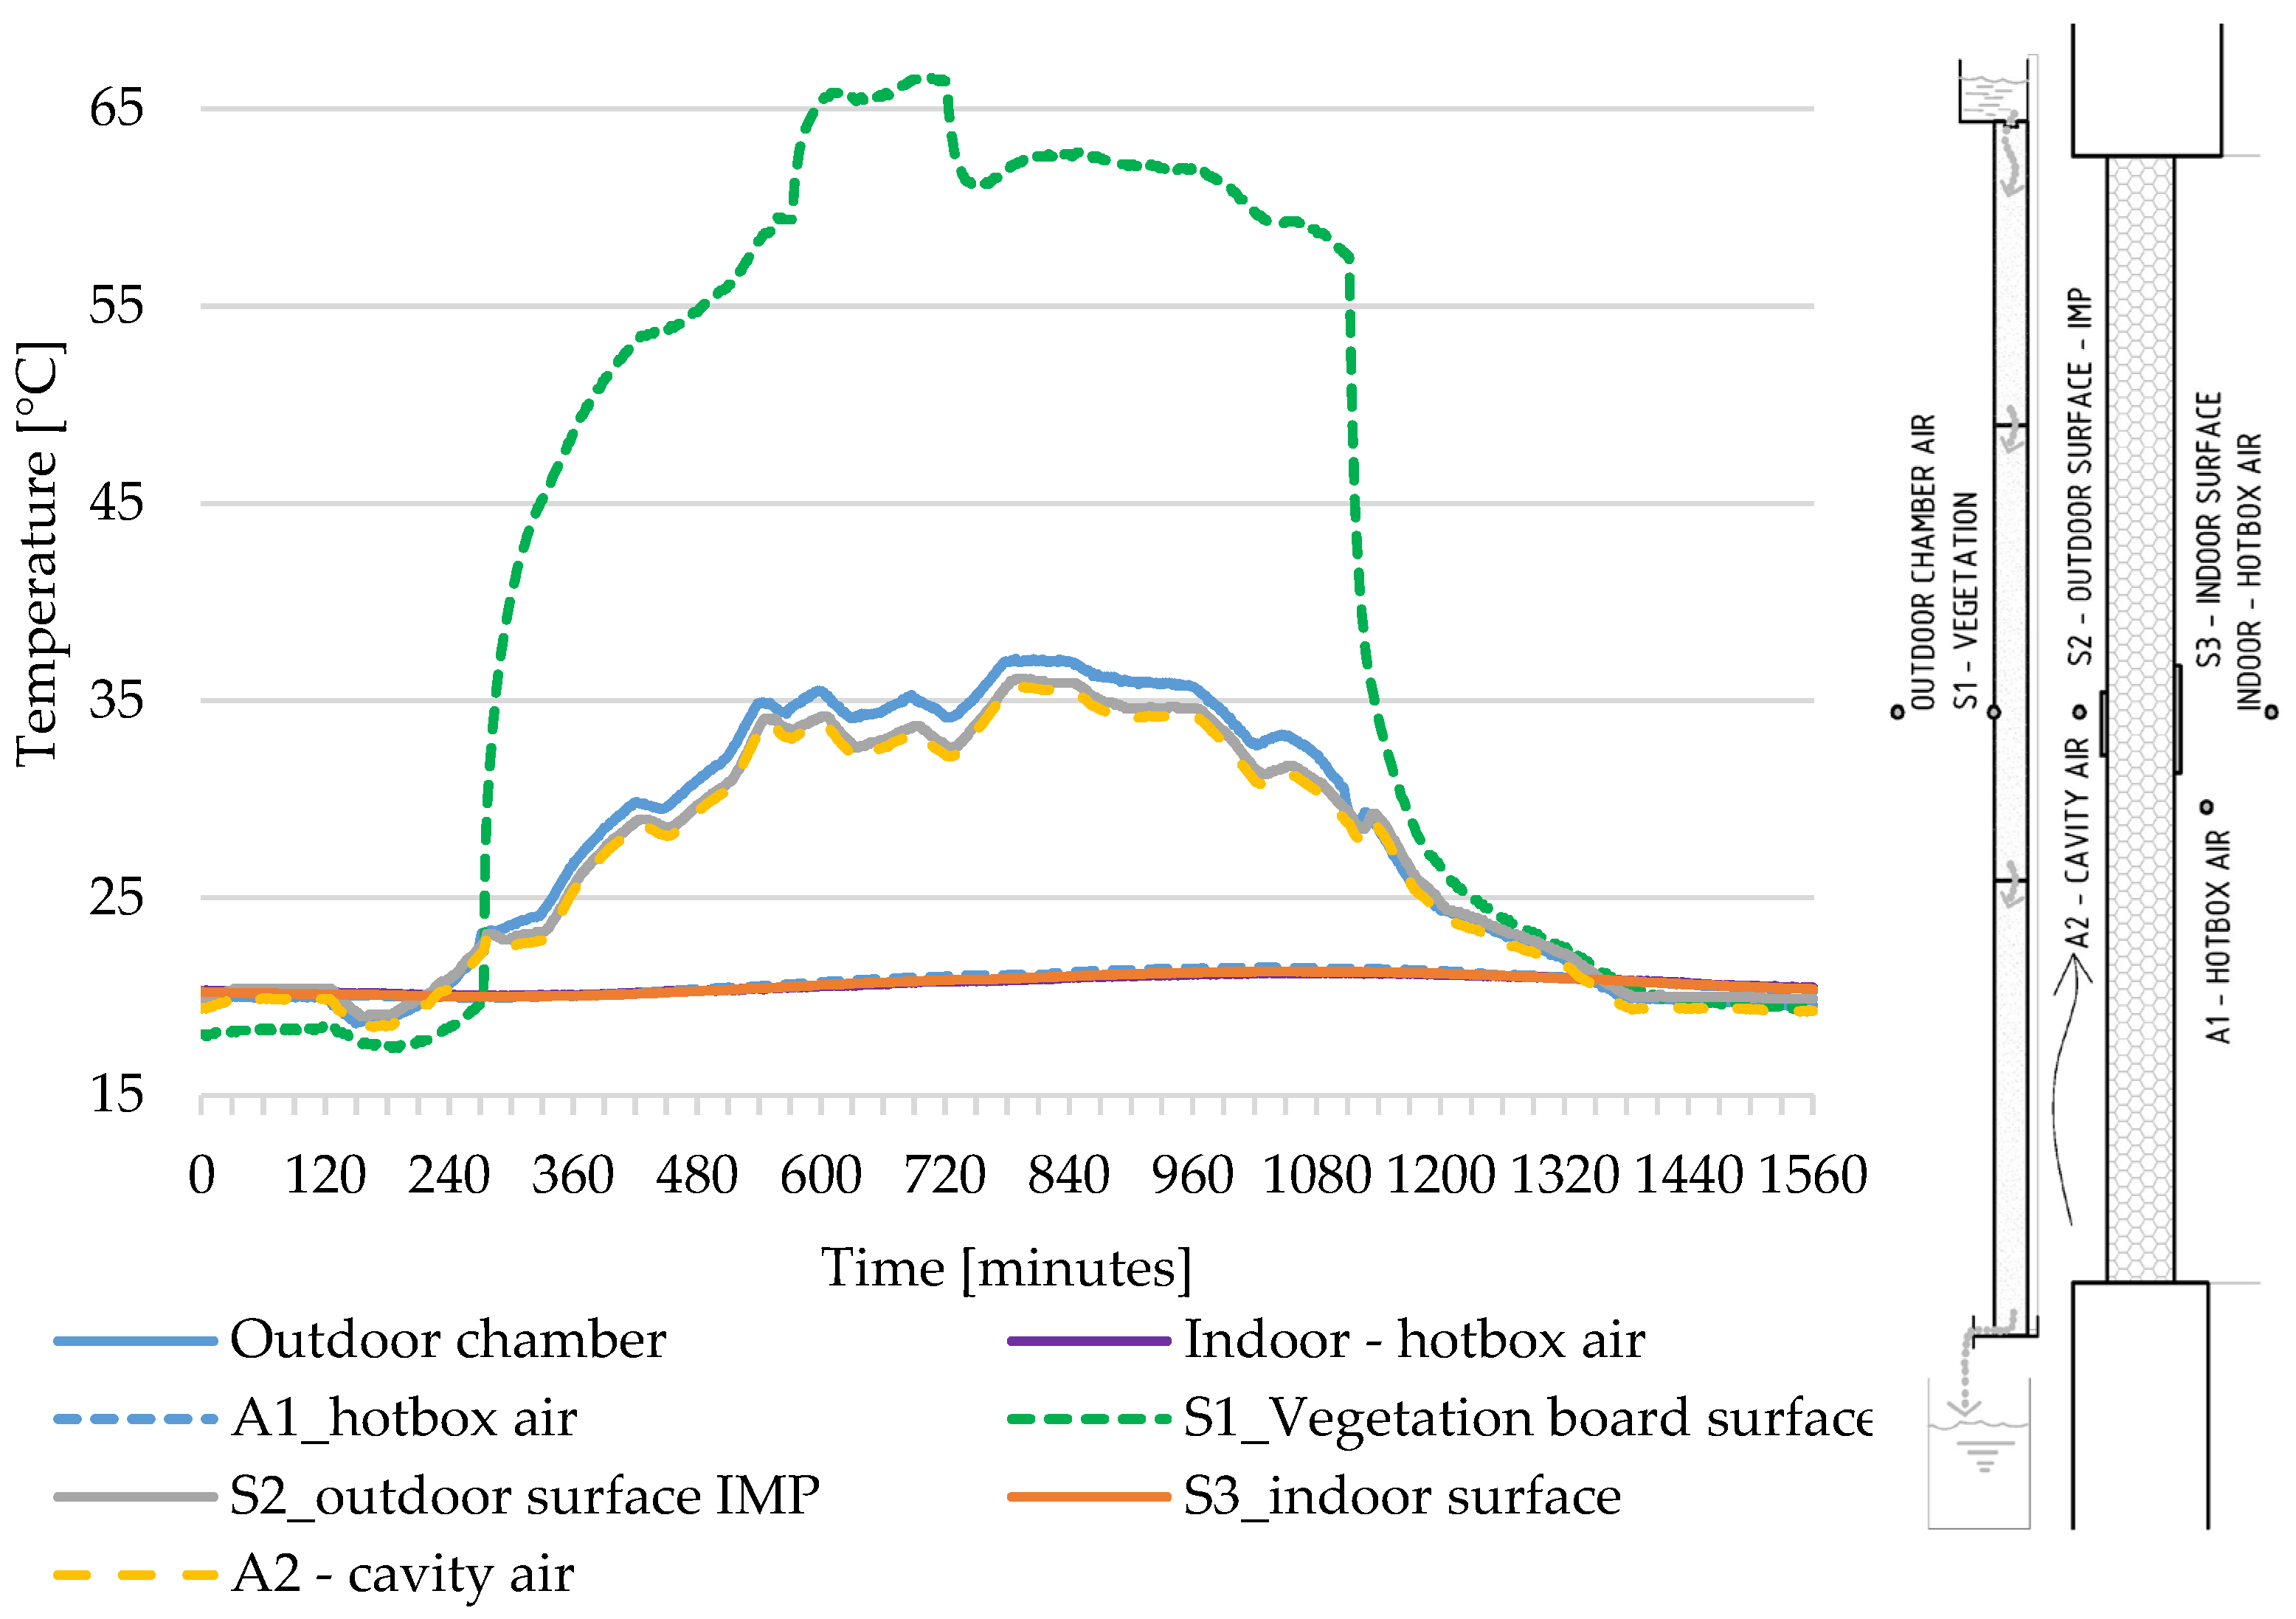
Figure 6.
The temperature course for the setup with the vegetation board. Without watering. Increase in S3 indoor surface temperature from 20.2 to 22.3 °C (temperature difference Δθsi = 2.1 K).

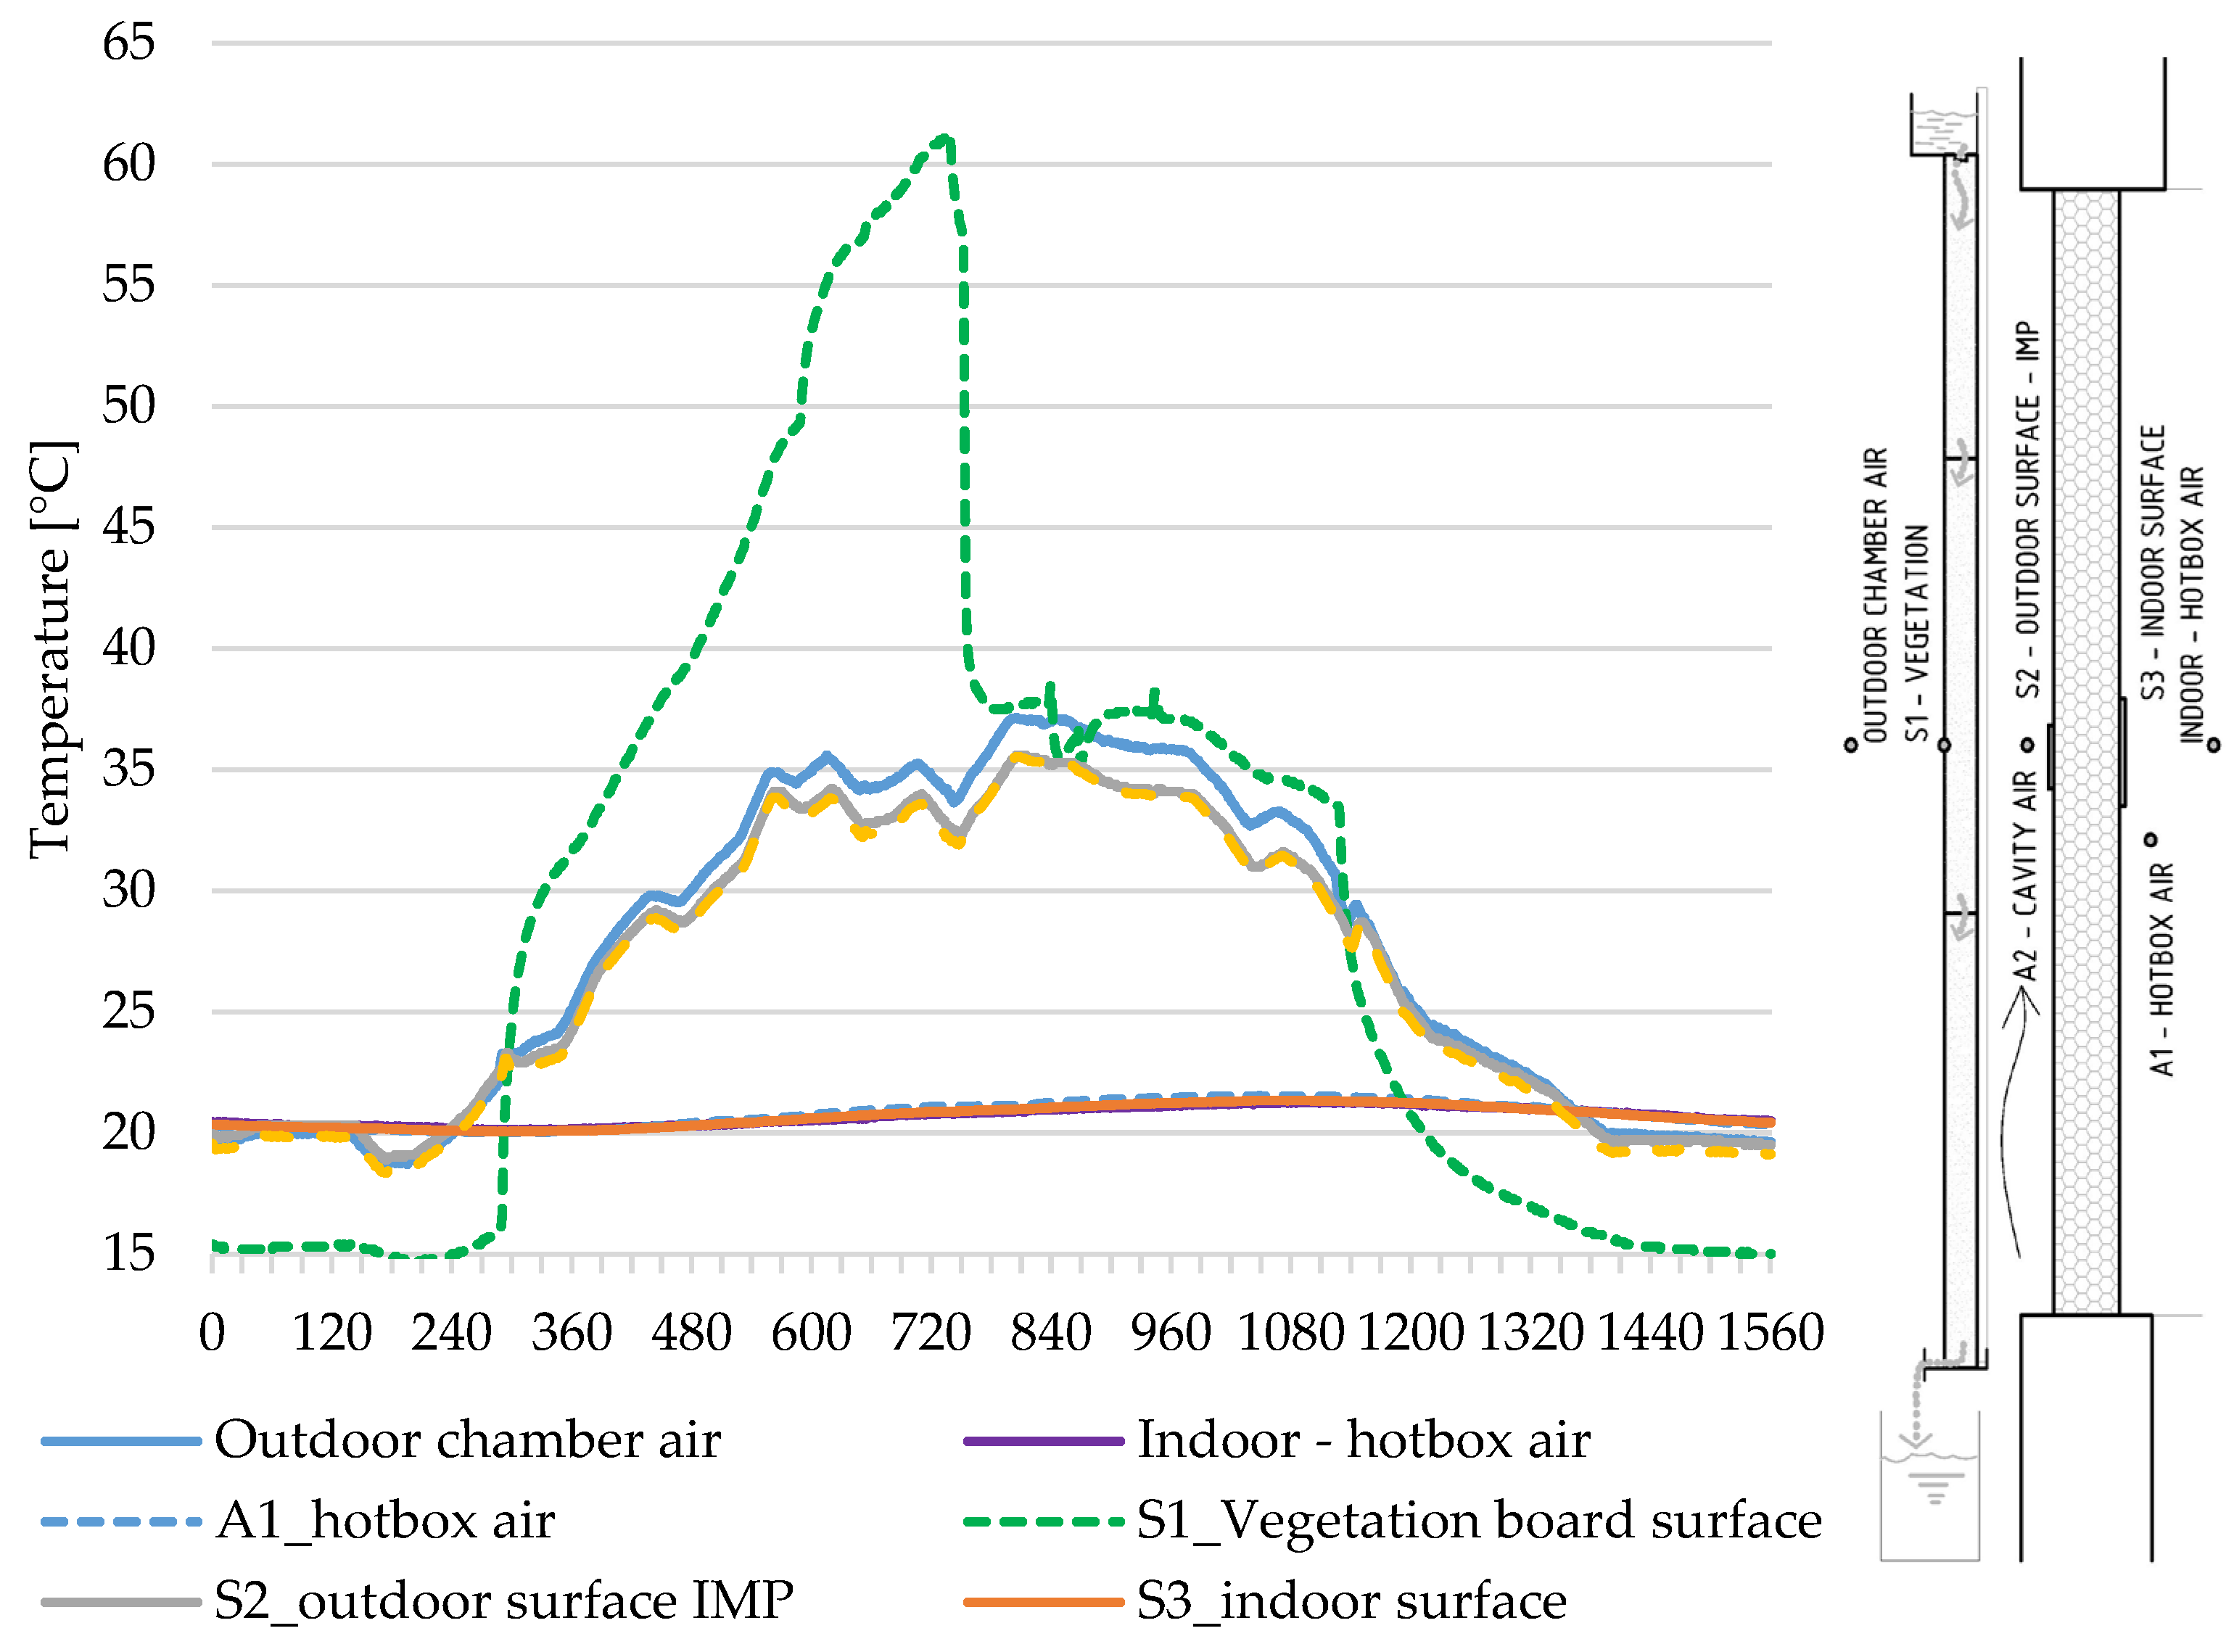
Figure 7.
The temperature course for the setup with the vegetation board. 1 × watering after 12 h from start. Increase in S3 indoor surface temperature from 20.0 to 21.3 °C (temperature difference Δθsi = 1.3 K).
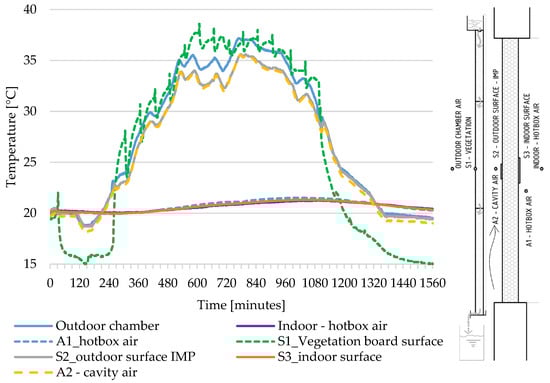
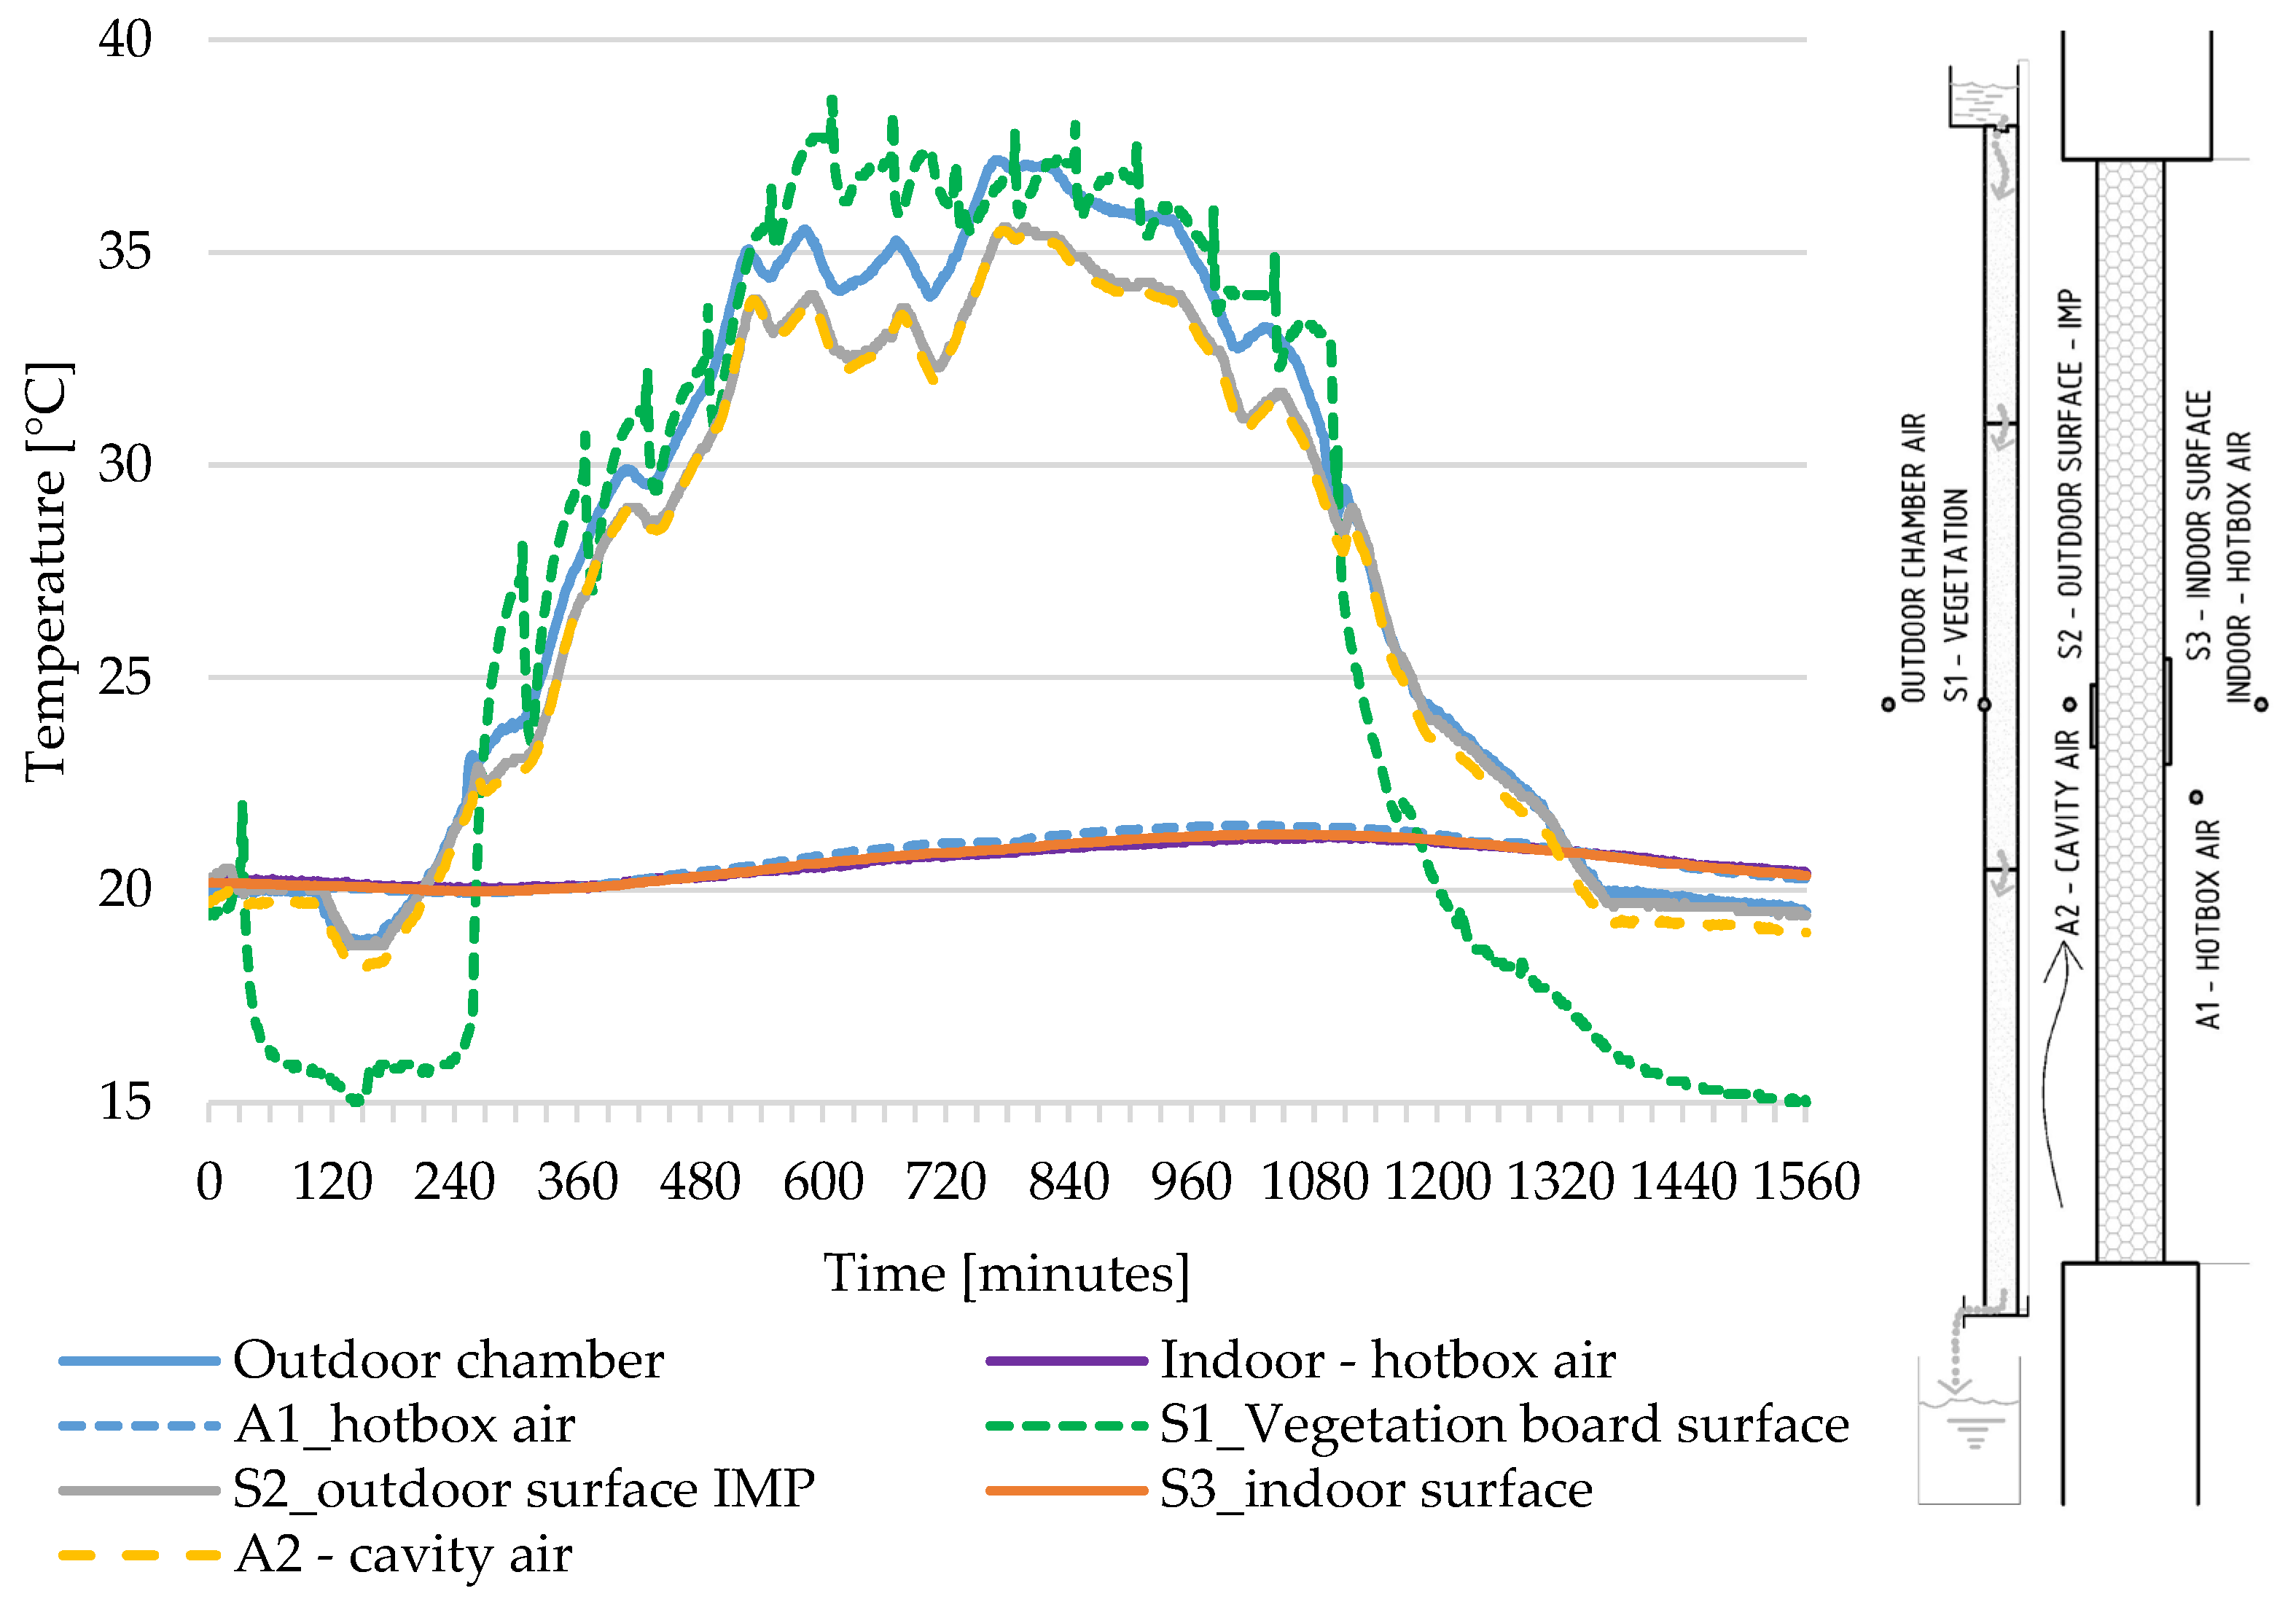
Figure 8.
The temperature course for the setup with the vegetation board, sun simulation on, and hourly watering. Increase in S3 indoor surface temperature from 20.0 to 21.7 °C (temperature difference Δθsi = 1.7 K).
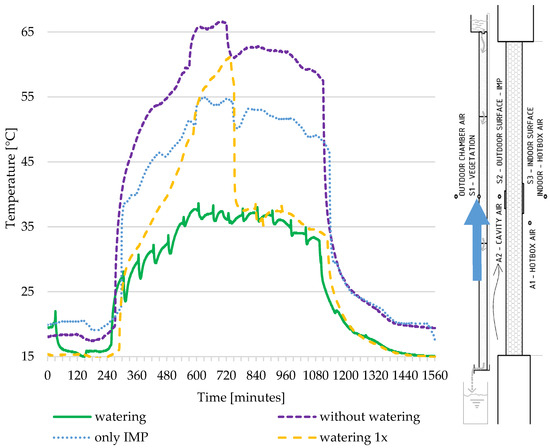
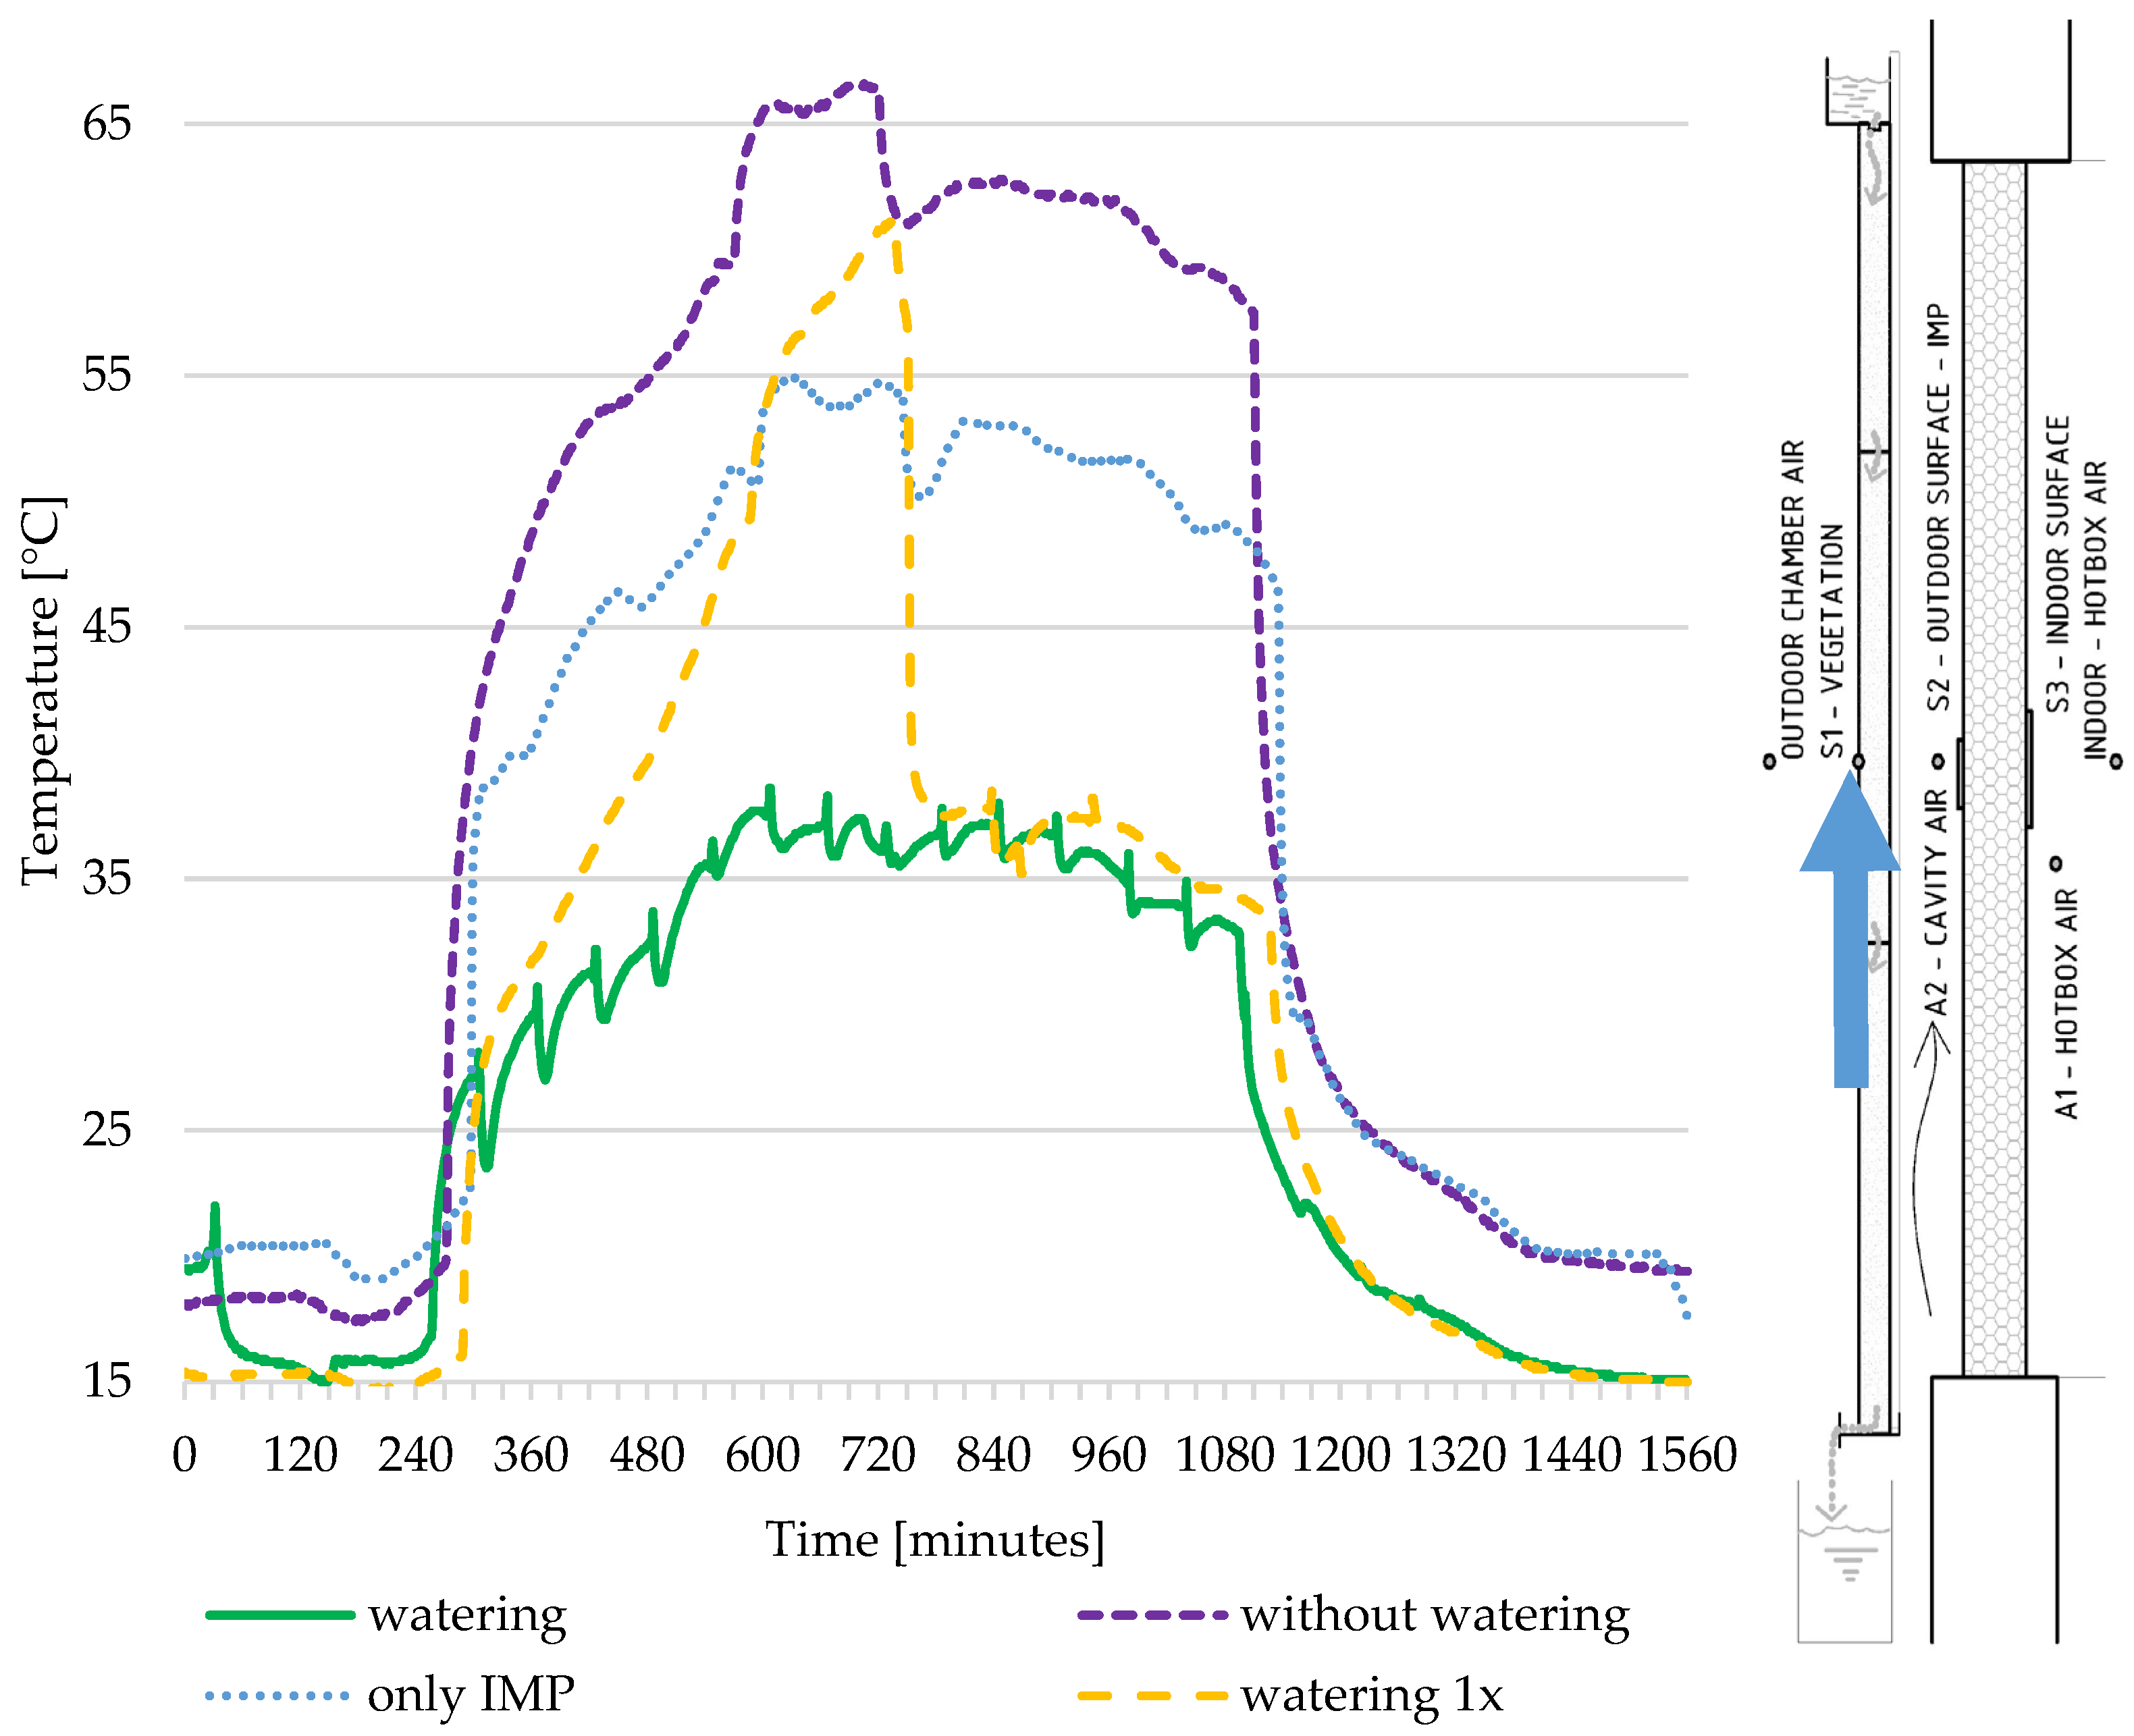
Figure 9.
The temperature courses of the vegetation board surface based on the different watering regimes and comparison to the IMP-only setup.
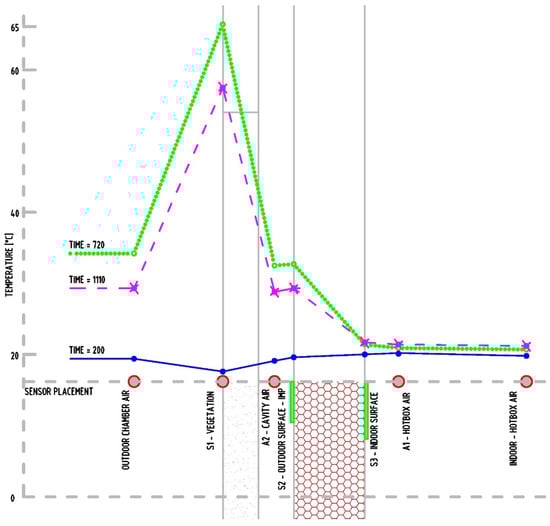
Figure 10.
Measurement with VB and without watering (courses in Figure 6). Measured temperatures for analyzed positions for times: 200 min after start of measurement; 720 min–highest temperature on the VB; 1110 min, just after turning off the SS.
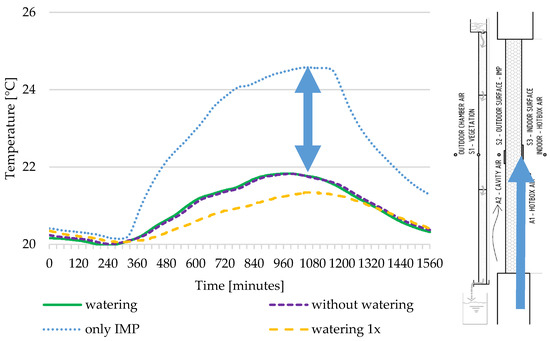
Figure 11.
The temperature courses of the indoor surface of IMP based on the different watering regime. Marked difference between the green façade and the IMP only.

Table 1.
Outdoor (S2) and indoor surface (S3) temperatures for simulated regimes. Phase shift is time difference between the surface temperature peaks (maximum values).
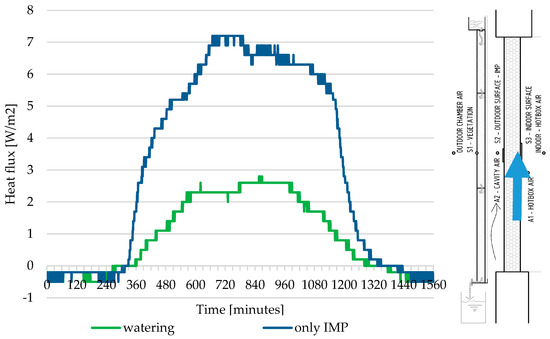
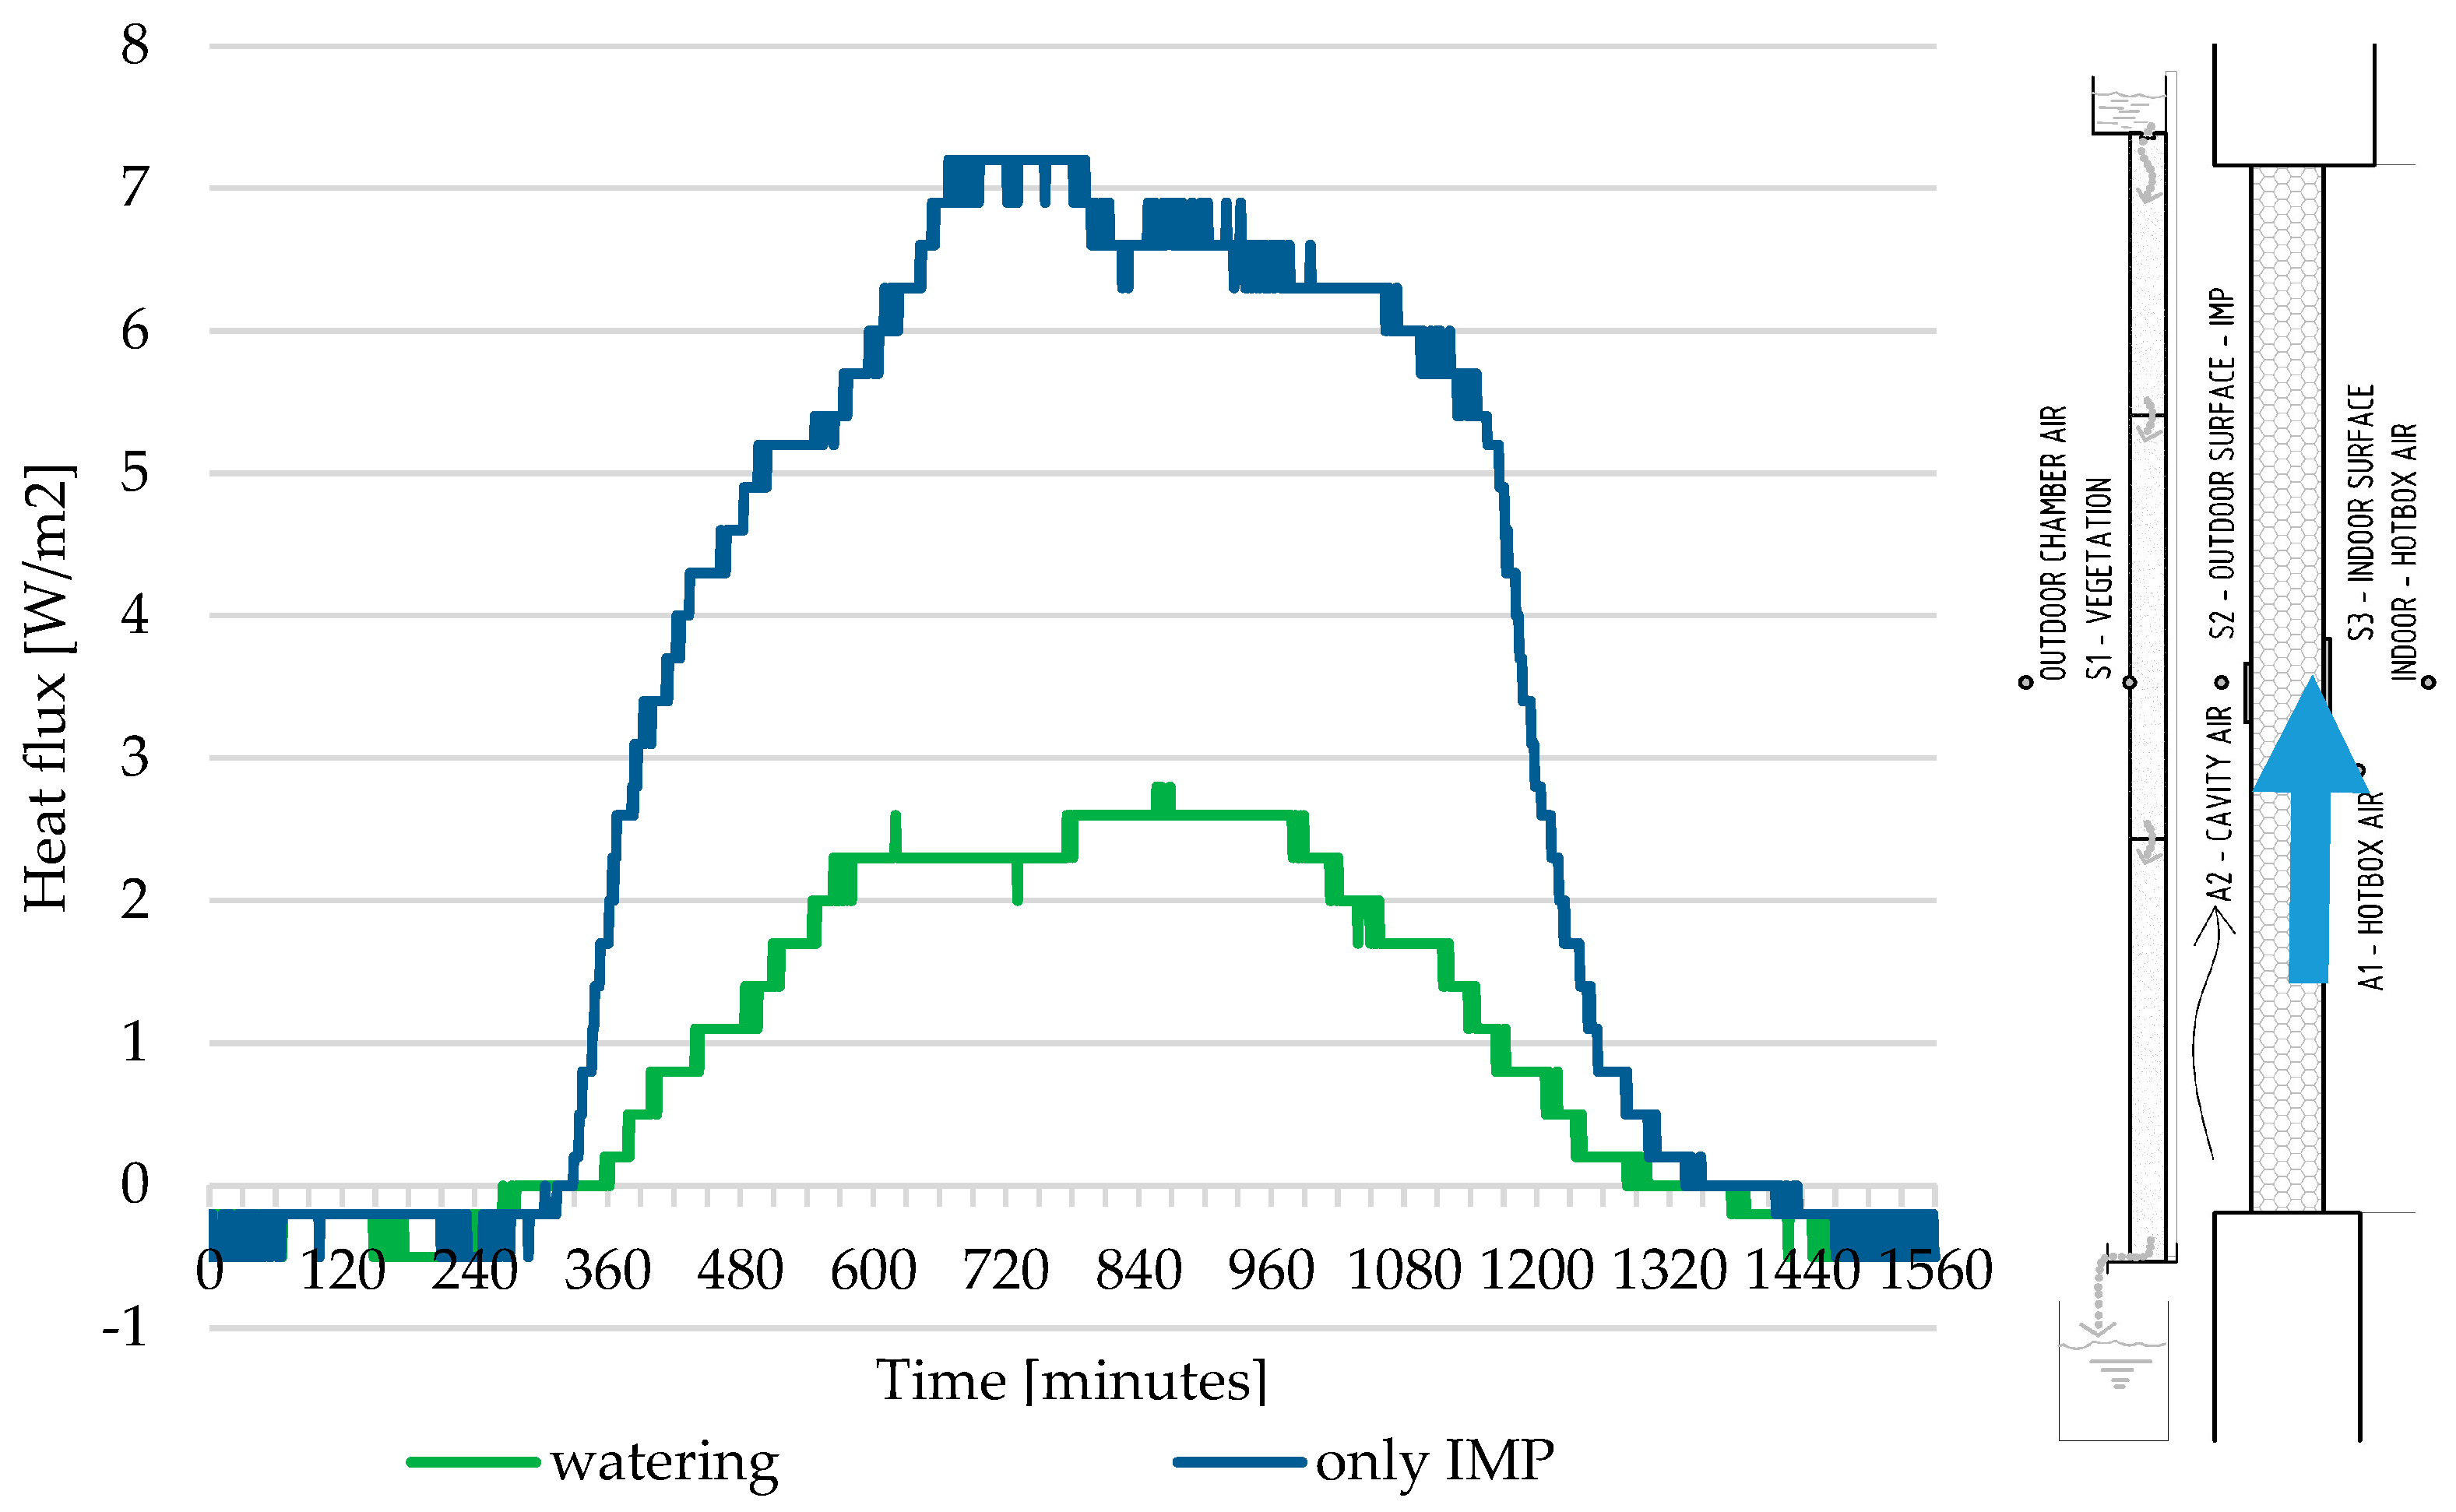
Figure 12.
Heat flux courses measured with heat flux plate on the indoor surface (S3). Maximum heat flow only for IMP setup (no cover) is 7.2 W/m2 and, for VB setup with hourly watering, it is 2.8 W/m2.
When measuring without the SS, the temperatures within the outdoor chamber are almost the same. With SS on, the temperature A3 and outdoor chamber air (measured near the air outlet protected against the radiation) differs because of the radiation from IMB surface. This is visible in Figure 5, where the air temperature near the surface A3 is higher than the air.
A fast increase in the IMP outdoor temperature (Figure 5) or the VB (Figure 6) after turning on the SS is clearly visible. Moreover, the change in the irradiance (Figure 4) can be seen. After turning off the SS, the temperature drops and copies the temperature course of the air.
This obtained temperature is similar to the measured temperature in the real world, based on the measurement of the surfaces with different colors of coating in other research [29]. This supports the idea and outcomes from this measurement, where the used boundary conditions could represent real-world measurement quite well. Results of this measurement show part of the potential of a vegetation façade (Figure 6). Firstly, it works as a regular double-skin façade, with ventilated cavity. The absolute surface temperature of the vegetation board is higher than IMP because its surface is darker and the short-wave radiation absorptivity is higher. However, the indoor surface temperature is, with the use of VB, lower by 2.3 °C and the indoor air temperature stays way below the overheating temperature, which, in Slovakia, is 26 °C.
Tested regimes with different watering showed a fast drop in the VB temperature (Figure 7). For the one-time watering, the temperature of VB dropped to 28 °C. The lower temperature of the board also caused the different microclimate around such a façade. The watering was with water, which was in the tank, so the temperature of that water was approximately the same as the temperature of the outdoor chamber air. That is the reason why the temperature courses with the outdoor chamber air are close to each other. After turning off the SS and before turning it on, it can be seen that the VB surface temperature is lower than the outdoor air. This is caused by the adiabatic cooling—the air flowing near the surface is cooled down by the wet surface (by the evaporation). This is also visible in Figure 8, with hourly watering, where the temperature course copies the course of outdoor temperature, and in Figure 10, where, in time =200, the wet surface is cooler than the ambient air.
The negative phenomenon in this case is resulting from the measurement in the climate chamber. The temperature in the cavity is the same as the air temperature of the chamber itself, which, in fact, will not be real by the in situ measurement. In addition, the regular airflow in the cavity with incorporation of chimney effect does not work because the air inlet in the chamber is located in the upper part of the chamber, near the usually exit apertures. Therefore, the airflow within the cavity is not only supported by the chamber fan speed, but is also inverted.
The watering (Figure 9) hourly or once during the cycle showed that it decreased the vegetation surface temperature dramatically (25 to 30 °C), but, again, because of outdoor chamber ventilation and compensation of heat gains from SS, it does not show on the outdoor surface temperatures, but it is shown in reducing the cooling power of the chamber. Therefore, the cooling with the façade works, but it was not possible to obtain or quantify the specific results straightforwardly.
During watering of the vegetation boards works, the evapotranspiration exists up to the level, where the HVAC system of the chamber cannot dehumidify the space (Figure 4), but it also cannot be quantified. This showed the potential of the evapotranspiration effect, which will highly influence the microclimate around the façade. The differences between the watering regimes in Figure 9 are caused by the starting water content not being exactly the same within the VB.
Figure 10 represents an example of temperature distribution for the setup with VB and without watering for three different times within the cycle:
- -
- 200 min after start of measurement;
- -
- 720 min–highest temperature on the VB;
- -
- 1110 min, just after turning off the SS.
The highest indoor surface increase is as expected with the setup without the vegetation board, but, in setup with vegetation, there are almost no differences, despite the different watering regime (Figure 11). The results of temperature courses are summarized in Table 1, where the temperature differences between the surfaces for different setups and regimes can be seen. In addition, the time between the peaks (phase shift) on both surfaces is calculated (max S2 outdoor surface temperature time and max S3 indoor surface temperature time). The rise in the surface temperature for the IMP-only setup is more than 4 °C, while, for all VB setups, it is somewhere between 1 and 2 °C, which is hard to evaluate within the sensors’ accuracy.
Figure 12 shows the comparison between the measured heat fluxes for the IMP covered with VB and non-covered. An almost 20 °C temperature difference of the surface caused more than twice as high heat flow through the IMP (max 7.2 W/m2 without VB and 2.8 W/m2 with VB setup). The impact of VB can be seen here too.
Based on this measurement, a decision was made to evaluate this type of structure in situ, on the pavilion laboratory building, where some lightweight wooden envelopes are tested, and then comparison with regular wooden ventilated cladding and surface temperatures with different colors will be possible because of undergoing measurements [29,30].
4. Conclusions
The experimental measurement of a green wall in the climate chamber was conducted. It is not known to the authors that there exists another working solution for green walls with such a system where the plants are rooted directly to the material. The purpose of the measurement was to evaluate the impact of the green wall made from VB and different watering regimes. Evaluation was made with direct comparison to the insulated metal panel façade to highlight the benefits.
The outcomes are summarized in these bullet points:
- -
- Additional skin creates the protective layer against the direct solar radiation, which decreases the temperature of the indoor IMP surface by 2.8 °C;
- -
- The vegetation board temperature is higher than the bright IMP panel because of the darker surface (55 to 66 °C);
- -
- Use of watering decreases the VB temperatures, in an extreme example, by 28 °C, which affects the microclimate around the façade; the difference in the surface temperature was not affected with different watering regimes.
The outdoor surface temperatures reach 55 °C in the case without the VB and with a green façade setup, and the maximum surface temperatures of the IMP follow the air temperature in the chamber. The short-wave absorptivity of the green wall is higher than the absorptivity of the bright IMP, hence the measured surface temperature was higher, up to 66 °C.
Usage of regular watering of the vegetation boards cooled down the VB significantly (up to 28 °C). This creates a different microclimate around such a façade because the wet surface with airflow moistens the air. This is supported by the finding that the evapotranspiration from vegetation makes the air within the outdoor chamber so wet that the chamber cannot maintain the set up air humidity in the case with VB for certain outdoor chamber air temperatures; in other words, it is not able to dehumidify the space to the boundary conditions (Figure 4).
The negative outcome is that the chamber, despite its complexity, is not an ideal device for such experiment. The airflow within the ventilated air cavity in the green façade is inverted and this influenced the temperature in the cavity. This is caused by fan system and inlet/outlet placement within the chamber. The solar chimney effect does not work in this case. In reality, the temperature of the flowing air rises up with the height of the cavity and the flowing air reduces the surface temperatures [29,31]. This can be considered as a major problem for such measurement in the climate chamber.
The existence of these problems can be avoided with in situ measurement, which is prepared. Some findings from this measurement for the designing phase of the vegetation skin were used. This measurement can additionally confirm the outcomes regarding the different boundary conditions.
It was also more or less determined that, in the short term, the wall using VB is a unique and functional solution. It is easier to use this solution than the traditional systems consisting of horizontal flowerpots and complex water piping through the façade, etc. In the future, the results with relative humidity and comparison with the closed air cavity and different thickness will be processed.
Author Contributions
Introduction and Conclusions, supervision, funding acquisitions: P.D.; test setup, discussion, methodology and conclusions: P.J. All authors have read and agreed to the published version of the manuscript.
Funding
This research was funded by Slovak Scientific Grant Agency (VEGA) grant number 1/0673/20.
Institutional Review Board Statement
Not applicable.
Informed Consent Statement
Not applicable.
Data Availability Statement
The data presented in this study are available on request from the corresponding author.
Acknowledgments
The research is supported by the grant project VEGA No. 1/0673/20 and MDM Slovakia.
Conflicts of Interest
The authors declare no conflict of interest. The funders had no role in the design of the study; in the collection, analyses, or interpretation of data; in the writing of the manuscript, or in the decision to publish the results.
References
- Vertaľ, M.; Zozulák, M.; Vašková, A.; Korjenic, A. Hygrothermal initial condition for simulation process of green building construction. Energy Build. 2018, 167, 166–176. [Google Scholar] [CrossRef]
- Klein, P.M.; Coffman, R. Establishment and performance of an experimental green roof under extreme climatic conditions. Sci. Total Environ. 2015, 512–513, 82–93. [Google Scholar] [CrossRef] [PubMed]
- Kubilay, A.; Allegrini, J.; Strebel, D.; Zhao, Y.; Derome, D.; Carmeliet, J. Advancement in Urban Climate Modelling at Local Scale: Urban Heat Island Mitigation and Building Cooling Demand. Atmosphere 2020, 11, 1313. [Google Scholar] [CrossRef]
- Besir, A.B.; Cuce, E. Green roofs and facades: A comprehensive review. Renew. Sustain. Energy Rev. 2018, 82, 915–939. [Google Scholar] [CrossRef]
- Bevilacqua, P. The effectiveness of green roofs in reducing building energy consumptions across different climates. A summary of literature results. Renew. Sustain. Energy Rev. 2021, 151, 111523. [Google Scholar] [CrossRef]
- Ascione, F.; Bianco, N.; de’Rossi, F.; Turni, G.; Vanoli, G.P. Green roofs in European climates. Are effective solutions for the energy savings in air-conditioning? Appl. Energy 2013, 104, 845–859. [Google Scholar] [CrossRef]
- Vertal, M.; Vranayova, Z.; Varga, J.; Poorova, Z.; Vranay, F.; Zozulak, M.; Vargova, A.; Zelenakova, M.; Gregorek, R. Experimentálna vegetačná strecha s biodiverzným potenciálom (in Slovak). Strechy Fasády Izol. 2020, 25–29, 11–12. [Google Scholar]
- Juras, P. Introduction to the Green Roof Research. In XXX Russian-Polish-Slovak Seminar Theoretical Foundation of Civil Engineering (RSP 2021); Springer International Publishing: Heidelberg, Germany, 2021; pp. 108–115. [Google Scholar] [CrossRef]
- Lundholm, J.T. Green roofs and facades: A habitat template approach. Urban Habitats 2006, 4, 87–101. [Google Scholar]
- Manso, M.; Castro-Gomes, J. Green wall systems: A review of their characteristics. Renew. Sustain. Energy Rev. 2015, 41, 863–871. [Google Scholar] [CrossRef]
- Hunter, A.M.; Williams, N.; Rayner, J.; Aye, L.; Hes, D.; Livesley, S. Quantifying the thermal performance of green façades: A critical review. Ecol. Eng. 2014, 63, 102–113. [Google Scholar] [CrossRef]
- Wong, I.; Baldwin, A.N. Investigating the potential of applying vertical green walls to high-rise residential buildings for energy-saving in sub-tropical region. Build. Environ. 2016, 97, 34–39. [Google Scholar] [CrossRef]
- Kontoleon, K.; Eumorfopoulou, E. The effect of the orientation and proportion of a plant-covered wall layer on the thermal performance of a building zone. Build. Environ. 2010, 45, 1287–1303. [Google Scholar] [CrossRef]
- Tudiwer, D.; Korjenic, A. The effect of living wall systems on the thermal resistance of the façade. Energy Build. 2017, 135, 10–19. [Google Scholar] [CrossRef]
- Tudiwer, D.; Vertal, M.; Korjenic, A.; Cakyova, K. Illustration of the heat-insulating effect of a façade greening system in a simulation. Bauphysik 2019, 41, 155–161. [Google Scholar] [CrossRef]
- Lakho, F.H.; Vergote, J.; Khan, H.I.-U.-H.; Depuydt, V.; Depreeuw, T.; Van Hulle, S.W.; Rousseau, D.P. Total value wall: Full scale demonstration of a green wall for grey water treatment and recycling. J. Environ. Manag. 2021, 298, 113489. [Google Scholar] [CrossRef] [PubMed]
- Segovia-Cardozo, D.A.; Rodríguez-Sinobas, L.; Zubelzu, S. Living green walls: Estimation of water requirements and assessment of irrigation management. Urban For. Urban Green. 2019, 46, 126458. [Google Scholar] [CrossRef]
- Prodanovic, V.; Wang, A.; Deletic, A. Assessing water retention and correlation to climate conditions of five plant species in greywater treating green walls. Water Res. 2019, 167, 115092. [Google Scholar] [CrossRef]
- Sun, T.; Bou-Zeid, E.; Ni, G.-H. To irrigate or not to irrigate: Analysis of green roof performance via a vertically-resolved hygrothermal model. Build. Environ. 2014, 73, 127–137. [Google Scholar] [CrossRef]
- Kubilay, A.; Strebel, D.; Derome, D.; Carmeliet, J. Mitigation measures for urban heat island and their impact on pedestrian thermal comfort. J. Phys. Conf. Ser. 2021, 2069, 012058. [Google Scholar] [CrossRef]
- Agathokleous, R.; Barone, G.; Buonomano, A.; Forzano, C.; Kalogirou, S.; Palombo, A. Building façade integrated solar thermal collectors for air heating: Experimentation, modelling and applications. Appl. Energy 2019, 239, 658–679. [Google Scholar] [CrossRef]
- Smyth, M.; Pugsley, A.; Hanna, G.; Zacharopoulos, A.; Mondol, J.; Besheer, A.; Savvides, A. Experimental performance characterisation of a Hybrid Photovoltaic/Solar Thermal Façade module compared to a flat Integrated Collector Storage Solar Water Heater module. Renew. Energy 2019, 137, 137–143. [Google Scholar] [CrossRef]
- Čurpek, J.; Čekon, M. Climate response of a BiPV façade system enhanced with latent PCM-based thermal energy storage. Renew. Energy 2020, 152, 368–384. [Google Scholar] [CrossRef]
- Hengstberger, F.; Zauner, C.; Resch, K.; Holper, S.; Grobbauer, M. High temperature phase change materials for the overheating protection of facade integrated solar thermal collectors. Energy Build. 2016, 124, 1–6. [Google Scholar] [CrossRef]
- Jelle, B.P.; Breivik, C.; Røkenes, H.D. Building integrated photovoltaic products: A state-of-the-art review and future research opportunities. Sol. Energy Mater. Sol. Cells 2012, 100, 69–96. [Google Scholar] [CrossRef] [Green Version]
- Available online: https://www.osram.com/appsj/pdc/pdf.do?cid=GPS01_1028075&vid=PP_EUROPE_Europe_eCat&lid=EN&mpid=ZMP_58227 (accessed on 26 March 2022).
- Plesnik, J.; Zlamala, J. Available online: https://register.epo.org/espacenet/regviewer?AP=13828952&CY=EP&LG=en&DB=REG (accessed on 26 March 2022).
- Jurasova, D. Analysis of Long-Term Measured Exterior Air Temperature in Zilina. Civ. Environ. Eng. 2018, 14, 124–131. [Google Scholar] [CrossRef] [Green Version]
- Juras, P. Lightweight timber-framed wall and impact of ventilated cladding on the possibility of reducing summer overheating in Central Europe. E3S Web Conf. 2020, 172, 03009. [Google Scholar] [CrossRef]
- Štaffenová, D.; Ponechal, R.; Ďurica, P.; Cangár, M. Climate Data Processing for Needs of Energy Analysis. Adv. Mater. Res. 2014, 1041, 129–134. [Google Scholar] [CrossRef]
- Stazi, F.; Tomassoni, F.; Vegliò, A.; Di Perna, C. Experimental evaluation of ventilated walls with an external clay cladding. Renew. Energy 2011, 36, 3373–3385. [Google Scholar] [CrossRef]

Publisher’s Note: MDPI stays neutral with regard to jurisdictional claims in published maps and institutional affiliations. |
© 2022 by the authors. Licensee MDPI, Basel, Switzerland. This article is an open access article distributed under the terms and conditions of the Creative Commons Attribution (CC BY) license (https://creativecommons.org/licenses/by/4.0/).