Abstract
Achieving net-zero carbon in the UK by 2050 will necessitate the decarbonisation of the transportation systems. However, there are challenges to this, especially for vehicles in cities where the charging infrastructure is at its minimum. Overcoming these challenges will undoubtedly encourage electrical vehicle (EV) use, with commensurate reductions in emission coupled with better environmental conditions in cities, e.g., air quality. Drivers, on the whole, are reluctant to invest in an EV if they cannot access a convenient charging point within their living area. This research provides a methodology to support the planning for the optimum siting of charging infrastructure, so it is accessible to as many citizens as possible within a city. The work focuses on Winchester City and District in the UK. The multi-criteria decision approach is based on the Analytical Hierarchy Process (AHP) linked to site spatial assessment using Geographical Information System (GIS). The assessment considered key criteria such as road type, road access, on-road parking availability, road slope, proximity to fuel stations, current/planned charging points, car parks and population distributions. The process contains two suitability filters, namely, restricted road and suitability mask. In the first, all restricted roads were excluded from further analysis, which resulted in reducing the road segments from over 9000 to around 2000. When applying the second filter an overall result of 44 suitable EV charging point locations was achieved. These locations were validated using the Google Earth® imaging platform to check actual locations against those predicted by the analysis. The presented methodology is accurate and is generalisable to other cities or regions.
1. Introduction
The UK was the first country and major economy to pass a Climate Change Act in 2008 committing the Government to an 80% reduction in emissions from 1990 levels by 2050 [1,2], which was augmented in 2019 to net-zero carbon emissions by the same date. Tracking the Act’s targets is the responsibility of the Committee on Climate Change (CCC), which produces annual progress reports to UK’s Parliament scrutinizing the Government’s actions and whether these are on target. In July 2019, the CCC progress report stated that current policy actions were “well short of those required for the net-zero targets” with the UK not even on track to meet their earlier targets based on the less challenging 80% target [3]. The benefits brought out by net-zero are vast, including improved air quality and enhanced natural environments, leading to improved health, potentially reducing hospital admissions and enhancing productivity [4].
Nationally, and to support the net-zero target, 74% of the UK’s local authorities have declared a climate emergency, with some setting quantifiable targets to net zero for their cities/districts by a certain date [5]. Winchester City Council (WCC) is one of these cities, and its District declared a Climate Emergency in June 2019 and is now committed to becoming a carbon-neutral Council by 2024 and a carbon-neutral District by 2030 [6]. The plan to achieve these targets focuses on Winchester’s three largest sources of carbon emissions—transport, property and energy, which will necessitate an understanding of various options that could provide a pathway to such a goal.
Over the past few years, the electric vehicle (EV) market has been growing considerably, and with the UK government recently announcing a revised 2-phase approach to the phasing-out of petrol and diesel cars, the EV market is expected to rise exponentially. The 2-phase strategy includes (i) the end of new petrol and diesel car sales brought forward to 2030 (previously 2040) and (ii) the requirement for all new cars and vans to be fully zero emissions by 2035 [7]. Data from the Office for National Statistics (ONS) shows that of the 38 million cars registered in the UK in 2020, 433,784 (1.12%) were registered as vehicles with an electrical plug-in (Table 1). Vehicles with plug-ins include pure electric vehicles (PEV) and plug-in hybrid electric vehicles (PHEV). When looking at Winchester District data, this percentage increases to 1.47%, far higher than the UK and in particular Hampshire’s 1.03%, where the District and Winchester City are located [8,9].

Table 1.
Registered cars and plug in cars adopted from [8,9,10].
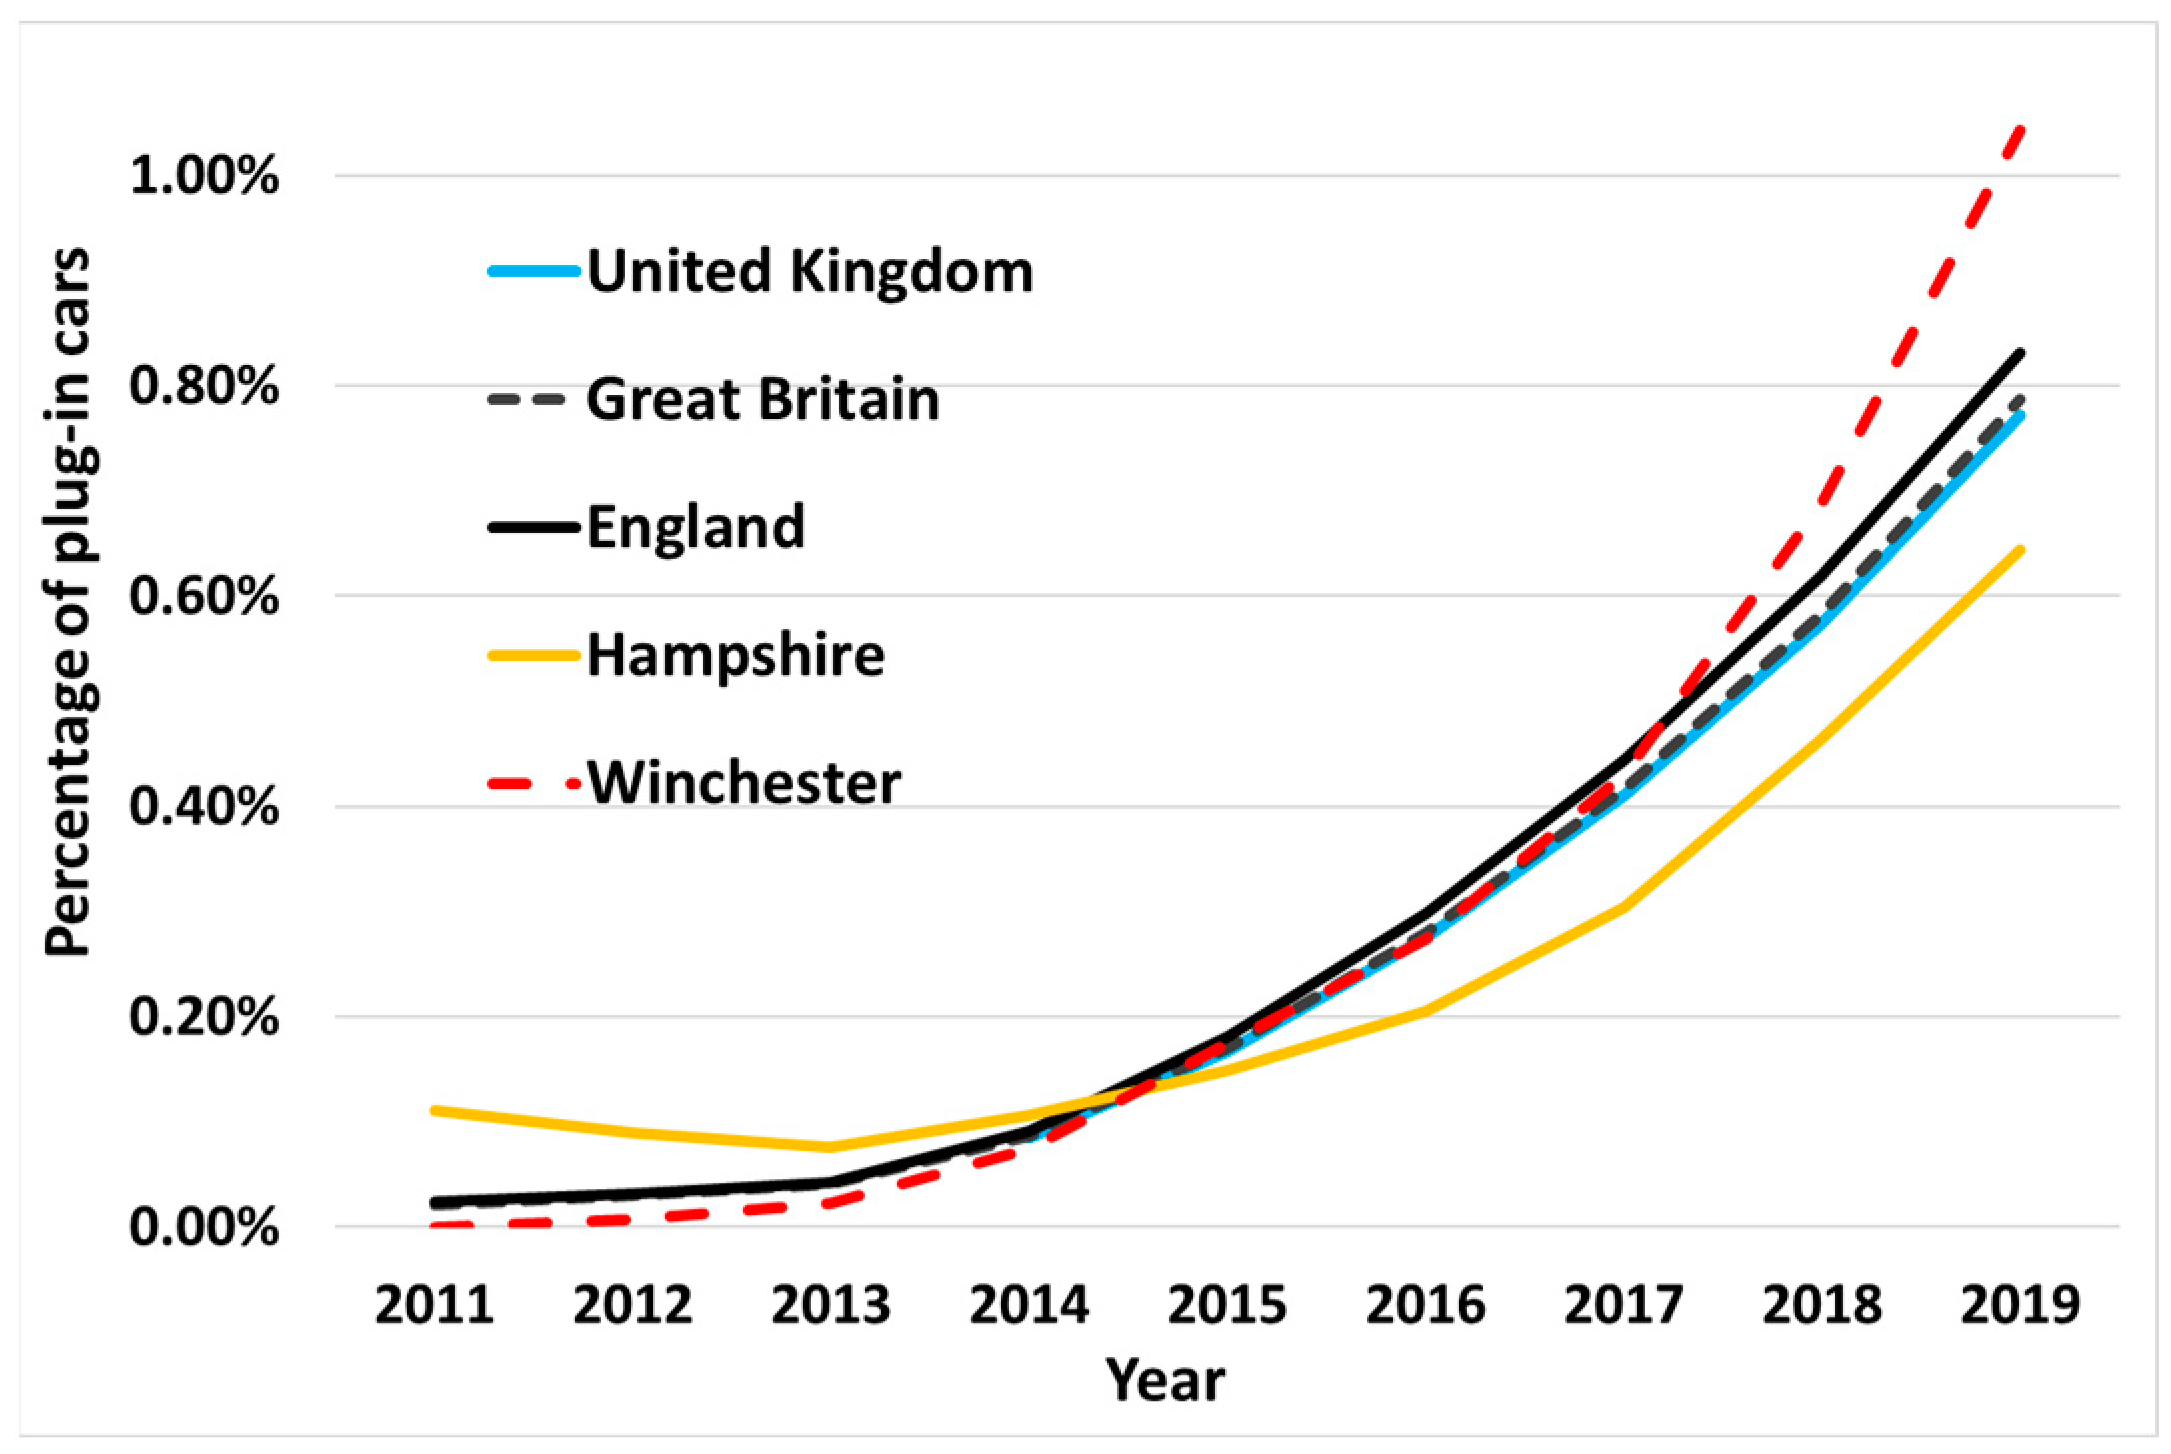
While the total percentage of plug-in vehicles is still relatively low, the relative growth in electric vehicles, particularly in Winchester, is considerable, see Figure 1. In 2011, none of the 842 plug-in cars registered in Hampshire were from Winchester; however, it now has the highest percentage of plug-in cars in Hampshire. As stated, this growth in the EV market is expected to accelerate, with projections from the National Grid suggesting that the UK stock of EVs could rise to 10.6 million by 2030 and up to 36 million by 2040. These figures can be compared to growth of 16.6 million by 2030 and less than 3 million by 2040 of conventional petrol and diesel cars [11].

Figure 1.
Growth from 2011–2019 in plug-in vehicle registration across the UK, Hampshire and Winchester, adopted from [8].
In response to the rollout of EVs, this research is supporting Winchester City Council (or Winchester for short) and the District in undertaking a mapping optimisation study for the needed infrastructure to allow both the City and the District to accommodate and encourage EV ownership. Currently, Winchester District has 32 fast (22 kWh) and one rapid (50 kWh) EV charge points, with 52% of these located in Winchester [12]. WCC’s Cabinet has endorsed the Electric Vehicle Charging Strategy, which recommends the installation of approximately 50 electric vehicle chargers across 58 parking bays, including 25 WCC car parks, one park (Park and Ride), 12 rural and town car parks and three on-street parking spaces [13]. With this in mind, the focus of this research is to identify suitable road locations for on-street charging points to support the above highlighted strategy.
The Winchester District, which contains Winchester City, covers approximately 250 square miles of rolling countryside and economic heartland, with Winchester City designated as a heritage city attracting an estimated 5.6 million visitors a year. The District is a rural area with the M3 motorway running through the middle, along with several busy ‘A’ roads, including the A34 and A3.
This research is a collaborative effort to support the aforementioned aspirations of WCC and the District. It concentrates on creating the required mapping of the optimum charging point infrastructure for EV rollout across the region. The outcomes will provide guidance for future policy in order to meet set aspirations.
2. Current State of Art Related to the Considered Problem
There is a paucity of information related to methodologies used for siting electrical charging points in cities. Only a few references used multi-criteria decision making (MCDM) or Analytical Hierarchy Process (AHP) to locate EV charging stations [14,15,16,17,18]. In addition, to our knowledge, available literature did not introduce a methodology to solve the on-road EV charging points spatial siting problem. When considering the following, it must be remembered that an EV charging station is an off-road site to charge multiple vehicles, while an EV charging point is on-road infrastructure around an on-road parking space with an EV charger installed at the curb side, some of which are integrated with light posts, etc.
Erbas et al. used the fuzzy analytical hierarchy process (AHP) technique to find the optimal EV charging station locations in Ankara, Turkey [14]. They had a four-stage spatial siting solution methodology: (i) criteria determination, (ii) EV charging stations site availability score, (iii) criteria weighting, and (iv) a proposed site ranking using AHP. For the first step, they used a panel of experts and academicians to create the criteria affecting the decision. The Technique for Order of Preference by Similarity to Ideal Solution (TOPSIS) method [14] was utilised to rank the proposed sites. Erbas et al. methodology’ is only valid to determine EV charging stations and not for on-road EV charging points. However, the TOPSIS technique is limited and mainly designed to evaluate only a few numbers of alternatives, which make it unpractical to rank a large number of alternatives (n) that are encountered in a large study such as our work here, where (n > 9000).
Additionally, Sen Guo and Huiru Zhao used a similar methodology to select the optimal EV charging station sites in Beijing districts, China [16]. They built a new evaluation index system to locate EV charging stations. The new approach contains three main sustainability criteria: environment criteria, society criteria and economy criteria. They determine the main criteria and sub-criteria based on previous comprehended studies and reports. Again, Sen Guo’s study is limited to locating the EV charging stations, with limited alternative size, and there is no possibility to extend their methodology to be applied to our study aims. Dogus Guler and Tahsin Yomralioglu [15] used the same methodology introduced by Sen Guo and Huiru Zhao [16] to study the spatial site locations for fast EV charging stations inside the boundaries of Istanbul, Turkey. The paper did not offer a new solution to the spatial siting problem.
Grzegorz Sierpinski et al. [17] identified the most suitable locations to build EV charging stations within Upper Silesia and Dabrowa Basin in Poland based on the methodology first introduced by Yongqin Zhang and Kory Iman [18]. The methodology is much simpler than the two studies mentioned earlier as the chosen factors are only dedicated to assessing and siting a limited number of off-road charging stations, and the methodology is deemed unsuitable for on-road charging points. For instance, the approximation used for the roads factor could not be utilised in our case study as all the alternatives used in our methodology referred to locations already on road, so all of them had the same score.
The currently available literature related to the topic of our research reviewed above is to some extent similar and based on the same methodology, which was used to compare and evaluate only a few locations. This is unlike the problem faced in our research, where analyses are needed to deal with a very large area with thousands of locations and alternatives. Hence, a new approach is needed to address the siting of locations for EV charging whilst taking into account other criteria related to the physical conditions and infrastructure availability. The next section provides details of the proposed new methodology.
3. Methodology
The approach promoted here to determine the most suitable locations for EV charging points across Winchester District is based on the Analytical Hierarchy Process (AHP) [19,20,21,22] coupled to site spatial assessment in a Geographical Information System (GIS). This multi-criteria decision analysis of the AHP-GIS combination can, in our view, provide a robust approach when considering spatial siting optimisation as it has been shown to work well with special siting problems by the authors [19,20].
The mapped study area (Winchester District) is divided into equal size grids where each pixel within the grid is referred to as a ‘cell/alternative’. Each cell has location-specific data, including road infrastructure, geography and demographics. The process involves two stages, the Boolean Mask and the Factors Aggregation, in order to calculate the Weighted Linear Combination (WLC) aggregation [20]. An example for an idealised case is shown in Figure 2, where an example map consisting of nine cells (nine alternatives) has five criteria, which are divided into constraints and suitability factors. These combined are used to evaluate the most suitable cell locations, including three constraints (c1, c2 and c3) and two suitability factors (x1, x2). For the constraints, cells are either rated as a 0 (constrained) or 1 (non-constrained) and are then multiplied together to create the Boolean Mask layer, revealing all non-constrained cells [23]. The Suitability Mask calculation then aggregates the suitability factor scores for each cell (scored with a value between 0 and 1) with a factor weighting (w1, w2) expressed through the formula ∑xiwi = factor aggregation [19,20]. These two masks are then multiplied together (WLC) to provide a final suitability decision, whereby in the example the most suitable cell was found to have a score of 0.7 (see the green coloured cell in Figure 2).
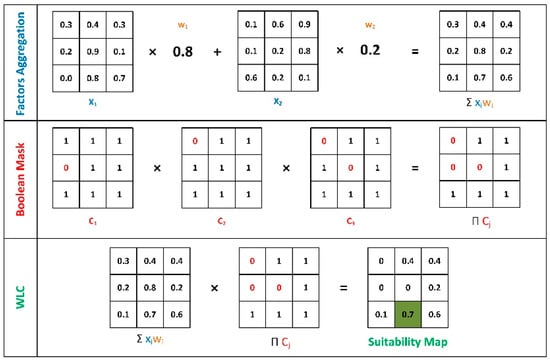
Figure 2.
An example of how the methodology is working, by considering the Boolean Mask (top), Factors Aggregation (middle) and Weighted Linear Combination (WLC) (bottom), where c1, c2 and c3 are constraints, x1, x2 are suitability factors and w1 and w2 are factor weights.
4. EV Charge Point Siting Criteria, Analysis and Suitability Maps
Winchester District as a whole has over 9000 road segments, ranging from motorways (highways) to restricted secondary-access roads, with 25% of these segments situated within Winchester City. The constraint/restriction criteria are listed and detailed in Table 2. The constraints are numbered in the order in which they were applied to the AHP- GIS model.
Table 2.
Table of constraint/restriction criteria.
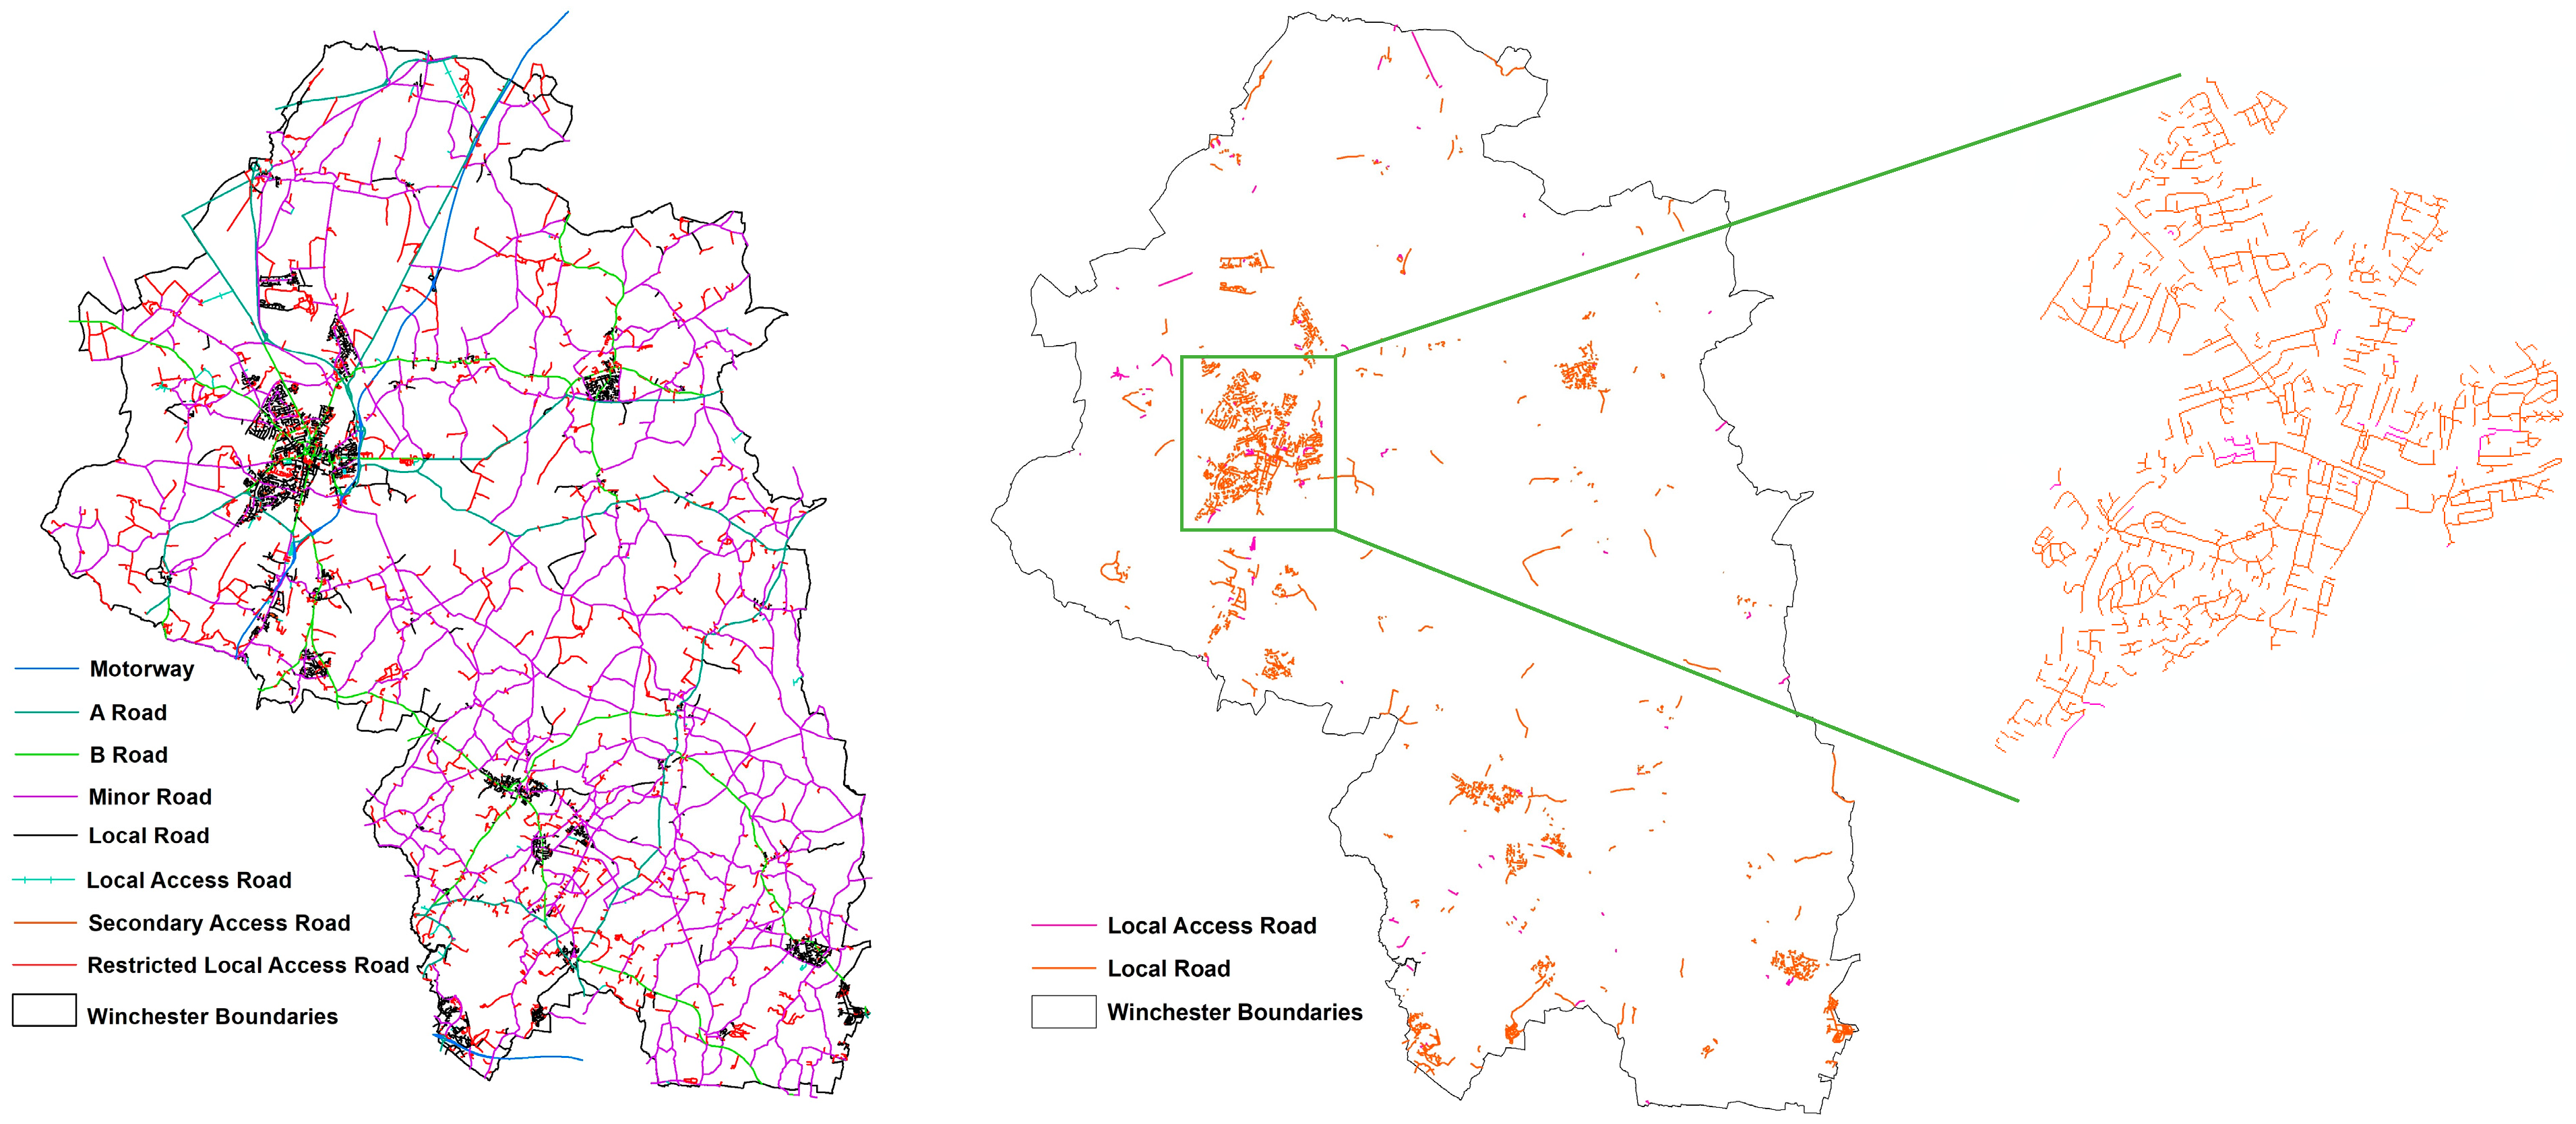
When applying the first three exclusion criteria (constraints) to Winchester District (WD) road types (Figure 3), a total of 6262 road segments (65%) were excluded, including segments totalling 2442 restricted secondary-access roads, 2424 minor roads, 108 secondary-access roads, 42 motorways, 28 dual carriageways and 461 A-roads. When reviewing all road types within WD, the most common was found to be local roads (33%), followed by minor roads and restricted access roads (each accounting for 26% of road segments), with B-roads and A-roads only accounting for 8% and 5%, respectively. Of the remaining roads (3361 road segments), more than a third were concentrated within the City, with the vast majority (94%) being classified as a local road, see Figure 3.
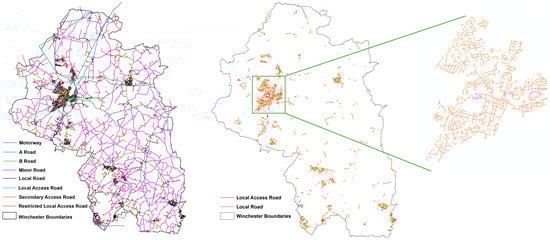
Figure 3.
All road types in Winchester District (left), and remaining potential road segments follow the initial three exclusion criteria (right). The square in the lower figure shows Winchester City’s local roads.
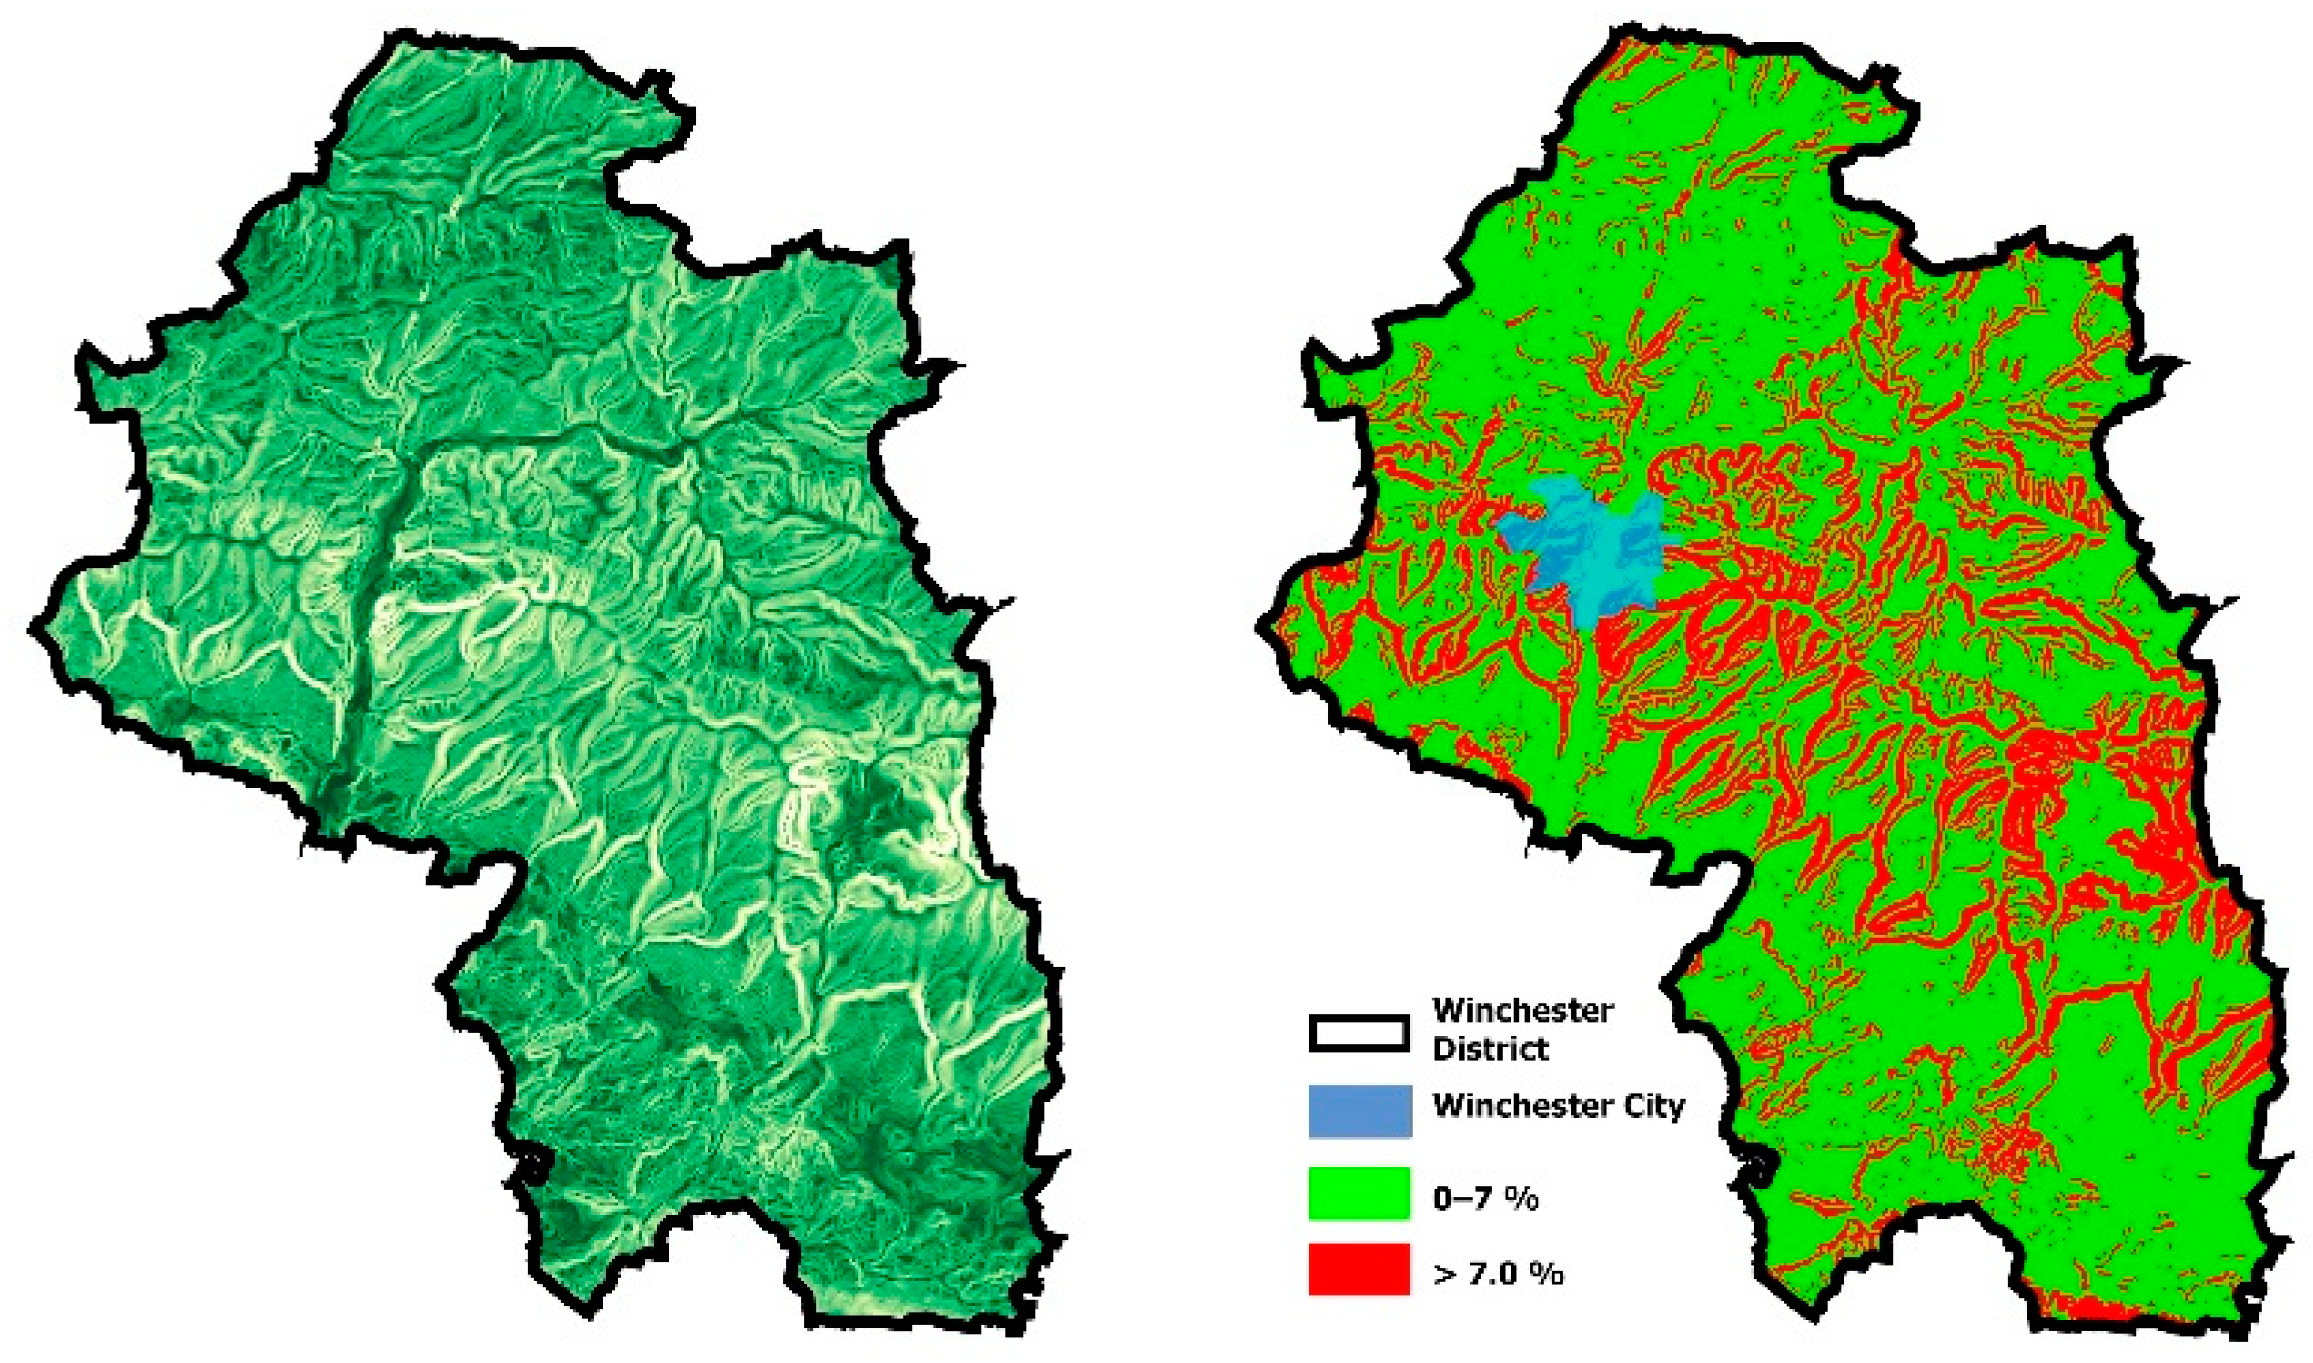
The road slope exclusion criterion concerns roads with a slope greater than 7%, which is applied to reduce the likelihood of breakdowns, and driving on an incline will result in excessive energy consumption [14]. In order to analyse the impact of this criterion, a Winchester District contour lines were extracted from the EDINA-Digimap Ordnance Survey Service [26] and converted into a slope map identifying any road segments on a slope greater than 7% (see the red areas on the right map in Figure 4). This process removed a further 35% of the remaining roads (1190), resulting in a reduced list of 2169 potential EV charging point locations.
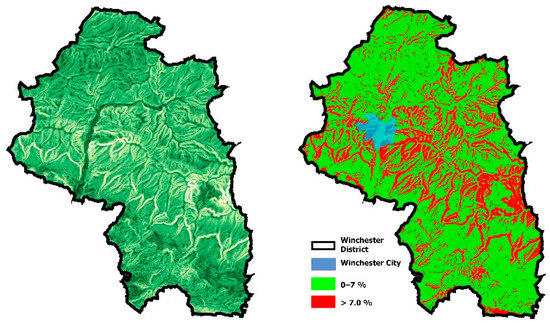
Figure 4.
Topographical map of Winchester District’s (left) remaining road segments available for EV charging following the exclusion of all segments on a slope of more than 7% (right).
As previously mentioned, all 33 EV charge points within the Winchester District are located within or next to a car park, and WCC has aspirations, as set out in the Electric Vehicle Charging Strategy, for almost 50 additional EV charging sites across WD car parks [11]. Therefore, the fifth and sixth constraint criteria were considered in the same step of the analysis.
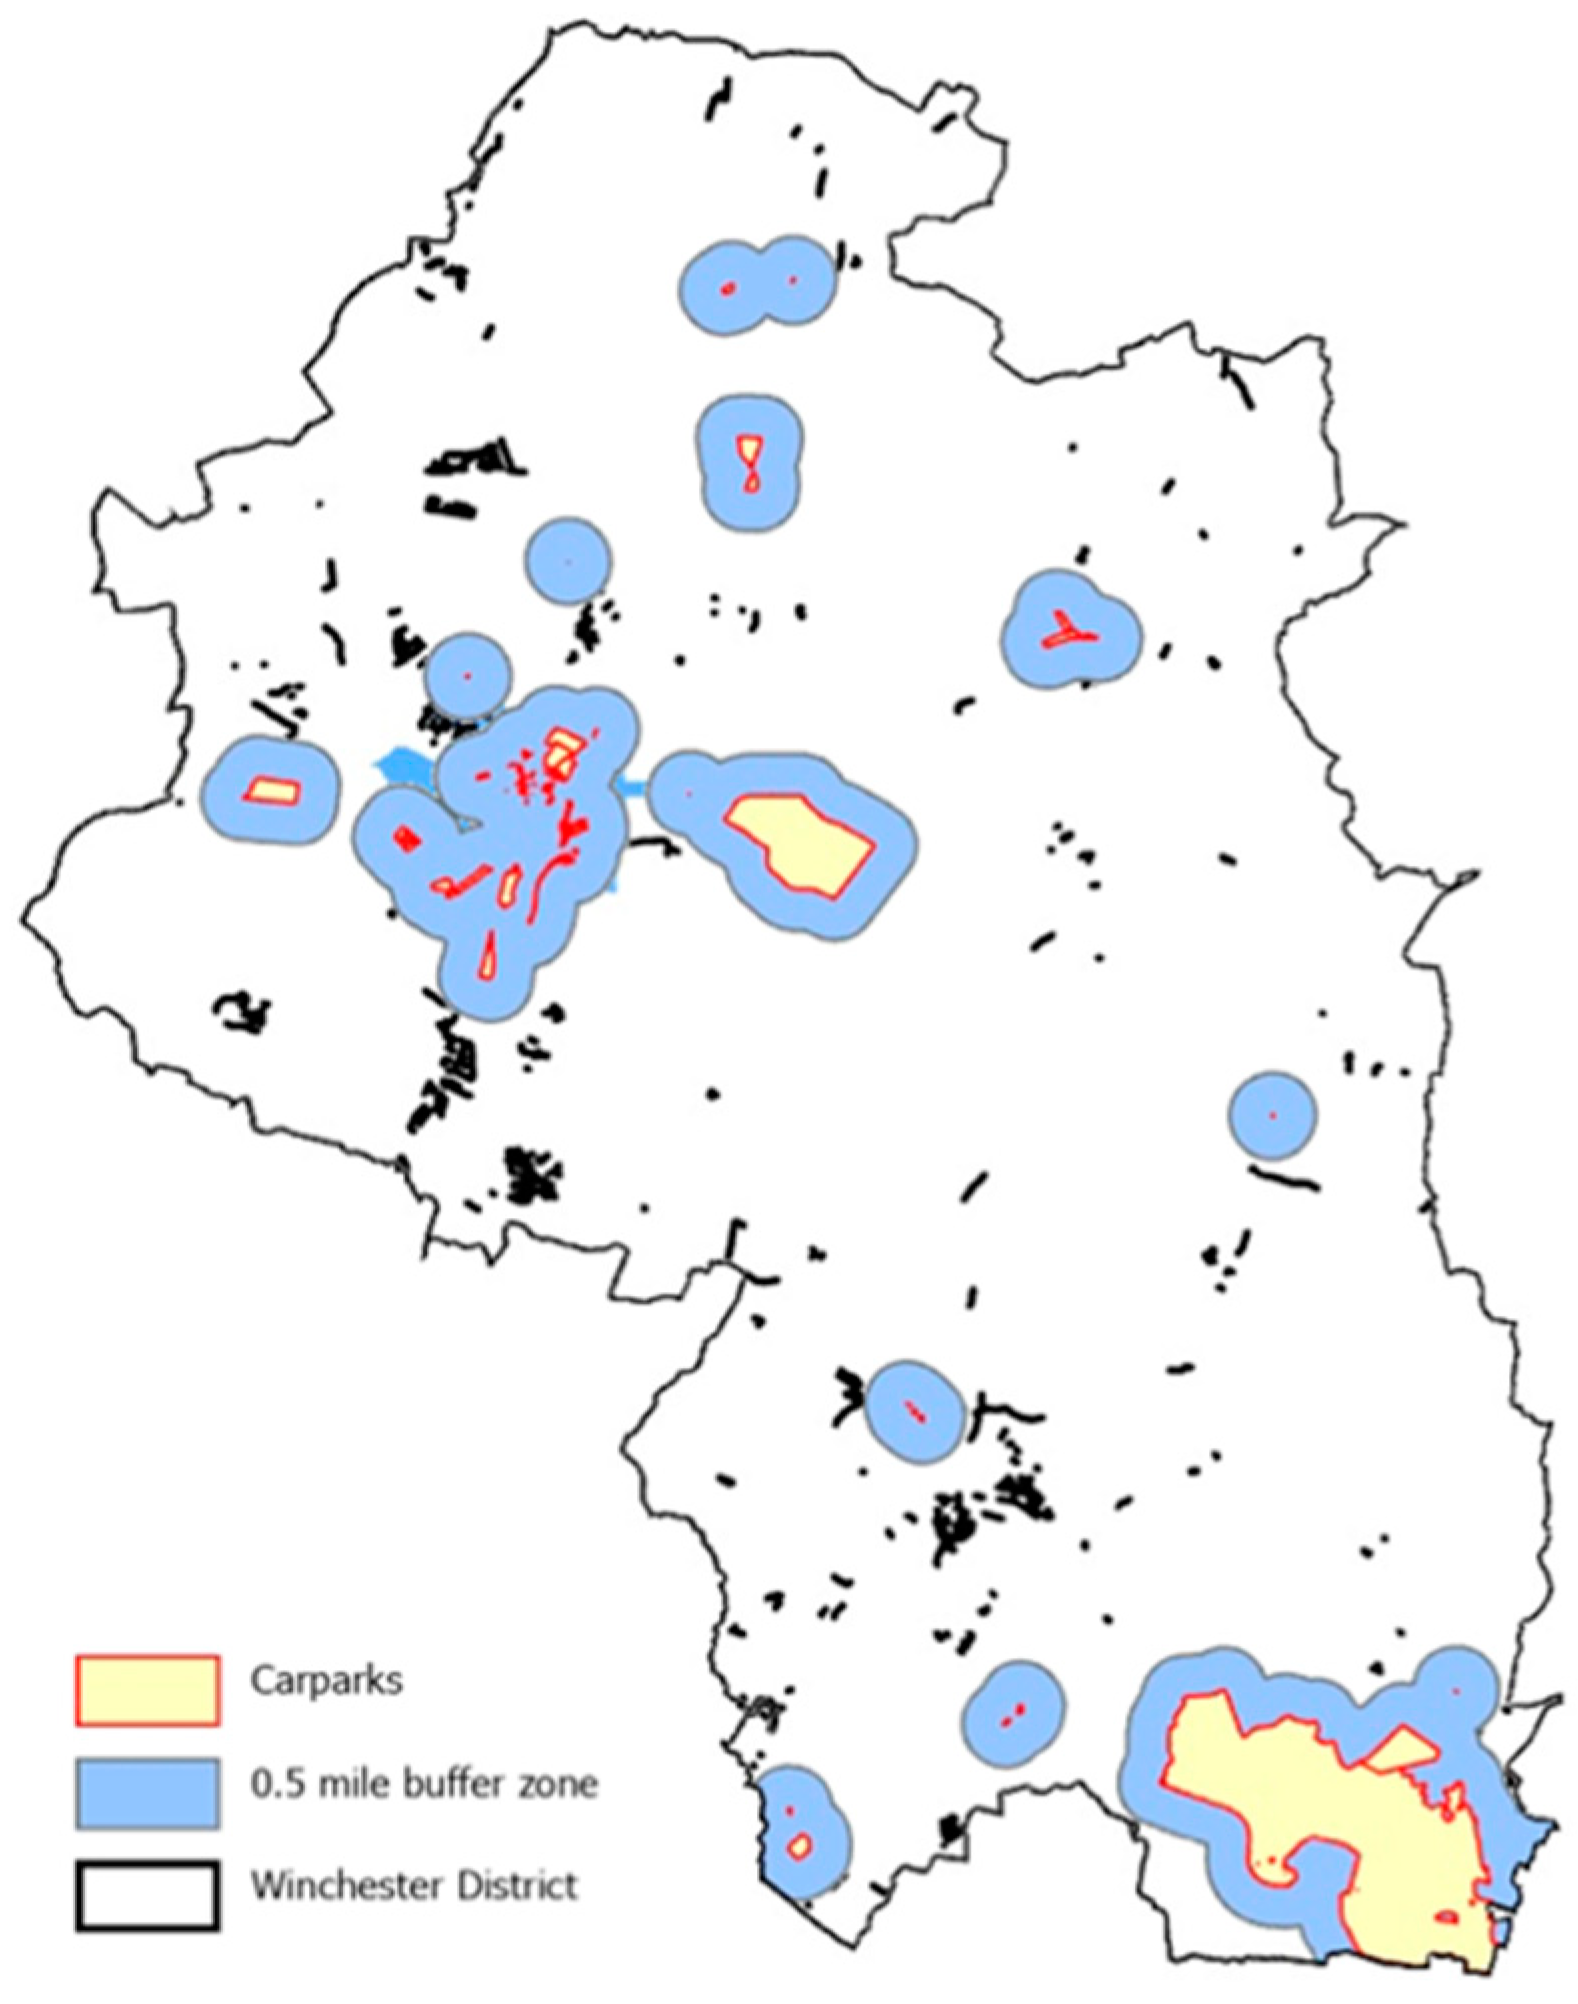
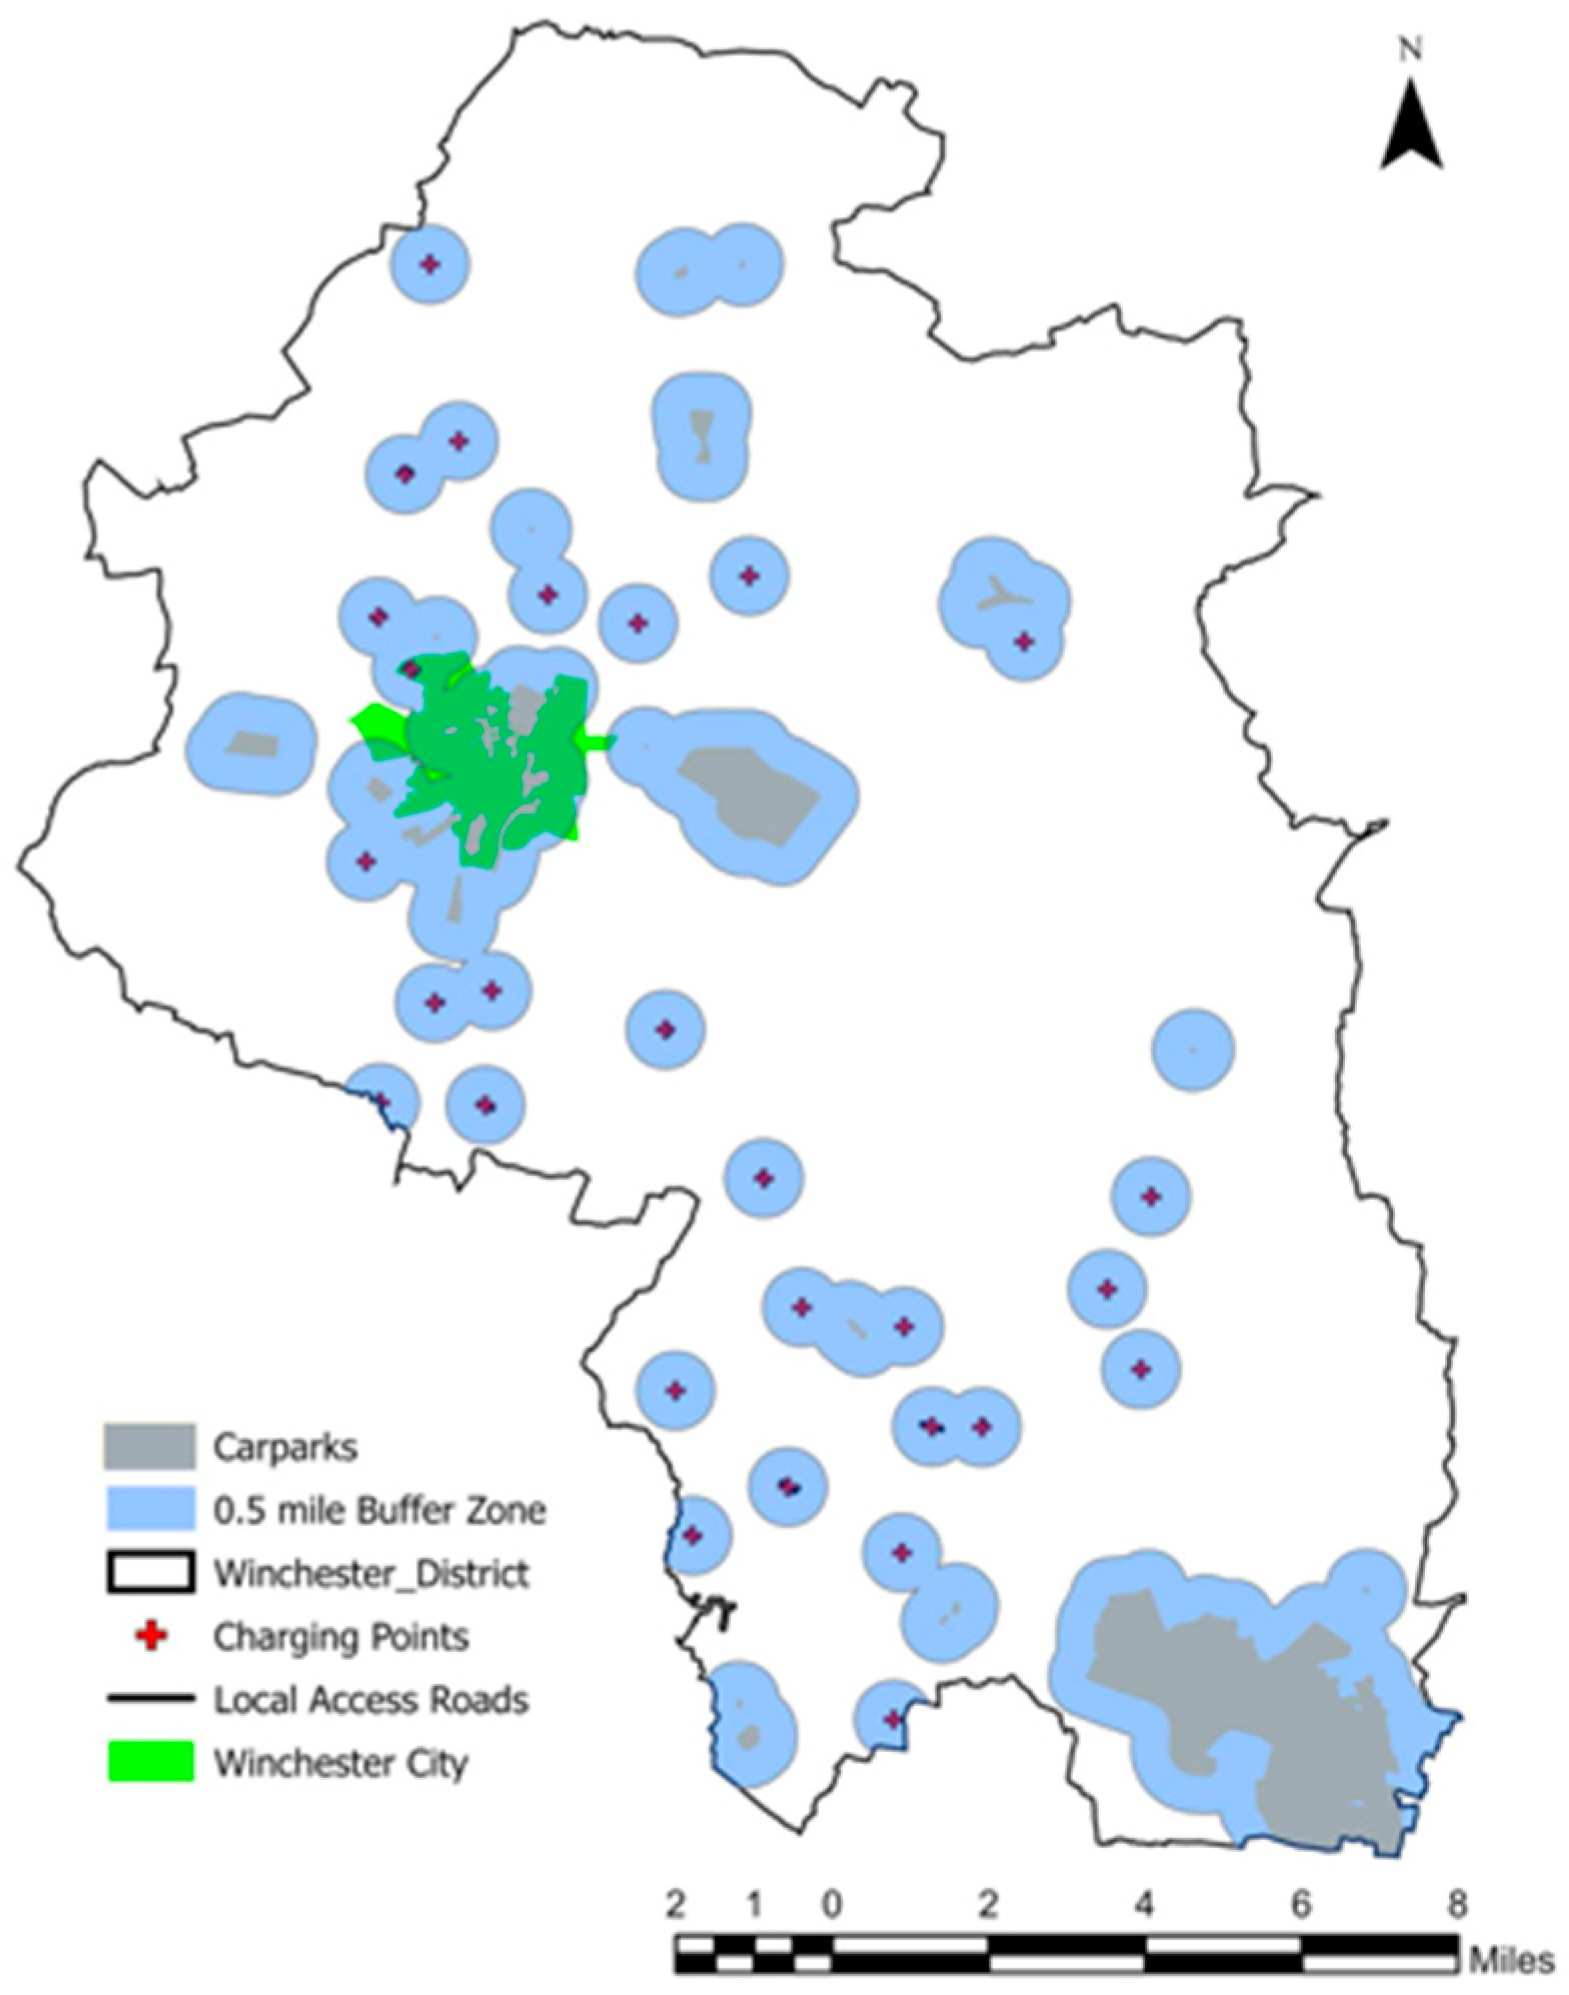
Walking distance is a critical concept within transportation and public health, and while such distance varies depending on the mode of transit, it is typically less for a slower local service (e.g., bus) than a faster service (e.g., train). Hence, a 0.5 miles distance or a 10 min walking time are considered the upper bound for an acceptable walking distance for a car owner [27,28]. Therefore, a 0.5-mile radius buffer zone was mapped around all suitably sized car parks—at least 25 parking bays (Figure 5)—excluding all roads within the buffer zone. This reduced the available road segments by a further 42%, down to 903, with relatively few remaining road segments within Winchester City as a result of the relatively high density of car parks within the city. Table 3 shows the idealised list of suitability factor criteria considered in the analysis.
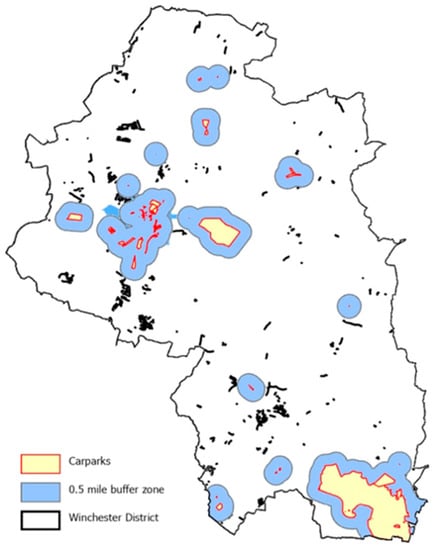
Figure 5.
Remaining suitable road segments following car park buffer zone mapping.
Table 3.
Table of suitability factor criteria.
In the AHP analysis, only two suitability criteria (proximity to fuel stations and population distribution) were used to find the most suitable locations for the EV charging point within the district. The analyses were augmented by consideration of the other three suitability factors mentioned in Table 3 (low-voltage electrical network, off-road parking and EV ownership) through the utilisation of the Visual Validation methodology mentioned in Section 4.2.
The visual imagery of Google Earth® allowed for site inspection and is used to validate the selected road segments to ensure all suitability and exclusion criteria are met. For the final suitability factor, EV ownership distribution, the data were only available at the postcode district level [10] and has been omitted because while it may assist in ranking the likely short-term usage, the increasing growth in the EV market means this data are likely to become invalid. Additionally, if an area has a low concentration of EVs it could be argued that it is more suited for charging facilities in order to increase take-up.
Until recently, electric vehicles have been considered to be a relatively expensive choice compared to traditional petrol or diesel cars. By the end of 2022, however, it is expected that new EVs will have a similar price to an equivalent internal combustion vehicle [29], and this price gap is expected to shrink even further as a result of the ban on the sale of new petrol and diesel cars by 2030 [7]. The predicted reduction in price and likely increase in EV ownership leading to a larger pre-owned market should help remove the financial barrier for EV purchases, with them likely to become a reliable option for all buyers regardless of their standard of living [29].
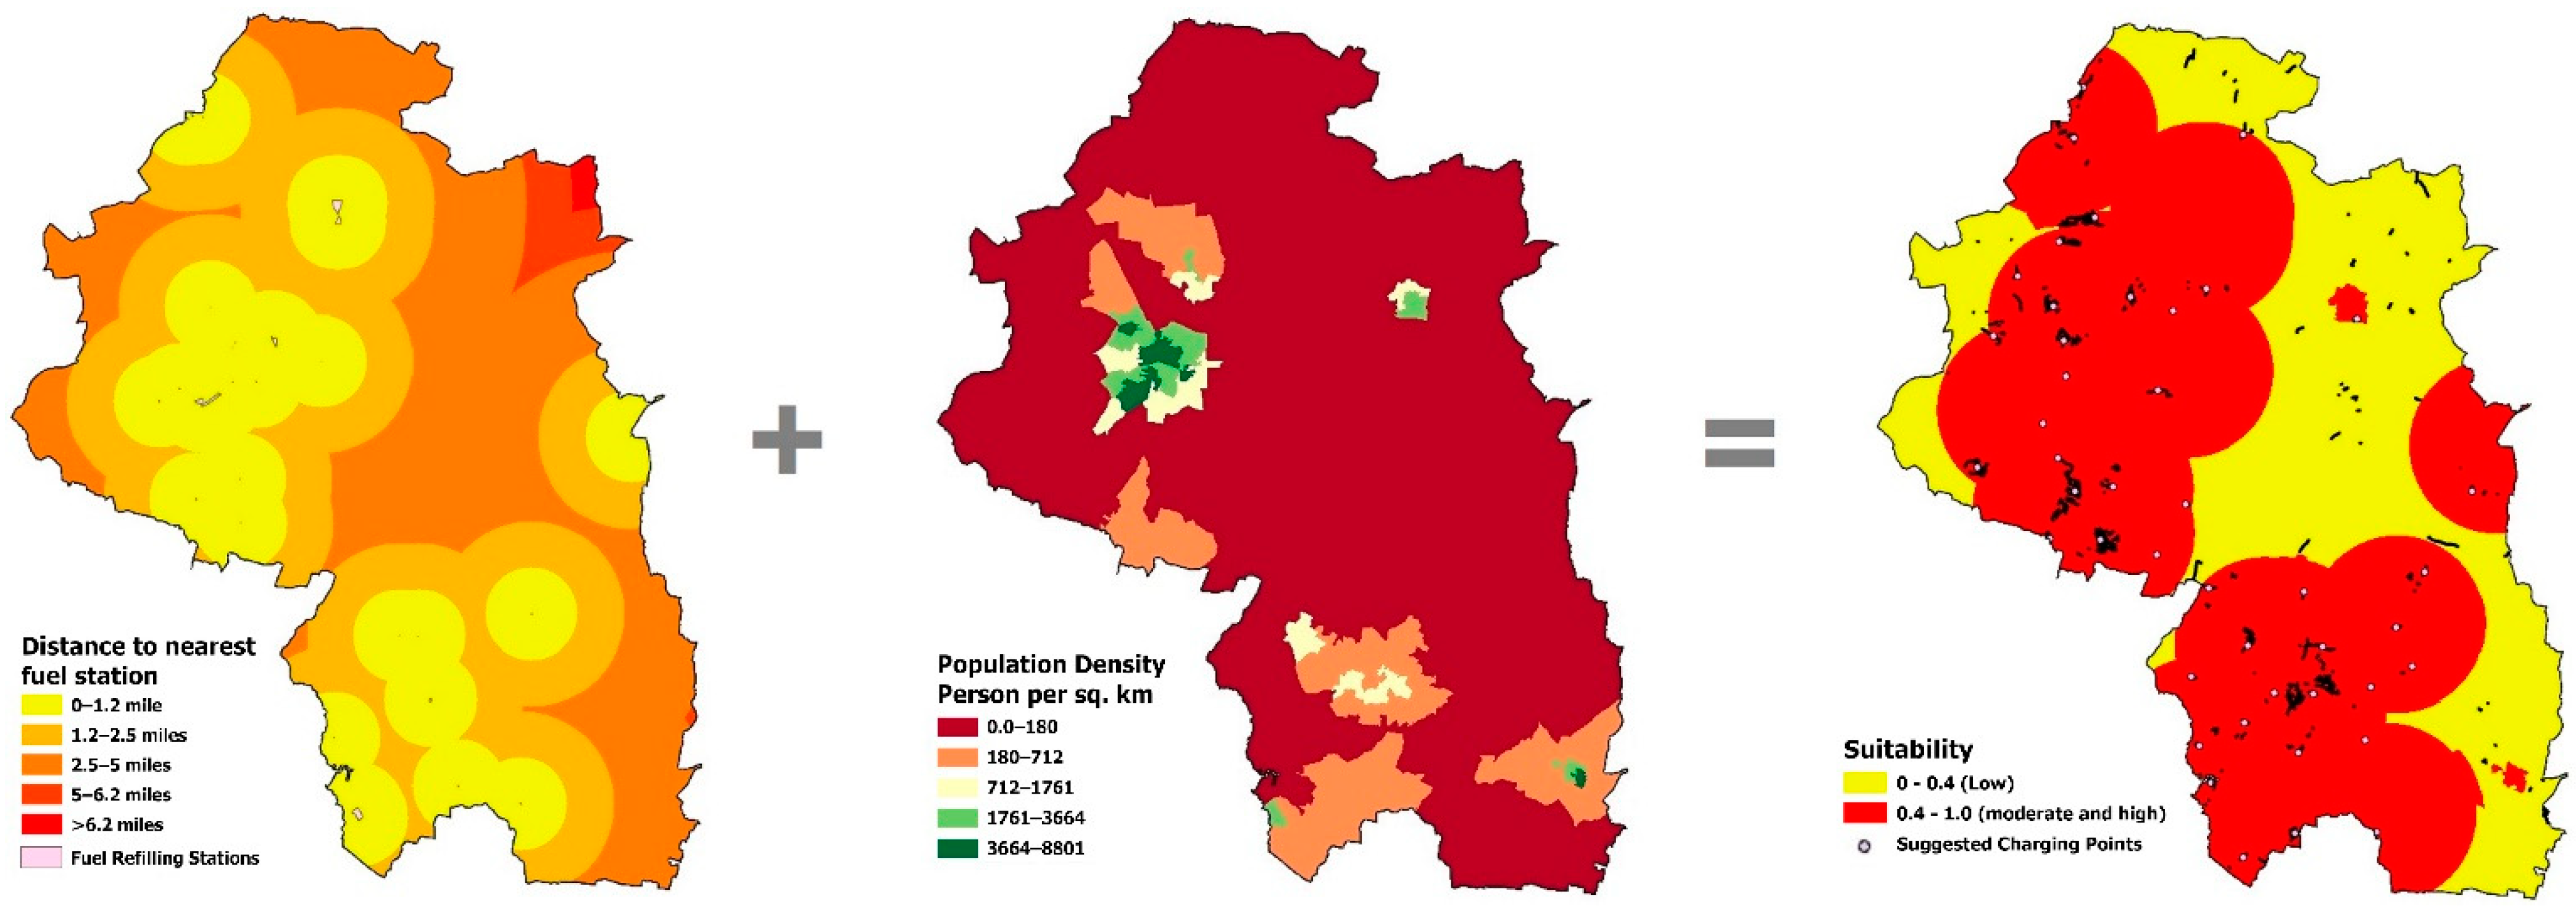
With only the first two factors or criteria of Table 3 being considered, these factors were given equal weighting when considering the factors’ aggregation, with cells scored based upon their proximity to the nearest fuel station and on their population density. Figure 6 shows the process, with the final suitability map revealing an exclusion of roads within areas of low population density (<180 people/km2) and a considerable distance from a petrol station (>2.5 miles), as indicated by the yellow area within the combined suitability map.
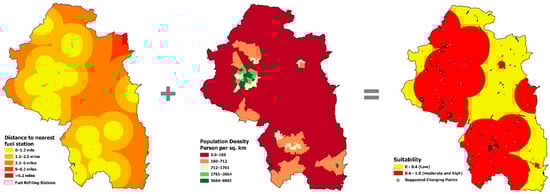
Figure 6.
Suitability factors mapping for Winchester District. Petrol station locations’ (left) population distribution (centre), and combined suitability map (right).
As can be seen from the combined suitability map in Figure 6, under the agreed constraints, our analysis determined that 44 road segments are suitable for on-road EV charging in Winchester District, with 4 of these located within the Winchester City boundaries.
4.1. Visual Validation and Final Results
The last stage in the suitability process is to check on the accuracy of the modelling and analysis of the predicted charging points. Ordinarily, this would be conducted through a sample of site visits. However, due to COVID-19, this was conducted using Google Earth® street imagery as follows. The research was conducted in the period of total lockdown in England, where only essential trips were allowed. The selected GIS street segments were converted to KLM (Keyhole Markup Language) files, compatible with Google Earth Pro® (Figure 7), where the validation process was configured to check on the following three factors: (i) road slope, (ii) proximity to a populated area and (iii) availability to park on the road. The methods for establishing these are discussed below.
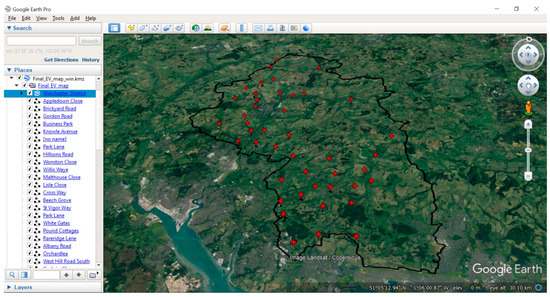
Figure 7.
Google Earth® map of Winchester District populated with the potential 44 EV charging points.
Road Slop visual check was accomplished by using the (Show Elevation Profile) tool available in Google Earth Pro®. The Elevation tool can draw the elevation profile for a path of the potential road location. Proximity to a populated area visual check is accomplished by applying the Map Length Tool inside Google Earth Pro® to ensure that the suggested charging point is in a range of 10 min walking (0.5 a mile) to at least 10 residential destinations. The availability to park on the road was established by visual check of parking places and securing the required minimum dimensions for the charging point layout. The minimum dimensions for the parking space are 2 m wide and 5 m long with a minimum of 1.5 m of pavement. Some assessed roads do not fill the requirements as they are narrow, but some have a small parking space, for example, Park Lane road (Table 4).
Table 4.
Optimal on-road EV charging points process. Green: No further action; Orange: Attempt to relocate; Red: Excluded.
All 44 prospective sites were found to have a suitable incline of less than 7%, and eight road segments (charging points sites) were found to be at a substantial distance from populated areas and so were excluded from the site recommendation list. These roads were deemed unsuitable but were picked up due to the granularity of the population density data, which would ideally have been considered at the postcode level (which are not available for the analysis).
The availability to park was assessed for the remaining 36 road segments, from which 19 were found to be unsuitable requiring relocation. After considering the locations, of the 19 road segments, eight out of these were excluded due to the lack of suitable, nearby, available roads. Hence, after the visual validation, the total number of proposed on-road sites for EV charging was reduced to 28 (Figure 8). Examples of the visual verification process are shown in Figure 9, while Table 4 provides the full tabulated verification process. The final list of roads is given in Table 5; last column of the table showed that all of the remaining roads are sited at least 0.5 miles from a car park, which confirms the optimisation in terms of cost of investment.

Figure 8.
Revised siting of 28 on-road EV charging points for Winchester District.
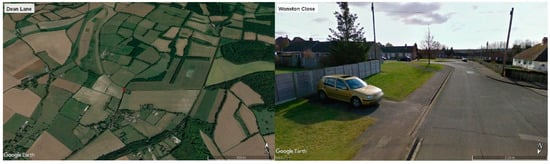
Figure 9.
Dean Lane (left) was excluded from further analysis as it was too far (1 mile radius) from a significantly populated area, while Wonston Close (right) is an example of a suitable location for installing an EV charging point.
Table 5.
Selected optimal EV on-road charging point locations for Winchester District and distance from nearest car park (A). The color intended to highlight the excluded streets due to lack of suitable grid cinnections.
4.2. Electrical Charging Infrastructure Characteristic
The driver for the research is to inform the local authority of the required infrastructure for EV charging based on the spatial and demographic analyses of their regions. In addition, the study aims to find where to install on-street charging points optimally. The outcome of the research is to arrive at an optimal distribution for these on-street charging points. In this section, we cover consideration of the electrical characteristics of the proposed charging points.
In the UK, most of the EV charging points consist of the following types: (i) AC standard (power transfer is less than 3.6 kW), (ii) AC fast (power transfer is less than 22 kW), (iii) AC rapid (power transfer is less than 47 kW) and (iv) DC rapid (power transfer is greater than 50 kW). Here, we address the provision of on-street public charging infrastructure under local authority-imposed cost-efficient criteria. According to the planning regulations, the recommended charging points output for on-street residential use should be less than 3.6 kW [30]. The average capital cost of this type of charging point is around £500 (~US $650) using grants provided by the “On-Street Residential Charge point Scheme” [31]. For this type of EV charger, the average vehicular charging time is around 8 h. Hence, to provide better availability for citizens, it is recommended that two charging points for each of the 25 identified on-street parking spaces (see Section 4.1) are installed. Following the planning recommendations [30], each charging location will have two separate 3 kW AC standard charging points (230 V AC ± 10% single-phase) to be installed to appropriately selected on-street electrical lighting poles. This will necessitate identifying these poles and their proximity to the charging points determined by the spatial analysis. In terms of the electrical charging characteristics, the 3 kW chargers at a low-voltage network of 250 V were recommended with specifications as per [30,31,32].
In order to identify the location of the required poles, additional visual verification was carried out to identify appropriate poles and the number of car parking spaces within Winchester. The latter determines the minimum required lamp post to deploy charging points. The final visual verification was completed using Google Street View to estimate the available on-street parking spaces and the number of lamp/electricity columns that exist in each street. This was done as follows: (a) virtually counting the number of car parking spaces around each of the identified 28 charging locations; (b) within the same location visually counting the electrical lamp poles; and (c) any location with less than the required number of lamp posts for the identified car parking spaces was excluded (Table 5). These visual considerations resulted in reducing the suggested charging locations from 28 to 20, as shown in Table 5. For example, “Knowle Avenue” street has 19 available parking spaces and needs two charging points, but there are no lamp/electricity columns on the street; therefore, the street was excluded.
In order to check the validity of the number of streetlamp posts within the considered geographical areas in Winchester District, the database of illuminated street furniture from the Hampshire County Council, which contains the District, [33], was imported into our GIS system. The results of the on-street visual investigations matched those of the said database.
As can be seen from Table 5, column 6 that the total number of charging points in the remaining streets is 94 in 20 different locations around Winchester district. In 2019 (the latest data available), the total number of EVs in Winchester is estimated to be around 3000 [10]. Assuming that each charging point will be utilised over 24 h and that each 3kW vehicle will require 8 h to be fully charged [30], the 94 charging points will service around 300 vehicles or 10% of the Winchester EVs.
5. Conclusions
The electric vehicle (EV) market is growing globally, and there is a need for providing a robust methodology for identifying charging infrastructure, particularly in cities. This work has at its core the development of such a methodology based on the multi-criteria Analytical Hierarchy Process (AHP) combined with GIS, to provide optimal spatial siting of EV points for real-world applications.
The case study selected represents one of the fastest-growing penetrations of EVs in cities in the UK. Winchester has, on average, 76.3% annual growth of cars registered as a plug-in, compared to the UK’s 31.3% and Hampshire County’s 37.9%. To identify appropriate EV charging point locations, the multi-criteria AHP assessment was based on applying the constraint and suitability criteria developed within the methodology supported by the Winchester City Council supplied data.
Applying the six constraint criteria reduced the potential road segments by 90% (down from over 9000 to 903). The derived combined suitability map (Figure 6) determined that 44 road segments are suitable for on-road EV charging points in Winchester District, and four of these are located within the Winchester City boundaries.
After site validation was undertaken visually on Google Earth maps; this process reduced the 44 locations to 28 optimal road segments (down from over 9000 analysed) listed in Table 5.
Planning regulation in the UK stipulates the use of 3 kW capacity charges for on-street charging installed on the street lighting posts infrastructure and evaluated the available alternatives based on the 3 kW charging point. In order to identify the location of the required poles, visual verification was carried out using Google Street View to estimate the available on-street parking spaces and the number of lamp/electricity columns that exist in each street. These considerations resulted in reducing the suggested charging locations from 25 to 20 as shown in Table 5. This was verified through the illuminated street furniture database of Hampshire County Council, which contains the District. The results of the on-street visual investigations matched those of the said database. The final number of lamp posts for the various streets and their associated car parking places was determined to be 94. For the 3 kW charger, these 94 charging points will service around 300 vehicles or 23.1% of the Winchester EVs.
The presented methodology is overarching and covers the identified gap in knowledge as previous literature lacks the ability to evaluate a large number of alternatives (road segments). The tested methodology addressed relevant key criteria such as road type, road access, on-road parking availability, road slope, proximity to fuel stations, current/planned charging points, car parks proximity and population distributions.
As emphasised earlier, the driver for the research was to inform the local authority of the required infrastructure for EV charging through the development of the appropriate and robust methodology to provide the need evidence. The multi-criteria decision approach based on the Analytical Hierarchy Process (AHP) linked to site spatial assessment using GIS was developed to address the evidence required. The methodology focus was based on the spatial and demographic analyses of Winchester District and how to optimally provide the required charging points for the identified demographics. The outcomes provided here also gave further considerations of the electrical infrastructure of the proposed charging points based on current UK regulations, as discussed in Section 4.2. Concerning the condition of the low-voltage electrical network, the data were not made available by the local distribution network operator (DNO) due to security issues. Nevertheless, as far as the publicly available information on substations around Winchester [8,34], there seem to be no constraints on grid capacity, and the considered charging points represents a small load on the infrastructure. Furthermore, the conducted visual verification method was employed to ensure that the suggested locations have a suitable connection to install the standard (3 kW) EVs charging points.
Future studies using the developed methodology will be aimed at expanding the charging points, with some being at enhanced capacity as the regulations allow. This will necessitate full consideration of the resilience of the low-voltage electrical network in such a way as to eliminate security concerns through discussion with the DNO. In addition, future research will also develop local-authority-led suitability factors, taking into account demographic factors such as age, income and understanding of distance to travel (gathered through surveys), which can have their own relative weights in an AHP analysis with surveyed expert input [2] to further optimise the siting of on-road EV charging stations for the specific needs and requirements of the many local authorities in the region.
Development of local-authority-led suitability factors and maps are important to create evidence-based policy and investment drivers, and this and future work is contributing to providing evidence for such policy needs. In addition, the methodology is now being applied to sites in Saudi Arabia and Kuwait. These two countries provide contrasting environments to those experienced in the UK, including a nascent proliferation of EVs, policy drivers and the general acceptability of EVs in an oil dominated region. Hence, this methodology, coupled with an expert input survey, is currently being planned to further optimise the siting of on-road EV charging stations in these countries and compare the results with our case study.
Author Contributions
Overall research concept A.S.B., conceptualization, M.M., P.T. and A.S.B.; methodology, M.M. and P.T.; software, M.M.; validation, M.M. and P.T.; formal analysis, M.M. and P.T.; investigation, M.M. and P.T.; resources, A.S.B., N.W., A.S.A. and H.H.; data curation, M.M. and P.T.; writing—original draft preparation, M.M.; writing—review and editing, M.M., A.S.B. and P.T.; visualisation, M.M. and P.T.; supervision, A.S.B.; project administration, A.S.B.; funding acquisition, A.S.B., N.W., A.S.A. All authors have read and agreed to the published version of the manuscript.
Funding
This research was funded by Winchester City Council and the Ministry of Education in Saudi Arabia through project number 714; UKRI EPSRC grants EP/G06394X/1, EP/T023074/1, EP/R030391/1.
Acknowledgments
This work is part of the activities of the Energy and Climate Change Division and the Sustainable Energy Research Group in the School of Engineering at the University of Southampton (www.energy.soton.ac.uk–The site was last accessed on 28 March 2022), UK.
Conflicts of Interest
The authors declare no conflict of interest.
References
- Department for Businssses (Energy & Industrial Strategy). UK Becomes the First Major Economy to Pass Net Zero Emissions Law. June 2019. Available online: https://bit.ly/2YvP9pG (accessed on 7 October 2021).
- Bahaj, A.; Turner, P.; Mahdy, M.; Leggett, S.; Wise, N.; Alghamdi, A. Environmental assessment platform for cities racing to net zero. In Journal of Physics: Conference Series; IOP Publishing: Bristol, UK, 2021. [Google Scholar]
- Institute for Government. UK Emissions by Sector. February 2020. Available online: https://bit.ly/3iFIujG (accessed on 7 October 2021).
- Climate Change Committee. Net Zero—The UK’s Contribution to Stopping Global Warming. May 2019. Available online: https://bit.ly/2YtGMuI (accessed on 7 October 2021).
- Climate Emergency. List of Councils Who Have Declared a Climate Emergency. February 2021. Available online: https://bit.ly/2ZgJtR6 (accessed on 7 October 2021).
- Winchester City Council. Carbon Neutrality Action Plan; Winchester City Council: Wichester, UK, 2021.
- Department for Business (Energy and Industrial Strategy). Government Takes Historic Step Towards Net-Zero with End of Sale of New Petrol and Diesel Cars by 2030. Available online: https://bit.ly/2WNPxz4 (accessed on 7 October 2021).
- Horizon Power and Energy. Electric Vehicle Charging Study for Winchester City Centre and District; Horizon Power and Energy: Winchister, UK, 2018. [Google Scholar]
- Department for Transport and Driver and Vehicle Licensing. All Vehicles (VEH01). December 2020. Available online: https://bit.ly/2YressK (accessed on 7 October 2021).
- Department for Transport and Driver and Vehicle Licensing. VEH0134 Licensed Ultra-Low Emissions Vehicles by Postcode District: United Kingdom. December 2020. Available online: https://bit.ly/3uQ6WDP (accessed on 7 October 2021).
- Hirst, D.; Winnett, J.; Hinson, S. Electric Vehicles and Infrastructure; House of Commons: London, UK, 2021. [Google Scholar]
- Winchester City Council. District’s Electric Vehicle Charging Point Roll out Beings in Denmead. November 2020. Available online: https://bit.ly/3Fsr4Rm (accessed on 7 October 2021).
- Winchester City Council. Nearly 50 Electric Vehicle Charging Points Earmarked for the Winchester District. 2020. Available online: https://bit.ly/3aeeW8r (accessed on 7 October 2021).
- Erbaş, M.; Kabak, M.; Özceylan, E.; Çetinkaya, C. Optimal siting of electric vehicle charging stations: A GIS-based fuzzy Multi-Criteria Decision Analysis. Energy 2018, 163, 1017–1031. [Google Scholar] [CrossRef]
- Guler, D.; Yomralioglu, T. Suitable location selection for the electric vehicle fast charging station with AHP and fuzzy AHP methods using GIS. Ann. GIS 2020, 26, 169–189. [Google Scholar] [CrossRef] [Green Version]
- Guo, S.; Zhao, H. Optimal site selection of electric vehicle charging station by using fuzzy TOPSIS based on sustainability perspective. Appl. Energy 2015, 158, 39–402. [Google Scholar] [CrossRef]
- Sierpiński, G.; Staniek, M.; Kłos, M.J. Decision making support for local authorities choosing the method for siting of in-city ev charging stations. Energies 2020, 13, 4682. [Google Scholar] [CrossRef]
- Zhang, Y.; Iman, K. A multi-factor GIS method to identify optimal geographic locations for electric vehicle (EV) charging stations. Proc. Int. Cartogr. Assoc. 2017, 1, 127. [Google Scholar] [CrossRef] [Green Version]
- Bahaj, A.S.; Mahdy, M.; Alghamdi, A.S.; Richards, D.J. New approach to determine the Importance Index for developing offshore wind energy potential sites: Supported by UK and Arabian Peninsula case studies. Renew. Energy 2020, 152, 441–457. [Google Scholar] [CrossRef]
- Mahdy, M.; Bahaj, A.S. Multi criteria decision analysis for offshore wind energy potential in Egypt. Renew. Energy 2018, 118, 278–289. [Google Scholar] [CrossRef]
- Saaty, T.L. Decision making with the analytic hierarchy process. Int. J. Serv. Sci. 2008, 1, 83–98. Available online: https://www.rafikulislam.com/uploads/resourses/197245512559a37aadea6d.pdf (accessed on 7 October 2021).
- Saaty, T.L. Decision making with the analytic hierarchy process. Sci. Iran. 2002, 9, 215–229. Available online: http://scientiairanica.sharif.edu/article_2696.html (accessed on 7 October 2021).
- Mahdy, M.; Bahaj, A.S.; Alghamdi, A.S. Offshore wind energy potential around the east coast of the Red Sea, KSA. In Proceedings of the IEA SHC International Conference on Solar Heating and Cooling for Buildings and Industry, Abu Dhabi, United Arab Emirates, 29 October–2 November 2017. [Google Scholar]
- Department for Transport. The Highway Code. March 2021. Available online: https://bit.ly/3iBL1vi (accessed on 7 October 2021).
- Chen, T.; Zhang, X.-P.; Wang, J.; Li, J.; Wu, C.; Hu, M.; Bian, H. A review on electric vehicle charging infrastructure development in the UK. J. Mod. Power Syst. Clean Energy 2020, 8, 193–205. [Google Scholar] [CrossRef]
- Sutton, E.; Medyckyj-Scott, D.; Urwin, T. The EDINA Digimap® Service–10 Years On. Cartogr. J. 2007, 44, 268–275. [Google Scholar] [CrossRef]
- Hoback, A.; Anderson, S.; Dutta, U. True walking distance to transit. Transp. Plan. Technol. 2008, 31, 681–692. [Google Scholar] [CrossRef]
- Walker, J. Walking Distance to Transit. April 2011. Available online: https://bit.ly/3DbHxrk (accessed on 7 October 2021).
- Wu, H.; Alberts, G.; Hopper, J.; Walton, B. New Market. New Entrants. New Challenges. In Battery Electric Vehicles; Deloitte LLP: London, UK, 2019; Available online: https://bit.ly/3oH2k20 (accessed on 7 October 2021).
- London, H. Planning Advice Note: Installing Electric Vehicle Charging Points; Transport for London: London, UK, 2021.
- Office for Zero Emission Vehicles. On-Street Residential Chargepoint Scheme Guidance for Local Authorities. Available online: https://bit.ly/3nEBQfZ (accessed on 20 January 2022).
- UK Department for Transport. Electric Vehicle Charging in Residential and Non-Residential Buildings; UK Department for Transport: London, UK, 2019.
- Hampshire County Council. Ampshire Illuminated Street Furniture. Available online: https://bit.ly/33BDSa7 (accessed on 20 January 2022).
- Scottish and Southern Electricity Networks. EV Connections. Available online: www.ssen.co.uk/Connections/EVconnections/ (accessed on 1 March 2022).


Publisher’s Note: MDPI stays neutral with regard to jurisdictional claims in published maps and institutional affiliations. |
© 2022 by the authors. Licensee MDPI, Basel, Switzerland. This article is an open access article distributed under the terms and conditions of the Creative Commons Attribution (CC BY) license (https://creativecommons.org/licenses/by/4.0/).