Abstract
The use of CO2-based hydrocarbons plays a crucial role in reducing the climate footprint for several industry sectors, such as the chemical industry. Recent studies showed that regions which are favorable for the production of CO2-based hydrocarbons from an energy perspective often do not provide concentrated point sources for CO2, which leads to an increased environmental impact due to the higher energy demand of direct air capture processes. Thus, producing H2 in regions with high renewable power potential and transporting it to industrialized regions with concentrated CO2 point sources could provide favorable options for the whole process chain. The aim of this study is to analyze and compare pathways to produce CO2-based methanol in Germany using a local CO2 point source in combination with the import of H2 per pipeline or per ship as well as H2 produced in Germany. The environmental and economic performance of the pathways are assessed using life cycle assessment and cost analysis. As environmental indicators, the climate, material, water, and land footprints were calculated. The pathway that uses H2 produced with electricity from offshore wind parks in Germany shows the least environmental impacts, whereas the import via pipeline shows the best results among the importing pathways. The production costs are the lowest for import via pipeline now and in the near future. Import via ship is only cost-efficient in the status quo if waste heat sources are available, but it could be more competitive in the future if more energy and cost-efficient options for regional H2 distribution are available. It is shown that the climate mitigation effect is more cost-effective if the H2 is produced domestically or imported via pipeline. Compared to the import of CO2-based methanol, the analyzed H2 import pathways show a comparable (pipeline) or worse environmental and economic performance (ship).
1. Introduction
The dominant role of fossil resource use in the global energy and industry sectors continues to cause the major share of Green House Gases (GHG) emissions and a highly linear use of resources [1,2]. This strongly impels climate change in combination with a depletion of finite resources. Thus, the dismissal of fossil resource use is required to reduce GHG emissions and to use resources in a more circular way.
Two different concepts are discussed to end fossil resource use in industrial processes, namely decarbonization and defossilization. The former describes a reduction of carbon use in general and aims at processes where the carbon use can be substituted by different technologies, e.g., in the electricity sector [3,4]. The latter describes a substitution of fossil carbon sources with different carbon sources, such as CO2 or biomass [5].
Hydrogen (H2), produced with renewable electricity, is considered an important factor for decarbonization and defossilization strategies in multiple industry sectors. H2 is produced via the electrolysis of water and represents an energy carrier that can be combusted without the emission of CO2. Thereby, it offers options for long-term storage and long-distance transport of volatile renewable electricity. Furthermore, it is required to substitute fossil resources in sectors where hydrocarbons cannot be directly substituted with electricity, e.g., in the chemical [6] or steel [7,8] industry. Thus, it is fundamental for climate-neutral energy and industry sectors, and a significant growth in the global H2 demand from 90 Mt (2020) to 175 Mt (2030) up to 570 Mt (2050) is estimated within the coming decades [9]. Independent from the subsequent application, a low climate footprint of H2 is a necessary premise to achieve climate benefits compared to fossil hydrocarbons [10]. Hence, regions with favorable conditions for renewable electricity generation are seen as promising locations for H2 production and export [6]. However, the production and especially the transport of H2 are still economically and technically challenging [11]. Further technological progress and cost reductions are necessary for H2 value chains to become a viable alternative to fossil fuels.
For the chemical industry, which is responsible for more than 12% of global crude oil use and around 1 Gt of direct CO2 emissions per year [12], neglecting fossil resources constitutes a challenge in two fields [13]. First, fossil-based heat and electricity production must be decarbonized using renewable energy sources. Second, fossil-based hydrocarbons must be substituted as carbon sources to produce organic chemicals. For the latter, a broad defossilization is necessary, which requires the exploration of new carbon sources [14]. Here, the use of CO2 is considered an important step to abate fossil carbon sources via Carbon Dioxide Capture and Utilization (CCU) technologies [15]. The use of CO2 opens up a broad field of possible synthesis pathways [16], while protecting biodiversity and the natural resources of land and water, whose use would be intensified in an unsustainable way if the chemical sector increases the use of biomass as a carbon source [17,18,19]. In addition, a recent study found that the application of CCU technologies could contribute to several other Sustainable Development Goals of the United Nations [20]. For the production of CO2-based chemicals, the use of renewable electricity [21] or H2 produced with renewable energy is elementary [22,23,24]. Therefore, the demand for H2 by the global chemical industry, which is already the largest consumer, is expected to double from 70 Mt in 2020 to 140 Mt in 2050. In addition, the current H2 sources, mainly natural gas, need to be substituted, which makes the chemical industry one of largest consumers for low-carbon H2 now and in the future [6]. Furthermore, unavoidable CO2 point sources or direct air capture should be used to source the necessary CO2 to avoid lock-in effects and the delay of emission reductions [5]. From an economic perspective, CO2-based chemicals are not yet competitive, but expected cost decreases in plant and energy costs could lead to a viable production in the near future [25,26]. At the same time, the use of CO2-based chemicals in high-value markets could make their production viable already today without causing significant cost increases at the end of the value chain [27].
For the German chemical industry, which constitutes the largest chemical industry in Europe and the fourth largest in the world [28], this imposes specific opportunities and challenges. The use of CO2 as a carbon source offers the chance to decrease the respective GHG emissions of more than 100 Mt CO2-equivalents per year, especially in the field of scope 3 emissions, which account for about 50% of the total emissions. Furthermore, the current rate of secondary carbon input, which is below 1% [5], can be increased. Due to the high rate of industrialization in Germany, unavoidable CO2 point sources will most likely continue to be available, offering sufficient amounts of CO2 in comparably high concentrations [29]. However, the substitution of fossil carbon sources with CO2 would require renewable energy in a quantity that corresponds to the current net production of electricity in Germany and most probably exceeds the future availability of renewable electricity [5,30,31]. Thus, the import of CO2-based chemicals seems like a promising pathway, even though domestic production offers environmental and economic advantages [26].
Other options to counter this bottleneck for renewable energy are the construction of offshore wind parks owned or financed by specific industry sectors or the import of H2 from regions with favorable conditions for renewable electricity production. Major chemical companies in Germany currently pursue both options. The company BASF is constructing a 1.5 GW wind park in the North Sea together with Vattenfall. The company Covestro signed a long-term purchase agreement of 100 kt of H2 per year that will be produced in Australia [32,33]. Furthermore, a consortium of several European grid operators for natural gas is planning to convert part of the current natural gas transportation and distribution pipelines into H2 pipelines and combine them with new pipelines that also connect countries in Northern Africa to the European grid [34]. These options both enable the combination of local CO2 sources with imported H2 or offshore electricity production. Compared to the import of hydrocarbons, this offers a higher domestic value creation and supply security for carbon. In addition, CO2 point sources are rare in regions favorable for renewable electricity production [26], wherefore the necessity to source CO2 from the atmosphere is avoided, which significantly reduces the environmental impacts of CO2-based chemical production.
However, the environmental impacts as well as the economic situation of H2 production with electricity from offshore wind parks or its import to Germany in combination with a further use in chemical production have not been studied yet. Therefore, the research question of this article is the following: What are the environmental impacts and production costs related with the combination of imported H2 and a CO2 point sources in Germany, compared to the use of H2 produced in Germany using electricity from offshore wind parks? As a case example, the production of CO2-based methanol (MeOH) was chosen due to its broad application options as a base chemical.
This study extends the existing research by combining the analysis of spatially distributed H2 production and transport with that of CCU technologies. The presented results allow a thorough characterization of CO2-based methanol production using H2 transported over a long distance from an environmental and economic perspective. The analysis has the following structure: (1) Description of the production systems and assessment methods. (2) Assessment of the environmental and economic performance using Life Cycle Assessment (LCA) and cost analysis. (3) Uncertainty assessment using Monte Carlo and sensitivity analysis.
2. Materials and Methods
2.1. Location Selection
The analysis of possible export countries for H2 or hydrocarbons to the German or European market was part of several studies in the past [35,36,37]. The studies assessed the potential for renewable energy, which could be available for exports, economic aspects, technical aspects such as the availability of export infrastructure, as well as sociopolitical aspects such as the quality of bilateral relations or security. With respect to the necessary long-distance transport, three technologies are available, namely transport via H2 pipelines and via ship using Liquefied H2 (LH2) or Liquefied Organic Hydrogen Carriers (LOHC) [38,39,40]. Each of the technologies offers specific advantages and disadvantages. On the one hand, transport via pipeline offers economic and environmental advantages compared to ship transport [39], but its construction requires a lead-time of several years and limits the available export options. On the other hand, import via ship is more flexible, with shorter lead-times, and it enables longer transport distances [37]. Furthermore, LH2 is more costly than ship-transport via LOHC but causes less environmental impacts.
For the analysis in this article, Australia and Morocco were chosen as export countries. Both countries were identified as highly suitable for the import of H2 to Germany in the studies listed above. Furthermore, the combination of both countries allows a thorough comparison between the import via Pipeline (Morocco) and ship using LH2 and LOHC (both Australia) for the same use case. The exact locations for the H2 production systems were derived from Gerhardt et al., (2020) [41] for Morocco and from the Australian Government (2021) [42] for Australia. They are located in Southern Morocco and Western Australia. Both regions offer comparably high-capacity factors for wind and photovoltaic (PV) plants, which enables high-occupancy rates for the electrolyzer using hybrid wind-PV plants for electricity generation, which results in lower H2 production costs [43]. In addition, Western Australia is geologically suitable to use salt caverns as a storage option between H2 production and shipping [42]. Bremerhaven was chosen as the port of arrival in Germany. As transport distances, 2800 km (Morocco) and 18,000 km (Australia) were assumed. As input data for the capacity factors for the wind and PV plants, publicly available data from the global wind and solar atlas were used [44,45]. In general, the export from Morocco via ship would be possible as well; however, because of the environmental and economic advantages of the use of a pipeline [39], this option is not regarded in this article.
2.2. Environmental Assessment
The environmental impacts of the product systems were analyzed using LCA. The LCA study was carried out in accordance with international standards [46,47] and specific guidelines for the LCA of CO2-based processes [29,48]. As functional unit, 1 kg of MeOH was considered. This base chemical is already used as feedstock for a variety of chemical or polymer products. Its importance is expected to further rise in the future, since it represents a promising option for the defossilization of the chemical sector [49]. Neither the chemical composition nor the use or end-of-life phase differ between fossil- and CO2-based MeOH. Therefore, a cradle-to-gate analysis is sufficient in the context of this article. The environmental performance is analyzed by comparing the LCA results based on single impact categories. Like for the economic performance, a product system performs better if it shows lower values. The further calculation of an overall environmental performance that considers all impact categories in an aggregated manner was not part of this study. This would require the introduction of multi-criterial analysis, e.g., via the introduction of specific weighting systems, which would go beyond the scope of this study.
For the system modeling, the software openLCA was used in combination with the LCA database ecoinvent 3.5. Two types of uncertainty were regarded in the analysis. To include parameter uncertainty, specific parameter distribution derived from the available literature were regarded in the foreground system, and Monte Carlo Analysis (MCA) with 1000 runs was conducted for each product system. In addition, the uncertainty of the technical development of the product system is regarded with the help of a scenario analysis that considers improved technical parameters for the electrolyzer and expected structural changes (Table 1).

Table 1.
Considered structural changes in the scenario analysis. 1 Data for the grid mixes can be found in Supplementary Table S6.
The climate footprint and three resource footprints were applied as indicators for the impact assessment. Recent studies showed that this set of indicators is an efficient and effective way to estimate environmental pressures in LCA with comparably few indicators, because the combination of these four footprints covers more than 84% of the possible environmental impacts of a product system [50]. Thereby, the climate footprint estimates the environmental pressures of GHG emissions, and the three resource footprints (Material, Water, Land) give information about the pressures of natural resource extraction [51,52,53]. As footprint indicators, the Raw Material Input (RMI) and Total Material Requirement (TMR) were used for the material footprint, the occupation of area for the land footprint, and the AWARE (Available Water Remaining) method for the water footprint. For the latter, only evaporation losses were considered, because water incorporation is not seen as problematic for CCU technologies [26], and the calculation of water dilution requires more detailed data than available.
2.3. Economic Assessment
To enable a thorough comparison between the results of the LCA and economic assessments, identical system boundaries for both analyses were considered [54]. For the economic assessment, the Production Costs (PC) and the CO2-Avoidance Costs (AC) were calculated for the status quo, as well as for a 2030 scenario for each production pathway.
t: Period
i: Production Pathway
WACC: Weighted Average Costs of Capital
The PC are expressed as € per t produced chemical including the capital and operational costs for all required process steps. As capital costs, location-specific values were chosen based on an empirical analysis by Steffen (2020) [55]. The AC were calculated based on the PC and the results for the climate footprint. They indicate the respective costs to avoid the emission of one ton of CO2-equivalents, i.e., the economic efficiency of climate mitigation measures. As costs for fossil MeOH, the average net market price of the last five years was considered in the status quo. For the future, a yearly price increase of 2% was considered according to the stated policies scenario published by the IEA [56].
As for the LCA, the uncertainties of the parameters and the system development were regarded in the economic assessment. For each cost parameter, a range was derived from the literature for the status quo and the future that results in a minimum, mean, and maximum value for the PC and AC. In the scenario analysis, structural changes were considered as well. A detailed list of the considered cost parameters and their values in the status quo and in 2030 can be found in the Supplementary Table S7.
2.4. System Description
The analyzed production systems consist of the process steps electricity generation, water production and purification, H2 production, H2 transport (long distance), H2 transport (short distance), CO2 capture and MeOH synthesis (Figure 1). If necessary, storage options were included as well. It was assumed that the CO2 capture process and the MeOH synthesis would take place at a cement plant in the middle of Germany. For the MeOH production, the following five pathways were considered for H2 provision:
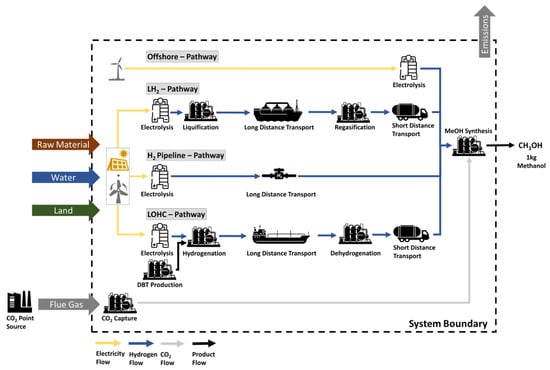
Figure 1.
System description for the CO2-based methanol production considering different production and import pathways for H2. (DBT = Dibenzyltoluene, LH2 = Liquified Hydrogen; LOHC = Liquid Organic Hydrogen Carrier).
- Offshore: H2 production in Germany using electricity from an offshore wind park
- Pipeline: H2 production and import via Pipeline from Morocco
- LH2: H2 production and import via ship from Australia
- LOHC: H2 production and import via ship from Australia
- LOHCwh: H2 production and import via ship from Australia using a waste heat (wh) source in Germany
In the following subchapters, the necessary processes are described in more detail. Further technical data and material balances can be found in Supplementary Tables S1–S5.
2.4.1. Renewable Electricity Production
To model the production of renewable electricity, data from UBA (2021) [57] was considered. The study contains actualized material and energy balances for offshore and onshore wind as well as PV plants. The material demand of the respective plants was adjusted to local conditions, i.e., the Full Load Hours (FLH) (Table 2). For electricity production in Australia and Morocco, a joint onshore wind and on-ground PV system was considered. For wind electricity, voltage (from high to low) and current transformation was assumed, and the calculation of the combined FLH includes an overlap of 15% [58]. For Germany, an offshore wind plant in the northern sea was modeled 80 km from the coast. To model representative local conditions, an area of 100 km × 100 km within each region was considered, for which the mean FLH were calculated.
Table 2.
Considered full load hours (FLH) for the local electricity production (PV = Photovoltaic).
2.4.2. Water Production and Purification
According to Boulay et al. [59], the selected regions in Morocco and Australia suffer under water stress. To avoid additional pressure on the water availability in those regions, the provision of tab water via reverse seawater osmosis was assumed. Data for the process was taken from the ecoinvent database. As water input for the electrolyzer, a further purification of tab water is necessary. The purification step is modeled via a process from the ecoinvent database.
2.4.3. Water Electrolysis
To produce H2, a Proton Exchange Membrane Electrolyzer system was modeled. In comparison to other electrolyzer types, such as Alkaline or High Temperature electrolyzer, this system offers higher elasticities and shorter start-up periods [60], which makes it more suitable to use renewable energies with a volatile electricity generation. The material balances for the plant and the stack are taken from Bareiß et al., (2019) [10] and were specifically modeled according to the local conditions of renewable electricity production at every location. In the status quo, a system efficiency of 61% based on the lower heating value of H2 is assumed. The operation takes place with a pressure of 30 bar and at 60 °C.
2.4.4. Pipeline Transport
For the transport of H2 via pipeline, a hub-to-point concept was considered [40]. This assumes that the transmission pipeline and the demand location are directly connected without further distribution grids or lower pressure levels. As pipeline length, 2800 km were assumed, which would suffice to connect the assumed H2 production location in southern Morocco with a cement plant in the middle of Germany following corridors of the existing pipeline grid for natural gas in Europe [41,61]. An amount of 25 km of this pipeline are assumed to be offshore, connecting Morocco with Spain. As the nominal operating pressure of the pipeline, 100 bar were assumed, with a pressure loss of 0.1 bar per km and a recompressing station every 500 km [34]. At every station, 0.5% of the transported H2 is lost due to leakage [11]. The stations are assumed to be located in Morocco (1 Station), Spain (2 Stations), France (3 Stations), and Germany (1 Station), and each is operated with the local grid mix.
The pipeline was modeled according to concepts for H2 pipelines presented in the literature. It has a diameter of 1000 mm, a wall thickness of 2.3 cm, and is built with conventional X70 Steel, which is considered suitable for H2 pipelines [62,63]. To model the pipeline in OpenLCA, the existing processes for on- and offshore transmission pipeline construction in the ecoinvent database were modified accordingly. In addition, the pipelines are assumed to be coated with a tin coating to reduce H2 diffusion [40,64]. A steel demand of 557 kg/m and a coating demand of 109 kg/m were assumed. In total, the modeled pipeline would have a H2 transmission capacity of 77 TWh/a. A lifetime of 40 years was assumed [65].
2.4.5. Liquefied H2 (LH2)
To transport H2 as fluid, several process steps are needed after the production step. At first, the H2 is stored in a salt cavern to allow a decoupling of H2 production and ship loading. To model its storage in a salt cavern, data from Wulf et al., (2018) [64] were used. As input pressure, 85 bar are assumed, and as output pressure, 50 bar are assumed. Prior to the long-distance transport of H2, it needs to be liquefied to raise the energy density. For the liquefaction process, a H2 input stream at 20 °C and 20 bar is cooled, then pressurized and expanded to reach a temperature of −250 °C and a pressure of 2 bar [66,67]. An initial compression is necessary due to the negative Joule Thompson coefficient of H2, which leads to a cooling of the gas while being compressed until reaching a temperature of −71 °C. After reaching this temperature, an expansion is necessary for further cooling.
For the long-distance transport, a modified tanker for Liquefied Natural Gas with a transport capacity of 140,000 m³ H2 was considered [68]. During the transport, H2 losses occur due to imperfect tank insulation. The liquefied H2 warms up and switches to the gas phase, which raises the pressure in the tanks. The emerged gaseous H2 gets released and can be used as a substitute for ship fuel [69]. These kinds of H2 losses are described as boil-off losses. In this article, a boil-off loss of 0.216% per day was assumed. Together with a travel distance of 18,000 km (port to port) from Geraldton to Bremerhaven according to Seadistance.org [65], in combination with a speed of 12 knots, this leads to 34 days of travel time and thus 7.2% of H2 losses per transport. To model the ship transport, an existing process in the ecoinvent database was modified. For every transport, two routes, one loaded and one unloaded, were considered.
After the transport, the H2 is regasified, i.e., heated up using the ambient temperature [11]. The short-distance transport is assumed to happen on the road using tube trailers at 500 bar pressure [39,70]. The trailer was modeled according to existing examples, and the material balances can be found in the Supplementary Table S5. As mean transport distance, 400 km were assumed. The different transport capacities between long- and short-distance transport also require an additional storage step, wherefore the storage in a salt cavern in northern Germany was assumed.
2.4.6. LOHC
The transport of H2 using LOHC requires a H2 carrier as well as a hydrogenation step at the starting location and a dehydrogenation step at the final destination. As a carrier, dibenzyltoluene (DBT) was considered in this study, because it offers comparably high-energy densities combined with low levels of flammability and toxicity, and low production costs [71]. The material balance for its production was derived from Wulf and Zapp (2018) [39]. In the hydrogenation step, the DBT is loaded with H2 in an exothermal reaction using platinum and aluminum as catalysts. Per kg DBT, 62 g of H2 can be stored corresponding to 6.2%wt. Before and after the loading, the LOHC is stored in chemical tanks at ambient pressure.
It is assumed that the ship transport happens with common oil tankers with a transport capacity of 150,000 t at a speed of 12 knots, resulting in 34 days of traveling time. To model the transport via ship, an existing process in ecoinvent was adjusted according to the respective transport volume, travel speed and transport distance [72]. For each trip, two transports were considered, one with loaded LOHC and one with unloaded LOHC. The exchange of loaded with unloaded LOHC takes place at each port, wherefore two sets of LOHC and chemical storage tanks are required. Potential H2 losses were derived from an average value for losses occurring during crude-oil transport of 0.2% [73]. The short-distance transport to the MeOH plant is modeled via an ordinary oil truck with a mean distance of 400 km.
The endothermic dehydrogenation step takes place at the MeOH plant and requires temperatures above 300 °C [39]. It is assumed that the necessary heat is either supplied by burning part of the transported H2 or by a waste heat (wh) source. For the former, around 27% of the hitherto transported H2 is necessary [71,74], and the dehydrogenation step would cause significant losses of H2. After the dehydrogenation, the H2 needs to be compressed from ambient pressure to 30 bar, which is the same output pressure as for the electrolysis step. The required electricity for the compressors is provided by the German grid mix.
2.4.7. CO2 Capture and MeOH Synthesis
To model the CO2 capture process, the capture from a cement kiln in combination with heat integration from a MeOH synthesis reactor according to Meunier et al., (2020) [75] was considered.
For the MeOH synthesis, an operating pressure of 80 bar was assumed, which makes further compressing steps necessary for the CO2 input flow as well as for the H2 input flows for the offshore and LOHC pathways. The pipeline and LH2 pathways deliver the H2 at around 100 bar or 500 bar, respectively, and no additional compression is necessary. The required electricity for the compressors is provided by the German grid mix. As material input, 1.42 kgCO2 and 0.197 kgH2 are required per kg MeOH [23,76]. For the scale of the plant, 100 ktMeOH per year were assumed, which corresponds to the largest CO2-based MeOH plant being built at the moment [77]. For the fossil-based MeOH production, a process for the German market from the ecoinvent database was used as a reference process.
3. Results
3.1. Energy Balances
The results for the energy balances for the production of 1 kgMeOH show how much energy is directly required for each pathway and how much of it is lost in the production and transport processes (Figure 2). For the methanol, a lower heating value of 21 MJ/kg was assumed. The balances are further differentiated in energy efficiency values, i.e., how much of the energy input is lost within the product system, and how much H2 is lost due to dissipation or its use in transformation processes.
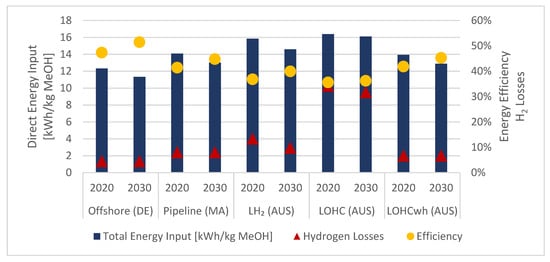
Figure 2.
Required direct energy input, energy efficiency, and process-related H2 losses for the different H2 provision pathways for the production of 1 kg CO2-based MeOH in Germany. H2 losses happen through dissipation or utilization as energy sources in the transformation processes. (AUS = Australia, DE = Germany, FR = Fossil Reference, MA = Morocco, LH2 = Liquefied Hydrogen, LOHC = Liquid Organic Hydrogen Carrier, Offshore = H2 production with electricity from an offshore wind park, wh = waste heat usage).
In general, at least half of the direct energy input is lost within the considered pathways in the status quo. The offshore pathway shows the lowest overall energy demand, the highest energy efficiency, and the least H2 losses per kg CO2-based MeOH. Here, H2 losses only occur in the MeOH synthesis step, and no transportation is required. If imported H2 is used, 14 (pipeline) to 33% (LOHC) more energy is required to produce the same product. Compared to the import via pipeline, the studied shipping pathways require more energy input and cause higher H2 losses due to the necessary transformation processes or the transport. Only if a source for waste heat is available, this pathway shows comparable values to the import via pipeline. For the future, efficiency gains between 1 to 5% can be expected, mainly due to increased process efficiencies for the electrolyzer and the transformation processes, as well as fewer compressing steps for the short distance transport.
3.2. LCA Results
3.2.1. Environmental Footprints
The results for the environmental footprints show a trade-off between the different impact categories (Figure 3). On the one hand, all processes show lower climate footprints than the fossil reference with H2 production in Germany and with the import via pipeline clearly outperforming the import via ship. Furthermore, for all environmental footprints, the import pathways cause higher impacts than for the offshore pathway, with the pipeline route being the best import alternative in every category and the LH2 pathway outperforming both LOHC pathways. On the other hand, the CO2-based MeOH production generally causes higher environmental impacts for all other footprints. The only exception is the water footprint for the offshore pathway; here, less evaporation losses occur than for the fossil-based production. In addition, the RMI of the offshore pathway is about the same as for the fossil-based production. The assumed structural changes in 2030 lead to generally lower environmental impacts, especially for the importing pathways. This is mainly caused by the more carbon-extensive grid mixes and more energy-efficient options for the short distance transport, which make the transport less impactful. Nevertheless, the existing trade-offs would not be avoided.
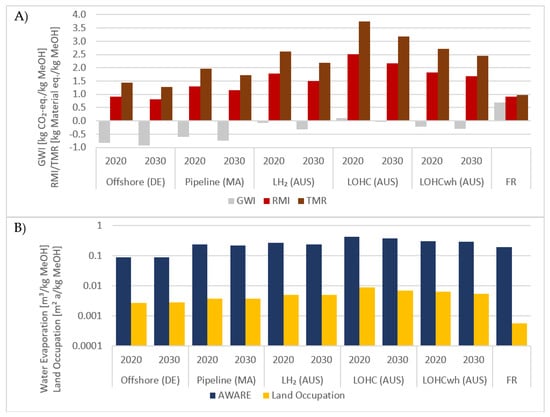
Figure 3.
Results of (A) the climate and material as well as (B) the water and land footprint for fossil (FR) and CO2-based MeOH production in 2020 and in 2030, based on different production pathways for H2. For the fossil reference, no substantial deviations can be expected for the future, wherefore only the values for the status quo were considered. (AUS = Australia, DE = Germany, FR = Fossil Reference, MA = Morocco, LH2 = Liquefied Hydrogen, LOHC = Liquid Organic Hydrogen Carrier, Offshore = H2 production with electricity from an offshore wind park, wh = waste heat usage; GWI = Global Warming Impact; RMI = Raw Material Input; TMR = Total Material Input; AWARE = Available Water Remaining).
3.2.2. Process Contribution to Footprints
The results of the contribution analysis show the major drivers of the environmental impacts as well as the higher complexity of the import pathways (Figure 4). In general, H2 production and transport are the dominating factors. For the climate and especially for the material footprint, the electrolysis step, i.e., the production of the required electricity, contributes the major part of the footprints (GWI: 31–45%; RMI: 48–69%). The impact of the electrolysis step increases proportionally with the H2 losses within the pathways, wherefore this impact is generally higher for the import via ship. The more transformation and transport processes are required, i.e., the more complex the product system is, the higher the environmental impacts. In most cases, the electricity demand for compression steps is responsible for large shares of the impacts. Especially for the import pathways via ship, the multiple transformation and storage steps cause pressure losses that require additional and energy-intensive recompressing. This was also shown by the results for the energy balances. For the hydrogenation and dehydrogenation steps of the LOHC pathways, the necessary platinum catalyst also significantly raises the material and climate footprint as well as the production of the required DBT as the carrier material. The short distance transport only matters for the import via the LH2 pathways, due of the pressure of 500 bars required for the transport in tube trailers. For the pipeline pathway, the contribution of the pipeline construction is below 3% of the total impacts and thus plays a minor role compared to the impacts of the pipeline operation. The impacts of CO2 capture and MeOH synthesis are mainly caused by the German grid mix for heat and electricity.
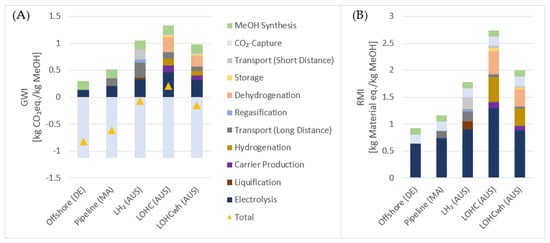
Figure 4.
Process contributions to (A) the climate and (B) the material footprint for all considered MeOH production pathways. The legend refers to both graphs. (AUS = Australia, DE = Germany, MA = Morocco, LH2 = Liquefied Hydrogen, LOHC = Liquid Organic Hydrogen Carrier, wh = waste heat usage; Offshore = H2 production with electricity from an offshore wind park; GWI = Global Warming Impact; RMI = Raw Material Input).
The results also show how sensitive the product systems are towards the environmental footprints of electricity provision, even though the electrolysis is assumed to be fully provided with renewable electricity. It is important to note that if the Australian grid mix is used for the local storage and transformation processes, the environmental impacts in general and specifically the climate footprint increase significantly. The climate footprint of the Australian grid of 0.97 kgCO2-eq./kWh would cause GWI values of 1.4 kgCO2-eq./kgMeOH (LH2) or 0.4 kgCO2-eq./kgMeOH (LOHC), i.e., an increase by a factor of 20 (LH2) or 4 (LOHC). Whereas for the LOHC pathway, the climate footprint remains lower, this would cause a higher climate footprint than for fossil-based MeOH production for the LH2 pathway. Furthermore, for the import via pipeline the climate footprint would be raised by 17% if the first compression step is provided by the Moroccan grid mix. Thus, the energy providers for the auxiliary processes have an important impact and need to be carefully examined in practice.
3.2.3. Parameter Distribution
The result distributions of the MCA show a difference between the pathways and enable a comparison between the impact of parameter uncertainty and technology selection (Figure 5, Supplementary Figure S1 and Table S8). If the standard deviations of the different production pathways are compared, the import via ship shows higher values, i.e., a higher uncertainty, than the import via pipeline or the offshore pathway. At the same time, the ranking of the pathways does not change if parameter uncertainty is considered. For all pathways, more than 75% of the results are lower than the next worse alternative. Consequently, the parameter variation has a lower impact on the results than the selection of the technology to provide H2 for the MeOH synthesis. In the case of the climate footprint, the worst-case values for all pathways except LOHC are still lower than the climate footprint of the fossil alternative. For the LOHC pathway, few outliers provide higher values. At the same time, even in the best case, a trade-off between climate footprint reduction and an increase in the material footprint cannot be avoided for the import pathways. In contrast, for the offshore pathway, it is avoided in around 25% of the cases.
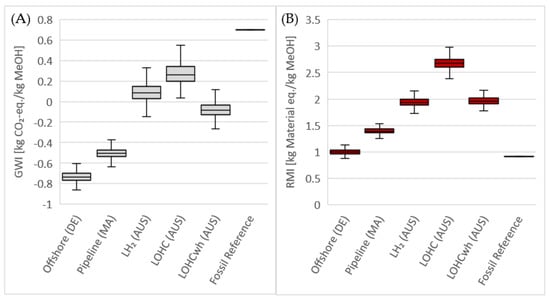
Figure 5.
Box plots showing the uncertainty distribution of (A) the climate and (B) the material footprint for all considered MeOH production pathways. Outliers are not shown for graphical reasons. (AUS = Australia, DE = Germany, FR = Fossil Reference, MA = Morocco, LH2 = Liquefied Hydrogen, LOHC = Liquid Organic Hydrogen Carrier, wh = waste heat usage; Offshore = H2 production with electricity from offshore wind park; GWI = Global Warming Impact, RMI = Raw Material Input).
3.3. Economic Results
3.3.1. Production Costs
The results for the production costs show a different picture than for the environmental impacts (Figure 6). Economic competitiveness compared to fossil-based MeOH can be reached neither now nor in the near future. In addition, the regarded import pathways via pipeline or LOHCwh are more promising than the offshore pathway. Furthermore, the differences in between the pathways are lower for the production costs than for the environmental impacts. The alternative with the lowest production costs in 2020 is the H2 transport via pipeline (1333 €/tMeOH). Ship transport only shows lower costs than the offshore pathway (1616 €/tMeOH) if waste heat is available. The import of LH2 is the most expensive pathway in the status quo, mainly due to the costs for short-distance transport, which are dominated by the investment costs for the tube trailer (20% of the total costs). For the offshore pathway and the import via pipeline, the electrolysis step is a more decisive cost driver (70–84% of the total costs) than for the import via ship. Beside the lower technical complexity of these pathways, this is also caused by higher electricity costs (Germany) or higher capital costs (Morocco) than in Australia. For the import via ship, the H2 transport causes 14% (LOHCwh), 28% (LOHC), or 43% (LH2) of the total costs. Thus, competitive advantages in lower H2 production costs are partly or completely compensated. The CO2 capture and MeOH synthesis together cause between 14 (LH2) and 22% (LOHCwh) of the total costs. The cost ranges show that the production costs could be 20% lower in the best case, but also 30% higher in the worst case. In addition, the results of a sensitivity analysis further illustrate the high influence of the electrolysis step for all pathways, but also its reduced impact for the import via ship (Supplementary Figures S2 and S3).
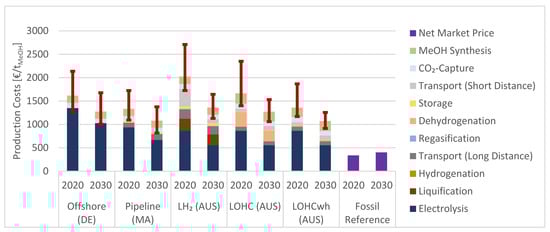
Figure 6.
Production costs for CO2-based MeOH, including cost ranges. The values for 2030 represent nominal values, i.e., no adjustment for a future inflation rate is conducted. (AUS = Australia, DE = Germany, FR = Fossil Reference, MA = Morocco, LH2 = Liquefied Hydrogen, LOHC = Liquid Organic Hydrogen Carrier, Offshore = H2 production with electricity from offshore wind park, wh = waste heat usage).
In 2030, reduced electricity and plant costs as well as more energy-efficient short distance transport could lead to a reduction of production costs between 19% (Pipeline) and 33% (LH2). Nevertheless, the cost ranking of the alternatives does not change. Despite the relatively higher cost reduction for the import pathways via ship, the LH2 and LOHC pathways still show higher costs than the offshore pathway. Due to the parameter uncertainty, no clear best alternative can be identified among the import pathways via ship without waste heat sources and the offshore pathway, because they all show similar value ranges. At the same time, the minimum and maximum values for the pipeline and LOHCwh pathways are clearly lower than for the other alternatives. Thus, in the status quo and the future, the LH2 and LOHC pathways are not competitive towards the offshore pathway either from an economic or from an environmental perspective.
The mean costs for H2 provision at the MeOH plant range from 5.2 (Pipeline) up to 8.9 €/kgH2 (LH2) in the status quo and 4.2 (Pipeline) to 5.6 €/kgH2 (LH2) in 2030. To achieve competitive MeOH production under the assumed circumstances, H2 provision cost below 0.4 (status quo) and 0.7 €/kgH2 (2030) would be necessary.
3.3.2. CO2-Avoidance Costs
If the climate footprint and the production costs are regarded in combination, it becomes clear that the import via ship shows significantly higher AC than the offshore and pipeline pathways now and, in the future, (Figure 7). In the status quo, the minimum avoidance costs are above 500 €/tCO2-avoided but could be reduced to 330 (Pipeline) or 412 €/tCO2-avoided (Offshore) in the future. Thus, the climate mitigation effect for the offshore or pipeline pathway is and remains more cost-efficient than for the import via ship.
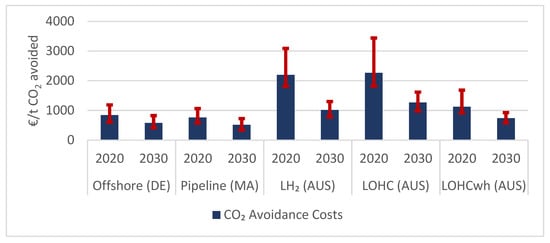
Figure 7.
CO2 avoidance costs of the different CO2-based methanol production pathways considering ranges for the production costs, assuming substitution of fossil-based methanol. (AUS = Australia, DE = Germany, FR = Fossil Reference, MA = Morocco, LH2 = Liquefied Hydrogen, LOHC = Liquid Organic Hydrogen Carrier, Offshore = H2 production with electricity from an offshore wind park, wh = waste heat usage).
In general, the AC for MeOH production strongly depends on the costs and the climate footprint of the provided H2 (Figure 8). In the status quo, avoidance costs below 100 € /tCO2-avoided are only possible for H2 provision costs below 1 €/kgH2 in combination with a climate footprint below 2 kgCO2-eq./kg kgH2. At the same time, a climate footprint above 9 kgCO2-eq./kgH2 would lead to higher climate footprint for the CO2-based production. The pathways analyzed in this article show a GWI of 1.8 (offshore) to 5.4 (LOHC) kgCO2-eq./kgH2. In the 2030 scenario, AC of 100 € are possible for H2 provision costs up to 1.5 €/kg H2 in combination with a climate footprint up to 2 kg CO2-eq. per kgH2 (Supplementary Figure S4).
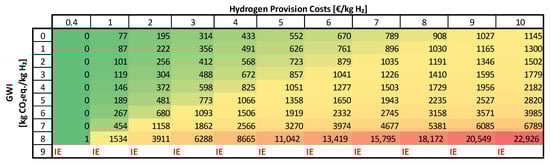
Figure 8.
CO2-avoidance costs for CO2-based methanol production in Germany, depending on the production costs and climate footprint of the used H2. (GWI = Global Warming Impact, IE = Increase in Emissions).
4. Discussion
The German chemical industry needs sources for non-fossil carbon in combination with large amounts of renewable energy to defossilize the production of organic chemicals. Due to probable scarcities of sufficient renewable energy capacities in Germany, alternative pathways for the provision of renewable energy need to be considered. In this article, the production of CO2-based MeOH using unavoidable CO2 point sources in Germany in combination with imported H2 was analyzed for the first time. The import of H2 via pipeline or ship was compared with H2 production in Germany using offshore wind as an energy source and assessed environmentally and economically. The climate footprint of MeOH production can be reduced in every case, but the results show several trade-offs between the environmental impact categories as well as between the environmental and economic results. Though the offshore pathway shows the least environmental impacts, it is comparably expensive at the same time. Furthermore, the reduction of the climate footprint would lead to an increased use of other resources in almost every case. Among the import pathways, the import via pipeline is the most promising. An import via ship seems only reasonable if sources for waste heat or local H2 pipeline grids for short-distance transport within Germany are available. The following in brief compares the results of this article to the existing literature and discusses the implications for practice and future research.
The analysis in the article for the first time combines the production and transport of H2 with CO2-based chemical production. For that reason, the results of this article need to be compared to the existing literature in both fields. Several studies analyzed the production and the transport of H2 from an environmental or economic perspective. Those studies mostly focused on the mere production and provision of H2 without a specific use case, its short distance distribution [38,71], or its use in the transport sector, as well as for energy storage [11,39]. Transport via pipeline was identified as the alternative with the least environmental impacts [64] and costs [71]. Furthermore, Wulf and Zapp (2018) [39] also described the trade-off between environmental impacts and economic performance for transport via LH2 and LOHC. The authors calculated climate footprints between 1.5 (Pipeline) and 5.8 kgCO2-eq./kgH2 (LOHC), which are similar to the results of this article (1.8 to 5.4 kgCO2-eq./kgH2). The differences are caused through different assumptions for the transport distance and the electricity providers. Heuser et al., (2019) [38] described the influence of transformation and transport processes on the import costs for LH2. They calculated costs of 4.4 €/kgH2, which differ from the results of this study for the status quo, because lower costs for electricity, a shorter transport distance, and no regional distribution after the ship transport were regarded. For the 2030 scenario, the results are identical. Hank et al. [78] calculated H2 provision costs for the import from Morocco to Germany via ship of 4.2 (LH2) and 5.1 €/kgH2 (LOHC). The differences compared to the results of this study can be explained by lower assumed electricity and capital costs, as well as a shorter transport distance and the exclusion cost-intensive short-distance transport. Thus, the core results for H2 production and transport of this study are comparable with previous studies and complement the existing literature with a detailed and combined environmental and economic assessment of a concrete use case for imported H2 in the chemical industry.
With respect to the MeOH production, the results of this study differ slightly from previous studies. For example, in case of the climate footprint, either lower [21] or higher values [22] were hitherto calculated, with the results of this study lying in the existing range. The deviations can be explained by different assumptions for the electricity and CO2 source. With respect to trade-offs between environmental impact categories and the risk of problem-shifting by importing CO2-based energy carriers or chemicals, a similar overall situation can be found in the literature [22,26,79].
Compared to the import options analyzed in this article, the import options for CO2-based MeOH analyzed by Kaiser et al., (2021) [26] offer a higher energy efficiency due to simpler and more efficient transport processes, which also reduces the environmental impacts. Regions with favorable wind conditions exhibit a better performance than all studied pathways using imported H2. Furthermore, the combination of local CO2 point sources with imported H2 shows a better or comparable performance for the pipeline pathway than MeOH imported from PV-based locations, especially if direct air capture is used as a CO2 source. In contrast, the import via ship without the availability of waste heat shows higher environmental impacts than all analyzed production locations for CO2-based MeOH, including those using direct air capture as a CO2 source. For the 2030 scenario, the situation does not significantly change. With respect to the economic situation, the costs for most of the locations for the import of CO2-based MeOH are lower in the status quo (933–1666 €/tMeOH) and in 2030 (588–889 €/tMeOH) compared to the calculated values for the production based on imported H2 in this article (2020: 1254–2709 €/tMeOH; 2030: 817–1645 €/tMeOH). Thus, the import of CO2-based MeOH would probably allow lower market prices and lower CO2 avoidance costs. However, the use of imported H2 would enable a higher domestic value creation, because two main process steps (CO2 capture and MeOH synthesis) would take place in the importing country. In addition, the use of local sources could increase the independency from global markets and therefore lower supply risks for carbon. Nevertheless, to achieve a competitive advantage, the costs for H2 transport (long- and short-distance) need to decrease significantly. This could happen through process optimization and scale-up, as well as the integration of H2 transport pathways in the existing industrial infrastructure by using redesignated pipelines and potential sources for waste heat.
Compared to the fossil-based production of MeOH, several approaches should be pursued to achieve economic competitiveness. First, the investment costs for all involved technologies need to be reduced significantly. Second, CO2-based chemicals should be used as input to produce high-value polymer products. This would allow a cost covering production without causing significant increases in production costs [27]. Third, the externalities of fossil carbon use as material should be consequently internalized, e.g., by the introduction of input quotas for non-fossil carbon sources. These approaches require expenditures for research and development, the overtaking of investment risks by companies, as well the right policy instruments in the future. In addition, transparent certification methods must be developed to ensure the environmental benefits of CO2-based chemical production in general, and especially for H2-production and transport, because auxiliary processes can have a major impact on the overall performance. However, the integration of CO2-based MeOH production into emission trading schemes will most probably not be sufficient to enable competitiveness. The calculated CO2 avoidance costs are more than eight times higher than the actual (50 €/t CO2 avoided, [80]) and expected carbon prices in the near future (85 €/t CO2 avoided, [81]) within the European Union. Consequently, this policy instrument could possibly help to cover a minor part of the additional costs but is far from enabling competitiveness of CO2-based MeOH production alone.
In general, current studies suggest that H2 based on renewable electricity will most probably be a highly demanded resource in several industry sectors [6]. This enables synergies, i.e., to share the costs to set up a transportation and distribution infrastructure between multiple sectors, which reduces the import costs. Nevertheless, the build-up of international trading and transport infrastructure will be required to connect producing and consuming locations. Here, transport via ship constitutes a comparably expensive option for the short term because it requires less lead-times, whereas transport via pipelines is more promising in the mid- and long-term perspective. Nevertheless, both options should be pursued, because synergies and cost reductions due to technical development and learning curves could help the shipping pathways to reduce the transport costs. In addition, a more diversified import structure would help to reduce the independence from one supply source, and thus level supply risks.
The results of this study should be considered in the light of some limitations. First, the authors did not have access to the primary data of actual plants but had to derive the model parameters from literature data. In consequence, the modeling results can only approximate the described production processes, whereas in reality, different results may be reached. Nevertheless, the calculated uncertainty ranges help to understand in what range the real values would probably lie. Second, the concepts considered in this article are in part still hypothetical or only realized on a smaller scale. Scaling effects and synergies with other industries could lead to lower costs and a higher energy efficiency than the values considered in this study. Though scaling effects were estimated with the help of average scaling factors, market synergies were not part of the scope of this study. Furthermore, the effects of an increasing global demand for CO2-based chemicals, which is expected to happen in the near future [82], were not considered in this study. This could enable regions and processes showing comparably high production costs to become competitive, too. Third, only one base chemical was considered as a case example. Other synthesis pathways, e.g., the use of H2 and CO2 to produce synthesis gas, offer the possibility to produce a broad range of CO2-based base and high-value chemicals. They potentially provide a higher energy efficiency than MeOH-based synthesis and need H2 directly. This could provide an advantage for the H2 import pathways compared to the import of CO2-based MeOH.
5. Conclusions
In this article, the combination of unavoidable CO2 point sources in Germany with different import pathways for H2 for CO2-based MeOH production was assessed environmentally and economically. As case examples for H2 provision, the hypothetical import via pipeline from Morocco and the currently under preparation import via ship from Australia were compared to possible domestic production using offshore wind as an energy source.
The results of the LCA show trade-offs between climate mitigation and other environmental impact categories for every pathway. They further show significant differences between the assessed alternatives, with the pathway for H2 provision from electricity generation down to the delivery at the chemical plant being the most decisive factor. High transport and transformation efforts associated with the import of H2 partly levelized more advantageous conditions for renewable energies in the exporting countries. Compared to the domestic production, environmental problem shifting by the import options studied in this article would result under the conditions of the status quo and in the near future.
From an economic perspective, production using electricity from an offshore wind park in Germany is more expensive than the import of H2 via pipeline. Nevertheless, the domestic production would offer lower costs than most import pathways via ship in the status quo. For the import via ship, liquefied H2 shows the highest costs. If the efforts for transformation processes and the short distance transport can be reduced in the future, all import pathways could exhibit lower or comparable costs than the analyzed production in Germany. With respect to climate change mitigation, import pathways via ship show the highest CO2 avoidance costs. Thus, the climate mitigation effect is more cost-efficient for the production of CO2-based MeOH using domestic H2 production or the H2 import via pipeline.
Compared with the import of CO2-based hydrocarbons, the analyzed pathways show similar or higher environmental impacts and higher production costs now and in the near future. Thus, if CO2-based MeOH cannot be produced in Germany, its import might be more favorable than the import of H2 for chemical production.
To improve economic and environmental performance, the energy efficiencies of H2-import pathways need to be increased in combination with a further decrease of investment costs along the whole value chain. Appropriate policies could complement this development and incentivize investments in this sector. For that, though, the hydrocarbon production pathways using imported H2 must show that they can exhibit lower environmental impacts and costs than the import of CO2-based hydrocarbons.
Future research should focus on technical development and process optimization as well as the analysis of suitable, effective, and economically efficient policy instruments. Furthermore, possible synergies with other industrial users of H2 to reduce import costs could be analyzed.
Supplementary Materials
The following supporting information can be downloaded at: https://www.mdpi.com/article/10.3390/en15072507/s1, Table S1: Process-specific energy and CO2 demands and H2 losses including the assumed values for the parameter range in form of triangle distributions; Table S2: General data and material balances for a 1 MW Proton Exchange Membrane Electrolyzer according to the status quo and the year 2030; Table S3: General data and material balances for the assumed H2 liquefaction plant.; Table S4: Material balance for the hydrogenation and the dehydrogenation plants; Table S5: Material balance for a high-pressure storage tank used for H2 tube trailers; Table S6: Composition of the assumed grid mixes for electricity in 2020 and 2030; Table S7: Description of Cost Parameters.; Table S8: Statistical parameters of the result distributions for the different footprints; respectively [83,84,85,86,87,88,89,90,91,92,93,94,95,96,97,98,99,100]. Figure S1: Box Plots showing the results distribution of the Monte Carlos for the Water and Land Footprints; Figure S2: Results of the sensitivity analysis for the production costs for the offshore, pipeline, and LH2 pathway; Figure S3: Results of the sensitivity analysis for the production costs for both LOHC production pathways; Figure S4: CO2-Avoidance costs for CO2-based MeOH production in Germany for the year 2030, depending on the production costs and climate footprint of the used H2.
Author Contributions
Conceptualization, S.K., F.S. and S.B.; methodology, S.K., F.S. and C.M.; formal analysis, S.K.; investigation, S.K. and F.S.; data curation, F.S. and S.K.; writing—original draft preparation, S.K.; writing—review and editing, F.S., C.M. and S.B.; visualization, S.K.; supervision, S.B.; funding acquisition, S.B. All authors have read and agreed to the published version of the manuscript.
Funding
The authors thank the German Federal Ministry of Education and Research (BMBF) for their support within the framework of CO2Win (Funding Number: 033RC016B).
Conflicts of Interest
The authors declare no conflict of interest. The funders had no role in the design of the study; in the collection, analyses, or interpretation of data; in the writing of the manuscript, or in the decision to publish the results.
Nomenclature
| AC | CO2 avoidance Costs |
| AUS | Australia |
| AWARE | Available Water Remaining |
| CCU | Carbon Dioxide Capture and Utilization |
| DE | Germany |
| FLH | Full Load Hours |
| FR | Fossil Reference |
| GHG | Green House Gases |
| GWI | Global Warming Impact |
| LCA | Life Cycle Assessment |
| LH2 | Liquefied H2 |
| LOHC | Liquid Organic Hydrogen Carriers |
| MCA | Monte Carlo Analysis |
| MeOH | Methanol |
| PV | Photovoltaic |
| PC | Production Costs |
| RMI | Raw Material Input |
| TMR | Total Material Requirement |
| wh | waste heat |
| WACC | Weighted Average Costs of Capital |
References
- IPCC. Climate Change 2014 Mitigation of Climate Change Working Group III Contribution to the Fifth Assessment Report of the Intergovernmental Panel on Climate Change; Cambridge University Press: New York, NY, USA, 2014. [Google Scholar]
- IRP. Assessing Global Resource Use: A Systems Approach to Resource Efficiency and Pollution Reduction; International Resource Panel: Paris, France, 2019. [Google Scholar]
- Bataille, C.; Waisman, H.; Colombier, M.; Segafredo, L.; Williams, J.; Jotzo, F. The need for national deep decarbonization pathways for effective climate policy. Clim. Policy 2016, 16, S7–S26. [Google Scholar] [CrossRef]
- Wimbadi, R.W.; Djalante, R. From decarbonization to low carbon development and transition: A systematic literature review of the conceptualization of moving toward net-zero carbon dioxide emission (1995–2019). J. Clean. Prod. 2020, 256, 120307. [Google Scholar] [CrossRef]
- Kaiser, S.; Bringezu, S. Use of carbon dioxide as raw material to close the carbon cycle for the German chemical and polymer industries. J. Clean. Prod. 2020, 271, 122775. [Google Scholar] [CrossRef] [PubMed]
- IEA. The Future of Hydrogen; International Energy Agency: Paris, France, 2019. [Google Scholar]
- Bampaou, M.; Panopoulos, K.; Seferlis, P.; Voutetakis, S.; Matino, I.; Petrucciani, A.; Zaccara, A.; Colla, V.; Dettori, S.; Branca, T.A.; et al. Integration of Renewable Hydrogen Production in Steelworks Off-Gases for the Synthesis of Methanol and Methane. Energies 2021, 14, 2904. [Google Scholar] [CrossRef]
- Matino, I.; Dettori, S.; Zaccara, A.; Petrucciani, A.; Iannino, V.; Colla, V.; Bampaou, M.; Panopoulos, K.; Rechberger, K.; Kolb, S.; et al. Hydrogen role in the valorization of integrated steelworks process off-gases through methane and methanol syntheses. Matériaux Tech. 2021, 109, 308. [Google Scholar] [CrossRef]
- IEA. World Energy Outlook 2021; International Energy Agency: Paris, France, 2021. [Google Scholar]
- Bareiß, K.; de la Rúa, C.; Möckl, M.; Hamacher, T. Life cycle assessment of hydrogen from proton exchange membrane water electrolysis in future energy systems. Appl. Energy 2019, 237, 862–872. [Google Scholar] [CrossRef]
- Reuß, M.; Grube, T.; Robinius, M.; Preuster, P.; Wasserscheid, P.; Stolten, D. Seasonal storage and alternative carriers: A flexible hydrogen supply chain model. Appl. Energy 2017, 200, 290–302. [Google Scholar] [CrossRef]
- IEA. The Future of Petrochemicals towards More Sustainable Plastics and Fertilisers; Intenrational Energy Agency: Paris, France, 2018. [Google Scholar]
- Bazzanella, A.; Ausfelder, F. Low Carbon Energy and Feedstock for the European Chemical Industry; DECHEMA, Gesellschaft für Chemische Technik und Biotechnologie e.V.: Frankfurt am Main, Germany, 2017. [Google Scholar]
- Meys, R.; Kätelhön, A.; Bachmann, M.; Winter, B.; Zibunas, C.; Suh, S.; Bardow, A. Achieving net-zero greenhouse gas emission plastics by a circular carbon economy. Science 2021, 374, 71–76. [Google Scholar] [CrossRef]
- Kätelhön, A.; Meys, R.; Deutz, S.; Suh, S.; Bardow, A. Climate change mitigation potential of carbon capture and utilization in the chemical industry. Proc. Natl. Acad. Sci. USA 2019, 116, 11187–11194. [Google Scholar] [CrossRef] [PubMed] [Green Version]
- Mikkelsen, M.; Jørgensen, M.; Krebs, F.C. The teraton challenge. A review of fixation and transformation of carbon dioxide. Energy Environ. Sci. 2010, 3, 43–81. [Google Scholar] [CrossRef]
- Bringezu, S.; Distelkamp, M.; Lutz, C.; Wimmer, F.; Schaldach, R.; Hennenberg, K.J.; Böttcher, H.; Egenolf, V. Environmental and socioeconomic footprints of the German bioeconomy. Nat. Sustain. 2021, 4, 775–783. [Google Scholar] [CrossRef]
- Engström, G.; Gars, J.; Krishnamurthy, C.; Spiro, D.; Calel, R.; Lindahl, T.; Narayanan, B. Carbon pricing and planetary boundaries. Nat. Commun. 2020, 11, 1–11. [Google Scholar] [CrossRef] [PubMed]
- Galán-Martín, Á.; Tulus, V.; Díaz, I.; Pozo, C.; Pérez-Ramírez, J.; Guillén-Gosálbez, G. Sustainability footprints of a renewable carbon transition for the petrochemical sector within planetary boundaries. One Earth 2021, 4, 565–583. [Google Scholar] [CrossRef]
- Olfe-Kräutlein, B. Advancing CCU Technologies Pursuant to the SDGs: A Challenge for Policy Making. Front. Energy Res. 2020, 8. [Google Scholar] [CrossRef]
- Wyndorps, J.; Ostovari, H.; von der Assen, N. Is electrochemical CO2 reduction the future technology for power-to-chemicals? An environmental comparison with H2-based pathways. Sustain. Energy Fuels 2021, 5, 5748–5761. [Google Scholar] [CrossRef]
- Hoppe, W.; Thonemann, N.; Bringezu, S. Life Cycle Assessment of Carbon Dioxide-Based Production of Methane and Methanol and Derived Polymers. J. Ind. Ecol. 2017, 22, 327–340. [Google Scholar] [CrossRef]
- Sternberg, A.; Jens, C.M.; Bardow, A. Life cycle assessment of CO2-based C1-chemicals. Green Chem. 2017, 19, 2244–2259. [Google Scholar] [CrossRef]
- von der Assen, N.; Jung, J.; Bardow, A. Life-cycle assessment of carbon dioxide capture and utilization: Avoiding the pitfalls. Energy Environ. Sci. 2013, 6, 2721–2734. [Google Scholar] [CrossRef]
- Hoppe, W.; Bringezu, S.; Wachter, N. Economic assessment of CO2-based methane, methanol and polyoxymethylene production. J. CO2 Util. 2018, 27, 170–178. [Google Scholar] [CrossRef]
- Kaiser, S.; Prontnicki, K.; Bringezu, S. Environmental and economic assessment of global and German production locations for CO2-based methanol and naphtha. Green Chem. 2021, 23, 7659–7673. [Google Scholar] [CrossRef]
- Kaiser, S.; Gold, S.; Bringezu, S. Environmental and economic assessment of CO2-based value chains for a circular carbon use in consumer products. 2022; in Review. [Google Scholar]
- VCI. At a Glance—Chemical Industry 2020 (Orig. Title: Auf einen Blick—Chemische Industrie 2020); Verband der Chemischen Industrie: Frankfurt am Main, Germany, 2020; Available online: https://www.vci.de/vci/downloads-vci/publikation/chemische-industrie-auf-einen-blick.pdf (accessed on 5 February 2022).
- Müller, L.J.; Kätelhön, A.; Bringezu, S.; McCoy, S.; Suh, S.; Edwards, R.; Sick, V.; Kaiser, S.; Cuéllar-Franca, R.; El Khamlichi, A.; et al. The carbon footprint of the carbon feedstock CO. Energy Environ. Sci. 2020, 13, 2979–2992. [Google Scholar] [CrossRef]
- Geres, R.; Kohn, A.; Lenz, S.; Ausfelder, F.; Bazzanella, A.; Möller, A. Roadmap Chemie 2050 on the Way torwards a Carbon Neutral Chemical Industry in Germany (Orig. Title: Auf dem Weg zu Einer Treibhausgasneutralen Chemischen Industrie in Deutschland); VCI: Frankfurt am Main, Germany, 2019; Available online: https://www.vci.de/vci/downloads-vci/publikation/2019-10-09-studie-roadmap-chemie-2050-treibhausgasneutralitaet.pdf (accessed on 5 February 2022).
- DECHEMA. Roadmap of the Kopernikus Project P2X Phase II – Options for a Sustainable Energy System with Power-to-X Technologies. (Orig. Title: Roadmap des Kopernikus-Projektes P2X Phase II Optionen für eine Nachhaltiges Energiesystem mit Power-to-X Technologien); DECHEMA, Gesellschaft für Chemische Technik und Biotechnologie e.V.: Frankfurt am Main, Germany, 2021. [Google Scholar]
- Chemie Technik. Covestro Buys Green Hydrogen from the Australien Company FFI (orig. Title: Covestro Kauft Grünen Wasserstoff vom Australischen Unternehmen FFI). 2022. Available online: https://www.chemietechnik.de/energie-utilities/covestro-kauft-gruenen-wasserstoff-vom-australischen-unternehmen-ffi-725.html (accessed on 5 February 2022).
- BASF. BASF Finishes Acquisition of 49.5 Percent of Offshore-Windpark Hollandse Kust Zuid Owned by Vattenfall (Orig. Title: BASF Schließt Erwerb von 49,5 Prozent des Offshore-Windparks Hollandse Kust Zuid von Vattenfall ab) 2021. Available online: https://www.basf.com/global/de/media/news-releases/2021/09/p-21-297.html (accessed on 5 February 2022).
- Wang, A.; van der Leun, K.; Peters, D.; Buseman, M. European Hydrogen Backbone; Guidehouse: Utrecht, The Netherlands, 2020. [Google Scholar]
- Perner, J.; Bothe, D. International Aspects of a Power-to-X Roadmap. A Report Prepared for the World Energy Council Germany; Frontier Economics: Cologne, Germany, 2018. [Google Scholar]
- Jensterle, M.; Narita, J.; Piria, R.; Schröder, J.; Steinbacher, K.; Wahabzada, F.; Zeller, T.; Crone, K.; Löchle, S. Green Hydrogen: International Cooperation Potential for Germany (Orig. Title: Grüner Wasserstoff: Internationale Kooperationspotenziale für Deutschland); Adelphi: Berlin, Germany, 2020. [Google Scholar]
- Merten, F.; Scholz, A.; Krüger, C.; Heck, S.; Girard, Y.; Mecke, M.; Goerge, M. Assessment of Advantages and Disadvantages of H2-Imports Compared to Domestic Production (Orig. Title: Bewertung der Vor- und Nachteile von Wasserstoffimporten im Vergleich zur heimischen Erzeugung); Wuppertal Institut; DIW Econ GmbH: Wuppertal, Germany, 2020. [Google Scholar]
- Heuser, P.-M.; Ryberg, D.S.; Grube, T.; Robinius, M.; Stolten, D. Techno-economic analysis of a potential energy trading link between Patagonia and Japan based on CO2 free hydrogen. Int. J. Hydrog. Energy 2019, 44, 12733–12747. [Google Scholar] [CrossRef]
- Wulf, C.; Zapp, P. Assessment of system variations for hydrogen transport by liquid organic hydrogen carriers. Int. J. Hydrogen Energy 2018, 43, 11884–11895. [Google Scholar] [CrossRef]
- Krieg, D. Concept and Costs for a Pipeline System for a Supply of the German Traffic Sector with Hydrogen (Orig. Title: Konzept und Kosten eines Pipelinesystems zur Versorgung des Deutschen Straßenverkehrs mit Wasserstoff); Forschungszentrum Jülich: Jülich, Germany, 2012; ISBN 9783893368006. [Google Scholar]
- Gerhardt, N.; Bard, J.; Schmitz, R.; Beil, M.; Pfennig, M.; Kneiske, D.T. Hydrogen in the Future Energy System: Focus Heating of Buildings (Orig. Title: Wasserstoff im Zukünftigen Energiesystem: Fokus Gebäudewärme); Fraunhofer IEE: Kassel, Germany, 2020. [Google Scholar]
- Australian Government. Hydrogen. 2021. Available online: https://www.ga.gov.au/scientific-topics/energy/resources/hydrogen (accessed on 4 December 2021).
- Fasihi, M.; Breyer, C. Baseload electricity and hydrogen supply based on hybrid PV-wind power plants. J. Clean. Prod. 2019, 243, 118466. [Google Scholar] [CrossRef]
- Global Solar Atlas 3.0.2019. Available online: www.globalsolaratlas.info (accessed on 1 December 2021).
- Global Wind Atlas 3.0.2019. Available online: www.globalwindatlas.info (accessed on 1 December 2021).
- DIN EN ISO 14044; Environmental Management—Life Cycle Assessment Requirements and Guidelines. German Institut for Standardization: Berlin, Germany, 2021.
- DIN EN ISO 14045:2012; Environmental Management—Eco-Efficiency Assessment of Product Systems—Principles, Requirements and Guidelines. German Institut for Standardization: Berlin, Germany, 2021.
- Müller, L.J.; Kätelhön, A.; Bachmann, M.; Zimmermann, A.; Sternberg, A.; Bardow, A. A Guideline for Life Cycle Assessment of Carbon Capture and Utilization. Front. Energy Res. 2020, 8, 15. [Google Scholar] [CrossRef]
- Prakash, G.K.S.; Olah, G.; Goeppert, A. Beyond Oil and Gas: The Methanol Economy. ECS Trans. 2011, 35, 31–40. [Google Scholar] [CrossRef] [Green Version]
- Steinmann, Z.J.N.; Schipper, A.M.; Hauck, M.; Huijbregts, M.A.J. How Many Environmental Impact Indicators Are Needed in the Evaluation of Product Life Cycles? Environ. Sci. Technol. 2016, 50, 3913–3919. [Google Scholar] [CrossRef]
- Stocker, T.; Tignor, M. Climate Change 2013 the Physical Science Basis Working Group I Contribution to the Fifth Assessment Report of the Intergovernmental Panel on Climate Change; Cambridge University Press: New York, NY, USA, 2014. [Google Scholar]
- Mostert, C.; Bringezu, S. Measuring Product Material Footprint as New Life Cycle Impact Assessment Method: Indicators and Abiotic Characterization Factors. Resources 2019, 8, 61. [Google Scholar] [CrossRef] [Green Version]
- Schomberg, A.C.; Bringezu, S.; Flörke, M. Extended life cycle assessment reveals the spatially-explicit water scarcity footprint of a lithium-ion battery storage. Commun. Earth Environ. 2021, 2, 1–10. [Google Scholar] [CrossRef]
- Zimmermann, A.; Müller, L.J.; Marxen, A.; Armstrong, K.; Buchner, G.; Wunderlich, J.; Kätelhön, A.; Bachmann, M.; Sternberg, A.; Michailos, S.; et al. Techno-Economic Assessment & Life-Cycle Assessment Guidelines for CO2 Utilization Version 1.1; Global CO2 Initiative: Ann Arbour, MI, USA, 2020; Available online: https://deepblue.lib.umich.edu/bitstream/handle/2027.42/162573/TEA%26LCA%20Guidelines%20for%20CO2%20Utilization%20v1.1.pdf (accessed on 5 February 2022).
- Steffen, B. Estimating the cost of capital for renewable energy projects. Energy Econ. 2020, 88, 104783. [Google Scholar] [CrossRef]
- IEA. World Energy Outlook 2020; International Energy Agency: Paris, France, 2020. [Google Scholar]
- UBA. Actualization and Assessment of LCAs for Wind Energy and Photovoltaic Plants Considering Current Technology Developments (Orig. Title: Aktualisierung und Bewertung der Ökobilanzen von Windenergie- und Photovoltaikanlagen unter Berücksichtigung Aktueller Technologieentwicklungen); German Environment Agency: Dessau-Roßlau, Germany, 2010.
- Frontier Economics. The Future Costs of Synthetic Fuels (Orig. Title Die Zukünftigen Kosten Strombasierter Synthetischer Brennstoffe); Agora Verkehrswende; Agora Energiewende: Berlin, Germany, 2018. [Google Scholar]
- Boulay, A.-M.; Bare, J.; Benini, L.; Berger, M.; Lathuillière, M.J.; Manzardo, A.; Margni, M.; Motoshita, M.; Nunez, M.; Pastor, A.V.; et al. The WULCA consensus characterization model for water scarcity footprints: Assessing impacts of water consumption based on available water remaining (AWARE). Int. J. Life Cycle Assess. 2017, 23, 368–378. [Google Scholar] [CrossRef] [Green Version]
- NOW GmbH. IndWEDe Industrialization of Water Electrolysis in Germany (Orig. Title Industrialisierung der Wasser Elektrolyse in Deutschland); Nationale Organisation Wasserstoff- und Brennstoffzellentechnologie: Berlin, Germany, 2018. [Google Scholar]
- Iskov, H.; Kneck, S. Using the natural gas network for transporting hydrogen–ten years of experience. In Proceedings of the International Gas Union Research Conference Proceedings, Rio de Janeiro, Brazil, 24–26 May 2017. [Google Scholar]
- Cerniauskas, S.; Junco, A.J.C.; Grube, T.; Robinius, M.; Stolten, D. Options of natural gas pipeline reassignment for hydrogen: Cost assessment for a Germany case study. Int. J. Hydrogen Energy 2020, 45, 12095–12107. [Google Scholar] [CrossRef] [Green Version]
- Fekete, J.; Sowards, J.W.; Amaro, R.L. Economic impact of applying high strength steels in hydrogen gas pipelines. Int. J. Hydrogen Energy 2015, 40, 10547–10558. [Google Scholar] [CrossRef] [Green Version]
- Wulf, C.; Reuß, M.; Grube, T.; Zapp, P.; Robinius, M.; Hake, J.-F.; Stolten, D. Life Cycle Assessment of hydrogen transport and distribution options. J. Clean. Prod. 2018, 199, 431–443. [Google Scholar] [CrossRef]
- Sea Distance. Ports Distances. Available online: https://sea-distances.org/ (accessed on 25 January 2022).
- Stolzenburg, K.; Mubbala, R. Hydrogen Liquefcation Report Integrated Design for Demonstration of Efficient Liquefaction of Hydrogen; Fuel Cells and Hydrogen Joint Undertaking: Brussels, Belgium, 2013. [Google Scholar]
- Aasadnia, M.; Mehrpooya, M. Large-scale liquid hydrogen production methods and approaches: A review. Appl. Energy 2018, 212, 57–83. [Google Scholar] [CrossRef]
- Ahn, J.; You, H.; Ryu, J.; Chang, D. Strategy for selecting an optimal propulsion system of a liquefied hydrogen tanker. Int. J. Hydrogen Energy 2017, 42, 5366–5380. [Google Scholar] [CrossRef]
- Kamiya, S.; Nishimura, M.; Harada, E. Study on Introduction of CO2 Free Energy to Japan with Liquid Hydrogen. Phys. Procedia 2015, 67, 11–19. [Google Scholar] [CrossRef] [Green Version]
- DOE. Fuel Cell Technologies Office Multi-Year Research, Development, and Demonstration Plan Section 3.2 Hydrogen Delivery; U.S. Department of Energy: Washington, DC, USA, 2015. Available online: https://www.energy.gov/sites/default/files/2015/08/f25/fcto_myrdd_delivery.pdf (accessed on 5 February 2022).
- Niermann, M.; Timmerberg, S.; Drünert, S.; Kaltschmitt, M. Liquid Organic Hydrogen Carriers and alternatives for international transport of renewable hydrogen. Renew. Sustain. Energy Rev. 2020, 135, 110171. [Google Scholar] [CrossRef]
- Adland, R.; Cariou, P.; Wolff, F.-C. Optimal ship speed and the cubic law revisited: Empirical evidence from an oil tanker fleet. Transp. Res. Part E Logist. Transp. Rev. 2020, 140, 101972. [Google Scholar] [CrossRef]
- Harrison, P. Global Crude Oil Voyage Losses Fall. Petroleum Review. 2016. Available online: http://www.oil-transport.info/admin/resources/petrev20.pdf (accessed on 5 February 2022).
- Schneider, M.J. Hydrogen storage and distribution via liquid organic carriers. In Bridging Renewable Electricity with Transportation Fuels Workshop; Brown Palace Hotel: Denver, CO, USA, 2015. [Google Scholar]
- Meunier, N.; Chauvy, R.; Mouhoubi, S.; Thomas, D.; De Weireld, G. Alternative production of methanol from industrial CO. Renew. Energy 2019, 146, 1192–1203. [Google Scholar] [CrossRef]
- Otto, A. Chemical, Technical and Economic Assessment of CO2 as Raw Material in the Chemical Industry (Orig. Title: Chemische, Verfahrenstechnische und ökonomische Bewertung von Kohlendioxid als Rohstoff in der Chemischen Industrie); Forschungszentrum Jülich: Aachen, Germany, 2015; ISBN 9783958060647. [Google Scholar]
- Carbon Recycling International. Shunli Project. 2020. Available online: https://www.carbonrecycling.is/projects#projects-shunli (accessed on 2 April 2021).
- Hank, C.; Sternberg, A.; Köppel, N.; Holst, M.; Smolinka, T.; Schaadt, A.; Hebling, C.; Henning, H.-M. Energy efficiency and economic assessment of imported energy carriers based on renewable electricity. Sustain. Energy Fuels 2020, 4, 2256–2273. [Google Scholar] [CrossRef]
- Bachmann, M.; Kätelhön, A.; Winter, B.; Meys, R.; Müller, L.J.; Bardow, A. Renewable carbon feedstock for polymers: Environmental benefits from synergistic use of biomass and CO. Faraday Discuss. 2021, 230, 227–246. [Google Scholar] [CrossRef]
- EU ETS Certificate Prices. 2021. Available online: https://ember-climate.org/data/carbon-price-viewer/ (accessed on 28 October 2021).
- Bloomberg Green. Europe CO2 Prices May Rise More Than 50% by 2030, EU Draft Shows. 2021. Available online: https://www.bloomberg.com/news/articles/2021-06-29/europe-co2-prices-may-rise-more-than-50-by-2030-eu-draft-shows (accessed on 5 February 2022).
- IEA. CCUS in Clean Energy Transitions; International Energy Agency: Paris, France, 2020. [Google Scholar]
- Abdin, Z.; Tang, C.; Liu, Y.; Catchpole, K. Large-scale stationary hydrogen storage via liquid organic hydrogen carriers. iScience 2021, 24, 102966. [Google Scholar] [CrossRef] [PubMed]
- Fröhlich, T.; Blömer, S.; Münter, D.; Brischke, L.-A. CO2 Quellen für die PtX Herstellung in Deutschland Technologien, Umweltwir-kung, Verfügbarkeit. 2019. Available online: https://www.ifeu.de/fileadmin/uploads/ifeu_paper_03_2019_CO2-Quellen-f%c3%bcr-PtX.pdf (accessed on 5 February 2022).
- RTE. Energy Data. 2022. Available online: https://www.rte-france.com/en/eco2mix/energy-data (accessed on 2 February 2022).
- European Commission. Integrated National Energy and Climate Plan for France. 2020. Available online: https://ec.europa.eu/info/energy-climate-change-environment/implementation-eu-countries/energy-and-climate-governance-and-reporting/national-energy-and-climate-plans_en (accessed on 5 March 2022).
- Fraunhofer ISE. Energy Charts: Öffentliche Nettostromerzeugung in Deutschland in 2021. 2022. Available online: https://energy-charts.info/charts/energy_pie/chart.htm?l=de&c=DE&interval=year&year=2021 (accessed on 2 February 2022).
- BMU. Klimaschutzplan 2050—Klimaschutzpolitische Grundsätze und Ziele der Bundesregierung; German Ministry for the Environment, Nature Conservation, Nuclear Safety and Consumer ProtectionBerlin: Berlin, Germany, 2016.
- RED, REData – Generation. 2022. Available online: https://www.ree.es/en/datos/generation (accessed on 2 February 2022).
- IRENA. Future of Solar Photovoltaic: A Global Energy Transformation Paper; International Renewable Energy Agency: Abu Dhabi, United Arab Emirates, 2019. [Google Scholar]
- IRENA. Future of Wind: A Global Energy Transformation Paper; International Renewable Energy Agency: Abu Dhabi, United Arab Emirates, 2019. [Google Scholar]
- IRENA. Renewable Power Generation Costs in 2019; International Renewable Energy Agency: Abu Dhabi, United Arab Emirates, 2020. [Google Scholar]
- Fraunhofer ISE. Stromgestehungskosten Erneuerbare Energien (Levelized Costs for Electricity of Renewable Energies): June 2021; Fraunhofer ISE: Freiburg, Germany, 2021. [Google Scholar]
- Eurostat. Electricity Prices. 2022. Available online: https://ec.europa.eu/eurostat/statistics-explained/index.php?title=Electricity_price_statistics#Electricity_prices_for_non-household_consumers (accessed on 11 February 2022).
- Energy Brainpool. EU Energy Outlook 2050. 2019. Available online: https://blog.energybrainpool.com/en/update-december-2019-eu-energy-outlook-2050/ (accessed on 16 December 2021).
- Vos, M.; Douma, J.; van den Noort, A. Study on the Import of Liquid Renewable Energy: Technology Cost Assessment. 2020. Available online: https://www.gie.eu/wp-content/uploads/filr/2598/DNV-GL_Study-GLE-Technologies-and-costs-analysis-on-imports-of-liquid-renewable-energy.pdf (accessed on 5 March 2022).
- Chemical Engineering. Chemical Engineering Plant Cost Index. 2021. Available online: https://www.chemengonline.com/2019-chemical-engineering-plant-cost-index-annual-average/ (accessed on 27 October 2021).
- UBA. Roadmap Gas for the Energiewende—Sustainable Climate Contribution of the Gas Sector: (Orig. Title: Roadmap Gas für Die Energiewende—Nachhaltiger Klimabeitrag des Gassektors); German Environmental Agency: Dessau-Roßlau, Germany, 2019. [Google Scholar]
- Hurskainen, M. Seminar on the Finnish Needs and Research Highlights on Hydrogen—Focus on Liquid LOHC “Batteries” and Hydrogen Legislation: Liquid Organic Hydrogen Carriers (LOHC)—Concept Evaluation and Technoeconomics: Seminar on the Finnish Needs and Research Highlights on Hydrogen—Focus on Liquid LOHC “Batteries” and Hydrogen Legislation (Espoo, 2018). Available online: https://projectsites.vtt.fi/sites/lohcness/files/LOHCNESS_WP1_Hurskainen_H2seminar_7.11.2018_public.pdf (accessed on 5 February 2022).
- Saadi, F.H.; Lewis, N.S.; McFarland, E.W. Relative costs of transporting electrical and chemical energy. Energy Environ. Sci. 2018, 11, 469–475. [Google Scholar] [CrossRef] [Green Version]


Publisher’s Note: MDPI stays neutral with regard to jurisdictional claims in published maps and institutional affiliations. |
© 2022 by the authors. Licensee MDPI, Basel, Switzerland. This article is an open access article distributed under the terms and conditions of the Creative Commons Attribution (CC BY) license (https://creativecommons.org/licenses/by/4.0/).