Article

Measurements and Analysis of Partial Discharges at HVDC Voltage with AC Components

Department of Electrical and Power Engineering, AGH University of Science and Technology, al. Mickiewicza 30, 30-059 Krakow, Poland
*
Author to whom correspondence should be addressed.
Energies 2022, 15(7), 2510; https://doi.org/10.3390/en15072510
Submission received: 1 February 2022 / Revised: 22 March 2022 / Accepted: 27 March 2022 / Published: 29 March 2022
(This article belongs to the Special Issue Diagnostic Testing and Condition Monitoring Methods)

Abstract

:
This paper presents the methodology for phase-resolved partial discharge measurements in HVDC systems with a DC voltage containing trace AC harmonics or a DC voltage ripple. The measurement result of partial discharges is an indicator of the current condition of the high-voltage power devices’ insulation system. The voltage waveforms in HVDC systems are not ideal DC, because different disturbances occurring naturally in these systems can affect the DC voltage. The AC harmonics related to the AC source voltage, and the voltage ripples provided by the power converter topology, can be found in the HVDC voltage. This paper proposes a novel approach to partial discharge measurement in DC networks. The synchronization to the particular AC harmonics appearing in DC voltage was applied to the PD measurements. The analyses were performed on the model sample containing a void inclusion, which was placed between electrodes fed by the DC voltages with the imposed chosen AC harmonics. Two scenarios were analyzed at a constant DC level: one with a variable AC magnitude and the second with a variable frequency of an AC source adjusted to the harmonics: 50, 150, 300, and 350 Hz. It was observed that the superimposed AC voltage component resulted in an intensification of PDs.

1. Introduction

In recent decades there has been significant development of HVDC transmission systems technology, in particular related to the development of new topologies of multi-level power electronics converters, increasing the rated voltages and currents of available industrial power electronic switching devices, and the introduction of new types of fast power switches based on SiC semiconductor technology [1,2,3,4]. The technical and economic attractiveness of HVDC technology is primarily caused by the significantly lower costs of long-distance electricity transmission compared to traditional AC transmission lines. As a result, research problems related to the development and implementation of new materials and structures of high-voltage insulation systems intended for operation at DC voltages remain current and important.
Two types of HVDC systems can be distinguished. The first, the Line Commutated Current Source Converter (LCC) is a classic solution developed at the beginning of the HVDC technology, with the power electronics switches based on the thyristor technology. The second system is the Voltage Source Converter (VSC) which uses high-voltage, high-power transistors as active switches in converter design. The inverter turning on–off capability allows working in power system restoration mode. The high-voltage transmission system reflects the capacitive character of the load; thus, the operation of power electronics devices can be treated as charging and discharging of this object. This system has the ability to control the power flow by setting the proper phase angle of the voltage appearing on the inductance ends, which acts as the separation between the grid and converter [1,2].
The high-voltage DC systems provide non-ideal DC voltages, which also contain trace AC harmonics or a DC voltage ripple [3,5,6,7,8]. The pulsating disturbances imposed on the DC voltage occur during the normal operation of the power converters, and can be transmitted from the AC side of the DC grid. These disturbances increase the exposure of high-voltage insulation systems on the strong electric field [5,6,7,8,9,10,11,12,13,14,15,16,17]. The HVDC components can be divided into two groups of devices depending on the exposure type. The first group is affected by the DC voltage and its disturbances, i.e., the wall bushings, grading capacitors in HVDC modules, power lines, and smoothing reactors [14,15,18]. The second group is affected by the AC and mixed AC–DC stimuli; this appears in the converter transformers. In this way, the AC–DC stresses appear in oil-pressboard insulation [7].
The simultaneous, combined AC and DC voltage stresses during the operation of power equipment can lead to increased accumulation of space charge; this was observed in XLPE cable samples [6,19]. The DC voltage harmonic distortions can also impact the power electronics modules; this was observed for modular multilevel converters (MMCs), which are a part of the VSC systems, in which the voltage ripples have an influence on their terminal characteristics [20]. Both HVDC topologies (LCC, VSC) provide a different pattern of generated harmonics in the DC voltage. The LCC topology based on the n-pulse converters, where n is usually 6 or 12 pulses, results in the generation of harmonics that sequentially build with n.k.f [Hz] components, where k is a natural number, and f refers to the network fundamental frequency. For a 50 Hz network, harmonics at the DC side will have a multiplication of 300 and 600 Hz. Detailed analysis of the LCC operation indicates that the firing angle of thyristors in a power electronic converter defines the harmonic parameters appearing at the DC side [1]. The investigations presented in [5] show that the highest measured values of the voltage harmonics based on the working principle of the power converter (6 n and 12 n) can reach up to 10%.
The second HVDC topology, VSC, has a different harmonic profile than that of LCC [1]. This topology is characterized by the low level of the harmonics appearing at the DC voltage, thus implying the design of filters and smoothing reactors for smaller ratings. The other side of this topology is the generation of harmonics at much higher frequencies than in LCC systems.
One of the indicators used to assess the condition of insulation is the presence and parameters of partial discharges (PDs) arising in defects located in the insulation systems of electrical devices. In the case of AC systems, Phase-Resolved Partial Discharge patterns (PRPD patterns, which map the set of recorded PD pulses in the phase-charge matrix, accumulating the number of PD pulses in its individual cells; as a result, a 3D mapping of the PD process is created) are commonly recorded and used for effective analysis of the insulation condition of such systems, and evaluation of the degree of their degradation [21]. In PD studies with DC voltages, their acquisition is usually based on the registration of the times of occurrence of successive PD pulses and their apparent charges [12,16,21,22,23]. On this basis, the relationships between the time intervals of consecutive PD pulses Δt = titi−1 and their apparent charges qi and qi−1 or apparent charge differences Δq = qiqi−1 (times and apparent charges for i-th and (i − 1)-th PD pulse, respectively), and as statistical distributions of selected parameters, are analyzed [12,16,22].
AC voltage harmonics and DC voltage ripple are undesirable distortions in system voltages. Their negative impact on high-voltage devices is related to the increased exposure of insulation systems to a non-static electric field with a changing value of the voltage derivative du/dt. As a result, they influence the conditions for the inception and development of PD in their sources. The influence of AC voltage harmonics on PRPD patterns is a well-known and well-described topic [13,24,25,26,27,28,29]. During PD measurements in HVDC systems, a noticeable effect of the presence of higher harmonics of the AC voltage on the parameters of the recorded time series of PD pulses, traceable on the DC side, was also observed. This problem, important from the point of view of the inception and potential intensification of PD in insulation systems of HVDC devices, remains an important topic of experimental research and theoretical considerations [6,23]. For example, in laboratory tests of dielectric materials for HVDC systems, it was proposed to use special test voltages that combine the AC voltage with a gradually increased DC voltage (“flooding” AC waveform). For high DC voltage levels, even a small presence of a fragment of the AC voltage waveform results in the appearance of distinct groups of PD pulses in time ranges with a non-zero derivative of the voltage [30,31].
Acquisition of PD pulses in a PRPD pattern may be a problem at DC voltages with trace AC harmonics or ripple due to the lack of an explicitly available synchronization signal. This paper presents the proposed methodology of PRPD pattern registration for measurement in HVDC networks, with synchronization to selected sync signals obtained from the AC or DC side of the HVDC station. The results of laboratory measurements of partial discharges arising in model samples of internal gas inclusions with well-defined geometry and closed in a dielectric material are also presented. The samples were subjected to the test stress caused by the controlled DC voltage with the AC component corresponding to different harmonics of the AC side voltage (or DC voltage ripple). For the analysis of the influence of individual harmonics on the PD parameters, a commercial system dedicated to PD measurement recorded PRPD patterns. The pattern acquisition was synchronized with the phase 0 of the individual AC voltage harmonic present in the DC voltage.

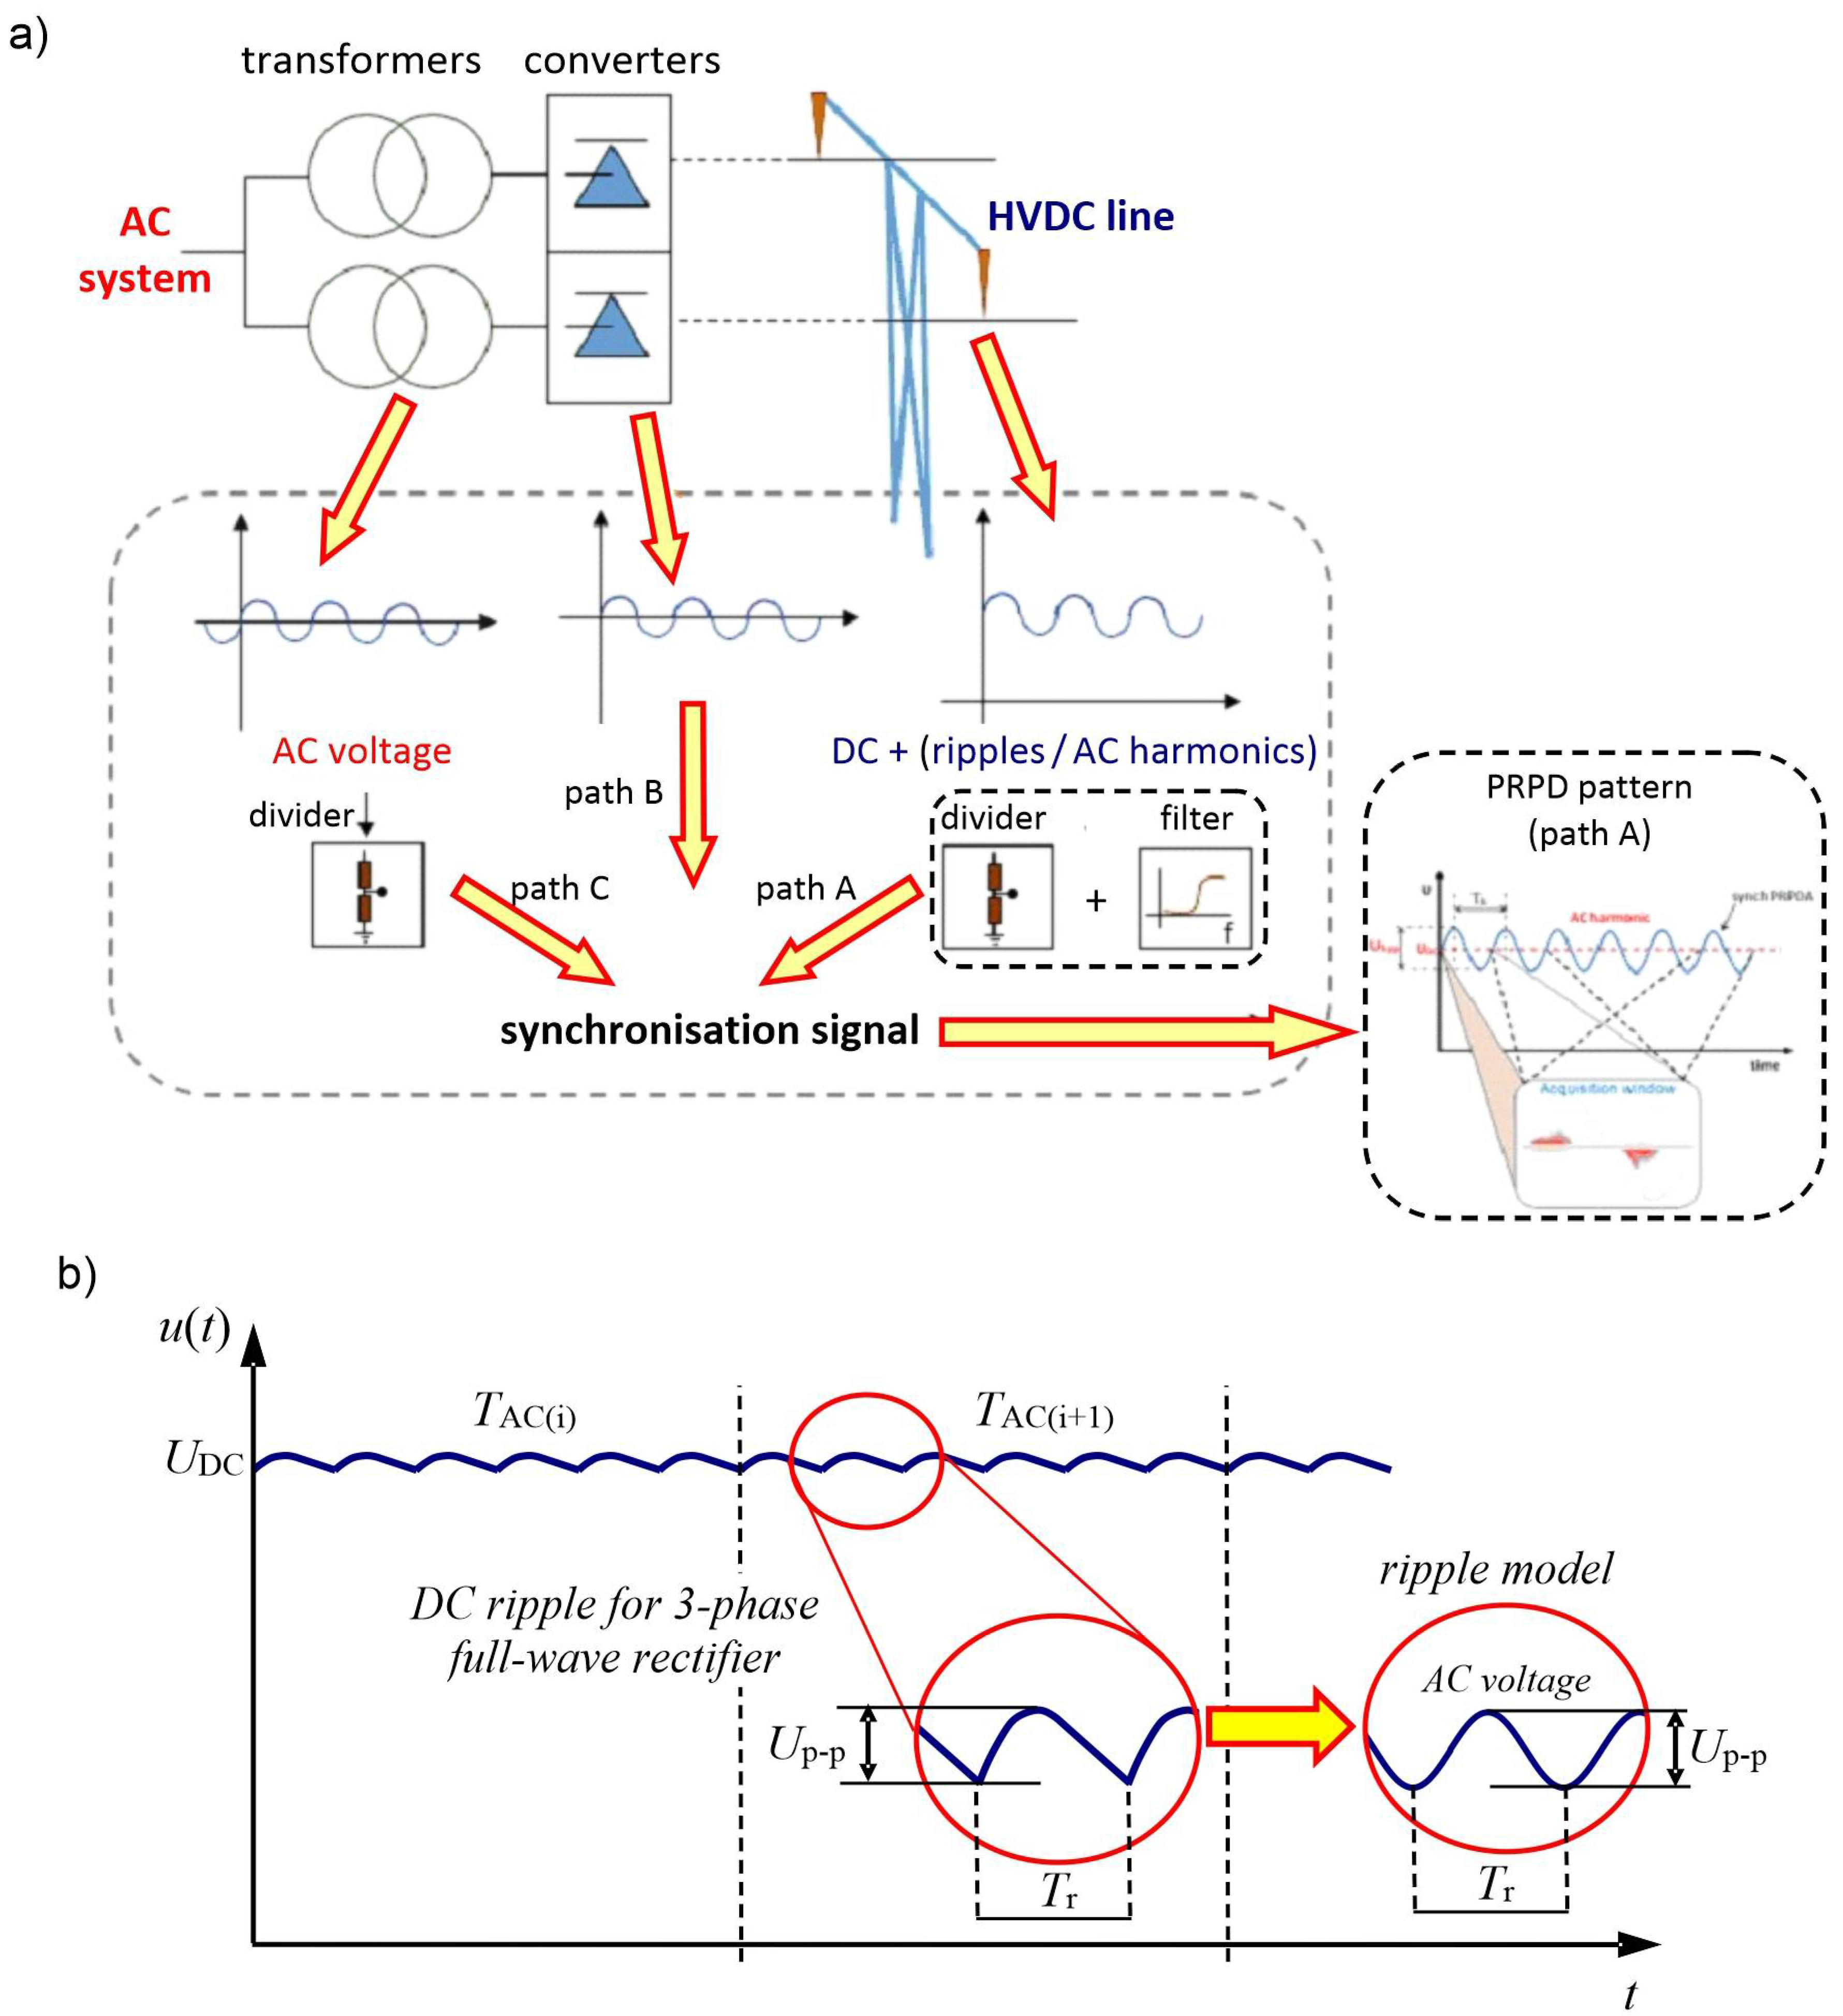
2. Methodology of Measurement

The analyses were performed in a laboratory stand-by application of high-voltage DC with a specific AC voltage component to the specimen imitating typical defects in high-voltage insulation. The PD acquisition and analysis at DC voltage is normally performed in the time domain or with respect to the time differences between the previous or following discharges [16,22]. The phase-resolved PD pulse acquisition is widely used in PD measurement at AC voltage [21]. The main focus in the presented research is on the influence of the periodic DC voltage ripple or superimposed AC voltage harmonics on PD generation. Therefore, a novel approach to PD pulse recording for an HVDC system was proposed, based on PRPD pattern acquisition synchronized to DC voltage ripple or specific AC voltage harmonics (Figure 1).
The synchronization signal can be achieved by the high-pass or band-pass filtering of real HVDC voltage (Figure 1a, path A). This procedure allows selecting the periodic voltage component related to the DC voltage ripple, which occurs naturally in the HVDC network [1,2,20]. Alternatively, the synchronization signals can be taken directly from the converter control signals [1,20] (Figure 1a, path B) or they can be obtained from one of the voltage phases on the AC side of the converter station (Figure 1a, path C). In the latter case, the PRPD pattern is recorded with a single matrix pattern acquisition time corresponding to the full period of the AC voltage. For path A, the procedure leads to the synchronic accumulation of measured PD pulses with respect to the DC ripple period or the specific AC voltage harmonic (Figure 1b), with a phase angle corresponding to the occurrence of PD.
In general, PRPD pattern acquisition may be synchronized to any higher harmonics with respect to the fundamental frequency of the AC voltage. In laboratory conditions, it allows observing the influence of the voltage values and the order of the AC voltage harmonic on the parameters of PD pulses at DC + AC voltage. Since there is no characteristic synchronization stamp in the DC voltage, similar to the zero crossing of AC voltage, the specific harmonic voltage can be used as synchronization of the PRPD pattern. The synchronization with the particular i-th voltage harmonic can provide the accumulation of discharges in a time-frame corresponding to the period T of this signal.
The following sections present the results obtained during laboratory tests for which the PRPD patterns were synchronized with a specific AC component superimposed on high DC voltage. Acquired PRPD patterns collected data for PD pulse sets generated in insulation defects due to the complex voltage stress produced by the DC voltage, UDC, with superimposed ripples with peak-to-peak voltage, Up-p, or an AC component (Figure 1b).

3. Measurement Setup and Test Specimen

The investigations were made on the model specimen, imitating one of the most common defects in high-voltage insulation. It had the form of a flat and round void with a thickness of a = 0.24 mm and diameter D = 10 mm (Figure 2). The embedded void was created using Nomex® flexible paper with a single sheet thicknesses of 0.08 mm. The most common usage of this type of solid insulation is for HV applications in transformers and electrical motors. The void sample was placed between two 2 mm glass plates to ensure proper mechanical stability.
The laboratory measurement stand was equipped with a commercial PD measurement system (ICM System, Power Diagnostix, Aachen, Germany), and the HVDC source was mimicked by the Trek 20/20B HV amplifier. The details of the principle and structure of the PD measurement system (Figure 2) are described elsewhere [29,30]. The recording time for PD measurements was set to 60 and 300 s, respectively, for the AC voltage and the DC voltage with added AC component.

4. Experimental Results

The presented investigations intended to determine the effect of superimposed AC voltage harmonics at DC voltage subject to the high-voltage insulation. Two subsequent scenarios were considered:
(a)
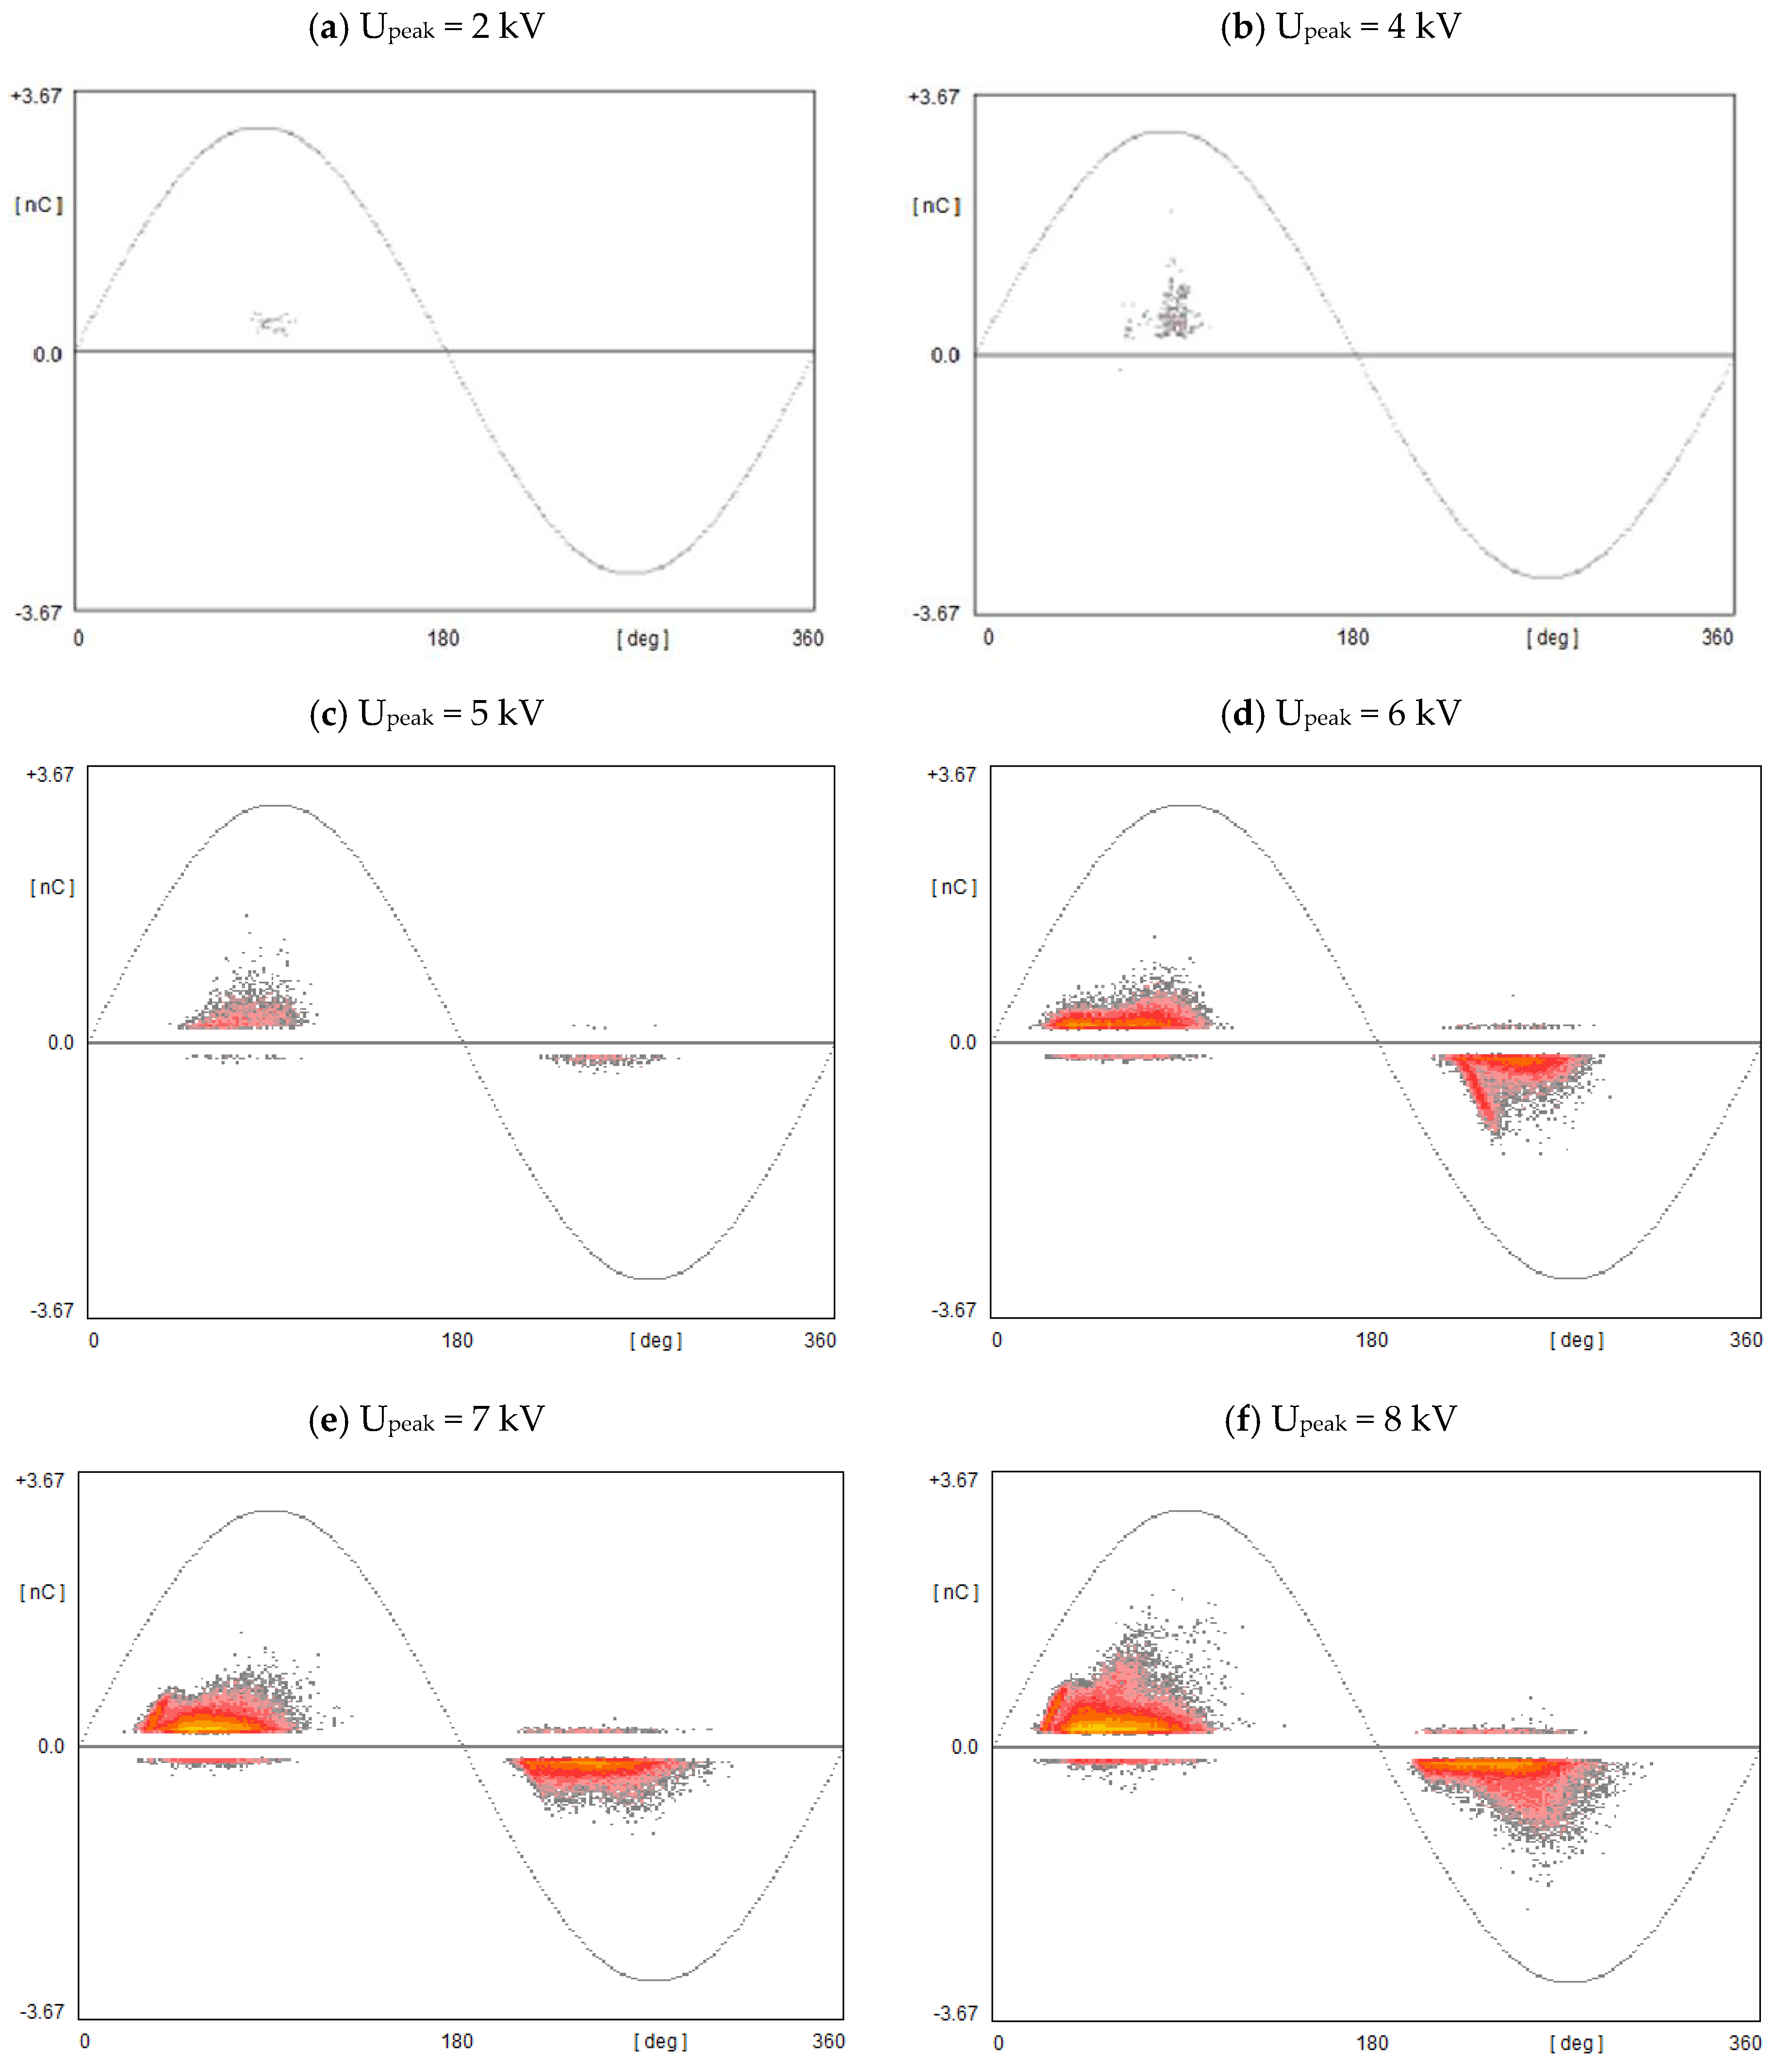
The DC voltage was set to 10 kV, the AC voltage component with frequency 50 Hz was superimposed on the DC, and the amplitude of the AC voltage was changed from the PD inception voltage to 8 kV.
(b)
The DC voltage was set to 10 kV, the AC harmonic with 6 kV amplitude was superimposed on the DC, and the frequency of the AC voltage component was set to: 50, 150, 300, and 350 Hz.
The PD inception voltage U0 for the analyzed specimen was compared between pure AC and mixed voltage DC/AC scenarios. In the case of AC (50 Hz) voltage, U0 was 5 kV and for combined DC + AC (50 Hz), voltage was equal to 10 kV DC + 2 kV AC.
The difference between the obtained results (U0) is related to the different mechanisms of the distribution of electric field in dielectric materials for AC and DC fields. The distribution of the AC electric field depends mostly on the electric permittivity of the dielectric material, whereas the DC electric field is distributed due to the resistivity of the material [32].
The following three examples of PD inception voltage in the form of phase-resolved patterns are shown in Figure 3:
(a)
pure AC 50 Hz, U0 = 5 kV,
(b)
pure AC 300 Hz, U0 = 5 kV,
(c)
mixed DC 10 kV + AC 50 Hz 2 kV, U0 = 12 kV.

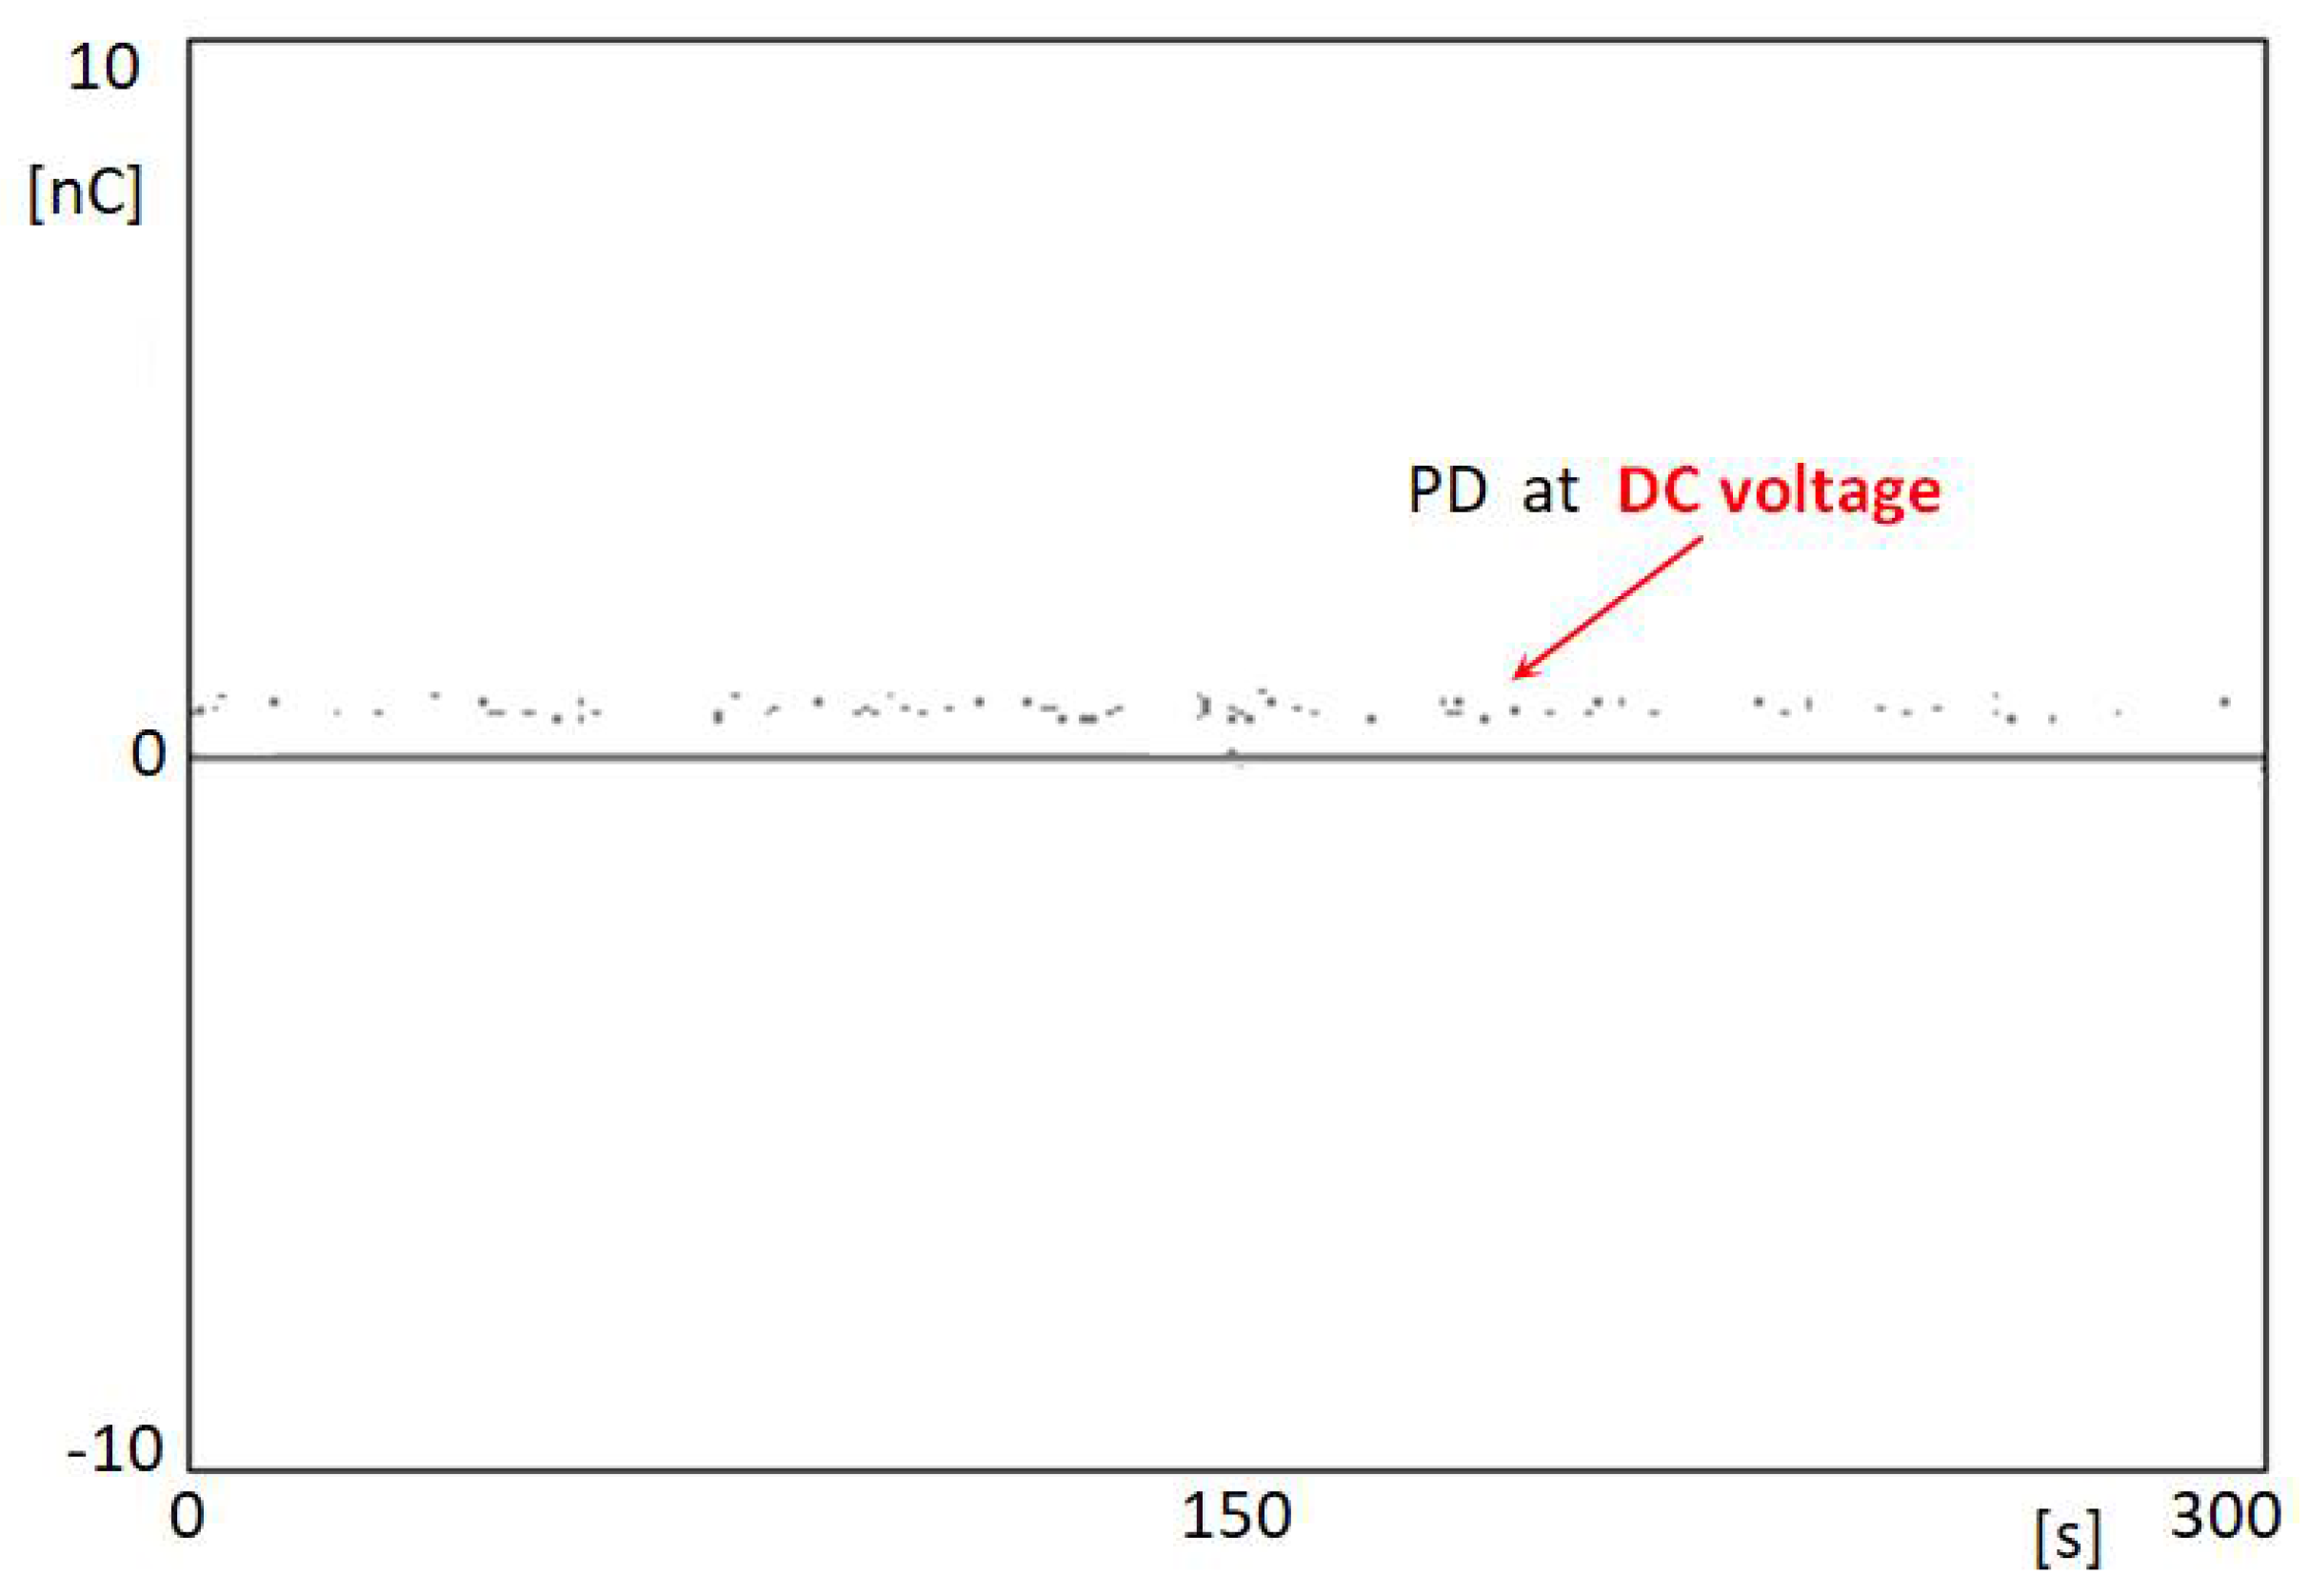
4.1. Acquisition of PDPD Patterns at Inception Voltage U0

The PD inception voltage for both frequencies (50 and 300 Hz) of AC test voltage was identified as 5 kV. In this case, the frequency value has an impact on the number of PD pulses for the AC voltage period; this can be seen in Figure 3a,b. For the DC voltage (10 kV) and superimposed AC voltage, the PD inception voltage was found at 2 kV AC. The PDs appeared at the positive half period of the AC harmonic, thus at the 12 kV peak of DC + AC voltage (Figure 3c).
The impact of the AC component was analyzed by the application of a DC voltage with a constant value of 10 kV, with an imposed AC component having a variable magnitude, to the test specimen. The frequency of the AC component was set to 50 Hz, and the amplitude varied from the inception voltage (2 kV) to 8 kV.
Figure 4 presents the results obtained for different AC voltages; the amplitude of the AC component is equal to Upeak. For the inception voltage level, a small group of discharges appears in the positive half period (Figure 4a). The rise of the AC amplitude up to 4 kV provides more intensive discharges with a higher charge magnitude up to 2nC (Figure 4b). The 5 kV AC component reveals partial discharges at the negative half period (Figure 4c). The voltage at the sample varies between 15 kV at the AC maximum and 5 kV for the minimum, with the frequency of 50 Hz around the DC 10 kV voltage.
A strong asymmetry between the apparent charge values for the positive and negative half period is observed. The 6 kV AC component provides equalization of discharge intensity in both polarities (Figure 4d). The rise of the AC voltage to 7 kV (Figure 4e) and 8 kV (Figure 4f) forces higher magnitude discharges with broader phase distribution, including the shift in the PD inception angle. In the last case, the voltage magnitude at the sample varies between 2 and 18 kV, depending on the 50 Hz AC amplitude.

4.2. PD at DC 10 kV + AC 50 Hz Upeak

The analysis of the results shows that the amplification of partial discharges, which deteriorates high-voltage insulation materials, occurs with rising AC voltage amplitude. The partial discharge inception voltage is influenced by the ratio between the AC component and the DC voltage, due to a combination of static and alternating electric fields in the model void. The PDs measured in the specimen at pure DC voltage, at 10 kV (without harmonic), are shown in Figure 5. The acquisition time frame was 300 s. The magnitude of the PDs is almost equal to 1 nC, and the distance between adjacent pulses is regular and correlated with the time constants of the relaxation phenomena in insulation materials and the capacitance of the void.

4.3. PD at DC 10 kV + AC 6 kV, f [Hz]

In turn, the impact of higher harmonics appeared during the application of the DC voltage at 10 kV with a superimposed AC component having an amplitude of 6 kV, which was kept constant. The frequency of an AC component was adjusted respectively to a harmonic: 50, 150, 300, and 350 Hz. It can be seen that the difference between 50 Hz (Figure 6a) and 150 Hz (Figure 6b) is quite invisible. However, for 300 Hz and above (Figure 6c,d) the magnitude on both polarities seems to be attenuated. This may result from the void re-charging time constant. The observation shows that the measured partial discharges in the case of DC voltage with AC superimposed components were mainly determined by the AC content. For positive polarization of the DC voltage, the first PDs occurred at a positive half cycle of the imposed AC waveform. The combination of a positive half cycle of harmonic and the positive polarization of DC implies a stronger electrical field in the test specimen.

5. Conclusions

This article presents investigative results of the impact of certain AC voltage harmonics on the partial discharge inception voltage. The AC harmonics can naturally appear in HVDC systems due to the working principles of the power converters. The acquisition of PDs at the DC voltage is normally performed in a time domain. A novel approach is proposed for partial discharge measurements at DC voltage, and the synchronization of measurements to the particular AC harmonic appearing in the DC waveform is introduced. This process allows accumulation of pulses originating from the PDs in HV insulation with reference to the phase of the synchronization harmonic. The synchronization signal can be taken as a voltage measured at the AC side of the power converter, the control signal from the power converter, or the filtered AC components or ripples appearing in the HVDC voltage. The filtration of the AC component allows for synchronization to the particular harmonic with consideration of its phase shift. This procedure makes it possible to measure phase-resolved PDs in DC networks.
The synchronization should be made to the lowest detected harmonic to avoid mis-interpretation of the measured results caused by the fluctuation of the synchronization stamp. Based on the results of the analyses of the partial discharge measured in the dielectric sample equipped with the void, the combined DC/AC voltage was applied to the sample. The investigations revealed the impact of AC harmonics imposed in the DC voltage on the intensification of the acquired partial discharges. These events influence the technical conditions of HV insulation systems.

Author Contributions

Investigation, M.F., M.K. and P.Z.; Methodology, M.F., M.K. and P.Z.; Writing—original draft, M.F., M.K. and P.Z.; Writing—review & editing, M.F., M.K. and P.Z. All authors have read and agreed to the published version of the manuscript.

Funding

The research presented in the paper was financed by a subsidy of the Polish Ministry of Education and Science for the AGH University of Science and Technology in Krakow.

Institutional Review Board Statement

Not applicable.

Informed Consent Statement

Not applicable.

Data Availability Statement

Not applicable.

Conflicts of Interest

The authors declare no conflict of interest.

References

  1. Jovcic, D.; Ahmed, K. High-Voltage Direct-Current Transmission. Converters, Systems and DC Grids; John Wiley & Sons: Hoboken, NJ, USA, 2015. [Google Scholar]
  2. Hammons, T.J.; Lescale, V.F.; Uecker, K.; Haeusler, M.; Retzmann, D.; Staschus, K.; Lepy, S. State of the art in ultrahigh-voltage transmission. Proc. IEEE 2012, 100, 360–390. [Google Scholar] [CrossRef]
  3. Debnath, S.; Qin, J.; Bahrani, B.; Saeedifard, M.; Barbosa, P. Operation, control, and applications of the modular multilevel converter: A review. IEEE Trans. Power Electron. 2015, 30, 37–53. [Google Scholar] [CrossRef]
  4. Kassakian, J.G.; Jahns, T.M. Evolving and emerging applications of power electronics in systems. IEEE J. Emerg. Sel. Top. Power Electron. 2013, 1, 47–58. [Google Scholar] [CrossRef]
  5. Tang, H.; Wu, G.; Chen, M.; Deng, J.; Li, X. Analysis and disposal of typical breakdown failure for resin impregnated paper bushing in the valve side of HVDC converter transformer. Energies 2019, 12, 4303. [Google Scholar] [CrossRef] [Green Version]
  6. Fard, M.A.; Farrag, M.E.; Reid, A.; Al-Naemi, F. Electrical treeing in power cable insulation under harmonics superimposed on unfiltered HVDC voltages. Energies 2019, 12, 3113. [Google Scholar] [CrossRef] [Green Version]
  7. Li, J.; Zhang, L.; Han, X.; Yao, X.; Li, Y. PD detection and analysis of oil-pressboard insulation under pulsed DC voltage. IEEE Trans. Dielectr. Electr. Insul. 2017, 24, 324–330. [Google Scholar] [CrossRef]
  8. Romano, P.; Imburgia, A.; Serdyuk, Y.; Ala, G.; Blennow, J.; Bongiorno, M.; Grasso, C.; Hammarström, T.; Rizzo, G. The Effect of the Harmonic Content Generated by AC/DC Modular Multilevel Converters on HVDC Cable Systems. In Proceedings of the 2019 IEEE Conference on Electrical Insulation and Dielectric Phenomena (CEIDP), Richland, WA, USA, 20–23 October 2019; pp. 666–669. [Google Scholar]
  9. Chen, G.; Hao, M.; Xu, Z.; Vaughan, A.; Cao, J.; Wang, H. Review of high voltage direct current cables. CSEE J. Power Energy Syst. 2015, 1, 9–21. [Google Scholar] [CrossRef]
  10. Doedens, E.; Jarvid, E.M.; Guffond, R.; Serdyuk, Y.V. Space charge accumulation at material interfaces in HVDC cable insulation Part I—Experimental study and charge injection hypothesis. Energies 2020, 13, 2005. [Google Scholar] [CrossRef] [Green Version]
  11. Doedens, E.; Jarvid, E.M.; Guffond, R.; Serdyuk, Y.V. Space charge accumulation at material interfaces in HVDC cable insulation Part II—Simulations of charge transport. Energies 2020, 13, 1750. [Google Scholar] [CrossRef] [Green Version]
  12. Gu, X.; He, S.; Xu, Y.; Yan, Y.; Hou, S.; Fu, M. Partial discharge detection on 320 kV VSC-HVDC XLPE cable with artificial defects under DC voltage. IEEE Trans. Dielectr. Electr. Insul. 2018, 25, 939–946. [Google Scholar] [CrossRef]
  13. Li, J.; Han, X.; Liu, Z.; Yao, X.; Li, Y. PD characteristics of oil-pressboard insulation under AC and DC mixed voltage. IEEE Trans. Dielectr. Electr. Insul. 2016, 23, 444–450. [Google Scholar] [CrossRef]
  14. Jacob, N.D.; McDermid, W.M.; Kordi, B. On-line monitoring of partial discharges in a HVDC station environment. IEEE Trans. Dielectr. Electr. Insul. 2012, 19, 925–935. [Google Scholar] [CrossRef]
  15. Fard, M.A.; Farrag, M.E.; McMeekin, S.G.; Reid, A. Partial discharge behaviour under operational and anomalous conditions in HVDC systems. IEEE Trans. Dielect. Electr. Insul. 2017, 24, 1494–1502. [Google Scholar] [CrossRef] [Green Version]
  16. From, U. Interpretation of partial discharges at dc voltages. IEEE Trans. Dielect. Electr. Insul. 1995, 2, 761–770. [Google Scholar] [CrossRef]
  17. Beroual, A.; Khaled, U.; Mbolo Noah, P.S.; Sitorus, H. Comparative study of breakdown voltage of mineral, synthetic and natural oils and based mineral oil mixtures under AC and DC voltages. Energies 2017, 10, 511. [Google Scholar]
  18. Sun, W.; Yang, L.; Zare, F.; Xia, Y.; Cheng, L.; Zhou, K. 3D modeling of an HVDC converter transformer and its application on the electrical field of windings subject to voltage harmonics. Electr. Power Energy Syst. 2020, 117, 105581. [Google Scholar] [CrossRef]
  19. Sarathi, R.; Oza, K.H.; Kumar, C.P.; Tanaka, T. Electrical treeing in XLPE cable insulation under harmonic AC voltages. IEEE Trans. Diel. Electr. Insul. 2015, 22, 3177–3185. [Google Scholar] [CrossRef]
  20. Li, G.; Liang, J.; Joseph, T.; An, T.; Lu, J.; Szechtman, M.; Andersen, B.R.; Zhuang, Q. Feasibility and reliability analysis of LCC DC grids and LCC/VSC Hybrid DC grids. IEEE Access 2019, 7, 22445–22456. [Google Scholar] [CrossRef]
  21. IEC 60270:2000+AMD1:2015 CSV; High-Voltage Test Techniques—Partial Discharge Measurements. International Electrotechnical Commission: Geneva, Switzerland, 2015.
  22. Morshuis, P.H.F.; Smit, J.J. Partial discharges at DC voltage: Their mechanism, detection and analysis. IEEE Trans. Dielectr. Electr. Insul. 2005, 12, 328–340. [Google Scholar] [CrossRef] [Green Version]
  23. Fard, M.A.; Reid, A.J.; Hepburn, D.M. Analysis of HVDC superimposed harmonic voltage effects on partial discharge behavior in solid dielectric media. IEEE Trans. Dielect. Electr. Insul. 2017, 24, 7–14. [Google Scholar] [CrossRef]
  24. Cavallini, A.; Montanari, G.C.; Tozzi, M.; Chen, X. Diagnostic of HVDC systems using partial discharges. IEEE Trans. Dielectr. Electr. Insul. 2011, 18, 275–284. [Google Scholar] [CrossRef]
  25. Florkowski, M. Influence of high voltage harmonics on partial discharge patterns. In Proceedings of the 5th International Conference on Properties and Applications of Dielectric Materials, Seoul, Korea, 25–30 May 1997. [Google Scholar]
  26. Florkowski, M.; Florkowska, B. Distortion of partial-discharge images caused by high-voltage harmonics, IEE Proceedings—Generation. Transm. Distrib. 2006, 153, 171–180. [Google Scholar] [CrossRef]
  27. Florkowski, M.; Florkowska, B.; Furgał, J.; Zydron, P. Impact of high voltage harmonics on interpretation of partial discharge patterns. IEEE Trans. Dielectr. Electr. Insul. 2013, 20, 2009–2016. [Google Scholar] [CrossRef]
  28. Florkowski, M.; Kuniewski, M.; Zydron, P. Partial Discharges in HVDC Insulation with Superimposed AC Harmonics. IEEE Trans. Dielectr. Electr. Insul. 2020, 27, 1906–1914. [Google Scholar] [CrossRef]
  29. Florkowski, M. Observations of Partial Discharge Echo in Dielectric Void by Applying a Voltage Chopped Sequence. Energies 2018, 11, 2518. [Google Scholar] [CrossRef] [Green Version]
  30. Romano, P.; Presti, G.; Imburgia, A.; Candela, R. A new approach to partial discharge detection under DC voltage. IEEE Electr. Insul. Mag. 2018, 34, 32–41. [Google Scholar] [CrossRef]
  31. Imburgia, A.; Rizzo, G.; Romano, P.; Ala, G.; Candela, R. Time evolution of partial discharges in a dielectric subjected to the DC periodic voltage. Energies 2022, 15, 2052. [Google Scholar] [CrossRef]
  32. Kuffel, J.; Zaengl, W.S.; Kuffel, P. High Voltage Engineering Fundamentals, 2nd ed.; Newnes: Oxford, UK, 2000; ISBN 978-0-7506-3634-6. [Google Scholar]
Figure 1. Measurement methodology and synchronization possibilities in HVDC networks for phase-resolved PD measurement: (a) concept and block diagram, (b) DC voltage with a single AC component as DC voltage with model ripple.
Energies 15 02510 g001
Figure 2. Measuring setup for PD measurements of DC voltage with superimposed harmonics: Cxtest object, Zm—coupling impedance, Ck—coupling capacitor, R1, R2—resistive divider, SCU—signal conditioning unit and preamplifier [29].
Energies 15 02510 g002
Figure 3. PRPD patterns acquired at inception voltage: (a) AC 50 Hz, (b) pure AC 300 Hz, (c) mixed DC 10 kV + AC 50 Hz 2 kV. (The scale for the number of pulses N presented on the right side of (c) is the same as for the other PRPD patterns presented in the article).
Energies 15 02510 g003
Figure 4. PRPD patterns at mixed DC 10 kV and additional 50 Hz AC content with a magnitude Upeak: (a) 2 kV, (b) 4 kV, (c) 5 kV, (d) 6 kV, (e) 7 kV, (f) 8 kV.
Energies 15 02510 g004
Figure 5. PD pattern at DC voltage (PD vs. time), at 10 kV; acquisition time 300 s.
Energies 15 02510 g005
Figure 6. PRPD patterns at mixed DC 10 kV and AC 50 Hz Upeak = 6 kV with frequency: (a) 50 Hz, (b) 150 Hz, (c) 300 Hz, (d) 350 Hz.
Energies 15 02510 g006
Publisher’s Note: MDPI stays neutral with regard to jurisdictional claims in published maps and institutional affiliations.

