Article

The Effects of Information and Communication Technology, Economic Growth, Trade Openness, and Renewable Energy on CO2 Emissions in OECD Countries

College of Business Management, Hongik University, Sejong 30016, Korea
Energies 2022, 15(7), 2517; https://doi.org/10.3390/en15072517
Submission received: 2 March 2022 / Revised: 26 March 2022 / Accepted: 28 March 2022 / Published: 29 March 2022
(This article belongs to the Special Issue Advances in Energy and Environmental Economics)

Abstract

:
This study examines the relationships between information and communication technology (ICT) usage and CO2 emissions considering economic growth, trade openness, and renewable electricity in the Organization for Economic Co-operation and Development countries for the period 1990–2018. It adopts pooled mean group (PMG) estimation based on the autoregressive distributed lag model. The PMG estimates indicate that although the coefficient value is small, ICT progress acts as a factor in increasing CO2 emissions in the long run. However, there is no significant short-run relationship between these two variables. Furthermore, economic growth increases CO2 emissions in the short and long run. The expansion of renewable electricity and trade openness reduces CO2 emissions in the long run. To mitigate the CO2 emissions originating from ICT, energy-saving technologies that use ICT as an energy management system should be further enhanced. The expansion of renewable electricity and the promotion of trade openness will also contribute to the mitigation of CO2 emissions in this region.

1. Introduction

Information and communication technology is at the core of the modern knowledge-based society. ICT innovation has been advancing at an unprecedented pace, and worldwide ICT usage has increased rapidly in recent years.
According to World Bank’s Data Bank [1], only 0.23% of the total population of the Organization for Economic Cooperation and Development (OECD) used the Internet in 1990, but this increased to 83.24% in 2018. Furthermore, the number of mobile cellular subscriptions (per 100 people) was only 0.96 in 1990, but it increased rapidly to 121.35 in 2018. Figure 1a illustrates the weighted average of individuals using the Internet per 100 people and mobile cellular subscriptions per 100 people for each selected OECD member country. Although there are differences by country, this generally indicates that the penetration of the Internet and mobile phones has increased rapidly over the past 38 years. These two indicators are evaluated to assess the development of ICT.
However, the expansion of ICT has led to higher electricity consumption due to the increase in ICT terminal devices, networks, and large-scale data centers, resulting in an increase in power consumption. Data centers, in particular, contain IT hardware, such as computers and data storage devices; various types of network equipment for communication (routers, switches, modems, etc.); and heating and cooling infrastructure. The energy used by data centers is 10–100 times that compared to the amount used by commercial buildings in the same area. According to UNEP and DTU [2], the amount of electricity consumed by data centers in 2018 corresponded to 1% of the global electricity demand, but it is expected to account for more than 20% of the total electricity demand in 2030. If ICT electricity consumption increases at the current rate, it will have a negative impact on reducing CO2 emissions. In other words, the expansion of ICT equipment supply accompanies the demand for electricity in terms of use, which leads to an increase in CO2 emissions.
Conversely, despite the increase in energy consumption due to ICT systems, energy efficiency can be improved by using ICT. The development of ICT can contribute to electricity demand and GHG reduction in various aspects. According to Malmodin and Bergmark [3], under the high reduction potential scenario (HRS), approximately 8 gigatons of CO2 can be reduced using ICT in the electricity and service sectors, which constitutes 12.4% of the 63.5 gigatons worth of expected emissions in 2030. These technologies include smart grids, smart buildings, smart transportation, smart work, smart travel, and smart services. Currently, these technologies are still under development, as are some commercialized technologies.
Therefore, it is necessary to empirically analyze the relationship between ICT and CO2 emissions based on past data to determine the influence of ICT on the reduction in greenhouse gas (GHG) emissions.
Previous empirical studies so far have shown contradictory results depending on the study subject. Some studies have shown that ICT usage improved environmental quality by reducing CO2 emissions (Higón et al. [4], Lu [5], Ozcan and Apergis [6], Haseeb et al. [7], Faisal et al. [8], Zhang and Liu [9], Usman et al. [10], Nguyen et al. [11], and Asongu [12]). Other studies have shown that ICT usage deteriorated environmental quality by increasing CO2 emissions (Park et al. [13], Lee and Brahmasrene [14], Salahuddin et al. [15], Asongu et al. [16], Danish et al. [17], Amri [18], Shehzad [19], Raheem et al. [20], Magazzino et al. [21], Avom et al. [22], and Alataş [23]).
This study analyzes the effect of ICT on CO2 emissions, along with economic growth, trade openness, and renewable energy in OECD countries. The OECD member countries consist mostly of developed countries, and ICT in this region has developed rapidly over the past 30 years. Therefore, OECD countries can be considered as an appropriate research subject for analyzing the effect of ICT on CO2 emissions.
The remainder of this paper is structured as follows: Section 2 presents the previous studies on this topic and the differences between this study and previous studies. Section 3 presents the data and methodology discussed in this study. Section 4 presents the estimation results. Section 5 discusses the main results. Section 6 provides a conclusion and some policy implications of the findings.

2. Literature Review

Table 1 shows the previous studies that have analyzed the effects of ICT on CO2 emissions by region since 2016. These studies show mixed results according to the analyses’ target countries, method, period, and level of economic development. Some multi-country panel studies have shown that the increase in ICT usage contributes positively to the improvement of environmental quality by reducing CO2 emissions through the achievement of energy efficiency (Higón et al. [4], Lu [5], Ozcan and Apergis [6], Haseeb et al. [7], and Faisal et al. [8]). Higón et al. [4] investigated the relationship between ICT and CO2 emissions for 142 economies (116 developing and 26 developed countries) from 1995 to 2010. Their empirical results showed that ICT positively contributed to the reduction in CO2 emissions beyond a threshold level of ICT. Lu [5] investigated the effects of ICT, energy consumption, economic growth, and financial development on CO2 emissions in 12 Asian countries for the period 1993–2013 using fully modified ordinary least squares (FMOLS). ICT had a significantly negative effect on CO2 emissions and was reported to have become an important strategy to mitigate CO2 emissions in those countries. Ozcan and Apergis [6] analyzed the effect of Internet use, employed as a proxy for ICT on CO2 emissions for 20 emerging economies for the period 1990–2015. They found that increased Internet access resulted in CO2 emissions. Haseeb et al. [7] examined the impact of ICT (i.e., Internet usage and mobile cellular subscriptions), globalization, electricity consumption, financial development, and economic growth on CO2 emissions for the BRICS economies for the period of 1994–2014. Their results confirmed that ICT reduced CO2 emissions in the long run and positively contributed to environmental quality. Faisal et al. [8] examined the effects of electricity consumption, financial development, economic growth, trade, and ICT on CO2 emissions in fast-emerging countries. There is a study on a single country in which the result showed that ICT leads to a CO2 reduction. Zhang and Liu [9] demonstrated a positive contribution of ICT to the industrial sector in reducing CO2 emissions using Chinese regional data from 2000 to 2010 and the panel data method. Furthermore, Usman et al. [10] found that ICT resulted in CO2 reduction in India by reducing energy consumption. Nguyen et al. [11] found that there was a negative relationship between ICT and CO2 emissions in selected G20 countries. According to Asongu [12], ICT could be employed to dampen the potentially negative effect of globalization on CO2 emissions in 44 Sub-Saharan African countries.
Other multi-country panel studies have shown that an increase in ICT usage damages the environment by releasing a massive amount of CO2 emissions (Park et al. [13], Lee and Brahmasrene [14], Salahuddin et al. [15], Asongu et al. [16], and Danish et al. [17]). Park et al. [13] investigated the impact of Internet use, financial development, economic growth, and trade openness on CO2 emissions in selected European Union (EU) countries for the period of 2001–2014. They found that ICT increases CO2 emissions and threatens sustainable development. Lee and Brahmasrene [14] examined relationships among ICT, CO2 emissions, and economic growth for nine members of the Association of Southeast Asian Nations (ASEAN) from 1991 to 2009. Their results showed that ICT had significant positive effects on CO2 emissions. Salahuddin et al. [15] estimated the short- and long-run effects of Internet usage and CO2 emissions on OECD countries for the period of 1991–2012. Their result indicated a significant positive relationship between Internet usage and CO2 emissions in OECD countries in the long run, which implies that the rapid growth in Internet usage is still an environmental threat for the region. Asongu et al. [16] investigated how ICT complemented globalization to influence CO2 emissions in 44 Sub-Saharan African countries over the period 2000–2012. They found that ICT can be employed to dampen the potentially negative effects of globalization on CO2 emissions. Danish et al. [17] investigated the nexus between ICT, economic growth, financial development, and CO2 emissions in emerging economies to show that ICT increased the level of CO2 emissions in emerging economies. Other studies on a single country also showed that ICT has little effect on CO2 reduction (Amri [18] and Shehzad [19]). Armi [18] examined the relationship between CO2 emissions, total factor productivity, ICT, trade, financial development, and energy consumption in Tunisia from 1975 to 2014. His result showed an insignificant impact of the ICT variable on CO2 emissions. Shehzad [19] investigated the nexus between climate change and ICT development in Pakistan and evaluated the impact of ICT investment and ICT goods trade on CO2 emissions. Their result indicated that investment in ICT could increase CO2 emissions. In addition, research suggesting that ICT increases CO2 emissions includes Raheem et al. [20], Magazzino et al. [21], Avom et al. [22], and Alataş [23].
Table 1. Previous Panel Studies on ICT and CO2 emissions.
RegionsPeriodsMethodsSigns of ICT Variable on CO2 Emissions
Higón et al. [4]116 developing and 26 developed countries1995–2010Pooled Ordinary Least Squares
Driscoll–Kraay Fixed
Effects model
Instrumental variable Fixed Effect model
Negative
Lu [5]12 Asian countries 11993–2013Pedroni cointegration testNegative
Ozcan and Apergis [6]20 emerging economies 21990–2015MG estimator GM FMOLSNegative
Haseeb et al. [7]BRICS countries 31994–2014FMOLS and DSURNegative
Faisal et al. [8]Fast emerging countries 41993–2014FMOLS, DOLS, robust least squareNegative
Zhang and Liu [9]China2000–2010STIRPATNegative
Park et al. [13]EU countries 52001–2014MG estimatorPositive
Lee and Brahmasrene [14]ASEAN countries 61991–2009FMOLS
Canonical Cointegrating Regression
Dynamic OLS
Positive
Salahuddin et al. [15]OECD countries 71991–2012PMG, DOLS, FMOLSPositive
Asongu et al. [16]44 countries in Sub-Saharan Africa2000–2012Generalized Method of MomentsInsignificant
Danish et al. [17]11 countries 81990–2014MG estimatorPositive
Amri [18]Tunisia1975–2014ARDLInsignificant
Shehzad [19]Pakistan1990–2018STIRPAT and ARDLPositive
Note: 1 Brazil, India, China, and South Africa. 2 Brazil, Chile, China, Colombia, the Czech Republic, Egypt, Hungary, Indonesia, India, Greece, Mexico, Malaysia, Peru, the Philippines, Poland, Russia, South Africa, South Korea, Thailand, and Turkey. 3 Austria, Belgium, Bulgaria, Croatia, Cyprus, the Czech Republic, Denmark, Finland, France, Germany, Greece, and Hungary, Ireland, Italy, Luxembourg, the Netherland, Poland, Portugal, Romania, Slovenia, Spain, Sweden, and the UK. 4 Brazil, Chile, China, Colombia, the Czech Republic, Egypt, Hungary, Indonesia, India, Greece, Mexico, Malaysia, Peru, the Philippines, Poland, Russia, South Africa, South Korea, Thailand, and Turkey. 5 Australia, Hong Kong, Japan, India, Indonesia, Korea, Malaysia, Philippines, Singapore, Thailand, and Turkey. 6 Brazil, China, Russia, India, and South Africa. 7 31 countries of OECD. 8 Bangladesh, Egypt, Indonesia, Iran, South Korea, Mexico, Nigeria, Pakistan, Philippines, Turkey, and Vietnam.
This study differs from previous studies in several ways. First, the subjects of analysis were OECD countries. Since these countries are generally classified as high-income countries, they are relatively active in addressing climate change policies. Understanding the GHG characteristics of these countries can help establish policies to address climate change in the future. Common characteristics of the OECD countries are that their levels of ICT are higher those in other countries and that they are leaders in related ICT usage. Therefore, it is important to analyze the influence of various factors on CO2 emissions in OECD countries. Although Salahuddin et al. [15] analyzed OECD countries, their study has limited relevance, as the analysis period was 10 years prior, and the recent changes in ICT were not reflected.
Second, the supply of renewable energy in OECD countries has gradually increased since 2000. Renewable energy has been an efficient and reliable means of reducing CO2 emissions. Recently, there were several studies on the role of renewable energy in mitigating CO2 emissions. Recent previous studies include Menyah and Wolde_Rufael [24], Apergis et al. [25], Shafiel and Salim [26], Jaforullah and King [27], Bilgili et al., [28], Dogan and Seker [29], Ito [30], Zoundi [31], Jebli et al. [32], Dong et al. [33], and Inglesi-Lotz and Dogan [34]. Most of these previous studies have shown that renewable energy has significantly contributed to the mitigation of CO2 emissions. However, previous empirical models for the impact of ICT on CO2 emissions do not sufficiently reflect the effects of these renewable energy sources. Specifically, Salahuddin et al. [15] also did not consider the effect of renewable energy on the GHG emissions in the context of OECD countries. Therefore, this study considered renewable electricity as a factor influencing CO2 emissions.
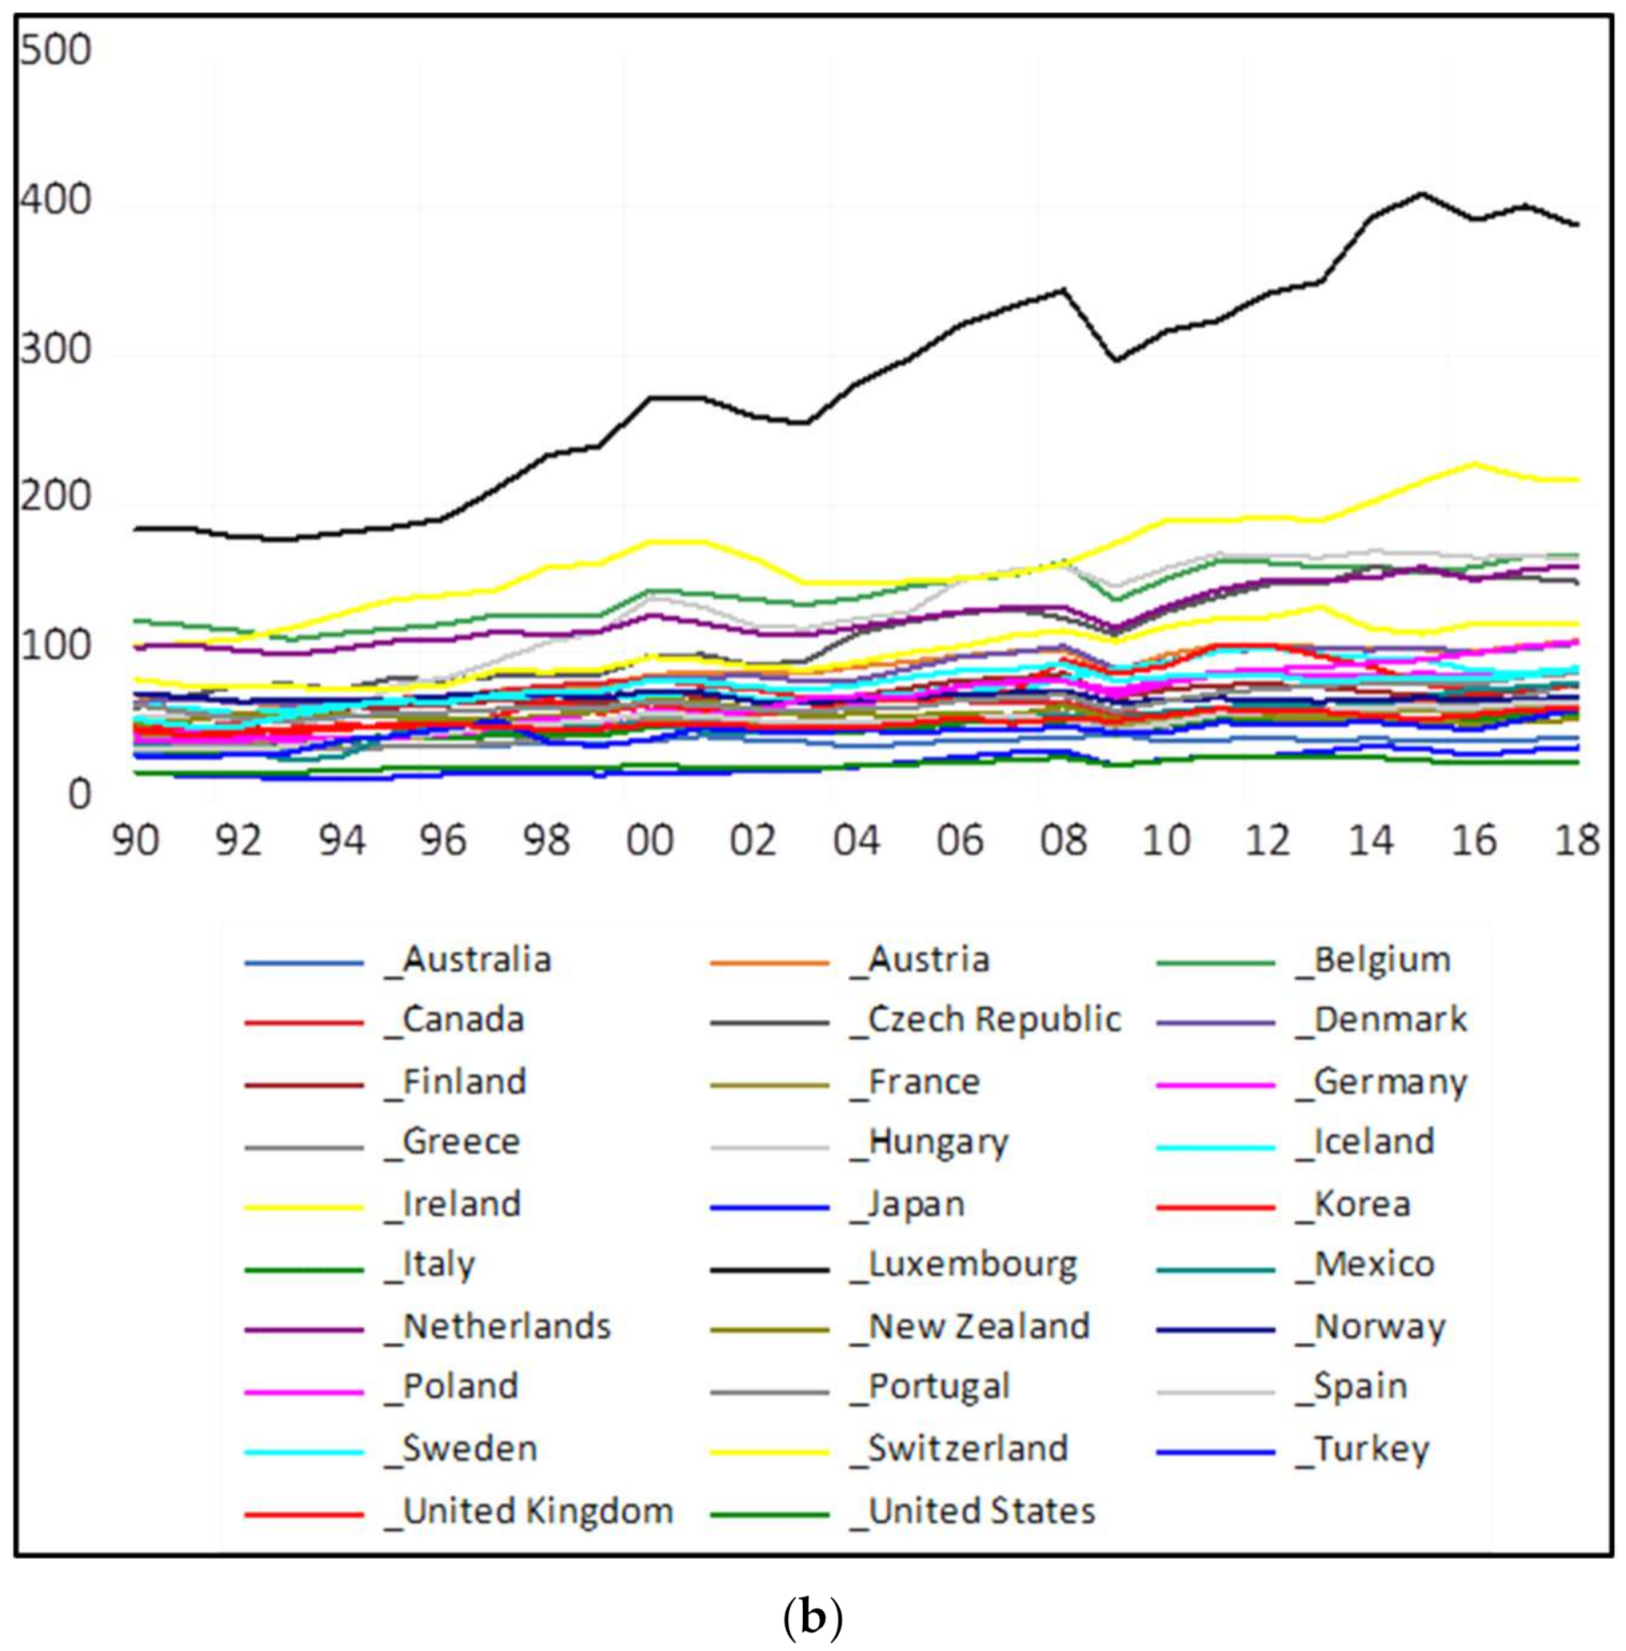
Third, economic growth was included as an important factor influencing CO2 emissions in most previous studies. However, although trade openness was included as a factor affecting CO2 emissions in some previous studies (Park et al. [13], Faisal et al. [8], Ozcan [6], Armi [18], and Shehzad [19]), there are other studies where it was not included as a factor influencing CO2 emissions (Haseeb et al. [7], Lu [5], Lee and Brahmasrene [14], Higón et al. [4], and Zhang and Liu [9]). Even studies that included trade openness as a factor influencing CO2 emissions may or may not be statistically significant. As shown in Figure 1b, most OECD countries are very open to trade and show increasing trends. Therefore, in this study, trade openness was included and analyzed as a factor affecting CO2 emission.
Fourth, in terms of analysis methods, the mean group (MG) estimator and FMOLS were mainly used in the existing panel analyses. However, this study used the pooled mean group (PMG) in line with Salahuddin et al. [15]. The pooled-mean-group (PMG) estimator of Pesaran et al. [35] assumes a common long-run equilibrium relationship across countries, allowing country-specific short-run dynamics. Furthermore, the PMG estimators are consistent and asymptotically normal when the regression variables are I(0) and I(1). Therefore, through this methodology, it is possible to identify the common characteristics of the OECD countries.

3. Data and Methods

This study adopted the PMG estimation introduced by Pesaran et al. [35], which is based on the autoregressive distributed lag (ARDL) model. There are several different approaches for estimating a panel dataset with many cross-sections. The within-groups (WG) estimator is consistent for the dynamic homogeneous model with a large time and cross-sectional dimension (n → ∞). Since the WG estimator assumes homogeneity of all slope coefficients, the presence of parametric heterogeneity may lead to incorrect estimates. In case of the MG estimator of Pesaran and Smith [36], all intercepts of slope coefficients are allowed, and error variances vary across countries. Therefore, the coefficients of MG estimators are considerably heterogeneous. The MG method derives long-run parameter estimates by applying a separate general least squares (OLS) equation to each country (or cross-section) and then averaging the coefficients. In the case of a reasonably long lag order for ARDL, the MG estimates of the long run parameters are very consistent, even if the regressors are nonstationary. The MG estimator may be inefficient in a small time dimension.
The PMG estimator of Pesaran et al. [35] assumes a common long-run equilibrium relationship across countries, but short-run dynamics of each country vary from country to country. The PMG estimators are consistent and asymptotically normal in cases where the regressors are I(0) and I(1). In this study, the PMG estimation was followed.
The specific ARDL ( p ,   q 1 ,   q 2 ,   q 3 ,   q 4 ) equation is given as:
L C O 2 E i t = j = 1 p λ i j L C O 2 E i ,   t j + j = 0 q 1 δ i j 1 L G D P i , t j + j = 0 q 2 δ i j 2 L T R i , t j + j = 0 q 3 δ i j 3 L I C T i , t j + j = 0 q 4 δ i j 4 L R E W i . t j + μ i + ε i t ,
where i denotes the country that is the cross-sectional unit; t   denotes the time period; ε i t is the error term; μ i is the fixed effect that is a specific cross-section effect. L C O 2 E denotes the log of the CO2 emissions per capita (metric tons per capita); L G D P denotes the logarithm of the gross domestic product (GDP) per capita (constant 2015 US $); L T R denotes the logarithm of the trade openness (the sum of exports and imports divided by the GDP (%); L I C T denotes the logarithm of the weighted average of individuals using the Internet (per 100 people) and mobile cellular subscriptions (per 100 people); L R E W denotes the logarithm of the share of renewable electricity in the total electricity generation (%); λ i j represents the coefficients of the lagged dependent variables; δ i j 1 ~ δ i j 4 represents the coefficients of lagged independent variables on dependent variables; μ i represents fixed effects for the cross-sectional unit; and ε i t represents error terms.
Equation (1) can be re-specified to include an error correction term, as follows:
Δ L C O 2 E i t = θ i v i , t 1 + j = 1 p 1 γ i j Δ L C O 2 E i ,   t j + j = 0 q 1 1 γ i j 1 Δ L G D P i , t j + j = 0 q 2 1 γ i j 2 Δ L T R i , t j + j = 0 q 3 1 γ i j 3 Δ L I C T i , t j + j = 0 q 4 1 γ i j 4 Δ L R E W i . t j + μ i + ε i t ,
where v i , t 1 = L C O 2 E i ,   t 1 ϕ 0 i ϕ 1 i L G D P i , t 1 ϕ 2 i L T R i , t 1 ϕ 3 i L I C T i , t 1 + ϕ 4 i L R E W i . t 1 is the linear error correction term for each cross section. Δ represents the time difference, and θ i is a coefficient of the error correction term, which means the speed of adjustment back to long-run equilibrium. Here, γ i j 1 ~ γ i j 4 are the short-run coefficients. ϕ 1 i ~ ϕ 4 i are the long-run coefficients for each cross section, and p, q 1 ,   q 2 ,   q 3 ,   and   q 4 are the optimal lag lengths, determined by the Schwartz criterion (SC) and Hannan–Quinn criterion (HQC), respectively.
The PMG restriction is that the elements of long-run coefficients are common across countries, thus:
Δ L C O 2 E i t = θ i * w i , t 1 + j = 1 p 1 γ i j * Δ L C O 2 E i ,   t j + j = 0 q 1 1 γ i j * 1 Δ L G D P i , t j + j = 0 q 2 1 γ i j * 2 Δ L T R i , t j + j = 0 q 3 1 γ i j * 3 Δ L I C T i , t j + j = 0 q 4 1 γ i j * 4 Δ L R E W i . t j + μ i + ε i t ,
where, w i , t 1 = L C O 2 E i ,   t 1 ϕ 0 ϕ 1 L G D P i , t 1 ϕ 2 L T R i , t 1 ϕ 3 L I C T i , t 1 + ϕ 4 L R E W i . t 1 is the common linear error correction term. θ i * is a coefficient of the error correction term and means the speed of adjustment back to long-run equilibrium in the PMG model. If θ i * is negative, statistically significant, and less than one in terms of absolute value, this model is dynamically stable among dependent and independent variables and converges to the long-run equilibrium. γ i j * 1 ~ γ i j * 4 are the short-run coefficients. ϕ 1 ~ ϕ 4 are the common long-run coefficients across countries.
The dataset comprised an unbalanced panel of the following 29 OECD countries over the period of 1990–2018: Australia, Austria, Belgium, Canada, Czech Republic, Denmark, Finland, France, Germany, Greece, Hungary, Iceland, Ireland, Italy, Japan, Korea, Luxembourg, Mexico, the Netherlands, New Zealand, Norway, Poland, Portugal, Spain, Sweden, Switzerland, Turkey, the United Kingdom, and the United States. The countries excluded from this analysis were Chile, Colombia, Costa Rica, Estonia, Lithuania, Latvia, Slovak Republic, and Slovenia, because the data from these countries were insufficient, as they joined the OECD after 2000. The specific data and sources are presented in Table 2. The C O 2 E , T R , and I C T were from the DataBank of the World Bank, and the G D P and R E W were from OECD.Stat from the OECD.
Table 3 shows the correlations among the panel data variables. L C O 2 E is negatively correlated with the other variable. It has the highest correlation with L T R and the lowest negative correlation with L I C T . L G D P is positively correlated with L T R , L I C T , and L R E W , and it is negatively correlated with L C O 2 E . L G D P has the highest positive correlation with L I C T and the lowest positive correlation with L R E W .

4. Estimation Results

4.1. Unit Root Tests

Four types of panel unit root tests that assume cross-sectional independence were conducted in this study (Levin et al., [37], Im et al. [38], Dickey and Fuller [39], and Phillips and Perron [40]). For these tests, the null and alternative hypotheses were the presence and absence of a unit root, respectively. According to Im et al. [39]’s W-statistic, ADF-Fisher Chi-square statistic, and PP-Fisher Chi-square statistic, for each level variable except L I C T , the null hypothesis cannot be rejected at the 5% level, as shown in Table 4. For each first difference variable, the null hypothesis can be rejected at the 1% level, as shown in Table 5. Therefore, L I C T was the I(0) variable and the other variables wre I(1).

4.2. Cointegration Tests

The cointegration of these mixed variables was examined using the tests developed by Pedroni [41,42]. Pedroni panel cointegration tests were used to test the residuals of the following equation for unit root variables:
ε ^ i t = ρ i ε ^ i t 1 + δ i t
The tests provide four statistics in the within-dimension (panel) approach with common AR coefficients and three statistics in the between-dimension (group) approach with individual AR coefficients. For the within-dimension approach, the null hypothesis was no cointegration ( ρ i = 1 for all i), and the alternative hypothesis was the presence of cointegration ( ρ i < 1 for all i). The group-means approach is less restrictive because it does not require a common value of ρ i under the alternative hypothesis.
Four within-dimension statistics indicated cointegration at the 1% level. In the between-dimension case, two statistics indicated cointegration at the 1% level, as shown in Table 6.
Additionally, the Kao residual cointegration test was also conducted, in which the null hypothesis of no cointegration was rejected at the 5% level.

4.3. Long-Run Coefficients

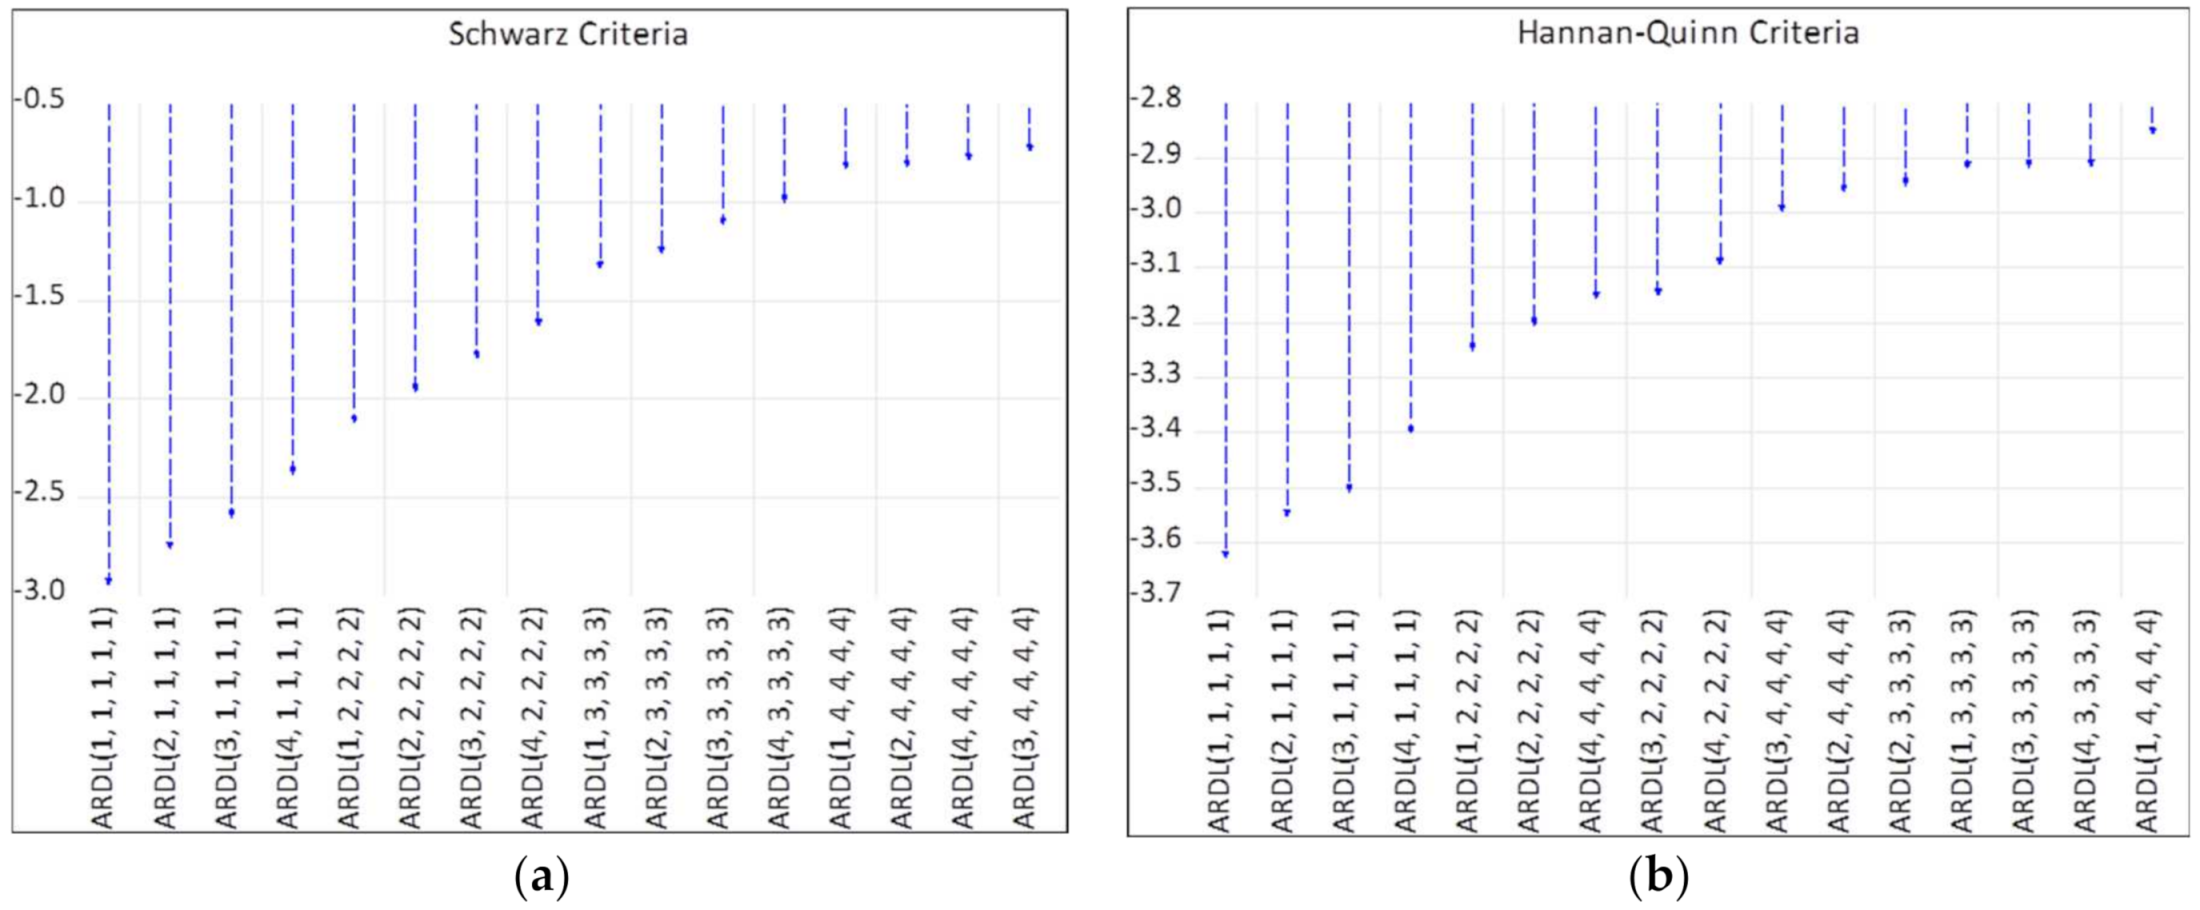
An appropriate lag length should be selected to avoid incorrect estimation and a low model reliability. According to SC and HQC, the appropriate lag length for the ARDL model is ARDL (1, 1, 1, 1, 1). Therefore, the appropriate lag lengths for LCO2E, LGDP, LTR, LICT, and LREW were 1, 1, 1, 1, and 1, respectively (Figure 2).
Table 7 shows the long-run PMG estimation results. The estimated long-run coefficient of the economic growth variable was 0.3658, which was positive and statistically significant at the 1% level. This result indicates that CO2 emissions increase as the economy grows and that economic growth has been a contributor to CO2 emission growth. The estimated long-run coefficient of the trade openness variable was −0.4663, which was negative and statistically significant at the 1% level. As the degree of trade openness increased, CO2 emissions decreased. This is because the proportion of products with a high carbon intensity in the composition of imports gradually increased, and the proportion of products with a high carbon intensity in the composition of exports gradually decreased, respectively. In other words, the import of goods produced by industries with a high energy intensity increased over the sample period as well as the exports of goods produced by industries with a low energy intensity.
The estimated long-run coefficient of the ICT variable was 0.0305, which was positive and statistically significant at the 1% level. Although the coefficient was small, ICT played a role in slightly increasing CO2 emissions in the long run. The estimated long-run coefficient of the renewable electricity variable was −0.7724, which was negative and statistically significant at the 1% level. Comparing the absolute values, the coefficient of the renewable electricity variable was the largest. The expansion of renewable energy could thus be a useful policy for reducing CO2 emissions.

4.4. Short Run Cofficients

As shown in Table 8, regarding the short-run coefficients, the estimated coefficient of the error correction term was −0.1523. Since the coefficient was negative and statistically significant and less than one in absolute value, the dynamics were stable and converged to the long-run equilibrium.
The estimated short-run coefficient of the economic growth variable was 0.5185, which was positive and statistically significant at the 1% level. In the short-run, economic growth is a major factor that increases CO2 emissions. The estimated short-run coefficient for the trade openness variable was 0.0822, which was positive and statistically significant at the 1% level. However, the magnitude of the short-run coefficient for the trade openness was too small. Therefore, it is difficult to conclude whether trade openness has increased CO2 emissions.
The estimated short-run coefficients of ICT and renewable electricity were not statistically significant. Therefore, policies for CO2 reduction through the expansion of renewable energy supply and the development of ICT should be pursued from a long-run perspective.

5. Discussion

The importance of ICT in reducing GHG emissions has been actively discussed in recent studies. According to Salahudddin et al. [15], who studied OECD countries, the coefficient of Internet use (the proxy variable of ICT) showed a positive sign that was statistically significant at the 95% confidence level. Their results correspond to this study’s, in which the ICT variable also showed a positive sign that was statistically significant at the 99% confidence level, even though the proxy variable of ICT was different. The study period of Salahuddin et al. [15] was 1991–2012, and the study period in this investigation was 1991–2018. The coefficient of the effect of ICT on CO2 emissions in this study still showed a positive sign as well as the coefficient of Salahuddin et al. [15]. Therefore, CO2 reduction by ICT has not yet been achieved in OECD countries, although the recent development of ICT has been reflected. This means that energy-saving technology using ICT has not yet progressed as expected. Combining the study results of the effects of ICT on CO2 emissions in the OECD countries so far, it seems that CO2 reduction using ICT has not yet been achieved from a macroeconomic point of view. However, energy consumption saving technologies using ICT are expected to improve gradually with the development of the energy-saving related ICT devices and software in the future. Therefore, policy efforts are needed to further promote CO2 reduction using ICT.
As shown in the results of this study, the reduction in CO2 emissions due to the expansion of renewable electricity is very clear in the long-run. Similar results have also been found in previous studies for OECD countries. Safiel and Salim [26] studied the effect of renewable energy on CO2 emissions in 29 OECD countries over the period of 1980–2011, and Bilgili et al. [28] studied 17 OECD countries over the period of 1965–2012. Both studies found that renewable energy consumption decreases CO2 emissions, which corresponds to the results of this study. Each OECD country is trying to expand its supply of renewable energy. However, the expansion of the supply of renewable energies depends on various factors, such as the technological level, geographical conditions, and social acceptability. Therefore, in order to expand the supply of renewable energy in OECD countries, cooperation between countries is important not only for technological development, but also for overcoming geographical limitations and social acceptability.
This study found that the coefficient of trade openness mitigates CO2 emissions. The results of this study are consistent with those of previous studies (Park et al. [13] and Faisal et al. [8]) However, some studies are not consistent with the results of this study (Ozcan and Apergis [6], Armi [18], and Shehzad [19]). Most of the studies that did not match the results of this study are studies on developing countries. Park et al. [13] indicated that the increase in trade openness improves environmental quality in OECD countries. In recent years, developed countries have progressed with remarkable innovation in new technologies, and OECD countries have taken advantage of the technology spillover through trade openness (Dogan and Seker [29]). The effect of trade openness on the environment is composed of the scale, technique, and composition effect (Balsalobre-Lorente et al. [43]). In particular, the imports and exports of ICT devices and software appear to be highly related to a CO2 emissions reduction. Therefore, the study of the effects of imports and exports of ICT equipment and software on CO2 emissions will be left for future research.

6. Conclusions and Policy Implications

This study examined the relationship between ICT usage and CO2 emissions incorporating the degree of trade openness and the share of new and renewable electricity in OECD countries for the period 1990–2018. The data stationarity was tested using Pedroni co-integration tests and the Kao residual cointegration test, which confirmed a cointegrating relationship among the relevant variables. A PMG estimation was also applied to estimate the short- and long-run relationship between the explanatory variable as well as ICT usage and CO2 emissions.
The PMG estimates indicated a positive significant long run relationship between ICT usage and CO2 emissions in the OECD countries. Although the coefficient value was small, ICT progress contributed to increasing CO2 emissions in the long run. However, there was no significant relationship between these variables in the short run. The expansion of ICT usage did not affect CO2 emissions in the short run.
The effects of the other variables on CO2 emissions are as follows. Economic growth acted as a factor in increasing CO2 emissions both in the long and short run. Trade openness reduced CO2 emissions in the long run. However, it had minor effects on CO2 emissions in the short run. As expected, the increase in the share of renewable electricity acted to reduce CO2 emissions in the long run and only had a minor effect on CO2 emissions in the short run. The statistically significant error correction coefficient of −0.1523 indicated that a full convergence process will take approximately 6.5 years to reach a stable equilibrium path.
The spread of ICT-related devices, such as mobile phones, Internet servers, and computers, has been accompanied by an increase in electricity consumption. However, along with the spread of such hardware, software development for efficient-energy consumption is also being actively developed. These two effects increase the energy consumption on the one hand and reduce it on the other hand. Therefore, ICT progress may have an opposite effect on CO2 emissions, depending on how it is used technologically and economically. Malmodin and Bergmark [3] explored the possible GHG emission reductions given different ICT solutions globally within 2030 and indicated a total GHG emission reduction potential due to the studied ICT solutions of approximately 8 gigatons of CO2-eq or 12% of the global GHG emissions in 2030 in a high-reduction scenario and 4 gigatons of CO2-eq in 2030 or 6% in a medium-reduction-potential scenario. To efficiently reduce GHG emissions in addressing climate change, the energy-saving ICT should be further promoted. Energy-saving technologies for power generation, factories, buildings, transportation, and various services should be further encouraged, and incentives should be given to companies that save energy efficiently. The expansion of renewable electricity and the promotion of trade openness will also contribute to the mitigation of CO2 emissions in this region.
The limitations of this study are as follows. First, the EKC was not checked in the relationship between economic growth and CO2 emissions. It is difficult to reflect the EKC effect in the PMG model. Therefore, it is necessary to check these relationships through other econometric models. Second, there may be several proxies representing ICT, but the proxies that have been consistently organized over the past 30 years were the proxies used in this study. If proxies representing various ICTs are developed in the future, it will be necessary to re-perform this analysis using them. Third, the trade variable used in this analysis represents total trade. In other words, only the knowledge spillovers through the entire trade were reflected. In future research, it is necessary to further refine this analysis by reflecting the trade between ICT devices and software.

Funding

This study was supported by the 2021 Hongik University Research Fund.

Institutional Review Board Statement

Not applicable.

Informed Consent Statement

Not applicable.

Data Availability Statement

Not applicable.

Acknowledgments

This paper was presented at ‘the 10th Congress of the Asian Association of Environmental and Resource Economics’. The valuable comments obtained from conference participants concerning this study are appreciated.

Conflicts of Interest

The author declares no conflict of interest.

References

  1. World Bank DataBank. Available online: https://databank.worldbank.org/home.aspx (accessed on 1 June 2020).
  2. UNEP. DTU Data Centers: Digitalisation Powerhouse and Energy Efficiency Potential. 2020. Available online: https://c2e2.unepdtu.org/kms_object/data-centres-digitalisation-powerhouse-and-energy-efficiency-potential/ (accessed on 10 January 2022).
  3. Malmodin, J.; Bergmark, P. Exploring the effect of ICT solutions on GHG emissions in 2030. In Proceedings of the 29th International Conference on Informatics for Environmental Protection (EnviroInfo 2015) Third International Conference on ICT for Sustainability (ICT4S 2015), Copenhagen, Denmark, 7–9 September 2015. [Google Scholar]
  4. Higón, D.A.; Gholami, R.; Shirazi, F. ICT and environmental sustainability: A global perspective. Telemat. Inform. 2017, 34, 85–95. [Google Scholar] [CrossRef]
  5. Lu, W.C. The impacts of information and communication technology, energy consumption, financial development, and economic growth on carbon dioxide emissions in 12 Asian countries. Mitig. Adapt. Strateg. Glob. Chang. 2018, 23, 1351–1365. [Google Scholar] [CrossRef]
  6. Ozcan, B.; Apergis, N. The impact of internet use on air pollution: Evidence from emerging countries. Environ. Sci. Pollut. Res. 2018, 25, 4174–4189. [Google Scholar] [CrossRef] [PubMed]
  7. Haseeb, A.; Xia, E.; Saud, S.; Ahmad, A.; Khurshid, H. Does information and communication technologies improve environmental quality in the era of globalization? an empirical analysis. Environ. Sci. Pollut. Res. 2019, 26, 8594–8608. [Google Scholar] [CrossRef] [PubMed]
  8. Faisal, F.; Azizullah; Tursoy, T.; Pervaiz, R. Does ICT lessen CO2 emissions for fast-emerging economies? an application of the heterogeneous panel estimations. Environ. Sci. Pollut. Res. 2020, 27, 10778–10789. [Google Scholar] [CrossRef]
  9. Zhang, C.; Liu, C. The impact of ICT industry on CO2 emissions: A regional analysis in China. Renew. Sustain. Energy Rev. 2015, 44, 12–19. [Google Scholar] [CrossRef]
  10. Usman, A.; Ozturk, I.; Hassan, A.; Zafar, A.; Zafar, A.M.; Ullah, S. The effect of ICT on energy consumption and economic growth in South Asian economies: An empirical analysis. Telemat. Inform. 2021, 58, 101537. [Google Scholar] [CrossRef]
  11. Nguyen, T.T.N.; Pham, T.A.T.; Tram, H.T.X. Role of information and communication technologies and innovation in driving carbon emissions and economic growth in selected G-20 countries. J. Environ. Manag. 2020, 261, 110162. [Google Scholar] [CrossRef]
  12. Asoungu, S.A. ICT, openness and CO2 emissions in Africa. Environ. Sci. Pollut. 2018, 25, 9351–9359. [Google Scholar] [CrossRef] [Green Version]
  13. Park, Y.; Meng, F.; Baloch, M.A. The effect of ICT, financial development, growth, and trade openness on CO2 emissions: An empirical analysis. Environ. Sci. Pollut. Res. 2018, 25, 30708–30719. [Google Scholar] [CrossRef]
  14. Lee, J.W.; Brahmasrene, T. ICT, CO2 Emissions and Economic Growth: Evidence from a Panel of ASEAN. Glob. Econ. Rev. 2014, 43, 93–109. [Google Scholar] [CrossRef]
  15. Salahuddin, M.; Alam, K.; Ozturk, I. The effects of Internet usage and economic growth on CO2 emissions in OECD countries: A panel investigation. Renew. Sustain. Energy Rev. 2016, 62, 1226–1235. [Google Scholar] [CrossRef]
  16. Asongu, S.A.; Le Roux, S.; Biekpe, N. Enhancing ICT for environmental sustainability in sub-Saharan Africa. Technol. Forecast. Soc. Change 2018, 127, 209–216. [Google Scholar] [CrossRef] [Green Version]
  17. Khan, N.; Baloch, M.A.; Saud, S.; Fatima, T. The effect of ICT on CO2 emissions in emerging economies: Does the level of income matters? Environ. Sci. Pollut. Res. 2018, 25, 22850–22860. [Google Scholar] [CrossRef]
  18. Amri, F. Carbon dioxide emissions, total factor productivity, ICT, trade, financial development, and energy consumption: Testing environmental Kuznets curve hypothesis for Tunisia. Environ. Sci. Pollut. Res. 2018, 25, 33691–33701. [Google Scholar] [CrossRef]
  19. Shehzad, K.; Xiaoxing, L.; Sarfraz, M.; Zulfiqar, M. Signifying the imperative nexus between climate change and information and communication technology development: A case from Pakistan. Environ. Sci. Pollut. Res. 2020, 27, 30502–30517. [Google Scholar] [CrossRef]
  20. Raheem, I.D.; Tiwari, A.K.; Balsalobre-Lorente, D. The role of ICT and financial development in CO2 emissions and economic growth. Environ. Sci. Pollut. Res. 2020, 27, 1912–1922. [Google Scholar] [CrossRef] [Green Version]
  21. Magazzino, C.; Porrini, D.; Fusco, G.; Schneider, N. Investigating the link among ICT, electricity consumption, air pollution, and economic growth in EU countries. Energy Sources Part B Econ. Plan. Policy 2021, 16, 976–998. [Google Scholar] [CrossRef]
  22. Avom, D.A.; Nkengfack, H.; Fotio, H.K.; Totouom, A. ICT and environmental quality in Sub-Saharan Africa: Effects and transmission channels. Technol. Forecast. Soc. Change 2020, 155, 120028. [Google Scholar] [CrossRef]
  23. Alataş, S. The role of information and communication technologies for environmental sustainability: Evidence from a large panel data analysis. J. Environ. Manag. 2021, 293, 112889. [Google Scholar] [CrossRef]
  24. Menyah, K.; Wolde-Rufael, Y. CO2 emissions, nuclear energy, renewable energy and economic growth in the US. Energy Policy 2010, 38, 2911–2915. [Google Scholar] [CrossRef]
  25. Apergis, N.; Payne, J.E.; Menyah, K.; Wolde-Rufael, Y. On the causal dynamics between emissions, nuclear energy, renewable energy, and economic growth. Ecol. Econ. 2010, 69, 2255–2260. [Google Scholar] [CrossRef]
  26. Shafiei, S.; Salim, R.A. Non-renewable and renewable energy consumption and CO2 emissions in OECD countries: A comparative analysis. Energy Policy 2014, 66, 547–556. [Google Scholar] [CrossRef] [Green Version]
  27. Jaforullah, M.; King, A. Does the use of renewable energy sources mitigate CO2 emissions? A reassessment of the US evidence. Energy Econ. 2015, 49, 711–717. [Google Scholar] [CrossRef]
  28. Bilgili, F.; Koçak, E.; Bulut, Ü. The dynamic impact of renewable energy consumption on CO2 emissions: A Revisited Environmental Kuznets Curve approach. Renew. Sustain. Energy Rev. 2016, 54, 838–845. [Google Scholar] [CrossRef]
  29. Dogan, E.; Seker, F. Determinants of CO2 emissions in the European Union: The role of renewable and non-renewable energy. Renew. Energy 2016, 94, 429–439. [Google Scholar] [CrossRef]
  30. Ito, K. CO2 emissions, renewable and non-renewable energy consumption, and economic growth: Evidence from panel data for developing countries. Int. Econ. 2017, 151, 1–6. [Google Scholar] [CrossRef]
  31. Zoundi, Z. CO2 emissions, renewable energy and the Environmental Kuznets Curve, a panel cointegration approach. Renew. Sustain. Energy Rev. 2017, 72, 1067–1075. [Google Scholar] [CrossRef]
  32. Jebli, M.B.; Farhani, S.F.; Guesmi, K. Renewable energy, CO2 emissions and value added: Empirical evidence from countries with different income levels. Struct. Change Econ. Dyn. 2020, 53, 402–410. [Google Scholar] [CrossRef]
  33. Dong, K.; Hochman, G.; Zhang, Y.; Sun, R.; Li, H.; Liao, H. CO2 emissions, economic and population growth, and renewable energy: Empirical evidence across regions. Energy Econ. 2018, 75, 180–192. [Google Scholar] [CrossRef]
  34. Inglesi-Lotz, R.; Dogan, E. The role of renewable versus non-renewable energy to the level of CO2 emissions a panel analysis of sub-Saharan Africa’s Βig 10 electricity generators. Renew. Energy 2018, 123, 36–43. [Google Scholar] [CrossRef] [Green Version]
  35. Pesaran, M.H.; Shin, Y.; Smith, R.P. Pooled Mean Group Estimation of Dynamic Heterogeneous Panels. J. Am. Stat. Assoc. 1999, 94, 621–634. [Google Scholar] [CrossRef]
  36. Pesaran, M.H.; Smith, R.P. Estimating long-run relationships from dynamic heterogeneous panels. J. Econom. 1995, 68, 79–113. [Google Scholar] [CrossRef]
  37. Levin, A.; Lin, C.F.; Chu, C. Unit root tests in panel data: Asymptotic and Finite sample properties. J. Econom. 2002, 108, 1–24. [Google Scholar] [CrossRef]
  38. Im, K.S.; Pesaran, M.H.; Shin, Y. Testing for unit roots in heterogeneous panels. J. Econmetr. 2003, 115, 53–74. [Google Scholar] [CrossRef]
  39. Dickey, D.A.; Fuller, W.A. Distribution of the estimators for autoregressive time series with a unit root. J. Am. Stat. Assoc. 1979, 74, 427–431. [Google Scholar]
  40. Phillips, P.C.B.; Perron, P. Testing for a unit root in time series regression. Biometrika 1988, 75, 335–346. [Google Scholar] [CrossRef]
  41. Pedroni, P. Critical values for cointegration tests in heterogeneous panels with multiple regressors. Oxf. Bull. Econ. Stat. 1999, 61, 653–670. [Google Scholar] [CrossRef]
  42. Pedroni, P. Purchasing power parity tests in cointegrated panels. Rev. Econ. Stat. 2001, 83, 727–731. [Google Scholar] [CrossRef] [Green Version]
  43. Balsalobre-Lorente, D.; Shahbaz, M.; Roubaud, D.; Farhani, S. How economic growth, renewable electricity and natural resources contribute to CO2 emissions? Energy Policy 2018, 113, 356–367. [Google Scholar] [CrossRef] [Green Version]
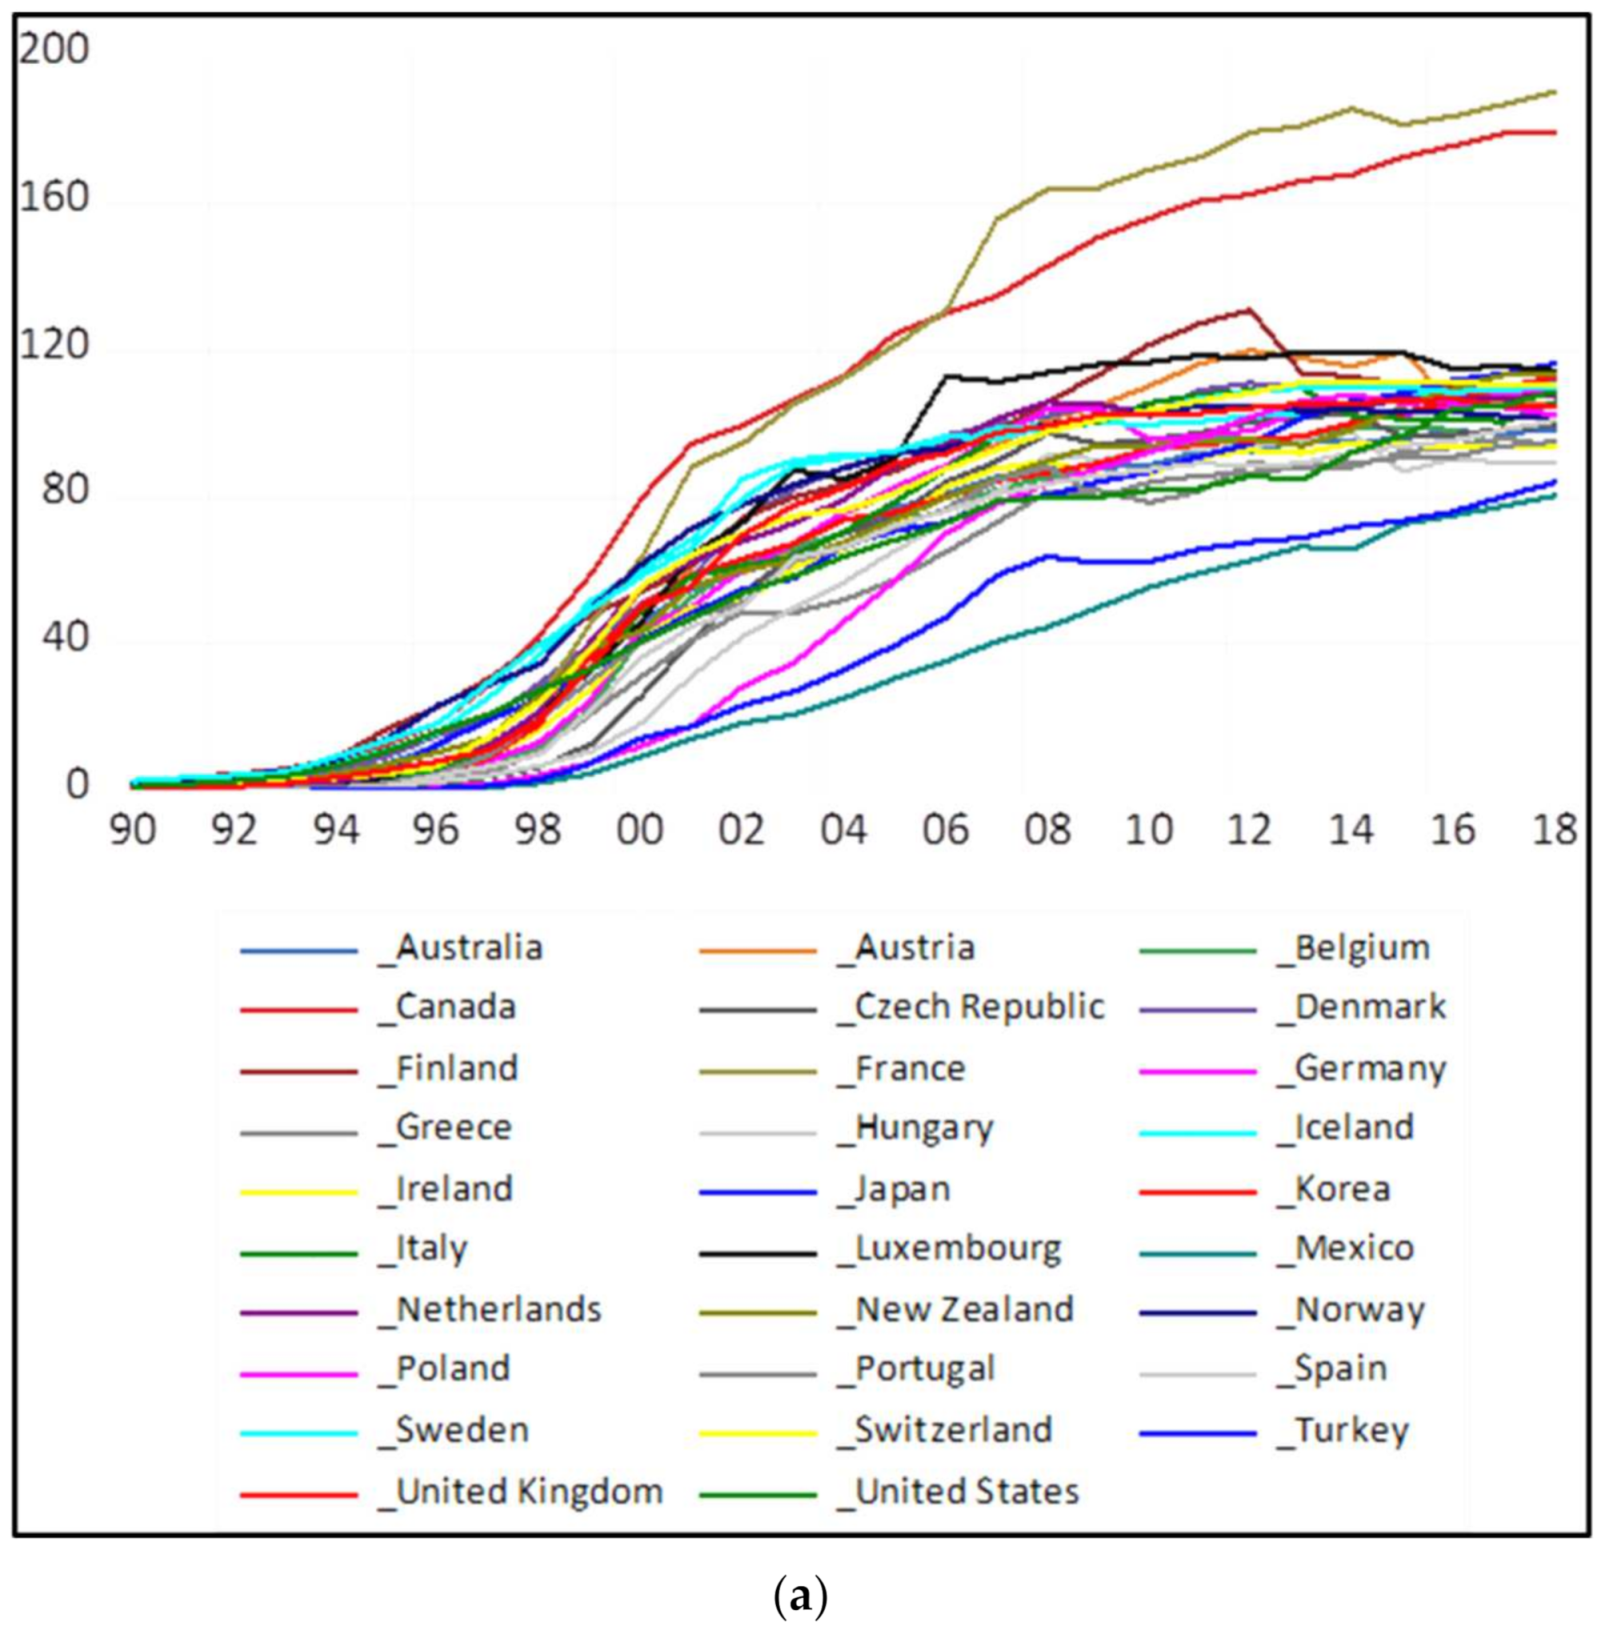
Figure 1. (a) The weighted average of individuals using the Internet per 100 people and mobile cellular subscriptions per 100 people by country. (b) Trade openness (the sum of exports and imports divided by the GDP (%)) by country.
Energies 15 02517 g001aEnergies 15 02517 g001b
Figure 2. Optimal lag length: (a) Schwarz criterion; (b) Hannan–Quinn criterion.
Energies 15 02517 g002
Table 2. Data Sources.
VariablesUnitSources
C O 2 E CO2 emissions (kt)World Bank DataBank
G D P GDP per capita (2015 constant US dollar)OECD.Stat
T R Exports and imports of goods and services (% of GDP)World Bank DataBank
I C T The weighted average of individuals using the Internet (% of population) and mobile cellular subscriptions (per 100 people)World Bank DataBank
R E W Renewable electricity (% of total electricity generation)OECD.Stat
Table 3. Correlations for the panel data.
L C O 2 E L G D P L T R L I C T L R E W
L C O 2 E 1
L G D P −0.22481
L T R −0.60560.39861
L I C T −0.02170.50890.28221
L R E W −0.38920.3400−0.00730.28511
Table 4. Panel unit root tests (level).
L C O 2 E L G D P L I C T L R W E L T R
MethodStatisticStatisticStatisticStatisticStatistic
Null: Unit root (assumes common unit root process)
Levin et al. [16] t *−3.009 ***−5.346 ***−21.864 ***1.590−3.022 ***
Null: Unit root (assumes individual unit root process)
Im et al. [17] W0.1821.578−23.650 ***3.0991.315
ADF-Fisher Chi-square71.50752.770472.404 ***41.06244.502
PP-Fisher Chi-square74.811 *75.663501.827 ***42.35856.493
Note: *** (p < 0.01); ** (p < 0.05); * (p < 0.1).
Table 5. Panel unit root tests (first difference).
Δ L C O 2 E Δ L G D P Δ L I C T Δ L R W E Δ L T R
MethodStatisticStatisticStatisticStatisticStatistic
Null: Unit root (assumes common unit root process)
Levin et al. [16] t *−22.702 ***−14.072 ***−9.433 ***−23.935 ***−22.553 ***
Null: Unit root (assumes individual unit root process)
Im et al. [17] W−22.520 ***−14.744 ***−5.881 ***−25.288 ***−20.854 ***
ADF-Fisher Chi-square490.774 ***313.557 ***152.000 ***562.762 ***454.787 ***
PP-Fisher Chi-square563.524 ***344.267 ***70.995 ***630.452 ***534.248 ***
Note: *** (p < 0.01); ** (p < 0.05); * (p < 0.1).
Table 6. Cointegration tests.
Alternative Hypothesis: Common AR Coefficients (Within-Dimension)
StatisticProbabilityWeighted
Statistic
Probability
Panel v0.80010.21180.08310.4669
Panel rho0.84670.80140.88090.8108
Panel PP−3.77750.0001−5.07380.0000
Panel ADF−5.28140.0000−6.59650.0000
Alternative Hypothesis: Individual AR Coefficients (Between-Dimension)
StatisticProbability
Group rho2.41760.9922
Group PP−7.44010.0000
Group ADF−7.39210.0000
Kao Residual Cointegration Test
StatisticProbability
ADF t−1.93080.0268
Note: Null hypothesis: No cointegration.
Table 7. Long-run PMG estimation.
VariableCoefficientStandard Errort-Statisticp-Value
L G D P 0.3658 ***0.07115.14420.0000
L T R −0.4663 ***0.0427−10.92950.0000
L I C T 0.0305 ***0.00724.26100.0000
L R E W −0.7724 ***0.0555−13.92260.0000
Jarque-Bera statistic67.24 0.0000
No. of cross sections29
Observations841
Note: *** (p < 0.01).
Table 8. Short-run PMG estimation.
VariableCoefficientStandard Errort-Statisticp-Value
COINTEQ−0.1523 ***0.0490−3.10600.0020
Δ LGDP0.5185 ***0.09685.35830.0000
Δ LTR0.0882 ***0.02233.96130.0001
Δ LICT−0.00110.0109−0.10150.9192
Δ LREW1.98292.04650.96890.3329
Constant1.73670.52933.28110.0011
Root MSE0.0279MDV0.0013
S.D. dependent variable0.0485SER0.0314
AIC−3.9138SSR0.6553
SC−2.9117Log likelihood1823.7330
HQC−3.5297
Note: *** (p < 0.01). AIC (Akaike Information Criterion), SC (Schwarz Criterion), HQC (Hannan–Quinn Criterion). MDV (Mean dependent variable), SER (S.E. of regression), SSR (Sum of squared residuals).
Publisher’s Note: MDPI stays neutral with regard to jurisdictional claims in published maps and institutional affiliations.