Article

Predicting Adsorption of Methane and Carbon Dioxide Mixture in Shale Using Simplified Local-Density Model: Implications for Enhanced Gas Recovery and Carbon Dioxide Sequestration

Department of Chemical and Petroleum Engineering, University of Calgary, Calgary, AB T2N 1N4, Canada
*
Author to whom correspondence should be addressed.
Energies 2022, 15(7), 2548; https://doi.org/10.3390/en15072548
Submission received: 3 March 2022 / Revised: 29 March 2022 / Accepted: 29 March 2022 / Published: 31 March 2022
(This article belongs to the Special Issue CO2 Enhanced Oil Recovery and Carbon Sequestration)

Abstract

:
Carbon dioxide (CO2) capture and storage have attracted global focus because CO2 emissions are responsible for global warming. Recently, injecting CO2 into shale gas reservoirs is regarded as a promising technique to enhance shale gas (i.e., methane (CH4)) production while permanently storing CO2 underground. This study aims to develop a calculation workflow, which is built on the simplified local-density (SLD) model, to predict excess and absolute adsorption isotherms of gas mixture based on single-component adsorption data. Such a calculation workflow was validated by comparing the measured adsorption of CH4, CO2, and binary CH4/CO2 mixture in shale reported previously in the literature with the predicted results using the calculation workflow. The crucial steps of the calculation workflow are applying the multicomponent SLD model to conduct regression analysis on the measured adsorption isotherm of each component in the gas mixture simultaneously and using the determined key regression parameters to predict the adsorption isotherms of gas mixtures with various feed-gas mole fractions. Through the calculation workflow, the density profiles and mole fractions of the adsorbed gases can be determined, from which the absolute adsorption of the gas mixture is estimated. In addition, the CO2/CH4 adsorption selectivity larger than one is observed, illustrating the preferential adsorption of CO2 over CH4 on shale, which implies that CO2 has enormous potential to enhance CH4 production while sequestering itself in shale. Our findings demonstrate that the proposed calculation workflow depending on the multicomponent SLD model enables us to accurately predict the adsorption of gas mixtures in nanopores based on single-component adsorption results. Following the innovative calculation flow path, we could bypass the experimental difficulties of measuring the multicomponent mole fractions in the gas phase at the equilibrium during the adsorption experiments. This study also provides insight into the CO2/CH4 competitive adsorption behavior in nanopores and gives guidance to CO2-enhanced gas recovery (CO2-EGR) and CO2 sequestration in shale formations.

1. Introduction

CO2 capture, utilization, and storage (CCUS) are effective processes to control and mitigate CO2 emissions worldwide. In recent years, capturing and storing CO2 in geological formations, e.g., depleted oil and gas reservoirs, deep saline formations, and coal seams [1,2,3], is regarded as an effective way to reduce the rapid rise in CO2 emissions from burning fossil fuels. Among the mentioned geological formations, shale gas formations are extensively distributed with abundant original gas-in-place (OGIP), contributing a considerable percentage of unconventional natural gas to the world [4]. In addition, the gas stored in shale belongs to the following three conditions: free gas in pores and natural fractures; adsorbed gas on the surface of organic and clay pore walls; and absorbed (dissolved) gas in organic matters and connate water [5,6]. More importantly, the adsorbed gas in shale may account for up to 85% of the OGIP [7,8], and the adsorption capacity of CO2 is two to five times the adsorption capacity of CH4 in shale [9,10,11]. Techniques for injecting CO2 into oil and gas reservoirs and coal while enhancing oil and gas production from such formations (i.e., CS-EGR, CO2-EOR, and CO2-ECBM) have been developed to productively utilize the emitted CO2 [12,13,14,15]. Compared with CO2 storage in saline aquifers, CO2 injection into shale and coal formations would enhance CH4 production and the revenues could compensate for the expense of CO2 capture and storage [16]. Therefore, shale gas formations are promising targets for CO2 sequestration while enhancing gas recovery (CS-EGR).
Recently, investigations of CO2 injection into organic-rich shales to enhance CH4 production have been intensively studied via molecular simulation on the microscopic scale and reservoir simulation on the engineering scale [4,16,17,18,19,20,21,22]. Grand canonical Monte Carlo (GCMC) and molecular dynamics (MD) simulation methods are widely employed to investigate competitive adsorption in shale kerogen and clay minerals. Huang et al. [17] investigated the effects of organic type and moisture on CH4/CO2 competitive adsorption in shale. The simulation results indicate that the CO2/CH4 adsorption capacity and adsorption selectivity increase in a sequence as kerogen IA < IIA < IIIA owing to the fraction of accessible pore volume (i.e., IA, 9.38%; IIA, 13.59%; IIIA, 28.88%) and the CH4/CO2 adsorption capacity reduces with the rise of moisture. Hu et al. [23] studied the competitive adsorption behaviors of CO2/CH4 mixtures in montmorillonite, illite, and kaolinite. He pointed out that the CO2 adsorption capacity in the clay minerals decreases in a sequence as montmorillonite > illite > kaolinite. CO2 molecules are willing to adsorb on the surfaces of montmorillonite and illite nanopores with cation exchange, instead of on the surface of the kaolinite nanopore without cation exchange. In addition, Sun et al. [22] developed a graphene and montmorillonite (graphene-MMT) model to simultaneously study the CH4/CO2 adsorption in organic and inorganic compounds in shale. The competitive adsorption behavior close to the MMT surface is much lower than close to the graphene surface, demonstrating an obvious asymmetric CO2/CH4 competitive adsorption in actual shale organic-inorganic nanocomposite.
Furthermore, reservoir simulation models are employed to evaluate the feasibility of CS-EGR and optimize the operation processes on the reservoir scale. Yu et al. [19] compared CO2 flooding and CO2 huff-n-puff in Barnett shale using a numerical reservoir simulation model coupled with multiple hydraulic fractures and multicomponent Langmuir isotherms. Jiang et al. [20] developed a fully coupled multi-continuum and multicomponent simulator associated with the extended Langmuir and embedded discrete fractures models to evaluate the CO2/N2 injection strategy in shale gas reservoirs. Zhang et al. [21] integrated the hybrid discrete fracture network (DFN), multiple interacting continua (MINC), and generalized Ono-Kondo (OK) lattice model to characterize the multicomponent gas flowing through the multiscale pores in shale matrix and fracture networks.
In addition, experimental measurements on competitive adsorption between CO2 and CH4 in nanoporous shale were carried out in several studies [12,24,25,26,27,28]. Currently, there are two methods to evaluate the adsorption amount and selectivity of the CO2 and CH4 gas mixture in shale. One is the static volumetric adsorption experimental setup coupled with the gas chromatograph [24,25,26], and another one is the dynamic gas displacement setup coupled with the low-field nuclear magnetic resonance (NMR) [27,28]. The preferential adsorption of CO2 over CH4 in shale is observed in experimental measurements, which demonstrates that the injection of CO2 into shale gas reservoirs would be beneficial to CH4 production and, meanwhile, the injected CO2 could be permanently stored in the shale matrix.
In previous studies, adsorption models for pure gas (single component) adsorption were intensively studied [29,30,31,32,33,34,35]. Meanwhile several adsorption models for a gas mixture were also proposed to characterize the CH4/CO2 competitive adsorption isotherms. The extended Langmuir model [36,37], ideal adsorbed solution theory [37,38], extended multicomponent Brunauer–Emmett–Teller (BET) model [39], multicomponent SLD model [40], and multicomponent OK lattice model [41] were widely used to describe the adsorption behaviors of gas mixtures in porous media. In general, such developed models are used to evaluate the measured competitive adsorption isotherms, and majority of the models require the component mole fraction in the gas phase at the equilibrium and the density of adsorbed gas mixture [42]. The multicomponent mole fractions in the gas phase at the equilibrium are determined using the gas chromatograph, which is the most complicated part for the experimental measurements of competitive adsorption. Fortunately, the multicomponent SLD model may enable us to predict the competitive adsorption behavior in shale without knowing the component mole fraction in the gas phase at the equilibrium.
The SLD model, which was first introduced by Rangarajan et al. [32], has been utilized to characterize pure-gas adsorption in porous media [43,44]. It assumes that all the pores associated with the porous media exist in the form of a rectangular slit with a constant slit width. In addition, the slit pore wall consists of the spherical carbon molecules, and the spherical gas molecules within the slit pore will interact with slit walls. For the SLD model, the fluid-fluid interactions between gas molecules will be described by the Peng–Robinson equation of state (PR-EOS) [45], while the fluid-solid interactions will be depicted on the basis of the 10-4 Lennard-Jones potential [46]. The advantages of the SLD model include: (1) it simulates both the fluid-fluid and fluid-solid interactions in the slit pore; and (2) it is able to predict the excess and absolute adsorption isotherms and gas density profile in the slit pore through rapid computation.
Although molecular simulation can precisely depict the multicomponent gas adsorption on the microscopic scale and experimental measurements can determine the multicomponent gas adsorption on core samples, the high computation costs of molecular simulation and the complex procedures and various devices of experiments are obstacles to achieving a fast prediction and evaluation for the competitive adsorption in porous media. Thus, the purpose of this study is to propose an iterative calculation workflow based on the multicomponent SLD model to determine the excess and absolute adsorption of a gas mixture on shale relying on the measured single-component adsorption data, which could considerably decrease the costs of computation and measurements.

2. SLD Model

2.1. SLD Model for Single Component Gas

For the SLD model, the equilibrium chemical potential is equivalent to the bulk fluid potential, which is composed of the fluid-fluid and fluid-solid interaction potentials [32].
μ ( z ) = μ f f ( z ) + μ f s ( z ) = μ b u l k
where µ(z) is the chemical potential at the position z, µbulk is the chemical potential of bulk fluid, and the “bulk”, “ff”, and “fs” as subscripts indicate the bulk fluid, fluid-fluid, and fluid-solid interactions, respectively. The chemical potential of the bulk fluid is a function of fugacity expressed as [32]:
μ b u l k = μ 0 ( T ) + R T ln ( f b u l k f 0 )
where the subscript “0” denotes an arbitrary reference state and fbulk refers to the fugacity of the bulk fluid. In a similar way, the chemical potential of a fluid-fluid interaction is a function of fugacity written as [32]:
μ f f ( z ) = μ 0 ( T ) + R T ln ( f f f ( z ) f 0 )
where fff(z) is the fugacity of the fluid-fluid interaction at the position z.
In addition, the chemical potential of a fluid-solid interaction is calculated by [47]:
μ f s ( z ) = N A [ Ψ f s ( z ) + Ψ f s ( L z ) ]
where NA is Avogadro’s number, and ψfs(z) and ψfs(Lz) are potential energy functions demonstrating a fluid molecule at position z interacting with slit walls at the distance of z and Lz, respectively. The fluid-solid interaction is determined based on the Lee’s partially integrated 10 − 4 Lennard-Jones potential [46]:
Ψ f s ( z ) = 4 π ρ a t o m s ε f s σ f s 2 [ σ f s 10 5 ( z ) 10 1 2 i = 1 4 σ f s 4 ( z + ( i 1 ) σ s s ) 4 ]
where ρatoms is the density of solid atoms, which is equal to 38.2 atoms/nm2, εfs is the fluid-solid interaction energy parameter, and σfs is the mean value of σff and σss, calculated by σfs = (σff + σss)/2. The σff and σss are the adsorbate diameter and the carbon interplanar distance, respectively. The value of the carbon interplanar distance is set as the value for graphite (i.e., σss = 0.335 nm). z′ is the dummy coordinate defined as z′ = z + σss/2. Substituting Equations (2)–(4) into Equation (1), the adsorption equilibrium is written as:
f f f ( z ) = f b u l k · exp ( Ψ f s ( z ) + Ψ f s ( L z ) k T )
where k is Boltzmann’s constant (i.e., k = 1.38 × 10⁻²³ J/K). The fluid-fluid interaction is characterized by PR-EOS. Herein, the PR-EOS is rewritten as a function of gas density (ρ) as follows [45]:
p ρ R T = 1 ( 1 ρ b ) a ( T ) ρ R T [ 1 + ( 1 2 ) ρ b ] [ 1 + ( 1 + 2 ) ρ b ]
in which:
a ( T ) = 0.457535 α ( T ) R 2 T c 2 p c
b = 0.077796 R T c p c
The term α(T) In Equation (8) is given as [48]:
α ( T ) = exp [ ( A + B T r ) ( 1 T r C + D ω + E ω 2 ]
where Tr = T/Tc, ω is the gas acentric factor, Pc is the critical pressure, Tc is the critical temperature, and parameters A, B, C, D, and E are assigned as 2.0, 0.8145, 0.134, 0.508 and −0.0467, respectively. Furthermore, the fugacity of the bulk fluid can be determined based on Equation (7) as:
ln f b u l k p = b ρ 1 b ρ a ( T ) ρ R T ( 1 + 2 b ρ b 2 ρ 2 ) ln ( p R T ρ p b R T ) a ( T ) 2 2 b R T ln ( 1 + ( 1 + 2 ) ρ b 1 + ( 1 2 ) ρ b )
Similarly, the fugacity of the adsorbate is calculated by:
ln f f f ( z ) p = b a d s ρ ( z ) 1 b a d s ρ ( z ) a a d s ( z ) ρ ( z ) R T ( 1 + 2 b a d s ρ ( z ) b a d s 2 ρ 2 ( z ) ) ln ( p R T ρ ( z ) p b a d s R T ) a a d s ( z ) 2 2 b a d s R T ln ( 1 + ( 1 + 2 ) ρ ( z ) b a d s 1 + ( 1 2 ) ρ ( z ) b a d s )
b a d s = b ( 1 + A b )
where the functions for aads(z) are derived by Chen et al. [47], the ρ(z) in Equation (12) is the gas density profile, and Ab in Equation (13) is the covolume correction factor. Finally, the excess adsorption isotherm is written as:
n E x c e s s = A 2 3 σ f f 8 L 3 σ f f 8 ( ρ ( z ) ρ b u l k ) d z
where parameter A denotes the specific surface area (in m2/g) and n E x c e s s denotes the excess adsorption amount (in mmol/g). Equation (14) can be integrated numerically with the Simpson’s rule. In general, four regression parameters including the specific surface area, A (in m2/g), fluid-solid interaction energy, εfs/k (in Kelvin), slit width, L (in nm), and covolume correction factor, Ab, will be determined during the regression process of fitting the single component gas adsorption by use of the SLD model. We noticed that εfs/k is the fluid-solid interaction energy divided by the Boltzmann’s constant (k).

2.2. SLD Model for Multicomponent Gas

For multicomponent gas, the functions for fluid-fluid and fluid-solid interactions and adsorption equilibrium mentioned previously will be applied to each component in the gas mixture. Thus, the function of fluid-solid interaction for component i in the gas mixture is given as:
Ψ i f s ( z ) = 4 π ρ a t o m s ε f s , i σ f s , i 2 [ σ f s , i 10 5 ( z ) 10 1 2 i = 1 4 σ f s , i 4 ( z + ( i 1 ) σ s s ) 4 ]
Then, the adsorption equilibrium function for each component i is written as:
f i f f ( z ) = f i b u l k · exp ( Ψ i f s ( z ) + Ψ i f s ( L z ) k T )
Similarly, the fugacity of component i in bulk phase can calculated by:
ln f i b u l k y i p = b i b ( p R T ρ 1 ) ln ( p R T ρ p b R T ) a 2 2 b R T ( b i b 2 j y j a i j a ) ln ( 1 + ( 1 + 2 ) ρ b 1 + ( 1 2 ) ρ b )
a = i j y i y j ( a b u l k ) i j
b = i y i b i
i y i = 1
where yi indicates the mole fraction of component i in bulk phase at the equilibrium, (abulk)ij in Equation (18) is calculated by Equation (8), and bi in Equation (19) is calculated by Equation (9). Moreover, the fugacity of component i in adsorbed phase can calculated by:
ln f i a d s ( z ) x i p = 2 j x j ( z ) b i j b b ( p R T ρ ( z ) 1 ) ln ( p R T ρ ( z ) p b R T ) + a ( z ) 2 2 b R T ( 2 j x j ( z ) b i j b b 2 j x j ( z ) a i j ( z ) a ( z ) ) ln ( 1 + ( 1 + 2 ) ρ ( z ) b 1 + ( 1 2 ) ρ ( z ) b )
a ( z ) = i j x i ( z ) x j ( z ) ( a a d s ) i j
b = i j x i ( z ) x j ( z ) ( b a d s ) i j
( a a d s ) i j = ( a a d s ) i ( a a d s ) j ( 1 C i j )
( b a d s ) i j = b i ( 1 + A b , i ) + b j ( 1 + A b , j ) 2
i x i ( z ) = 1
where xi indicates the mole fraction of component i in adsorbed phase at the equilibrium and Cij is the binary interaction parameters (BIPs) between gas components. The (aads)ij in Equation (22) is calculated using the functions derived by Chen et al. [47] and the (bads)ij in Equation (23) is calculated based on Equation (13). Finally, the excess adsorption isotherm for gas mixture can be written as [40]:
n i E x c e s s = A 2 3 σ f f , i 8 L 3 σ f f , i 8 ( ρ ( z ) x i ( z ) ρ b u l k y i ) d z
For pure gas, the xi and yi are equal to 1. Moreover, the absolute adsorption isotherm for gas mixture can be calculated by:
n i A b s = A 3 σ f f , i 8 z c u t o f f ( ρ ( z ) x i ( z ) ) d z
where n i A b s is the absolute adsorption amount for component i in the gas mixture (in mmol/g) and zcutoff is the cutoff point. Beyond such point, the density of component i in the adsorbed phase is nearly identical to the density of component i in the bulk phase. In this study, the zcutoff is determined when the difference between the densities of adsorbed and free gases is less than 5%.

3. Calculation Workflow for Adsorption of Multicomponent Gas

In this study, we developed an iterative calculation workflow to determine the competitive adsorption of the CH4/CO2 binary mixture in shale based on the pure CH4 and CO2 adsorption results. Such a calculation workflow is able to forecast the adsorption isotherms of multicomponent gas without demanding the experimental measurements for the adsorption of gas mixture on porous media, which significantly reduces the complexity, time, and cost of experiments.
The main idea of the developed calculation workflow is to utilize the SLD model for a gas mixture to evaluate the measured adsorption isotherm of each component in the gas mixture (i.e., pure gas) simultaneously, and then use the determined εfs,i and Ab,i for each gas component coupled with the L and A corresponding to the slit pore structure to predict the adsorption isotherms of gas mixture with various feed-gas mole fractions. The calculation workflow for predicting the adsorption of the CH4/CO2 binary mixture is presented in Figure 1 in detail.
As shown in Figure 1, the excess adsorption isotherms of each gas component (pure gas) in a gas mixture are the only required experimental measurements. The first key step is to simultaneously perform curve fitting on the measured excess adsorption of each gas component in the gas mixture using a multicomponent SLD model (Equations (15)–(27)) by setting the mole fraction of component i in the gas phase at the equilibrium very close to one (e.g., yi = 0.999). The second key step is to set the binary interaction parameters equal to zero (Cij = 0) and find the suitable yi via iteration. The iteration is controlled by the component mass balance equation given as:
z i = n i E x c e s s + ρ b u l k V s l i t y i n t E x c e s s + ρ b u l k V s l i t
where zi is the feed-gas mole fraction, Vslit is the specific volume of slit, and n t E x c e s s is the sum of excess adsorption of each component in gas mixture. It is noted that the Vslit can be obtained through fitting the pure gas adsorption by an SLD model for single component gas (i.e., Equations (4)–(14)). Herein, the Vslit used in the calculation is 169.2 × 10 9 m3/g. If the yi calculated by Equation (29) does not match the assumed yi to initiate the calculation, a new set of yi will be assumed to start another trial. Such an iterative process will end when the difference between the calculated yi and assumed yi is less than 0.002 in this study. The physical properties of CH4 and CO2 used in the SLD model are shown in Table 1.

4. Results and Discussion

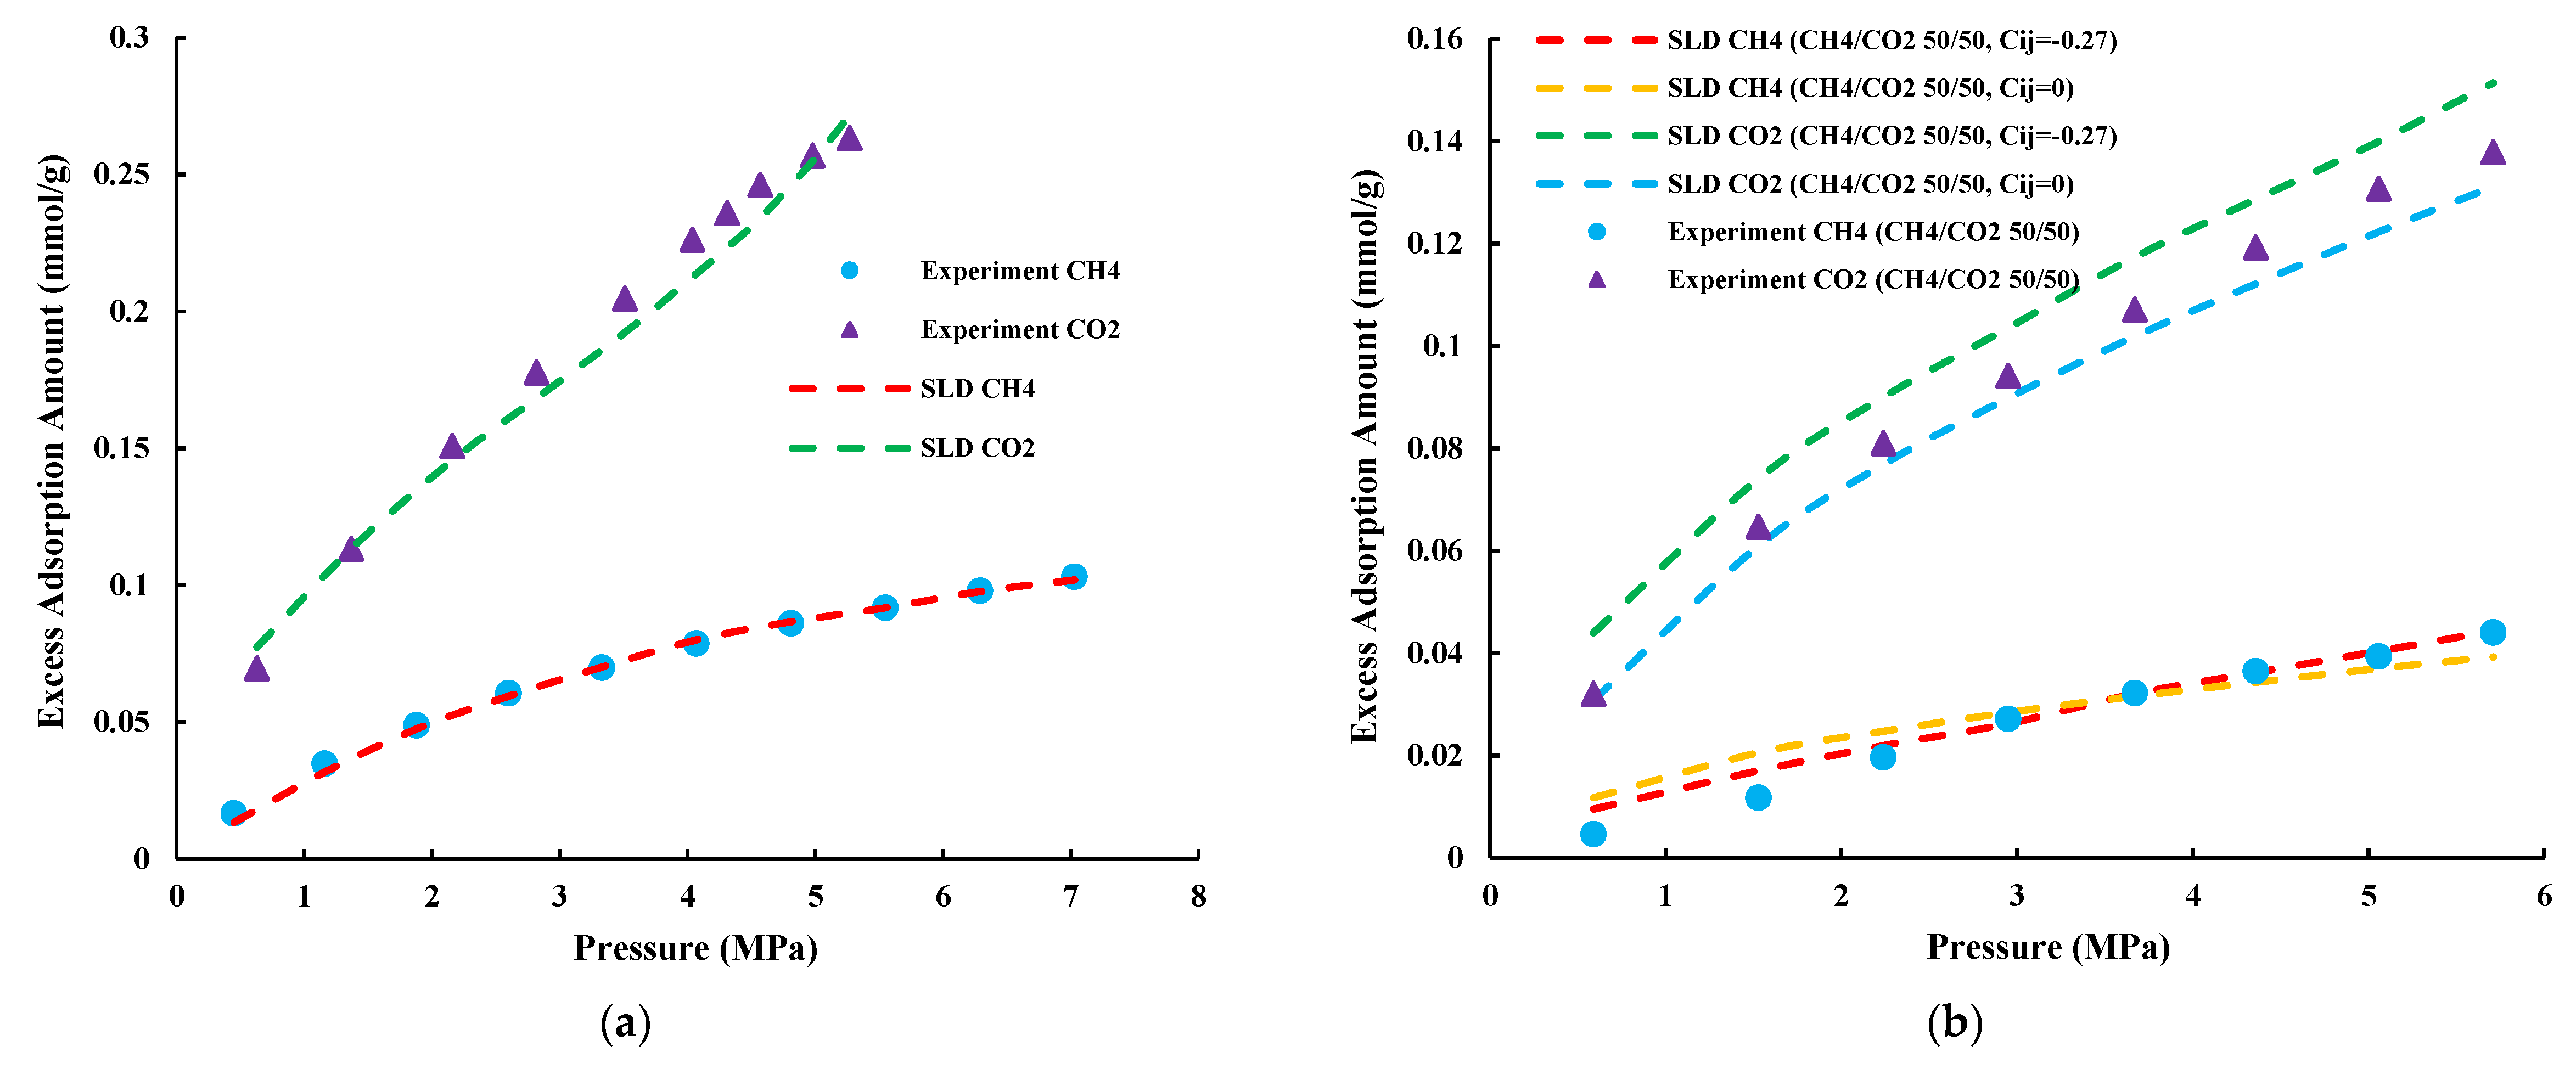
4.1. Validation of Developed Calculation Workflow

In this study, the results of experimentally measured pure CH4 and CO2 adsorption and CH4/CO2 competitive adsorption in Yanchang shale from the Ordos Basin in China reported by Qin et al. [49] are employed as the references to validate the developed calculation workflow. The adsorption isotherms of CH4, CO2, and an equimolar CH4/CO2 mixture (i.e., the mole fractions of the feed CH4 and CO2 are identical, expressed as CH4/CO2 50/50 in the following figures) measured at 313.15 K from Qin et al. [49] are displayed in Figure 2. Herein, we examine the practicability and reliability of the developed calculation workflow by comparing two cases. For case one, we use all the data determined via the experimental measurements to perform regression analysis on the measured competitive adsorption of the CH4/CO2 binary mixture in shale by the SLD model for multicomponent gas. For case two, we employ the SLD model for multicomponent gas to match such measured CH4/CO2 competitive adsorption isotherms following the calculation workflow merely based on the measured pure CH4 and CO2 adsorption isotherms. The main differences between the two cases are the demands of the component mole fraction in the gas phase at the equilibrium (yi) and the binary interaction parameters (Cij). The yi is usually determined using a gas chromatograph during experimental measurements, which is the most complex part in the adsorption experiments with multicomponent gas. In addition, the Cij is the curve-fitting parameter obtained during the regression process. It is noted that yi and Cij are the primary obstacles to estimating the adsorption isotherms of a gas mixture depending on the corresponding single-component adsorption results.
For both cases, the first step is to simultaneously fit the adsorption isotherms of pure CH4 and pure CO2 with the SLD model for multicomponent gas, from which the εfs,i and Ab,i for both CH4 and CO2 coupled with the L and A can be determined. The curve-fitting results are demonstrated in Figure 2a, and the regression parameters and average absolute percentage deviation (%AAD) are listed in Table 2. Herein, the %AAD used to reveal the curve-fitting quality is calculated by:
% A A D = 1 N i = 1 N | n E X P n S L D n E X P | × 100
where N is the amount of the total data point, nEXP is the adsorption amount determined via the experiments, and nSLD is the adsorption amount calculated by the SLD model. From Figure 2a, it can be seen that the SLD model for multicomponent gas can properly depict the measured pure CH4 and CO2 adsorption isotherms. Next, the yi measured by the gas chromatograph at each testing pressure and the regression parameters shown in Table 2 are set as inputs for the SLD model to match the measured CH4/CO2 competitive adsorption in shale. The Cij is the only curve-fitting parameter during the regression process. The values of yi are from Qin et al. [49] and the results of regression analysis are presented in Figure 2b. The optimal curve-fitting results associated with Cij = −0.27 correspond to the %AAD = 21.06 for CH4 (red dashed line) and %AAD = 13.33 for CO2 (green dashed line). It was found that the CO2 adsorption amount obtained with the SLD model (green dashed line) is a little bit larger than the experimental data (purple triangles), but the trend of the CO2 adsorption isotherm is nearly identical to that of the measured data points. Similarly, the adsorption amount of CH4 calculated by the SLD model (red dashed line) is larger than the experimental data (blue circles) at p < 3 MPa, but the calculated adsorption amount matches well with the experimental data when p > 3 MPa. The main reasons resulting in the imperfect match may be attributed to (1) the inaccuracy of measured yi, (2) the deviations that existed between the measured adsorption of pure gas and such adsorption calculated by the SLD model (Figure 2a), (3) the inaccuracy of determined xi, and (4) the convergence of regression analysis. Although the deviations reveal that the SLD model for multicomponent gas cannot perfectly describe the CH4/CO2 competitive adsorption results on shale, the %AADs for the CH4/CO2 binary mixtures share a similar degree of accuracy with the %AADs for pure gases reported in the literature. Mohammad et al. summarized that the %AADs for evaluating the CO2 adsorption in coals using the SLD model are in the range of 10 to 12 [43]. Additionally, Chareonsuppanimit et al. pointed out the prediction of adsorption in shales associated with the %AADs for CH4 lying between 2 and 12 and the %AADs for CO2 lying between 4 and 14 by use of the SLD model [44].
Furthermore, for case two, the Cij is set as 0 and yi is determined through the iterative calculation workflow (Figure 1). The curve-fitting results obtained via the developed calculation workflow are illustrated in Figure 2b as well. The %AADs for CH4 (orange dashed line) and CO2 (blue dashed line) are 35.27 and 5.23, respectively. As shown in Figure 2b, the CO2 adsorption isotherm calculated by the SLD model following the calculation workflow (blue dashed line) approximately fits in with the experimental data (purple triangles). In contrast, the CH4 adsorption amount calculated by the SLD model following the calculation workflow (orange dashed line) partially deviates from the experimental data, especially at p < 3 MPa. Compared with case one, case two provides a better prediction for CO2 adsorption but a worse prediction for CH4 adsorption. Overall, the calculation methods in both cases, to some extent, are able to forecast the gas mixture adsorption isotherms. Following the proposed calculation workflow, the SLD model for multicomponent gas might be used to predict competitive adsorption of a binary gas mixture in shale based merely on the single-component adsorption. After determining the εfs,i and Ab,i for each gas component in a gas mixture coupled with the L and A for a slit-pore structure, the adsorption isotherms of a gas mixture for any feed-gas mole fractions can be calculated, which in turn greatly reduces the complexity, time, and cost of experimental measurements.

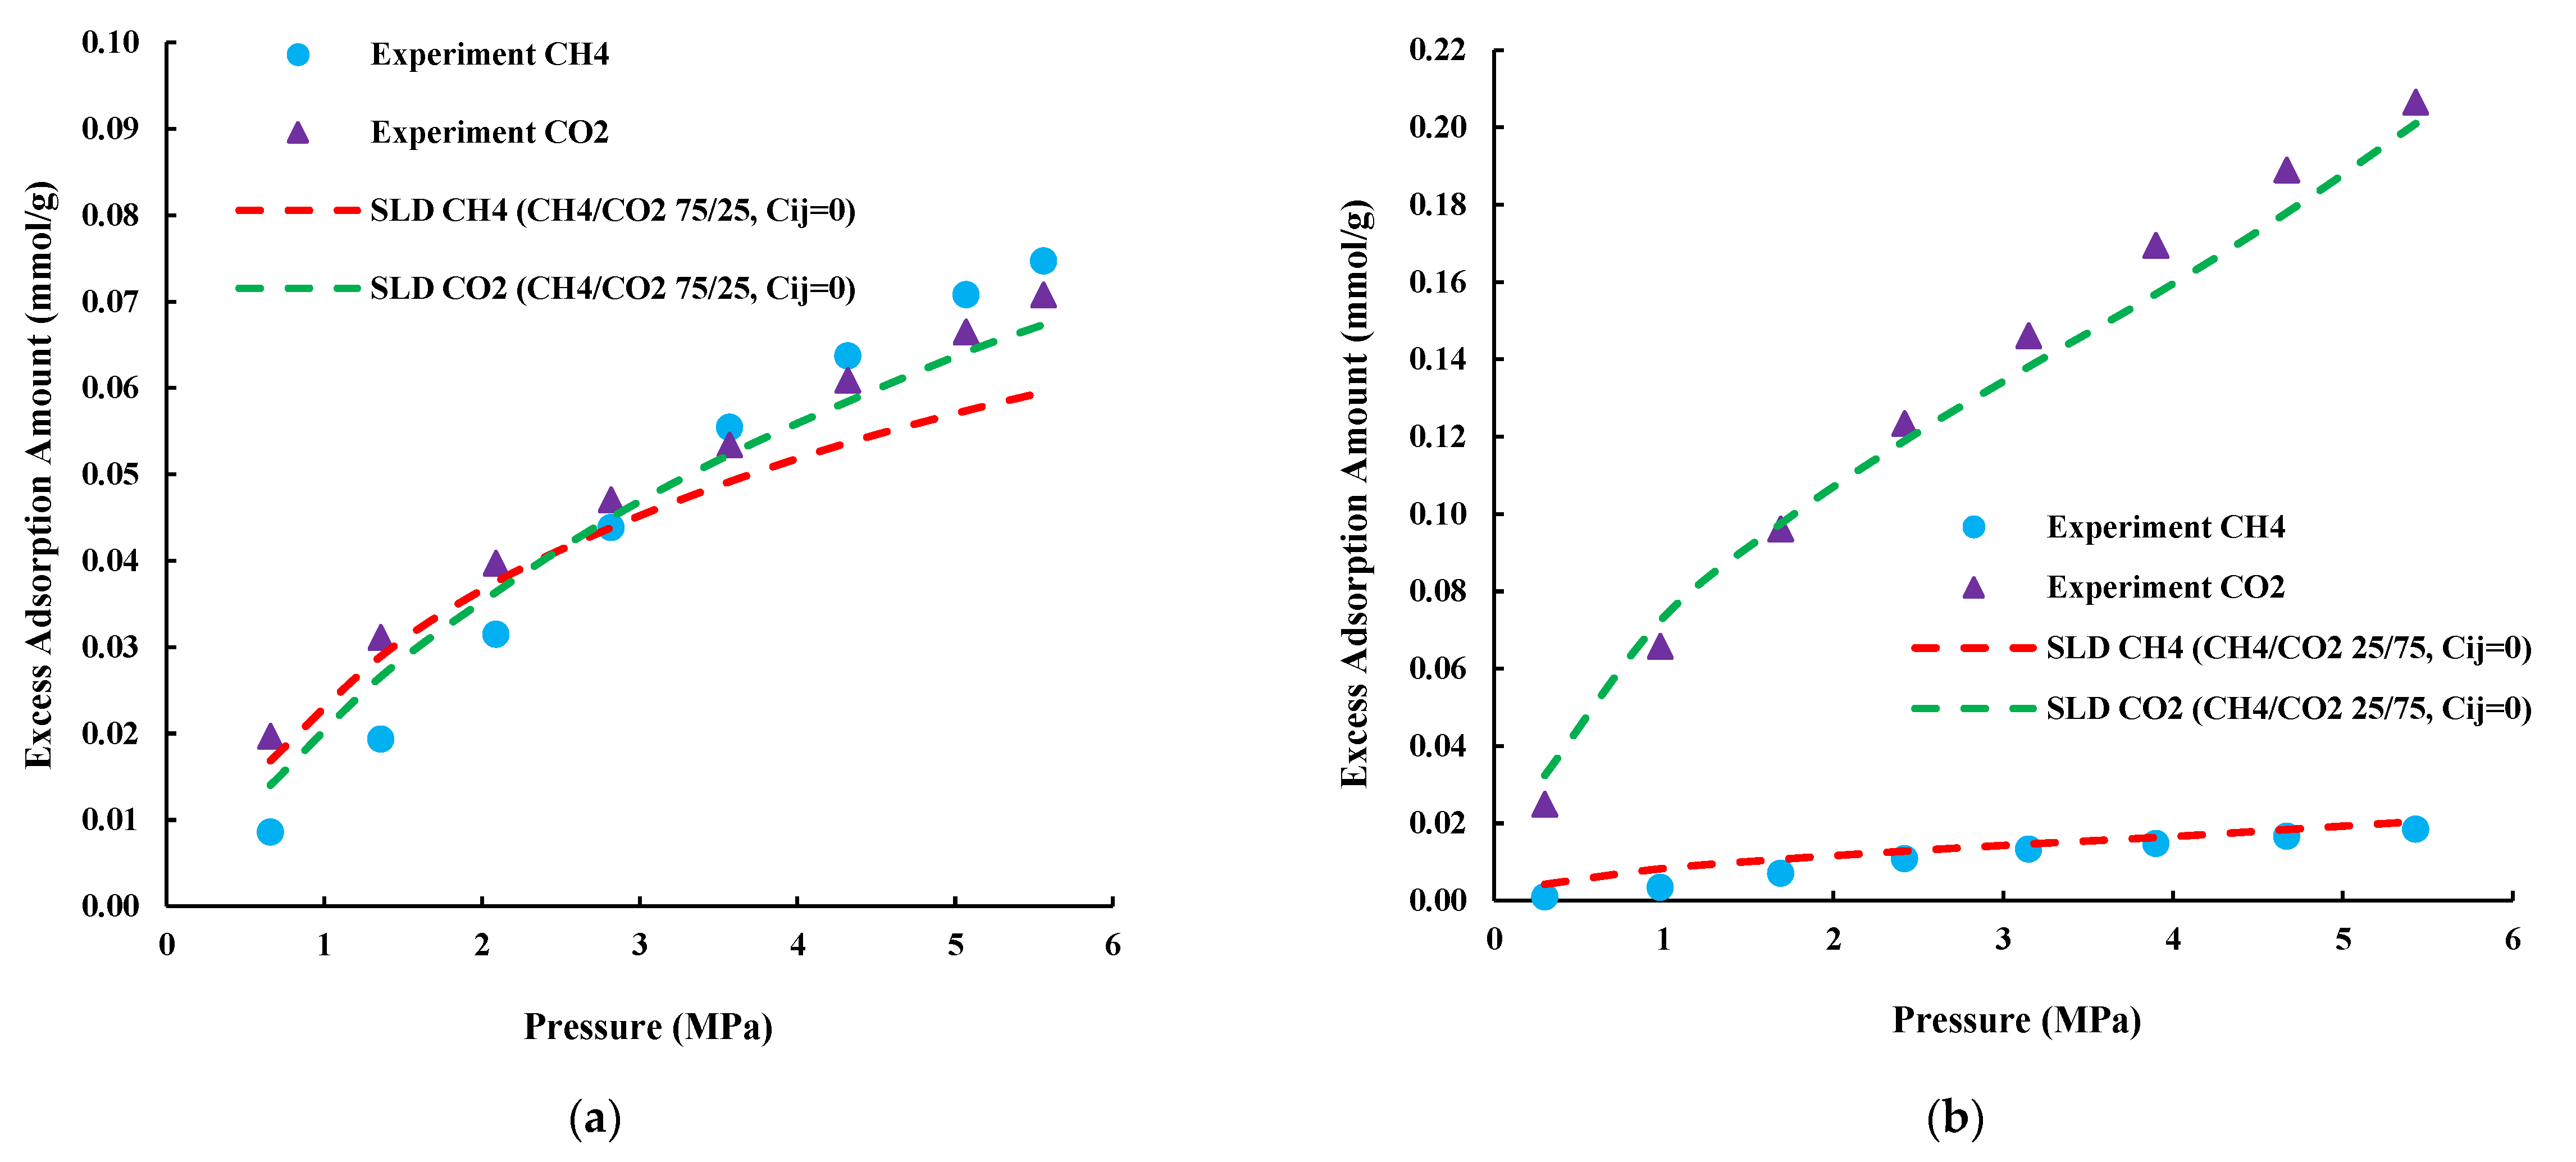
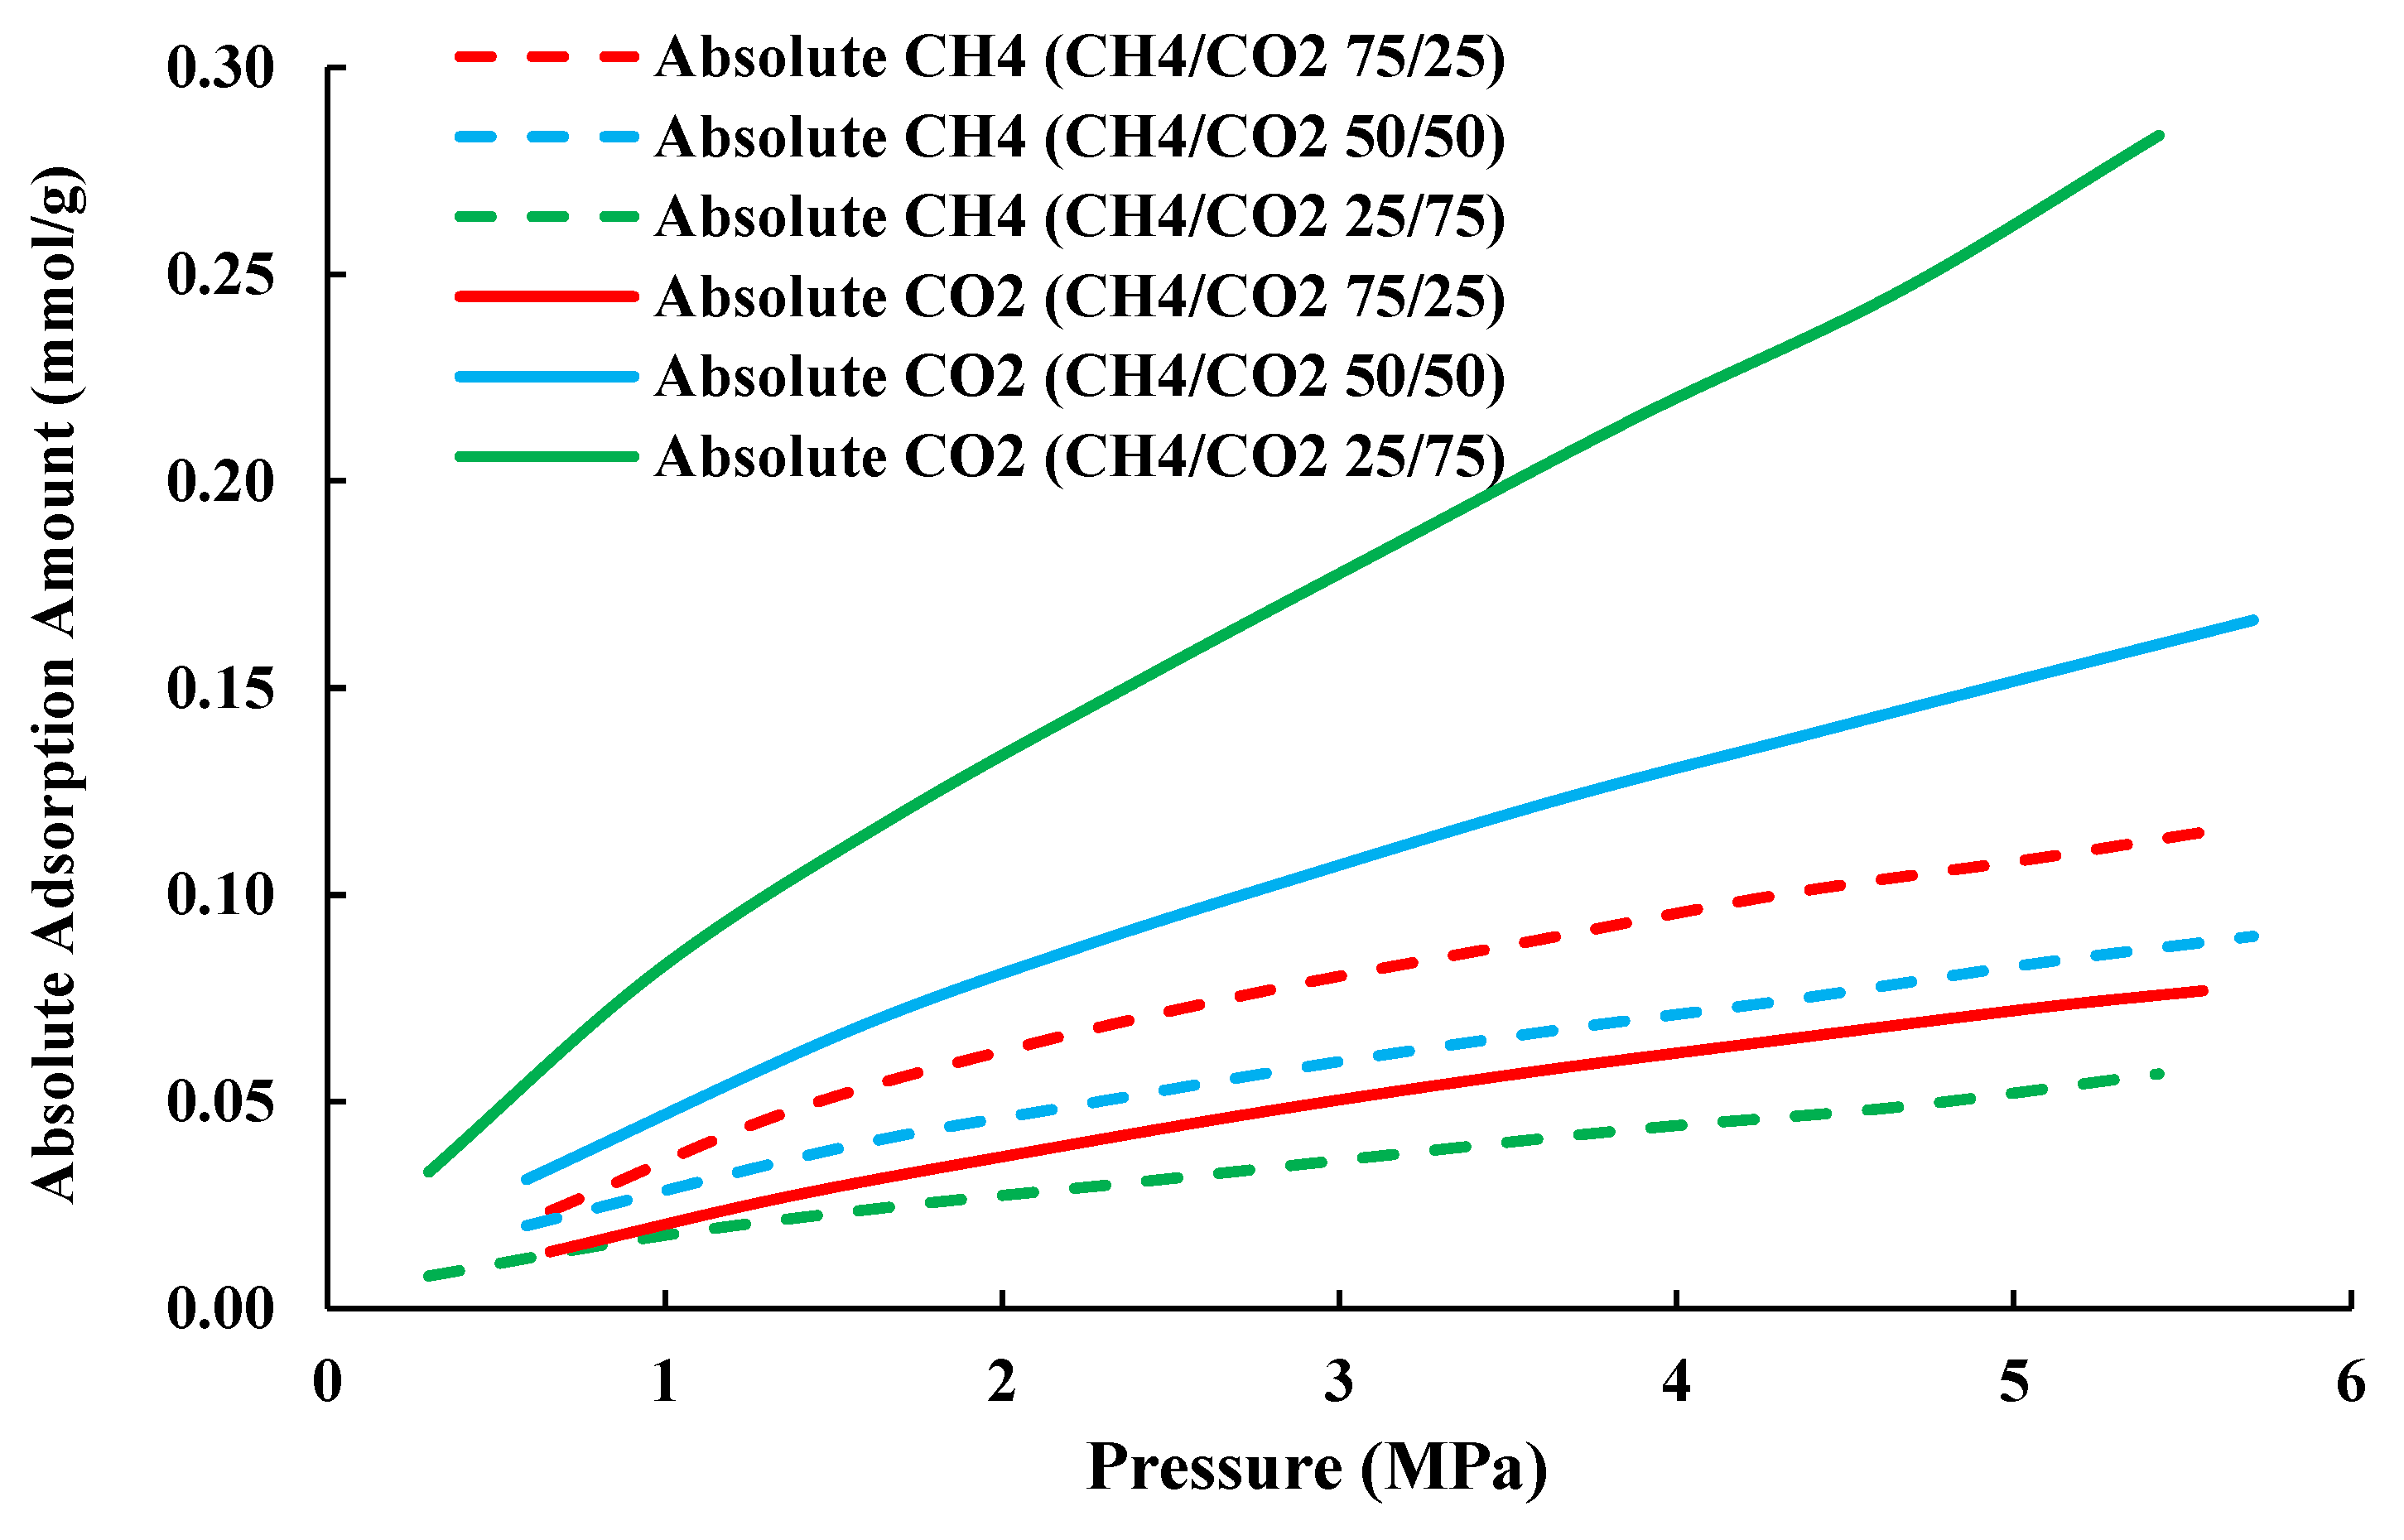
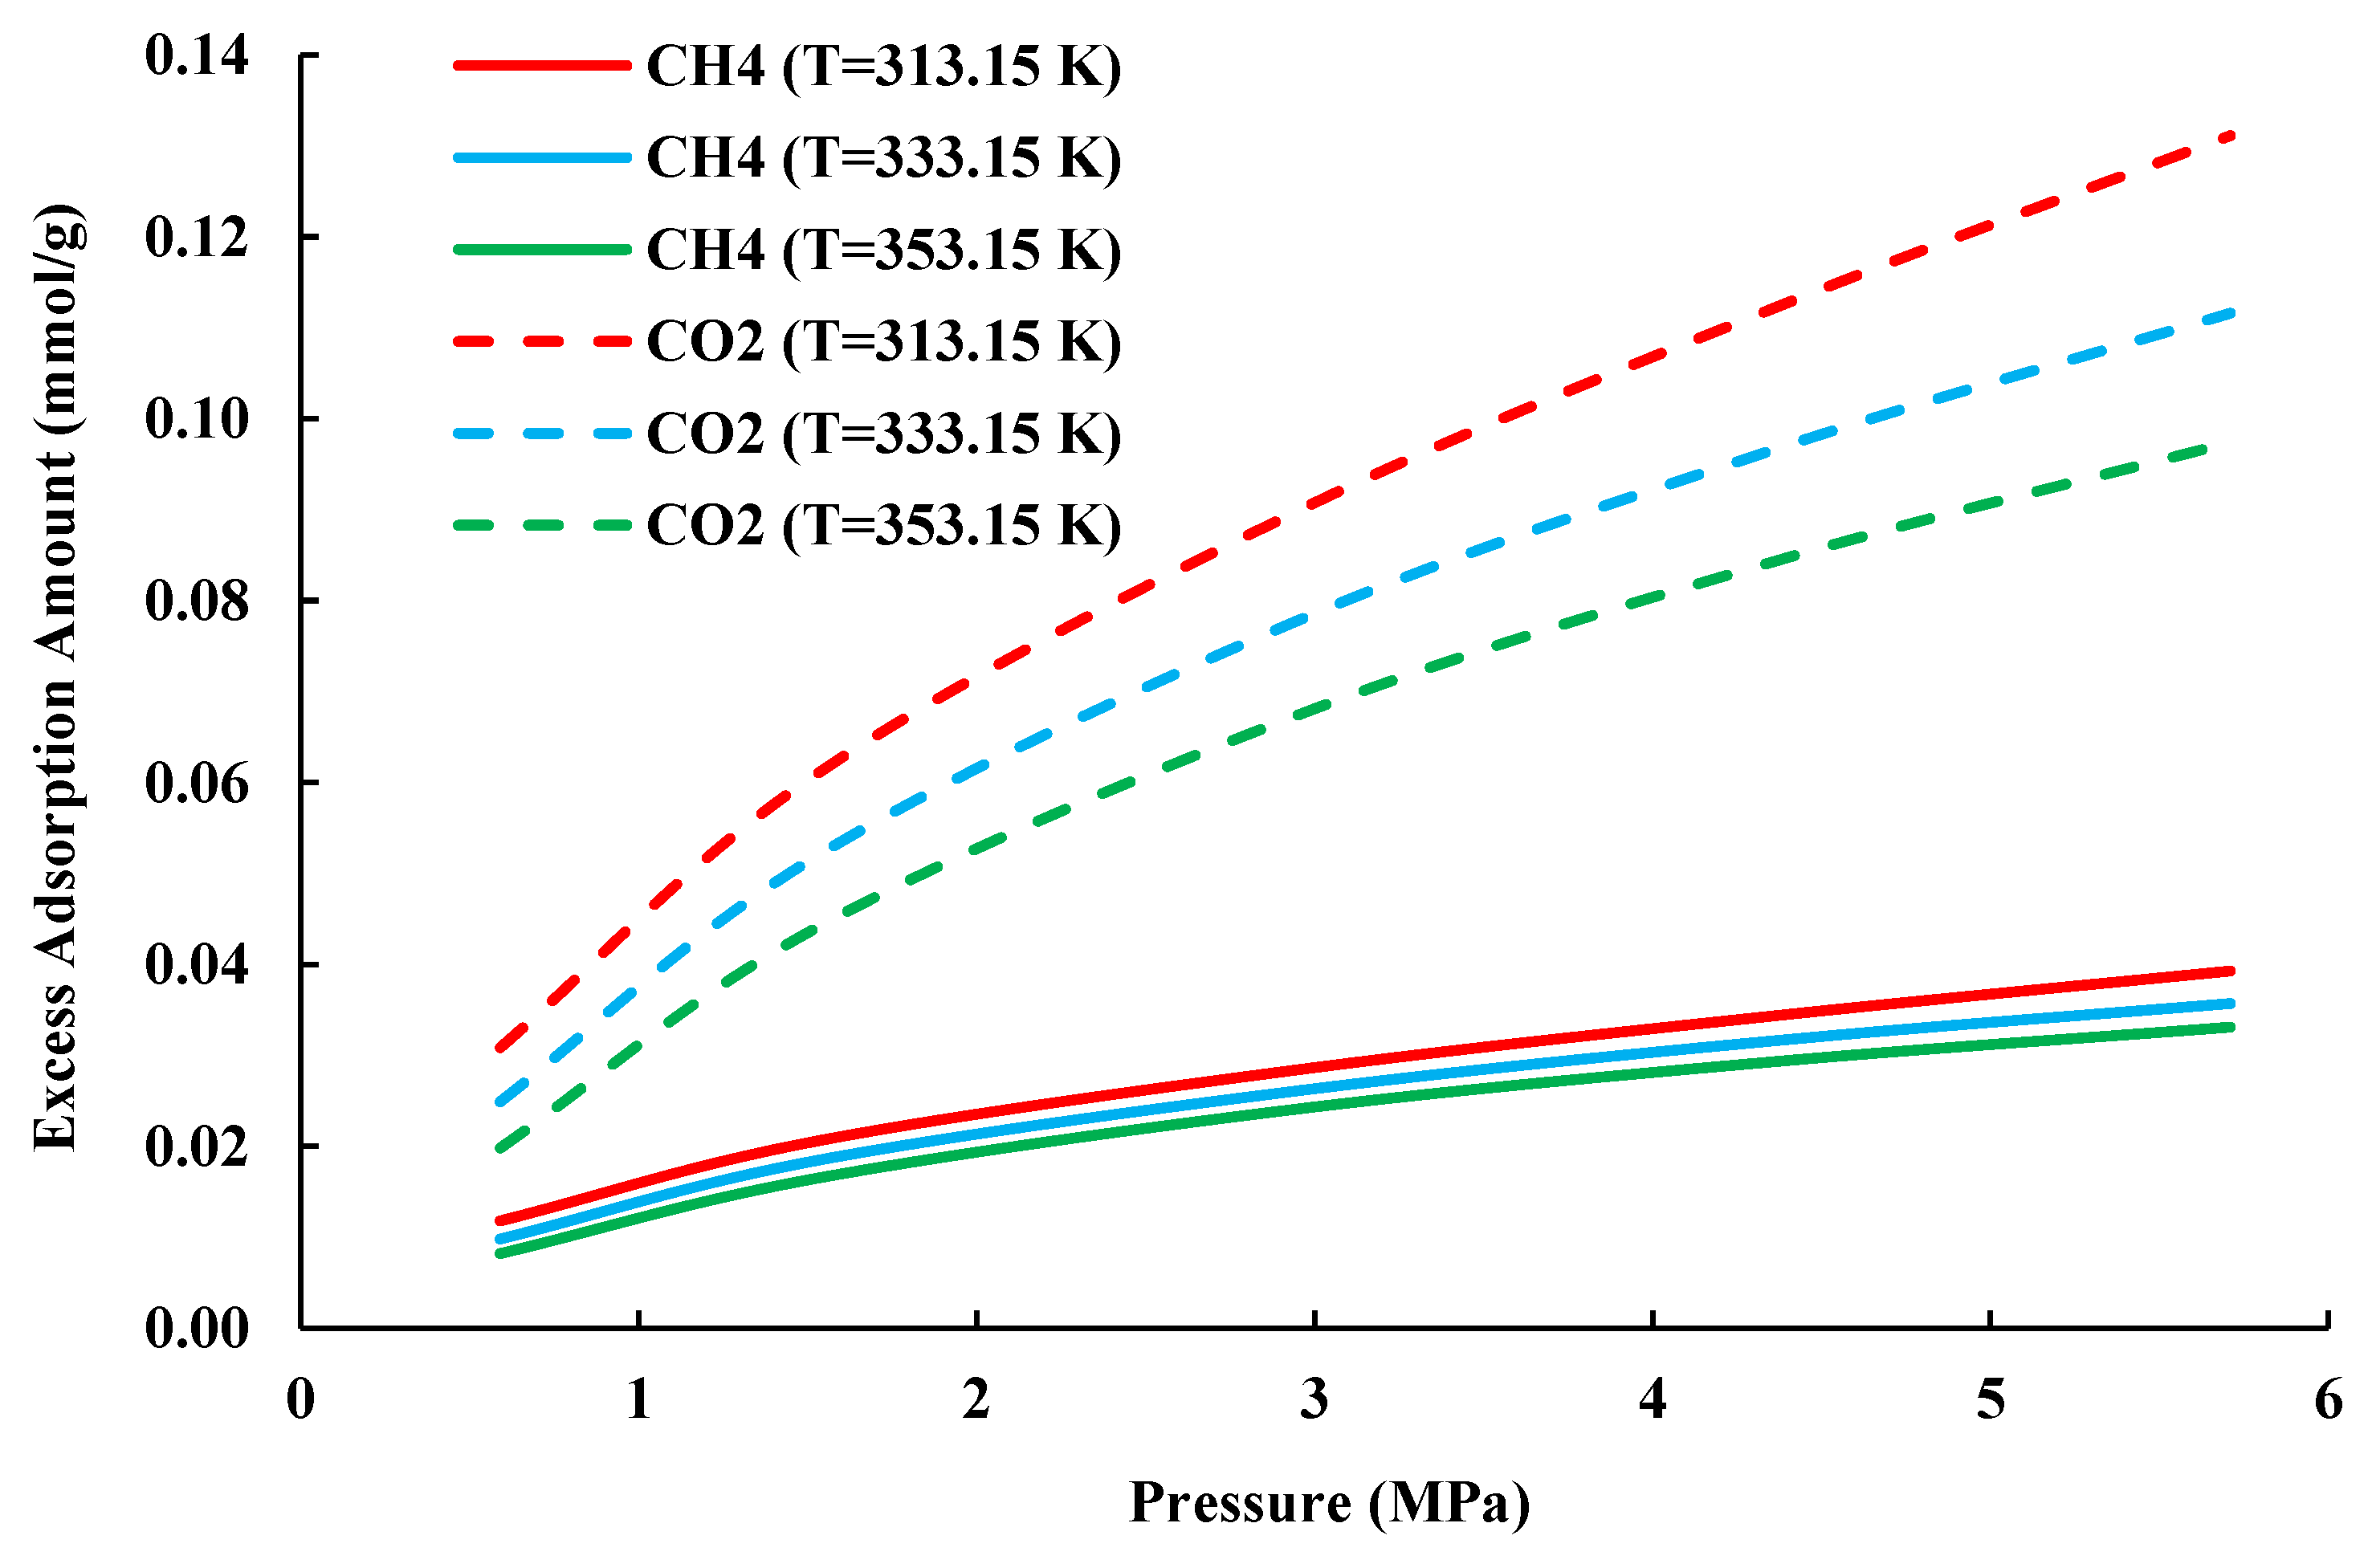
4.2. Prediction of CH4/CO2 Competitive Adsorption

The absolute and excess adsorption isotherms of CH4/CO2 mixtures with different feed-gas mole fractions can be predicted following the developed calculation workflow once the regression parameters of the SLD model are obtained. It is noted that the following Figure 3, Figure 4, Figure 5 and Figure 6 are generated using the SLD model with the four regression parameters listed in Table 2. Figure 3 shows the excess adsorption isotherms of 75/25 and 25/75 CH4/CO2 gas mixtures in shale at 313.15 K. The corresponding adsorption isotherms measured by Qin et al. [49] are set as comparisons. In spite of the deviations for CH4 adsorption isotherms similar to those shown in Figure 2b, acceptable agreement for the CO2 adsorption isotherms between the multicomponent SLD model (calculation workflow) and the experimental results is reached, which further proves the practicability of the calculation workflow to some extent. Moreover, Figure 4 presents the absolute adsorption isotherms of CH4 and CO2 in 75/25, 50/50, and 25/75 CH4/CO2 gas mixtures in shale core samples at 313.15 K. The absolute adsorption isotherms shown in Figure 4 are calculated by Equation (28) with the regression parameters from Table 2. It is found that the CH4 adsorption amount increases with the feed-gas mole fraction (CH4/CO2), while the CO2 adsorption amount decreases with the feed-gas mole fraction. The CO2 adsorption amounts are considerably larger than the CH4 adsorption amounts for the 75/25 and 50/50 feed-gas mole fractions. However, the CO2 adsorption amount is lower than the CH4 adsorption amount for the 25/75 feed-gas mole fraction. As a result, there will be a threshold of a feed-gas mole fraction, above which the CO2 adsorption amount would be larger than the CH4 adsorption amount. Finding such a threshold can provide guidance for CO2-EGR and CO2 sequestration operations in shale gas reservoirs.
In addition, after determining the regression parameters (Table 2), we can predict the excess adsorption isotherms of CH4/CO2 mixtures at different temperatures following the developed calculation workflow. Figure 5 exhibits the excess adsorption isotherms of each component in a CH4/CO2 (50/50) gas mixture in shale at temperatures of 313.15, 333.15, and 353.15 K, respectively. It is found that the excess adsorption amounts for both the CH4 and CO2 decrease with the increase in temperature, which are consistent with the observations in previous studies [50,51,52]. Moreover, we can conclude from Figure 5 that CO2 sequestration during the CO2-EGR process would benefit from the lower temperature, since the effect of temperature on the CO2 adsorption amount is more distinct.
In sum, without requiring extensive laboratory measurements, the developed calculation workflow is capable of predicting absolute and excess adsorption isotherms of CH4/CO2 mixtures with any feed-gas mole fractions at various temperatures. It is also an optimal method to determine the threshold of the feed-gas mole fraction, which enables us to optimize CO2 injection amounts and rates for the CO2-EGR operation in shale gas reservoirs.

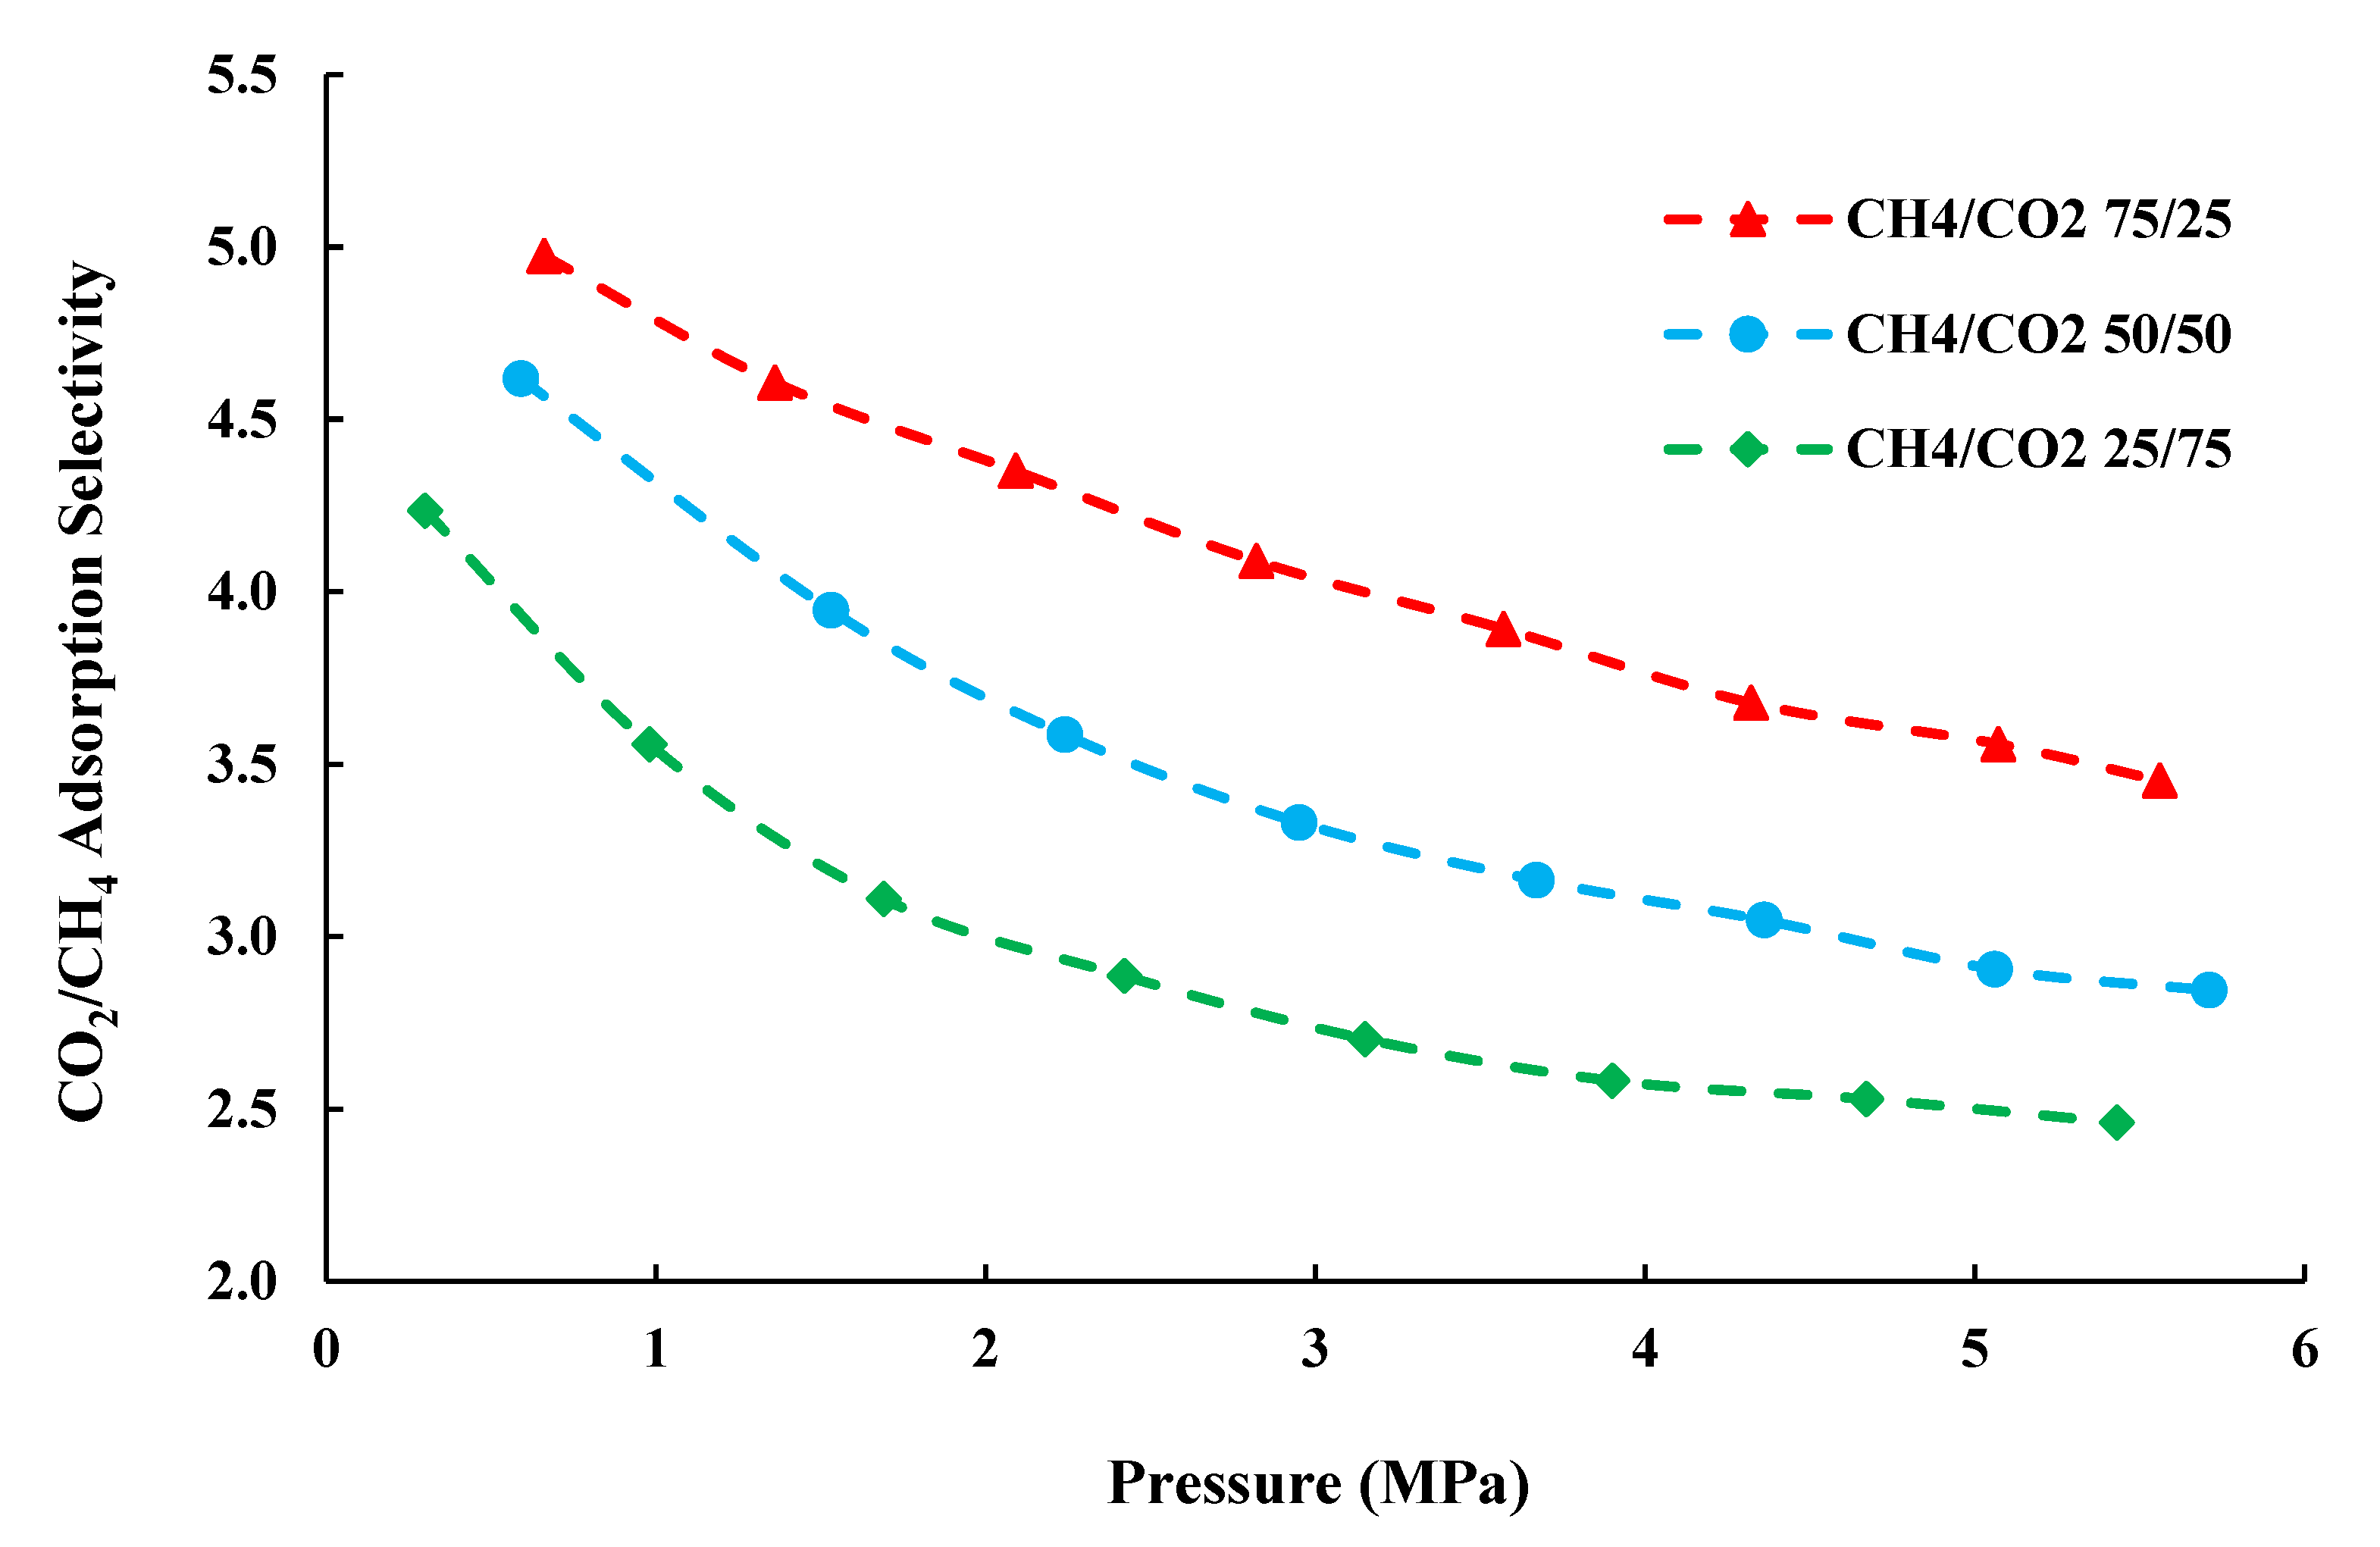
4.3. CO2/CH4 Adsorption Selectivity

Adsorption selectivity is a critical parameter to reflect the feature of CH4/CO2 competitive adsorption. The adsorption priority of CO2 against CH4 in shale can be expressed by:
S C O 2 / C H 4 = x C O 2 / x C O 2 y C O 2 / y C O 2 = n C O 2 A b s / n C H 4 A b s y C O 2 / y C O 2
where x and y refer to the mole fractions of CH4 and CO2 in adsorbed and free gases, respectively, and SCO2/CH4 is the adsorption selectivity of CO2 against CH4. It is noted that if the adsorption selectivity is larger than 1, CO2 will be preferentially adsorbed [23,53]. In addition, the larger selectivity signifies the more intense adsorption affinity of CO2 to shale rock. Herein, Figure 6 demonstrates the adsorption selectivity of 75/25, 50/50, and 25/75 CH4/CO2 gas mixtures determined via the developed calculation workflow. The adsorption selectivity ranges approximately from 2.5 to 5, indicating the preferential adsorption of CO2 over CH4 on shale. Moreover, it is observed that the adsorption selectivity decreases with the pressure because the high-energy adsorption sites are easily occupied by CO2 at low pressures, whereas CO2 and CH4 will start to take up the low-energy adsorption sites through the competition when the high-energy adsorption sites are fully occupied at high pressures, leading to the decline of the selectivity at elevated pressures [17]. Figure 6 also shows the increase of adsorption selectivity with the feed-gas mole fraction, which implies that the higher mole fraction of CO2 in feed-gas will weaken the selectivity of CO2 over CH4, although the higher mole fraction of CO2 in feed-gas will lead to more CO2 adsorption amounts in shale as shown in Figure 4. This finding is consistent with the results of adsorption selectivity reported by Wei et al. [54]. Therefore, it is significant to select a proper mole fraction for feed-gas to keep the high adsorption capacity and selectivity of CO2 over CH4 for CO2-EGR and CO2 sequestration processes.

5. Conclusions

In this work, an iterative calculation workflow based on the multicomponent SLD model is developed to predict and characterize competitive adsorption of a gas mixture in shale. Such a calculation workflow depends not on the competitive adsorption measurements that demand the multicomponent mole fractions in the gas phase at the equilibrium but on the single-component adsorption results, which significantly lower the complexity, time, and cost of the gas adsorption experiments. The main findings and conclusions in this study are summarized as follows:
  • The developed iterative calculation workflow is able to characterize and predict the excess and absolute adsorption of a gas mixture with various feed-gas mole fractions through manipulating the multicomponent SLD model to implement regression analysis on the measured single-component adsorption results simultaneously, thus bypassing the demands of the mole fraction of each component in the gas phase at the equilibrium in experiments and the binary interaction parameters obtained from the curve-fitting process.
  • The adsorption capacity of the gas component in a gas mixture is proportional to the initial feed-gas mole fraction. Accordingly, there will be a threshold of feed-gas mole fraction, above which the CO2 adsorption capacity would be larger than the CH4 adsorption capacity. Such a threshold is critical for CO2-EGR and CO2 sequestration operations in shale gas reservoirs.
  • In this study, adsorption selectivity (SCO2/CH4) ranges approximately from 2.5 to 5, indicating the preferential adsorption of CO2 over CH4 in shale. The adsorption selectivity increases with the feed-gas mole fraction, demonstrating that the higher mole fraction of CO2 in feed-gas will weaken the selectivity of CO2 over CH4, despite that the higher mole fraction of CO2 in feed-gas will lead to the larger CO2 adsorption capacity. As a result, a proper mole fraction for feed-gas should be determined to ensure the high adsorption capacity and selectivity of CO2 over CH4 in the process of CO2-EGR and CO2 sequestration.

Author Contributions

Conceptualization, Y.P. and S.C.; methodology, Y.P.; software, H.W.; validation, Y.P. and H.W.; formal analysis, Y.P.; investigation, Y.P. and H.W.; resources, Y.P. and S.C.; data curation, Y.P.; writing—original draft preparation, Y.P.; writing—review and editing, Y.P., S.C. and H.W.; visualization, H.W.; supervision, S.C.; project administration, S.C.; funding acquisition, S.C. All authors have read and agreed to the published version of the manuscript.

Funding

This research was funded by the Natural Sciences and Engineering Research Council of Canada (NSERC) Discovery Grant (RGPIN-2020-05215) and Alliance Grant (ALLRP\548576-2019) and the Canada First Research Excellence Fund entitled “Global Research Initiative in Sustainable Low Carbon Unconventional Resources”.

Institutional Review Board Statement

Not applicable.

Informed Consent Statement

Not applicable.

Data Availability Statement

Not applicable.

Acknowledgments

The authors gratefully acknowledge the Canada First Research Excellence Fund entitled “Global Research Initiative in Sustainable Low Carbon Unconventional Resources” and the Discovery Grant (RGPIN-2020-05215) and Alliance Grant (ALLRP\548576-2019) from the Natural Sciences and Engineering Research Council of Canada.

Conflicts of Interest

The authors declare no conflict of interest.

References

  1. Tao, Z.; Clarens, A. Estimating the Carbon Sequestration Capacity of Shale Formations Using Methane Production Rates. Environ. Sci. Technol. 2013, 47, 11318–11325. [Google Scholar] [CrossRef] [PubMed]
  2. Khosrokhavar, R.; Griffiths, S.; Wolf, K.-H. Shale Gas Formations and Their Potential for Carbon Storage: Opportunities and Outlook. Environ. Process. 2014, 1, 595–611. [Google Scholar] [CrossRef] [Green Version]
  3. Pei, P.; Ling, K.; He, J.; Liu, Z. Shale gas reservoir treatment by a CO2-based technology. J. Nat. Gas Sci. Eng. 2015, 26, 1595–1606. [Google Scholar] [CrossRef]
  4. Sun, H.; Yao, J.; Gao, S.-H.; Fan, D.-Y.; Wang, C.-C.; Sun, Z.-X. Numerical study of CO2 enhanced natural gas recovery and sequestration in shale gas reservoirs. Int. J. Greenh. Gas Control 2013, 19, 406–419. [Google Scholar] [CrossRef]
  5. Etminan, S.R.; Javadpour, F.; Maini, B.B.; Chen, Z. Measurement of gas storage processes in shale and of the molecular diffusion coefficient in kerogen. Int. J. Coal Geol. 2014, 123, 10–19. [Google Scholar] [CrossRef]
  6. Pang, Y.; Tian, Y.; Soliman, M.Y.; Shen, Y. Experimental measurement and analytical estimation of methane absorption in shale kerogen. Fuel 2019, 240, 192–205. [Google Scholar] [CrossRef]
  7. Huo, P.; Zhang, D.; Yang, Z.; Li, W.; Zhang, J.; Jia, S. CO2 geological sequestration: Displacement behavior of shale gas methane by carbon dioxide injection. Int. J. Greenh. Gas Control 2017, 66, 48–59. [Google Scholar] [CrossRef]
  8. Curtis, J.B. Fractured shale-gas systems. AAPG Bull. 2002, 86, 1921–1938. [Google Scholar]
  9. Heller, R.; Zoback, M. Adsorption of methane and carbon dioxide on gas shale and pure mineral samples. J. Unconv. Oil Gas Resour. 2014, 8, 14–24. [Google Scholar] [CrossRef] [Green Version]
  10. Kang, S.M.; Fathi, E.; Ambrose, R.J.; Akkutlu, I.Y.; Sigal, R.F. Carbon Dioxide Storage Capacity of Organic-Rich Shales. SPE J. 2011, 16, 842–855. [Google Scholar] [CrossRef] [Green Version]
  11. Charoensuppanimit, P.; Mohammad, S.A.; Gasem, K.A. Measurements and Modeling of Gas Adsorption on Shales. Energy Fuels 2016, 30, 2309–2319. [Google Scholar] [CrossRef]
  12. Klewiah, I.; Berawala, D.S.; Walker, H.C.A.; Andersen, P.Ø.; Nadeau, P.H. Review of experimental sorption studies of CO2 and CH4 in shales. J. Nat. Gas Sci. Eng. 2020, 73, 103045. [Google Scholar] [CrossRef]
  13. Liu, S.; Sun, B.; Xu, J.; Li, H.; Wang, X. Study on Competitive Adsorption and Displacing Properties of CO2 Enhanced Shale Gas Recovery: Advances and Challenges. Geofluids 2020, 2020, 6657995. [Google Scholar] [CrossRef]
  14. Busch, A.; Gensterblum, Y.; Krooss, B. Methane and CO2 sorption and desorption measurements on dry Argonne premium coals: Pure components and mixtures. Int. J. Coal Geol. 2003, 55, 205–224. [Google Scholar] [CrossRef]
  15. Li, L.; Su, Y.; Sheng, J.J.; Hao, Y.; Wang, W.; Lv, Y.; Zhao, Q.; Wang, H. Experimental and Numerical Study on CO2 Sweep Volume during CO2 Huff-n-Puff Enhanced Oil Recovery Process in Shale Oil Reservoirs. Energy Fuels 2019, 33, 4017–4032. [Google Scholar] [CrossRef]
  16. Godec, M.; Koperna, G.; Petrusak, R.; Oudinot, A. Potential for enhanced gas recovery and CO2 storage in the Marcellus Shale in the Eastern United States. Int. J. Coal Geol. 2013, 118, 95–104. [Google Scholar] [CrossRef]
  17. Huang, L.; Ning, Z.; Wang, Q.; Zhang, W.; Cheng, Z.; Wu, X.; Qin, H. Effect of organic type and moisture on CO2/CH4 competitive adsorption in kerogen with implications for CO2 sequestration and enhanced CH4 recovery. Appl. Energy 2018, 210, 28–43. [Google Scholar] [CrossRef]
  18. Zhao, T.; Li, X.; Zhao, H.; Li, M. Molecular simulation of adsorption and thermodynamic properties on type II kerogen: Influence of maturity and moisture content. Fuel 2017, 190, 198–207. [Google Scholar] [CrossRef]
  19. Yu, W.; Al-Shalabi, E.W.; Sepehrnoori, K. A Sensitivity Study of Potential CO2 Injection for Enhanced Gas Recovery in Barnett Shale Reservoirs. In Proceedings of the SPE Unconventional Resources Conference, The Woodlands, TX, USA, 1–3 April 2014. [Google Scholar]
  20. Jiang, J.; Shao, Y.; Younis, R. Development of a Multi-Continuum Multi-Component Model for Enhanced Gas Recovery and CO2 Storage in Fractured Shale Gas Reservoirs. In Proceedings of the SPE Improved Oil Recovery Symposium, Tulsa, OK, USA, 12–16 April 2014. [Google Scholar]
  21. Zhang, R.-H.; Wu, J.-F.; Zhao, Y.-L.; He, X.; Wang, R.-H. Numerical simulation of the feasibility of supercritical CO2 storage and enhanced shale gas recovery considering complex fracture networks. J. Pet. Sci. Eng. 2021, 204, 108671. [Google Scholar] [CrossRef]
  22. Sun, J.; Chen, C.; Hu, W.; Cui, J.; Jiang, L.; Liu, Y.; Zhao, Y.; Li, W.; Song, Y. Asymmetric competitive adsorption of CO2/CH4 binary mixture in shale matrix with heterogeneous surfaces. Chem. Eng. J. 2021, 422, 130025. [Google Scholar] [CrossRef]
  23. Hu, X.; Deng, H.; Lu, C.; Tian, Y.; Jin, Z. Characterization of CO2/CH4 competitive adsorption in various clay minerals in relation to shale gas recovery from molecular simulation. Energy Fuels 2019, 33, 8202–8214. [Google Scholar] [CrossRef]
  24. Niu, Y.; Yue, C.; Li, S.; Ma, Y.; Xu, X. Influencing Factors and Selection of CH4 and CO2 Adsorption on Silurian Shale in Yibin, Sichuan Province of China. Energy Fuels 2018, 32, 3202–3210. [Google Scholar] [CrossRef]
  25. Luo, X.; Wang, S.; Wang, Z.; Jing, Z.; Lv, M.; Zhai, Z.; Han, T. Adsorption of methane, carbon dioxide and their binary mixtures on Jurassic shale from the Qaidam Basin in China. Int. J. Coal Geol. 2015, 150–151, 210–223. [Google Scholar] [CrossRef]
  26. Cancino, O.P.O.; Pérez, D.P.; Pozo, M.; Bessieres, D. Adsorption of pure CO2 and a CO2/CH4 mixture on a black shale sample: Manometry and microcalorimetry measurements. J. Pet. Sci. Eng. 2017, 159, 307–313. [Google Scholar] [CrossRef]
  27. Liu, J.; Xie, L.; Elsworth, D.; Gan, Q. CO2/CH4 competitive adsorption in shale: Implications for enhancement in gas production and reduction in carbon emissions. Environ. Sci. Technol. 2019, 53, 9328–9336. [Google Scholar] [CrossRef]
  28. Yao, Y.; Liu, J.; Liu, D.; Chen, J.; Pan, Z. A new application of NMR in characterization of multiphase methane and adsorption capacity of shale. Int. J. Coal Geol. 2019, 201, 76–85. [Google Scholar] [CrossRef]
  29. Lowell, S.; Shields, J.E.; Thomas, M.A. Characterization of Porous Solids and Powders: Surface Area, Pore Size and Density; Springer: Berlin, Germany, 2012; Volume 16. [Google Scholar]
  30. Clarkson, C.R.; Haghshenas, B. Modeling of Supercritical Fluid Adsorption on Organic-Rich Shales and Coal. In Proceedings of the SPE Unconventional Resources Conference, The Woodlands, TX, USA, 10–12 April 2013. [Google Scholar]
  31. Pang, Y.; Soliman, M.Y.; Deng, H.; Emadi, H. Analysis of Effective Porosity and Effective Permeability in Shale-Gas Reservoirs with Consideration of Gas Adsorption and Stress Effects. SPE J. 2017, 22, 1739–1759. [Google Scholar] [CrossRef]
  32. Rangarajan, B.; Lira, C.T.; Subramanian, R. Simplified local density model for adsorption over large pressure ranges. AIChE J. 1995, 41, 838–845. [Google Scholar] [CrossRef]
  33. Pang, Y.; Hu, X.; Wang, S.; Chen, S.; Soliman, M.Y.; Deng, H. Characterization of adsorption isotherm and density profile in cylindrical nanopores: Modeling and measurement. Chem. Eng. J. 2020, 396, 125212. [Google Scholar] [CrossRef]
  34. Sudibandriyo, M.; Mohammad, S.; Robinson, R.L.; Gasem, K.A. Ono-Kondo lattice model for high-pressure adsorption: Pure gases. Fluid Phase Equilibria 2010, 299, 238–251. [Google Scholar] [CrossRef]
  35. Zhou, S.; Ning, Y.; Wang, H.; Liu, H.; Xue, H. Investigation of methane adsorption mechanism on Longmaxi shale by combining the micropore filling and monolayer coverage theories. Adv. Geo-Energy Res. 2018, 2, 269–281. [Google Scholar] [CrossRef] [Green Version]
  36. Arri, L.; Yee, D.; Morgan, W.; Jeansonne, M. Modeling coalbed methane production with binary gas sorption. In Proceedings of the SPE Rocky Mountain Regional Meeting, Casper, WY, USA, 18–21 May 1992. [Google Scholar]
  37. Clarkson, C.; Bustin, R. Binary gas adsorption/desorption isotherms: Effect of moisture and coal composition upon carbon dioxide selectivity over methane. Int. J. Coal Geol. 2000, 42, 241–271. [Google Scholar] [CrossRef]
  38. Walton, K.S.; Sholl, D.S. Predicting multicomponent adsorption: 50 years of the ideal adsorbed solution theory. AIChE J. 2015, 61, 2757–2762. [Google Scholar] [CrossRef]
  39. Duan, S.; Gu, M.; Du, X.; Xian, X. Adsorption Equilibrium of CO2 and CH4 and Their Mixture on Sichuan Basin Shale. Energy Fuels 2016, 30, 2248–2256. [Google Scholar] [CrossRef]
  40. Fitzgerald, J.E.; Robinson, R.L.; Gasem, K.A. Modeling High-Pressure Adsorption of Gas Mixtures on Activated Carbon and Coal Using a Simplified Local-Density Model. Langmuir 2006, 22, 9610–9618. [Google Scholar] [CrossRef]
  41. Sudibandriyo, M.; Mohammad, S.A.; Robinson, R.L., Jr.; Gasem, K.A. Ono-Kondo Model for High-Pressure Mixed-Gas Adsorption on Activated Carbons and Coals. Energy Fuels 2011, 25, 3355–3367. [Google Scholar] [CrossRef]
  42. Sudibandriyo, M.; Pan, Z.; Fitzgerald, J.E.; Robinson, R.L.; Gasem, K.A. Adsorption of Methane, Nitrogen, Carbon Dioxide, and Their Binary Mixtures on Dry Activated Carbon at 318.2 K and Pressures up to 13.6 MPa. Langmuir 2003, 19, 5323–5331. [Google Scholar] [CrossRef]
  43. Mohammad, S.A.; Arumugam, A.; Robinson, R.L., Jr.; Gasem, K.A. High-Pressure Adsorption of Pure Gases on Coals and Activated Carbon: Measurements and Modeling. Energy Fuels 2012, 26, 536–548. [Google Scholar] [CrossRef]
  44. Chareonsuppanimit, P.; Mohammad, S.; Robinson, R.L., Jr.; Gasem, K.A. High-pressure adsorption of gases on shales: Measurements and modeling. Int. J. Coal Geol. 2012, 95, 34–46. [Google Scholar] [CrossRef]
  45. Peng, D.Y.; Robinson, D.B. A New Two-Constant Equation of State. Ind. Eng. Chem. Fundam. 1976, 15, 59–64. [Google Scholar] [CrossRef]
  46. Lee, L.L. Molecular Thermodynamics of Nonideal Fluids; Butterworth-Heinemann: Oxford, UK, 2016. [Google Scholar]
  47. Chen, J.H.; Wong, A.D.S.H.; Tan, C.S.; Subramanian, R.; Lira, A.C.T.; Orth, M. Adsorption and Desorption of Carbon Dioxide onto and from Activated Carbon at High Pressures. Ind. Eng. Chem. Res. 1997, 36, 2808–2815. [Google Scholar] [CrossRef]
  48. Gasem, K.; Gao, W.; Pan, Z.; Robinson, R., Jr. A modified temperature dependence for the Peng-Robinson equation of state. Fluid Phase Equilibria 2001, 181, 113–125. [Google Scholar] [CrossRef]
  49. Qin, C.; Jiang, Y.; Zhou, J.; Song, X.; Liu, Z.; Li, D.; Zhou, F.; Xie, Y.; Xie, C. Effect of supercritical CO2 extraction on CO2/CH4 competitive adsorption in Yanchang shale. Chem. Eng. J. 2021, 412, 128701. [Google Scholar] [CrossRef]
  50. Zhang, T.; Ellis, G.; Ruppel, S.C.; Milliken, K.; Yang, R. Effect of organic-matter type and thermal maturity on methane adsorption in shale-gas systems. Org. Geochem. 2012, 47, 120–131. [Google Scholar] [CrossRef]
  51. Zhou, W.; Zhang, Z.; Wang, H.; Yan, Y.; Liu, X. Molecular insights into competitive adsorption of CO2/CH4 mixture in shale nanopores. RSC Adv. 2018, 8, 33939–33946. [Google Scholar] [CrossRef] [Green Version]
  52. Tang, X.; Ripepi, N.; Luxbacher, K.; Pitcher, E. Adsorption Models for Methane in Shales: Review, Comparison, and Application. Energy Fuels 2017, 31, 10787–10801. [Google Scholar] [CrossRef]
  53. Wang, S.; Yao, X.; Feng, Q.; Javadpour, F.; Yang, Y.; Xue, Q.; Li, X. Molecular insights into carbon dioxide enhanced multi-component shale gas recovery and its sequestration in realistic kerogen. Chem. Eng. J. 2021, 425, 130292. [Google Scholar] [CrossRef]
  54. Wei, M.; Yu, Q.; Duan, W.; Hou, L.; Liu, K.; Qin, Q.; Liu, S.; Dai, J. Equilibrium and Kinetics Analysis of CO2 Adsorption on Waste Ion-exchange Resin-based Activated Carbon. J. Taiwan Inst. Chem. Eng. 2017, 77, 161–167. [Google Scholar] [CrossRef]
Figure 1. Calculation workflow based on multicomponent SLD model for competitive adsorption of the CH4/CO2 binary mixture.
Energies 15 02548 g001
Figure 2. Adsorption isotherms of CH4, CO2, and 50/50 CH4/CO2 mixture in shale at 313.15 K. (a) Pure gas. (b) Gas mixture (CH4/CO2 50/50).
Energies 15 02548 g002
Figure 3. Excess adsorption isotherms of each component in 75/25 and 25/75 CH4/CO2 mixtures in shale at 313.15 K. (a) Gas mixture (CH4/CO2 75/25). (b) Gas mixture (CH4/CO2 25/75).
Energies 15 02548 g003
Figure 4. Absolute adsorption isotherms of each component in CH4/CO2 mixtures in shale at 313.15 K.
Energies 15 02548 g004
Figure 5. Excess adsorption isotherms of each component in CH4/CO2 (50/50) mixture in shale at 313.15, 333.15, and 353.15 K.
Energies 15 02548 g005
Figure 6. Adsorption selectivity of CH4/CO2 binary mixtures at 313.15 K.
Energies 15 02548 g006
Table 1. Physical properties of CH4 and CO2.
Gas MoleculeCritical Pressure (MPa)Critical Temperature (K)Molecular Diameter (nm)Acentric Factor
CH44.599190.560.3730.0113
CO27.377304.130.36480.225
Table 2. Regression parameters and %AAD for pure gas adsorption.
Gas ComponentL (nm)εfs/kB (K)A (m2/g)Ab %AAD
CH48.637.81160.13.76
CO28.672.2516−0.014.63
Publisher’s Note: MDPI stays neutral with regard to jurisdictional claims in published maps and institutional affiliations.

