Abstract
Due to the complex operation conditions in a power transformer, an oil-impregnated pressboard (OIP) simultaneously suffers from thermal, electrical, and mechanical stress. Since most research studies have paid much attention to thermal or electrical aging of OIPs, this paper analyzes the effects of long-term mechanical vibrations on cellulose degradation in OIPs under simultaneous multi-stress. The aging experiments were firstly conducted at 130 °C, with a DC electric voltage of +6 kV, vibration amplitude of 10–50 μm, and vibration frequency of 100–300 Hz. The finite element analysis (FEA) of the pressboard vibration model was then performed on Abaqus to investigate the time–frequency domain characteristic parameters of compressive stress on the pressboard under varied vibration frequencies and amplitudes. The FEA results reveal that compressive stress on the pressboard in a multi-stress aging experiment coincided with the axial compressive stress on the insulation spacers in an SZ-50000/110 transformer. Moreover, combined with the degree of polymerization (DP) of cellulose, the effects of long-term vibration on cellulose degradation are reflected in two ways: the increase in compressive stress on the pressboard generates more links available for degradation, while more high frequency harmonic components in compressive stress accelerate the reaction rate in cellulose degradation.
1. Introduction
An oil-impregnated pressboard (OIP) is widely utilized as the main electrical insulation in a power transformer [1]. Due to the complex operating conditions in a power transformer, an OIP simultaneously suffers from thermal, electrical, and mechanical stresses, which degrade its tensile strength, thus threatening the safe operation of transformer [2]. Since most faults in electrical equipment correspond to the electrical insulation, investigation into the aging of an OIP is of vital importance to prevent possible failures and to ensure the stable operation of the power transformer [3].
Thus far, most research studies have focused on the thermal aging of OIPs [4,5,6,7] in transformers. Thermal stress is widely regarded as the primary factor of cellulose degradation, while other factors, including low molecular acid [8], moisture [9], partial discharge [10], etc., accelerate the aging reaction. However, few research studies have considered the effects of mechanical vibrations on cellulose degradation. In a transformer, the OIP suffers from the electromagnetic force of winding in a leakage magnetic field, which probably leads to deformation or even destruction, especially in a short-circuit fault. Therefore, research studies [11,12] and IEC standard 60076-5 [13] have investigated the ability to withstand the short-circuit force and set the allowable short-circuit stress limitation. Apart from the short-circuit fault, the OIP in the transformer is continuously exposed to long-term vibrations from windings along the radial and axial directions in steady-state operating conditions [14,15]. The radial vibration in disk windings produces the compressive force in the inner winding and the tensile force in the outer winding, which directly lay the compressive or tensile stress on the turn-to-turn insulation [16]. Reference [17] focuses on the aging properties of an OIP under high-temperature and long-term radial vibration of windings, the authors found that the DP and tensile strength of the OIP markedly declined. Thus, this suggests that the combined mechanical–thermal aging might be regarded as thermal aging with lower degradation activation energy. The axial vibration in winding produces the compressive stress on the insulation spacers [18]. Compared with the instantaneous short-circuit fault, the long-term effects of mechanical vibration on the aging of an OIP under steady-state operating conditions remain unknown, which should be investigated in detail.
In previous research, we conducted an aging experiment of an OIP under simultaneous thermal–electrical–mechanical stress and investigated the characteristics and kinetics of cellulose degradation in the OIP [19]. However, it lacked a more detailed analysis regarding the effects of long-term mechanical vibrations on the cellulose degradation in the OIP. In order to solve this problem, in this paper, we investigate the compressive stress on the pressboard by means of the finite element method (FEM) to extract the time–frequency domain characteristic parameters of compressive stress under varied vibration frequencies and amplitudes. The comparison between compressive stress on a pressboard and that on the insulation spacers in a real transformer was then made to prove the engineering significance of the OIP multi-stress aging experiment. Finally, the correlation between the cellulose degradation in the OIP and compressive stress on the pressboard was built to reveal the effects of mechanical vibration on the cellulose degradation.
2. OIP Multi-Stress Aging Experimental Setup and Plan
2.1. OIP Multi-Stress Aging Experimental Setup
The OIP multi-stress aging experiment setup was built to emulate the operation conditions of insulation spacers between windings in the converter transformer, including the temperature rise, electric field, and mechanical vibration. According to reference [20], the average temperature rise of winding in the transformer measures 50–70 °C. On overloading conditions, the temperature of hot spot is as high as 120 °C. As to the electric field, the insulation materials in the converter transformer suffers from an AC–DC combined voltage. Due to the different permittivities and resistivities of the oil and pressboard, the AC and DC electric field was concentrated in the oil and pressboard, respectively. The DC electric voltage on OIP was approximately 3 kV/mm. As to the vibration, according to references [21,22], the axial vibration on the insulation spacers between windings was mainly dominated by the frequency components at 100 Hz and its second and third harmonics. Moreover, based on the reported FEM results, the vibration amplitude was within 1 to 100 μm in winding under steady-state operating conditions.
According to the operation conditions of insulation spacers between windings, the multi-stress aging experiment setup was built, as shown in Figure 1, and was made up of a pressboard vibration system, three aging chambers, a DC high-voltage source, and a temperature controller. In each aging chamber (Figure 2), the thermal–electrical–mechanical stress was simultaneously applied to the OIP samples, as listed below.
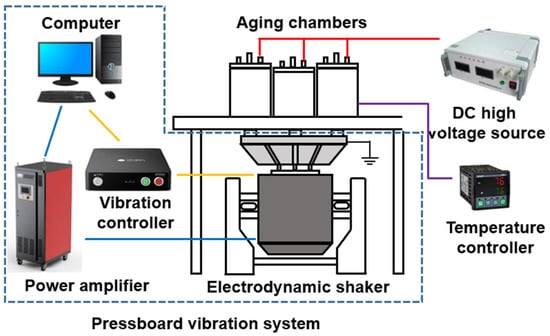
Figure 1.
OIP multi-stress aging experimental setup.
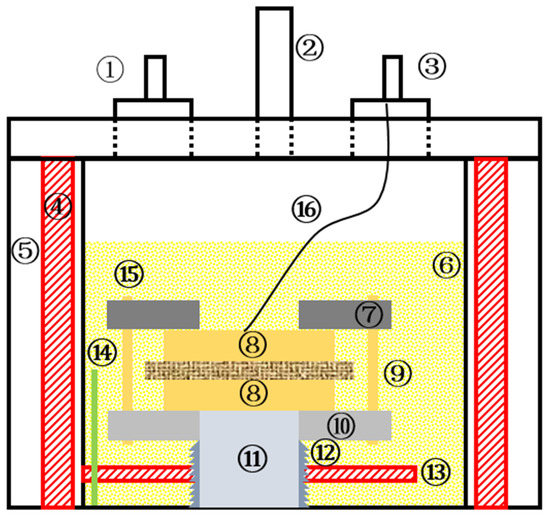
Figure 2.
Aging chamber diagram (① pressure relief valve, ② gas injection valve, ③ bushing, ④ insulating layer, ⑤ stainless steel cavity, ⑥ transformer oil, ⑦ mica board, ⑧ copper electrode plate, ⑨ insulating pressboard, ⑩ aluminum board, ⑪ aluminum rod, ⑫ bellows, ⑬ heating pipe, ⑭ thermocouple, ⑮ bolt, ⑯ high-temperature wire).
- Thermal stress: in each aging chamber, the oil and pressboard were heated until 130 °C ± 0.1 °C.
- Electrical stress: a DC voltage of +6 kV was applied on the OIP sample by two copper plate electrodes.
- Mechanical stress: the sine wave vibration was transmitted from the shaker to the lower copper plate electrode via an aluminum rod. The vibration frequencies and vibration amplitudes were determined as 100–300 Hz and 10–50 μm, respectively.
2.2. OIP Multi-Stress Aging Experimental Parameters
As described in 2.1, the multi-stress aging experimental parameters were determined, as listed in Table 1. Briefly, the aging experiments were conducted at 130 °C, a DC electrical voltage of +6 kV for all experimental groups, while the vibration frequency ranges from 100 to 300 Hz and the vibration amplitude ranges from 10 to 50 μm. Apart from these experimental groups, the control groups were determined as well, including the thermal aging experiment (group T), the thermal–electrical aging experiment (group TE), and the mechanical aging experiment (group M15). The aging experimental parameters of control groups are also listed in Table 1. Moreover, the abbreviation is listed as well to describe the experimental and control groups more appropriately. For example, the experimental group TEM11 means that the aging experiment was performed at a vibration frequency of 100 Hz and a vibration amplitude of 10 μm.

Table 1.
OIP multi-stress aging experimental parameters.
3. Mechanical Vibration Finite Element Analysis of the Pressboard
3.1. Force Analysis of the Pressboard under Vibration
In a multi-stress aging experiment, the pressboard in each aging chamber is installed between the two copper plate electrodes inside each aging chamber. The “electrode-pressboard-electrode” sandwich structure is clamped by the mica board and aluminum board via a bolt. The preload between the mica board and aluminum board prevents the pressboard from an unexpected horizontal slide during vibration. The aluminum rod rigidly connects the lower copper plate electrode and external electrodynamic shaker, so that the vibration can be transmit effectively from the electrodynamic shaker to the lower copper plate electrode, which can be regarded as an external vibration loading. During vibration, most of the central area (over 95% of the total area) of the pressboard suffers from axial compressive forces from both sides, which is expected to be the main cause of the aging of the OIP under mechanical vibration. Therefore, this paper mainly investigates the axial compressive stress by means of FEM.
Based on the above analysis, the pressboard vibration model can be simplified as shown in Figure 3.
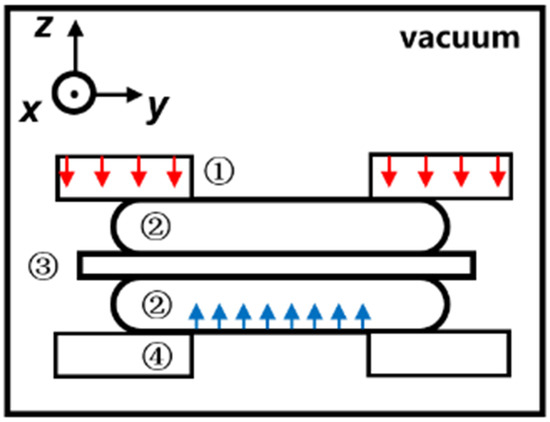
Figure 3.
Pressboard vibration system in OIP multi-stress aging experimental setup (① mica board, ② copper electrode plate, ③ pressboard, ④ aluminum board, ↓ preload, ↑ vibration).
As can been seen from Figure 3, the pressboard vibration model is composed of the mica board, upper copper electrode plate, pressboard, lower copper electrode plate, and the aluminum board from top to bottom. A preload is applied on the mica board, while a vibration is applied on the bottom surface of the lower copper electrode plate. Since the main research focus is the pressboard, it is assumed that the transformer oil is ignored to avoid the possible nonconvergence of the fluid–solid finite element analysis. Moreover, in most cases, the finite element analysis of the winding vibration in a real transformer ignores the transformer. The objective of the finite element analysis of the pressboard vibration is to calculate the axial displacement and compressive stress under different vibration conditions.
3.2. Finite Element Analysis Procedure
FEM is a popular method used for numerically solving differential equations arising in engineering modeling. For a one-dimensional function f(x), the FEM focuses on its expansion on the subdomain (xi, xi+1) rather than on a global base. Therefore, the FEM expansion function can be described as Equation (1).
where ai + bix(x∈(xi,xi+1)) is the basis function on subdomain (xi, xi+1), ai, bi are the coefficients.
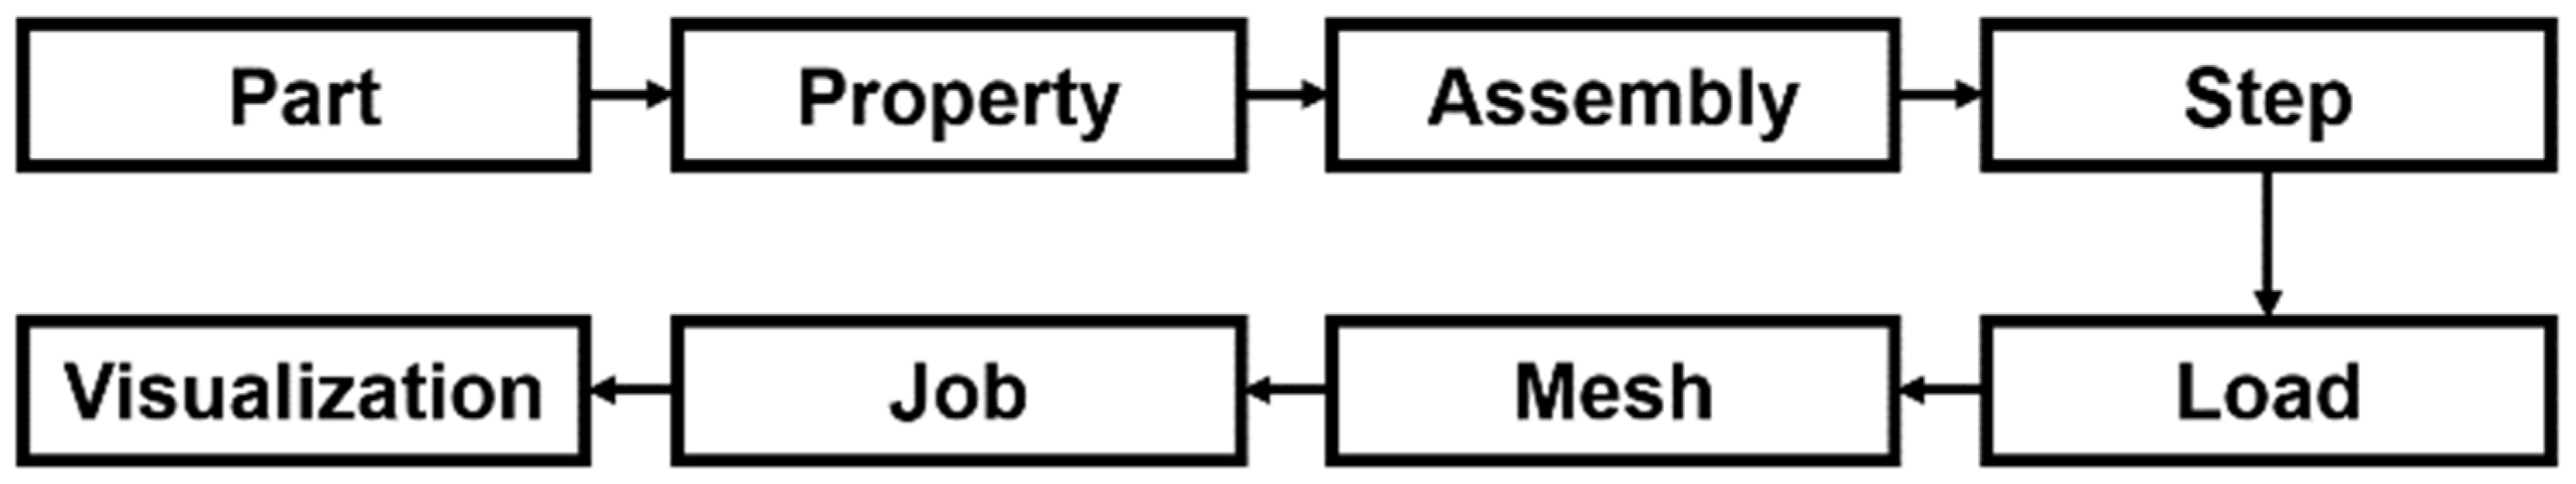
The finite element model of the pressboard vibration is built on Abaqus through the following procedures shown in Figure 4. More details are shown as follows.

Figure 4.
Finite element analysis flowchart on Abaqus.
- Modeling: As shown in Figure 3, the 3D finite element model of the pressboard vibration on Abaqus is shown in Figure 5. The related material properties for each part of the finite element model are listed in Table 2. The 3D element model equation can be described as
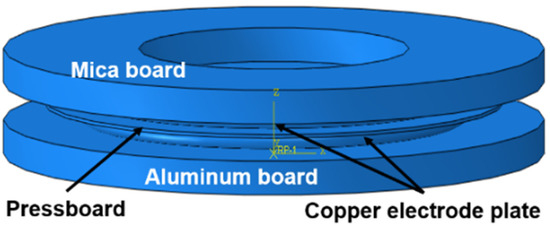 Figure 5. The 3D finite model of the pressboard vibration.
Table 2. Material properties for the finite element model of the pressboard vibration.
Figure 5. The 3D finite model of the pressboard vibration.
Table 2. Material properties for the finite element model of the pressboard vibration.
- Load and boundary condition: the load and boundary conditions of the pressboard vibration model are defined through two analysis steps, successively. In the first “static” analysis step, the initial preload is applied on the upper surface of the mica board, and the lower surface of the aluminum board is fixed. This static step lasts for 1 s. In the second “dynamic” analysis step, the sine wave vibration is applied on the lower surface of the lower copper plate electrode. This dynamic step lasts 0.5 s for groups (fV = 100 Hz and 200 Hz) and 0.8 s for group (fV = 300 Hz).
- Meshing: after defining the load and boundary conditions, meshing is then performed on the 3D pressboard vibration model. Detailed meshing information is listed in Table 3.
Table 3. Meshing information in the finite element model of the pressboard vibration.
- Calculation: the calculation job is submitted and performed on PC (CPU: i3-8100, GPU: RX580 2048SP, RAM: 8G) to output the axial displacement and stress nephogram and time domain signals of the pressboard.
4. Time–Frequency Domain Analysis of Compressive Stress on the Pressboard
Based on the established pressboard vibration model, an investigation on the mechanical stress of the pressboard is performed under different vibration conditions in order to calculate and obtain time domain mechanical parameters, including displacement signal, stress signal, and spectrum. The time–frequency domain characteristic parameters of compressive stress are then extracted to investigate the effect of vibration amplitudes and frequencies. Since, in most cases, the displacement or stress on the pressboard under different vibration conditions share similar time–frequency domain characteristics, this section uses the group TEM11 (fV = 100 Hz, AV = 10 μm), for example, if not mentioned otherwise.
4.1. Axial Displacement of the Pressboard under Vibration
The vibration from the lower copper plate electrode leads to axial displacement of the pressboard. The axial displacement nephogram of the pressboard is shown in Figure 6. From this figure, a uniform distribution of axial displacement of the pressboard can be found during vibration. Moreover, the axial displacement signal of the central node of the pressboard is shown in Figure 7. The axial sinusoidal displacement signal of the pressboard follows the external vibration loading applied on the lower copper plate electrode, which means that the vibration can be effectively transmitted to the pressboard in the finite element modeling.
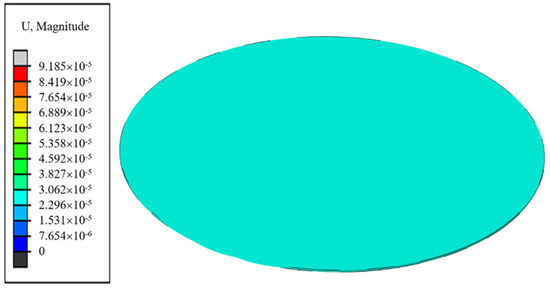
Figure 6.
Axial displacement nephogram of the pressboard (TEM11) at the moment of 1.03.
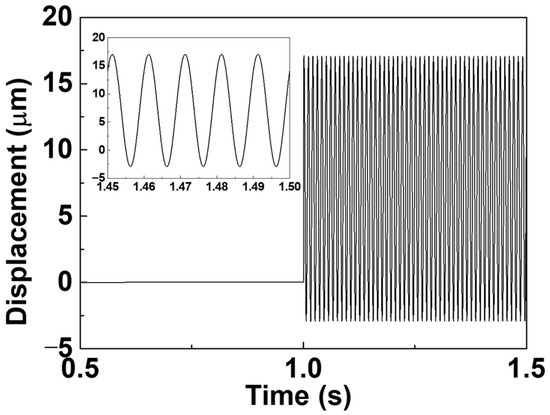
Figure 7.
Axial displacement signal of the central node of the pressboard of group TEM11 in the time range 0.5 to 1.5 s (locally enlarged signal in time range 1.45 to 1.5 s in the subfigure.
4.2. Time Domain Analysis of Stress on the Pressboard under Vibration
4.2.1. Compressive Stress Signal
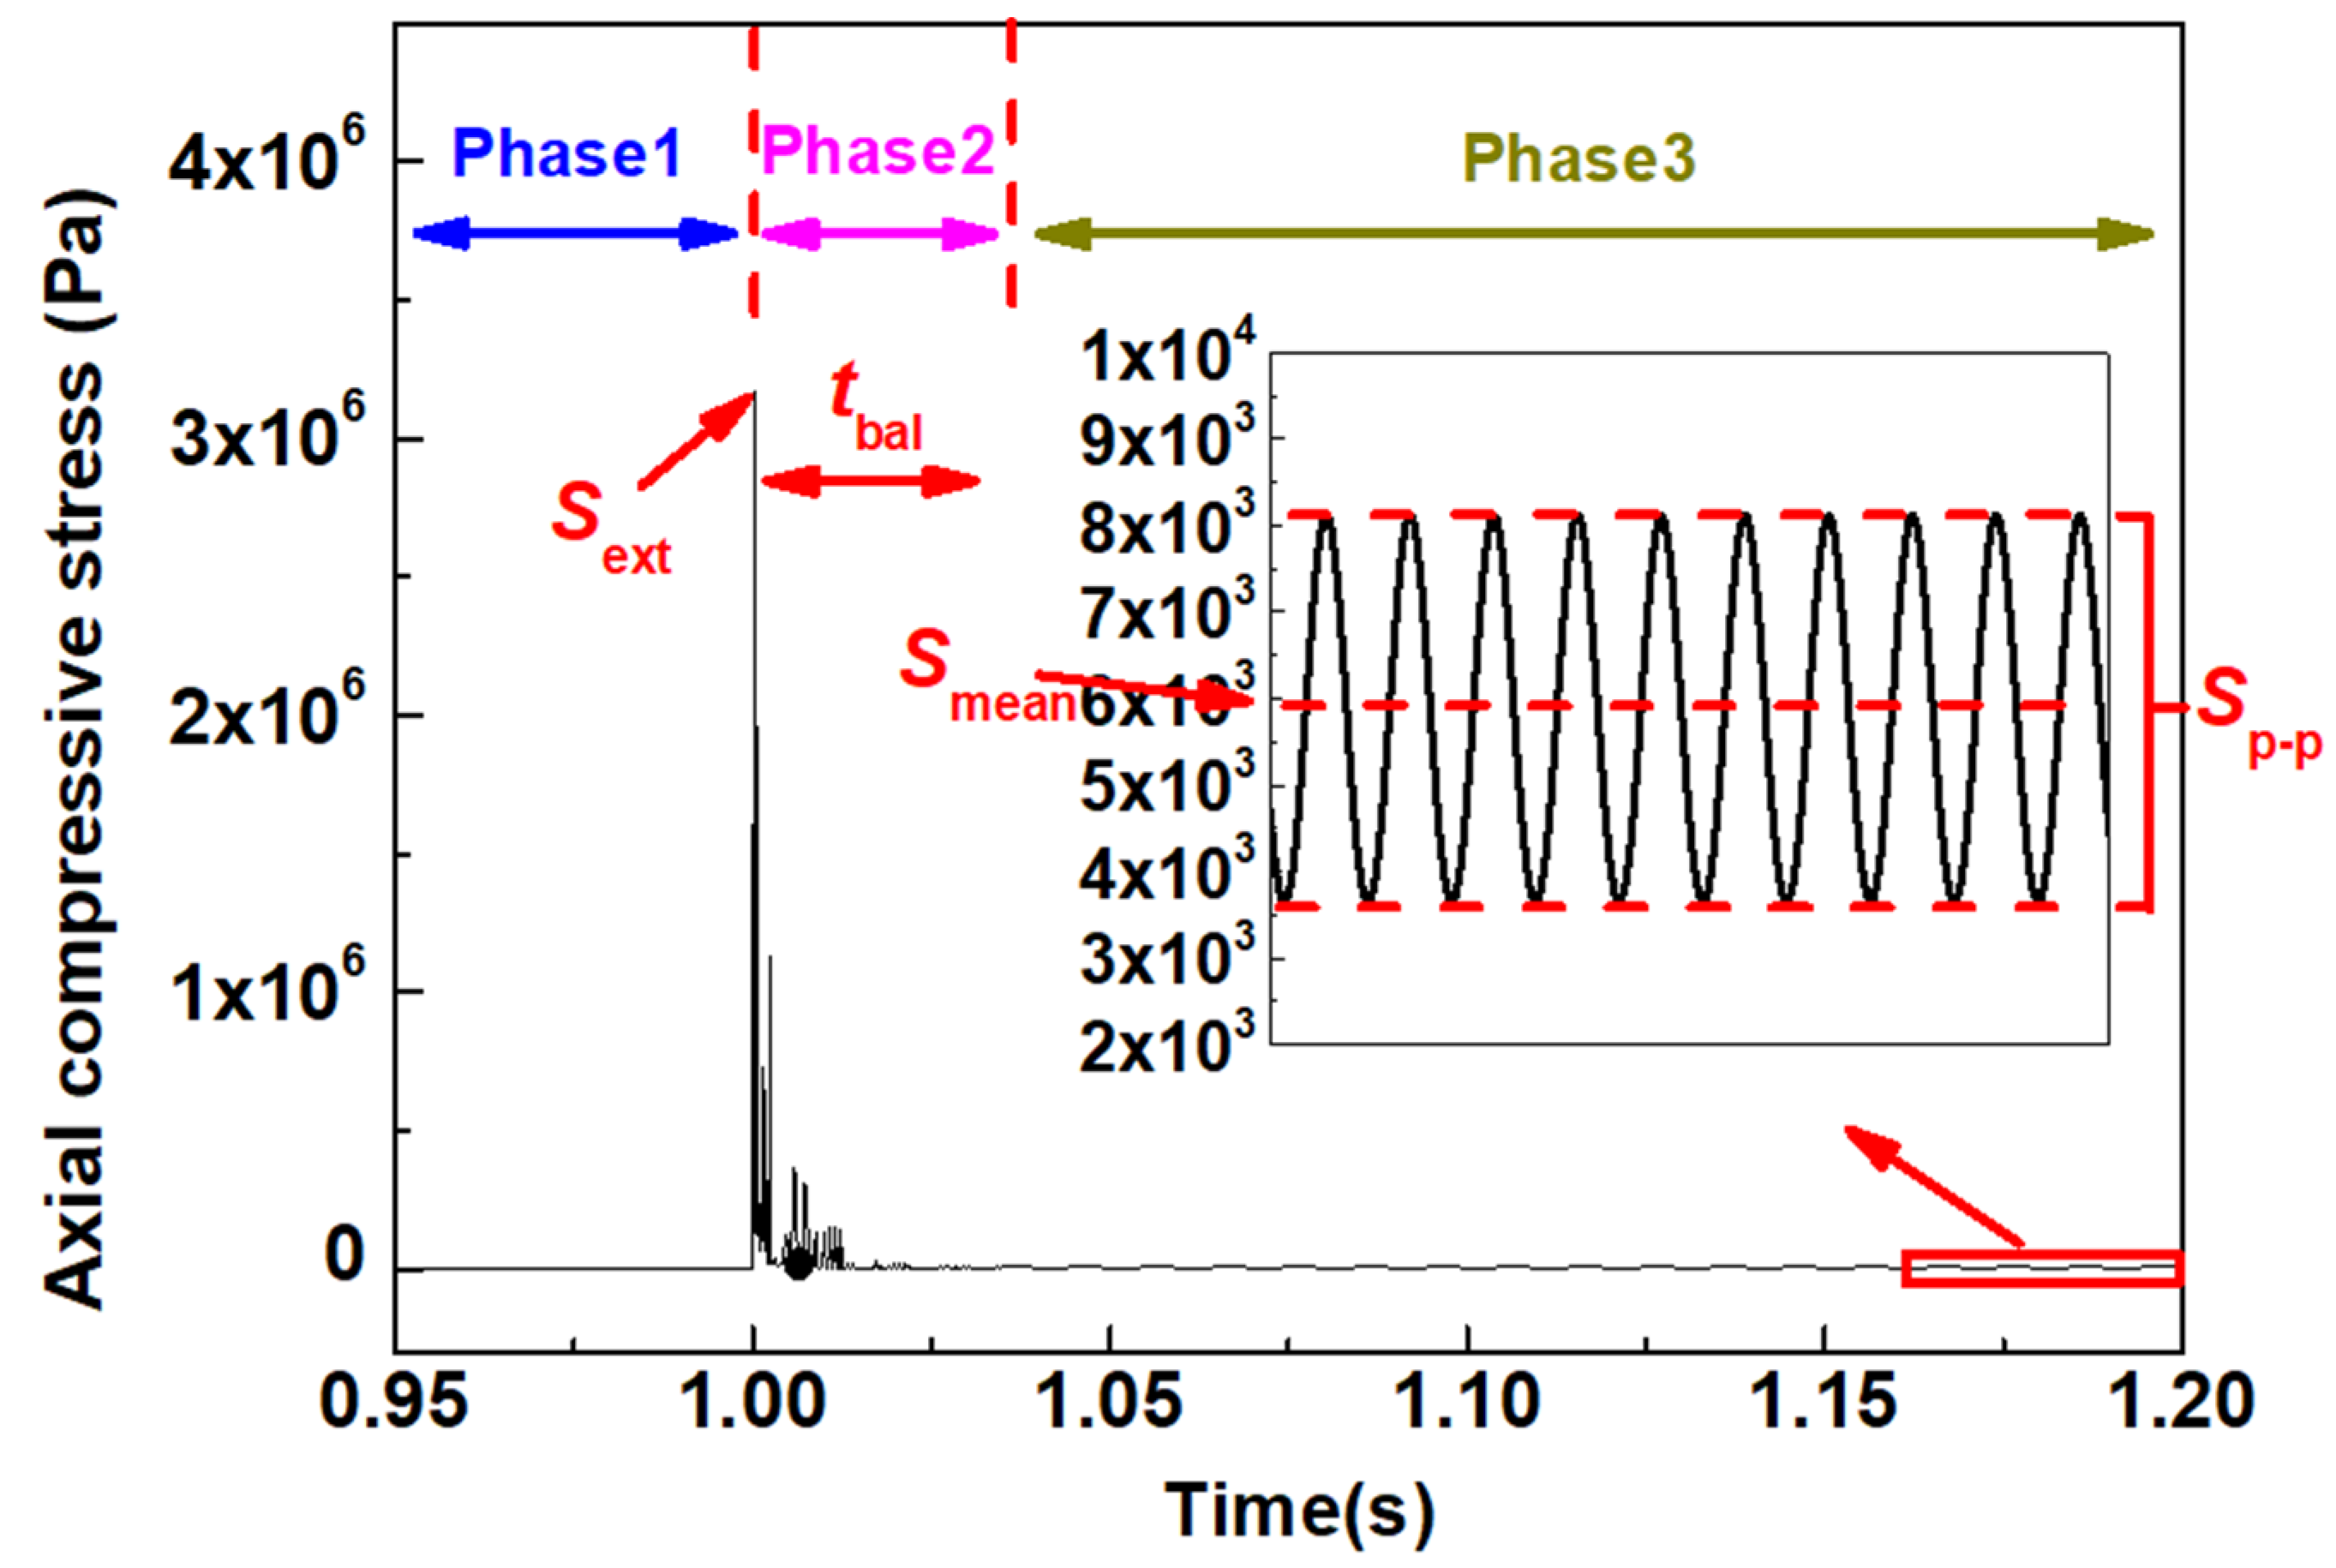
The axial compressive stress signal on the central node of the pressboard in the time range 0.95 to 1.5 s is shown in Figure 8.

Figure 8.
Axial compressive stress signal on the central node of the pressboard of group TEM11.
From Figure 8, it is clear that the axial compressive stress signal can be divided into three phases over time.
- Phase 1 (before 1 s): before vibration, only the preload is assigned on the pressboard. Compared with the following two phases, the axial compressive stress in phase 1 is negligible.
- Phase 2 (1–1.03 s): at the start of vibration, the compressive stress increases sharply and reaches over 3 Mpa. After that, the compressive stress decays quickly within 0.03–0.05 s, depending on the vibration frequencies.
- Phase 3 (1.03–1.5 s): as shown in subfigure in Figure 8, the compressive stress on the pressboard becomes steady and fluctuates periodically, similar to a sine wave signal. The mean stress value reduces to approximately 6 × 10³ Pa.
According to the axial compressive stress signal on the pressboard, the extreme value of instantaneous axial compressive stress (under different vibration conditions) is not higher than 20 Mpa, which is far below the compressive strength of the pressboard (over 100 Mpa). Moreover, this extreme stress lasts less than 0.2 s, much less than the aging duration (at least 5 days). Therefore, the compressive stress on the pressboard during aging experiments is not high enough to crush the pressboard directly. Meanwhile, the long-term effects of compressive stress on the pressboard in phase 3 is the key to the aging of the OIP under mechanical vibration. Therefore, the following investigations mainly focus on the compressive stress on the pressboard in phase 3.
In order to feature the time domain properties of compressive stress, four characteristic parameters are proposed, as follows, and are labeled in Figure 8.
- Sext: the extreme axial compressive stress on the pressboard at the start of vibration in phase 2, Sext measures 3.170 Mpa in Figure 8.
- Smean: the axial mean compressive stress on the pressboard in phase 3, Smean measures 6 × 10³ Pa in Figure 8.
- Sp-p: the peak-to-peak compressive stress on the pressboard in phase 3, which describes the volatility of the stress signal. Sp-p measures 5 × 10³ Pa in Figure 8.
4.2.2. Compressive Stress Distribution
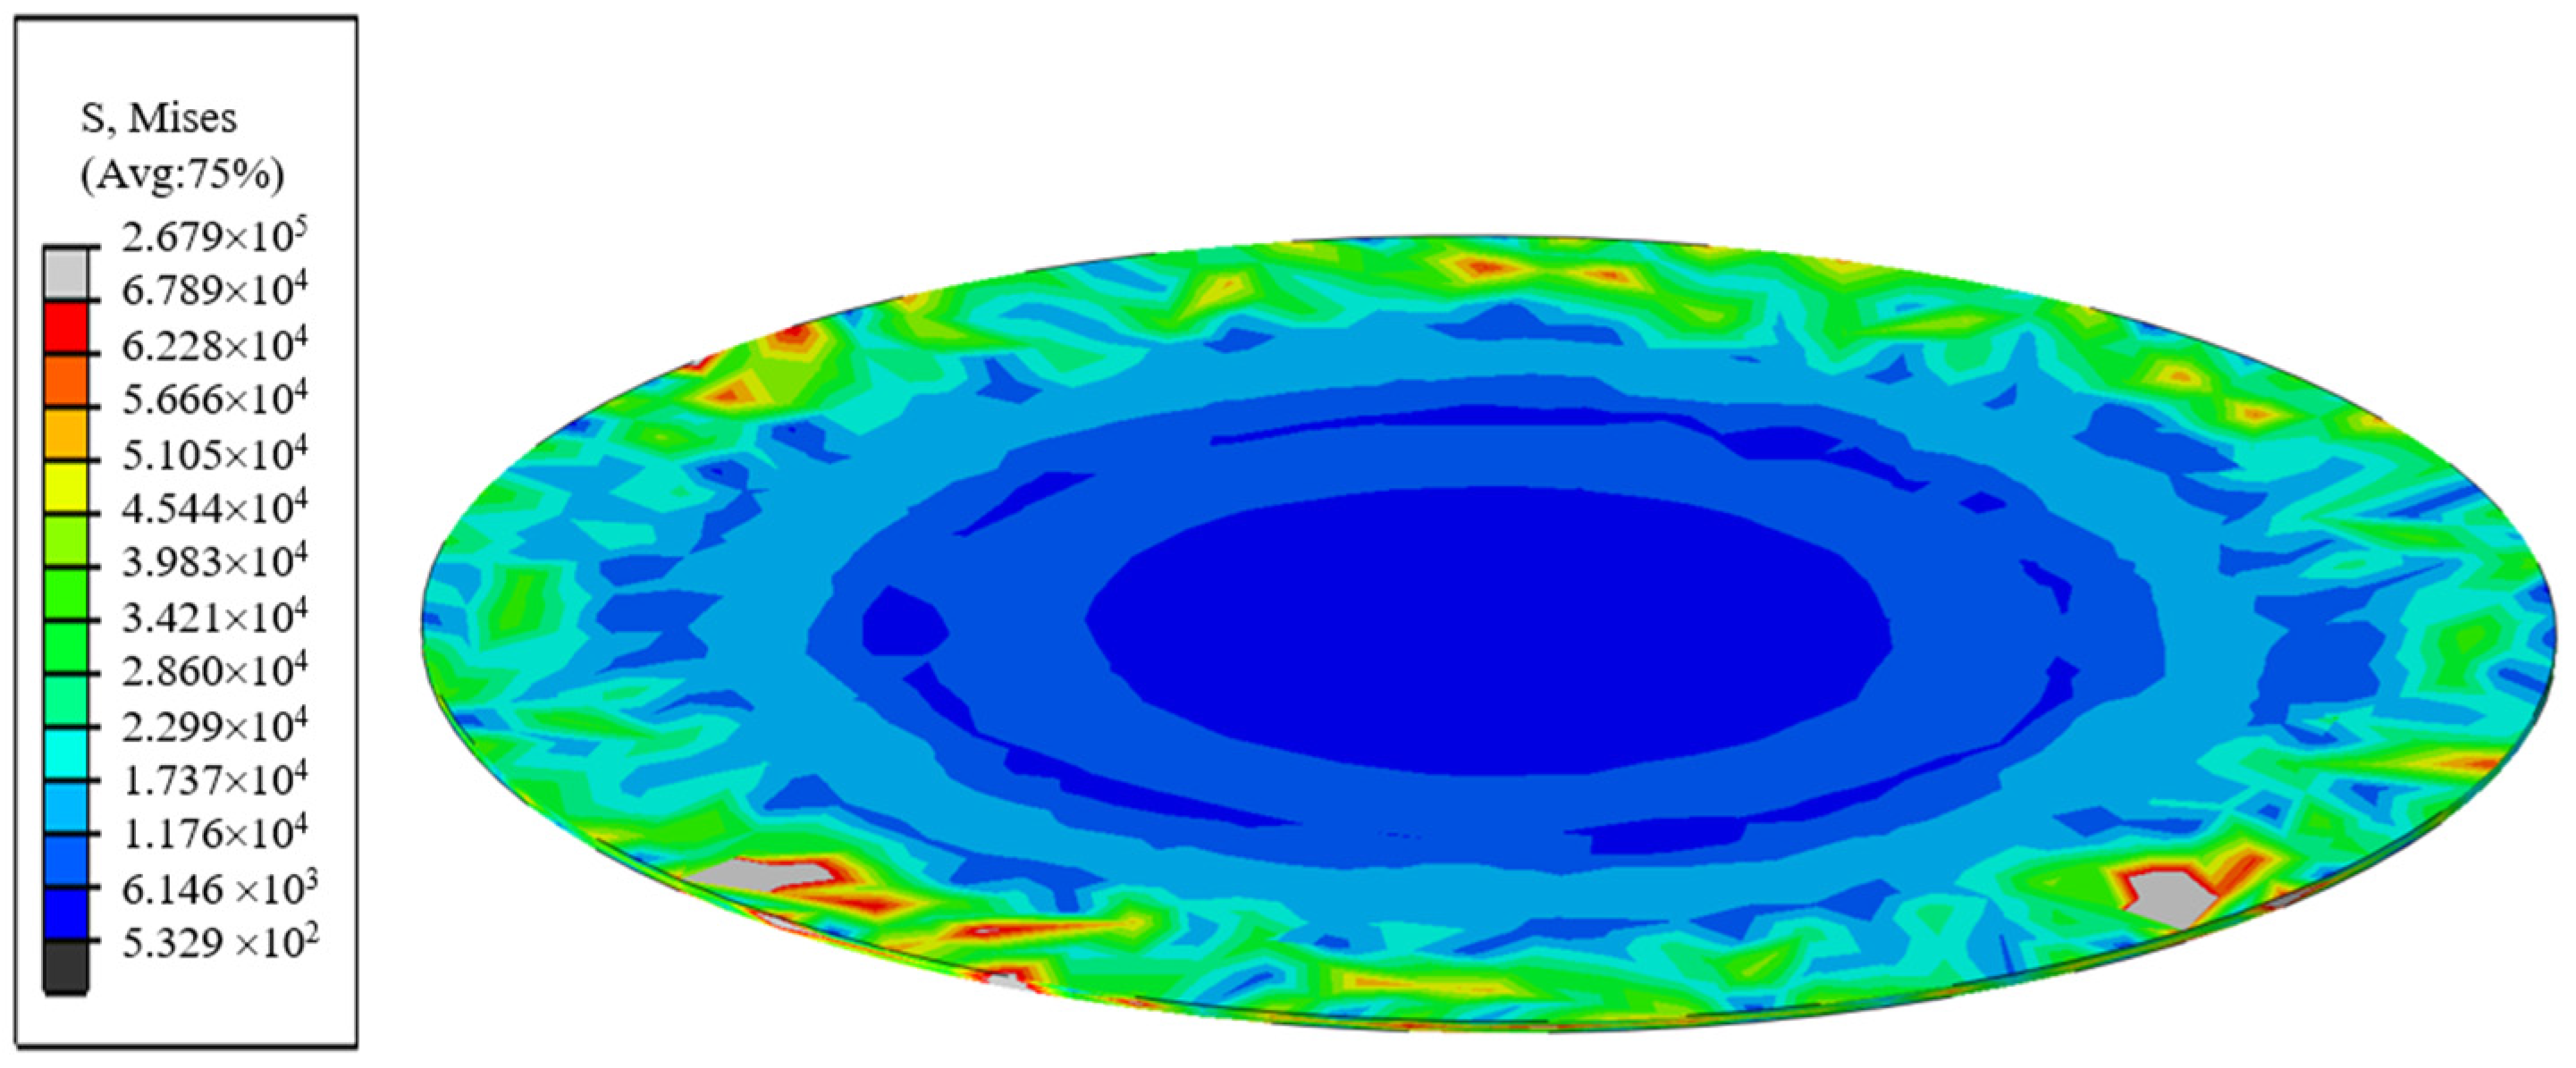
The axial compressive stress nephogram on the pressboard is shown in Figure 9. From this figure, the distribution of the axial compressive stress on the pressboard is of central symmetry, and its value depends on the positions. Moreover, the compressive stress of the central area of the pressboard is lower than the marginal area. That is because the central area of the pressboard is fastened between two copper electrode plates, limiting the strain of the central area of the pressboard, while the marginal area of the pressboard deforms easily without any restriction.
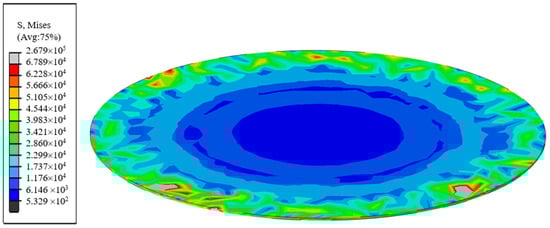
Figure 9.
Axial compressive stress nephogram on the pressboard of group TEM11 at the moment of 1.05 s.
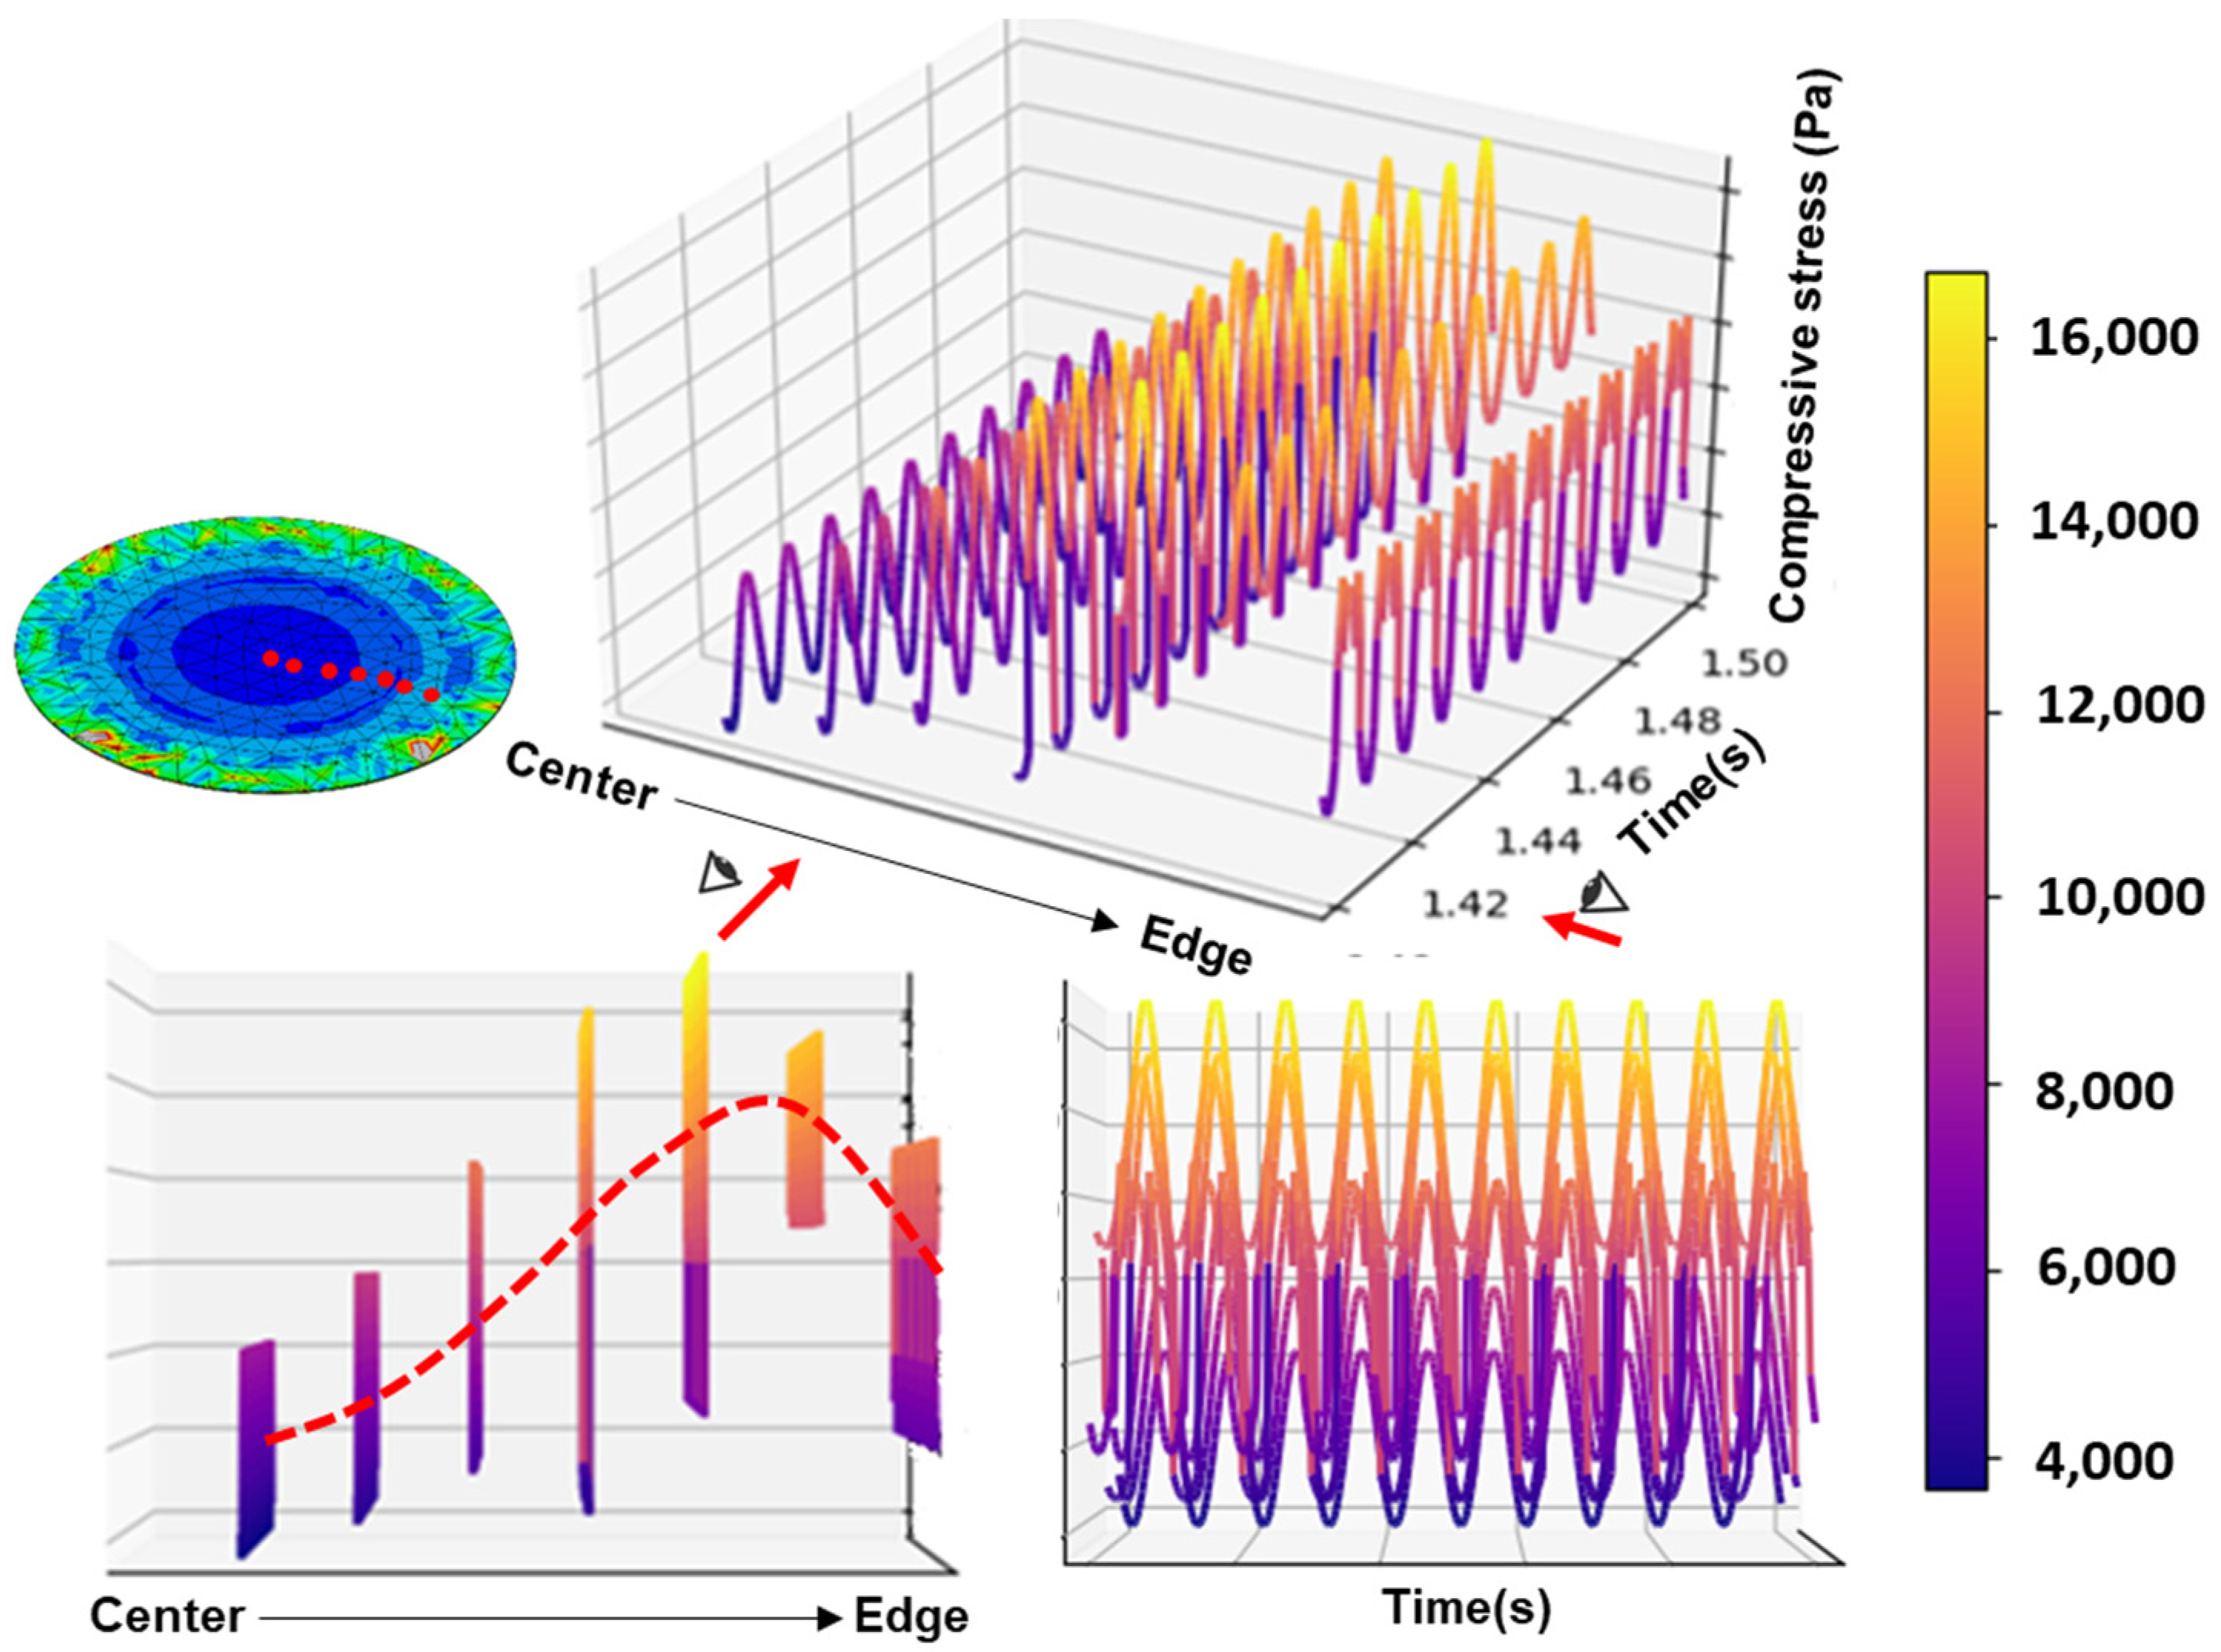
The time domain stress signals of a series of nodes along the radial direction, from the center to the edge of the pressboard in phase 3, are shown in Figure 10. Generally, the compressive stress firstly increases and then decays along the radial direction from the center to the edge. The maximum compressive stress value is three times higher than the minimum one. Since the pressboard is a kind of elastomer, the different distributions of compressive stress on the pressboard are mainly due to the different distributions of deformation of the pressboard. Moreover, the maximum compressive stress (over 1.4 × 10⁴ Pa) is located on the sixth node of the pressboard from the center, which is regarded as the stress concentration area. Since the weak spot of a structure is located on the stress concentration area, the following investigations focus on the compressive stress on the stress concentration area. Combined with the above findings, the compressive stress signal in phase 3 on the mechanical stress concentration node of the pressboard is the research focus.

Figure 10.
Axial compressive stress signals of a series of nodes along the radial direction from the center to the edge of the pressboard of group TEM11 in the time range of 1.4 to 1.5 s.
4.2.3. Compressive Stress under Different Vibration Conditions
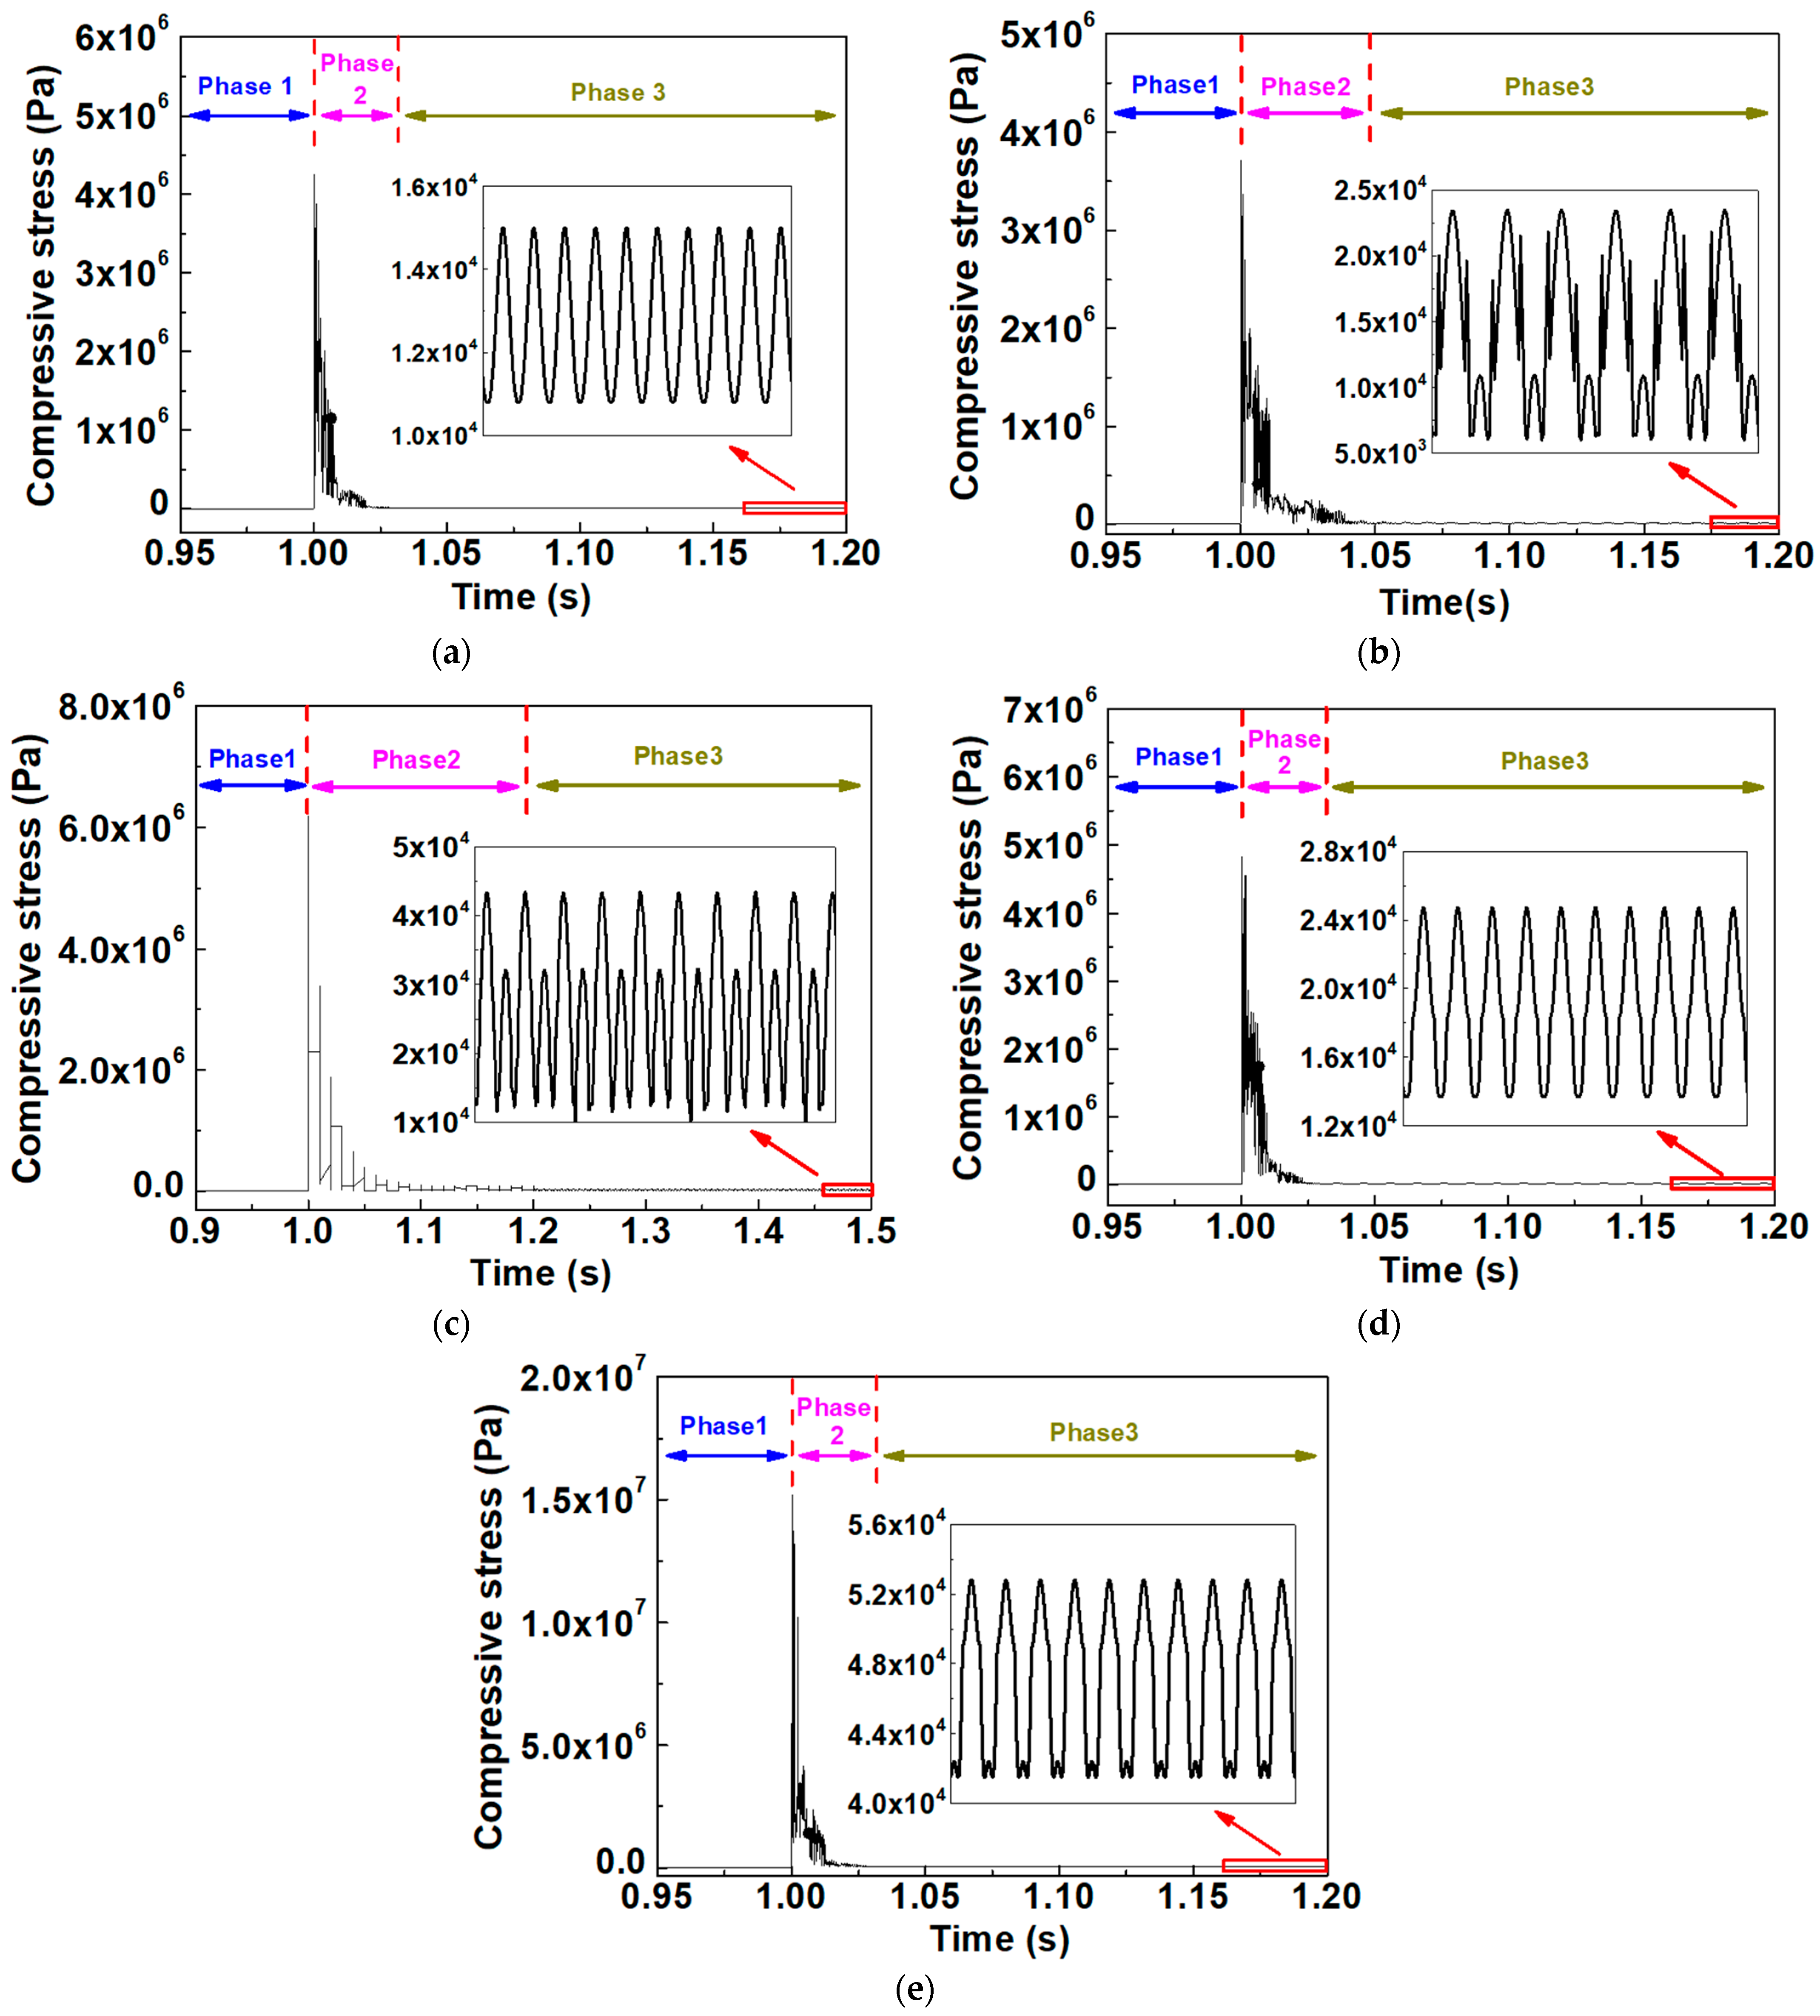
In a multi-stress aging experiment, the vibration frequency varies from 100 to 300 Hz, while the vibration amplitude varies from 10 to 50 μm. The stress signal in phase 3 on the stress concentration node of the pressboard under three typical vibration conditions are shown in Figure 11a–e, respectively. Moreover, four related time domain characteristic parameters (tbal, Sext, Smean, Sp-p) of axial compressive stress on the pressboard under different vibration conditions are listed in Table 4. From Figure 11a–e and Table 4, it is clear that the time domain characteristics of compressive stress change with the vibration conditions. The effects of different vibration conditions on the time domain characteristics of compressive stress are investigated in detail below.
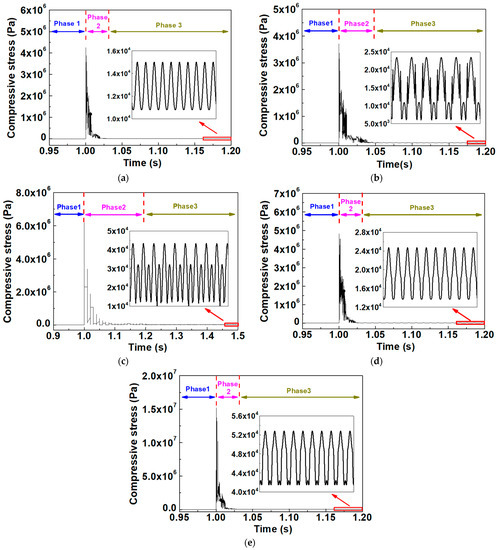
Figure 11.
Axial compressive stress signals on the stress concentration node of the pressboard in phase 3 under different vibration conditions (a) TEM11, (b) TEM21, (c) TEM31, (d) TEM13, (e) TEM15.
Table 4.
Time domain characteristic parameters of axial compressive stress on the stress concentration node of the pressboard under different vibration conditions.
4.3. Frequency Domain Analysis of Stress on the Pressboard under Vibration
The axial compressive stress signal in phase 3 on the pressboard, shown in Figure 11, reveals that the stress signal does not refer to the pure sine wave. Instead, it contains different frequency components. Therefore, a spectrum analysis is badly needed to obtain a clearer picture of the frequency domain properties of axial compressive stress. The stress spectrum of stress can be obtained through the Fourier transform, as shown in Equation (1) [23,24].
where X(ω) represents the stress spectrum, x(t) represents the stress signal. The spectra of axial compressive stress signals on the pressboard under different vibration conditions are shown in Figure 12. According to this figure, the axial compressive stress on the pressboard basically belongs to a wide-band process, which is mainly composed of 0 Hz, fundamental frequency (external vibration loading frequency) and its second–fifth harmonic components. Moreover, the stress spectra depend on the vibration frequencies and amplitudes.
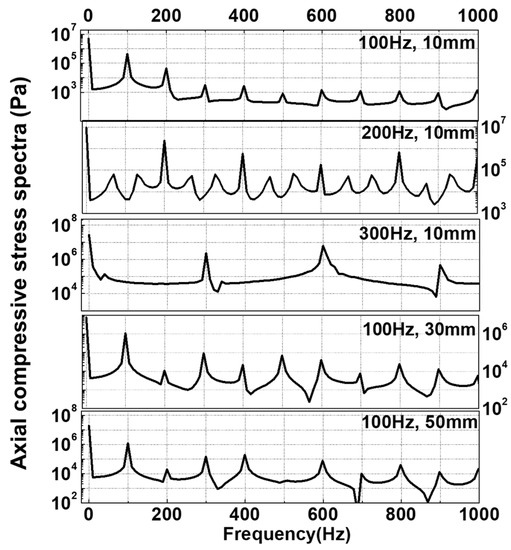
Figure 12.
Spectra of axial compressive stress signals on the stress concentration node of the pressboard in phase 3 under different vibration conditions.
The power spectral density (PSD) of stress describes the distribution of power into frequency components composing the stress signal. According to the Wiener–Khinchin theorem, the PSD function (Gx(ω)) is defined by (2)–(4) [24,25].
where Sx(ω) is the two-sided spectral density function as shown in (3), which is the Fourier transform of the autocorrelation function Rx(τ) of the stress signal shown in (5), E[ ] is the expected value operator.
The PSD of axial compressive stress on the pressboard under different vibration conditions are shown in Figure 13. According to the PSD, several characteristic parameters of stress can be extracted to feature the frequency domain properties of the stress signal. The PSD spectral moments mi have the general form in (6) [26]. In particular, the moment of zero order (m0) graphically represents the area under PSD function.
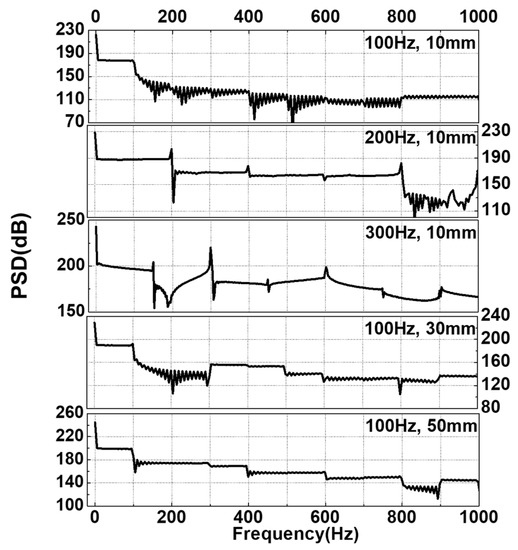
Figure 13.
PSD of the axial compressive stress signal on the stress concentration node of the pressboard in phase 3 under different vibration conditions.
The expected peak occurrence frequency vp and the expected positive zero-crossing frequency v0 are defined in, respectively,
The spectral width of the process is estimated using the bandwidth parameter α2, which is defined as
It takes values from 0 to 1. For a narrow-band process, α2 tends to 1, and for a wide-band process, it approaches 0. After calculation, the above frequency domain characteristic parameters are listed in Table 5. The effects of the different vibration conditions on the frequency domain characteristics’ compressive stress are discussed in the following section.
Table 5.
Frequency domain characteristic parameters of axial compressive stress on the stress concentration node of the pressboard under different vibration conditions.
4.4. Effect of Vibration Frequencies and Amplitudes on the Time–Frequency Characteristics of Compressive Stress
From Figure 11, Figure 12 and Figure 13, it is clear that the increase of either vibration frequency or amplitude enhances the compressive stress, but its influencing mechanism reflects in different ways.
4.4.1. Vibration Frequency
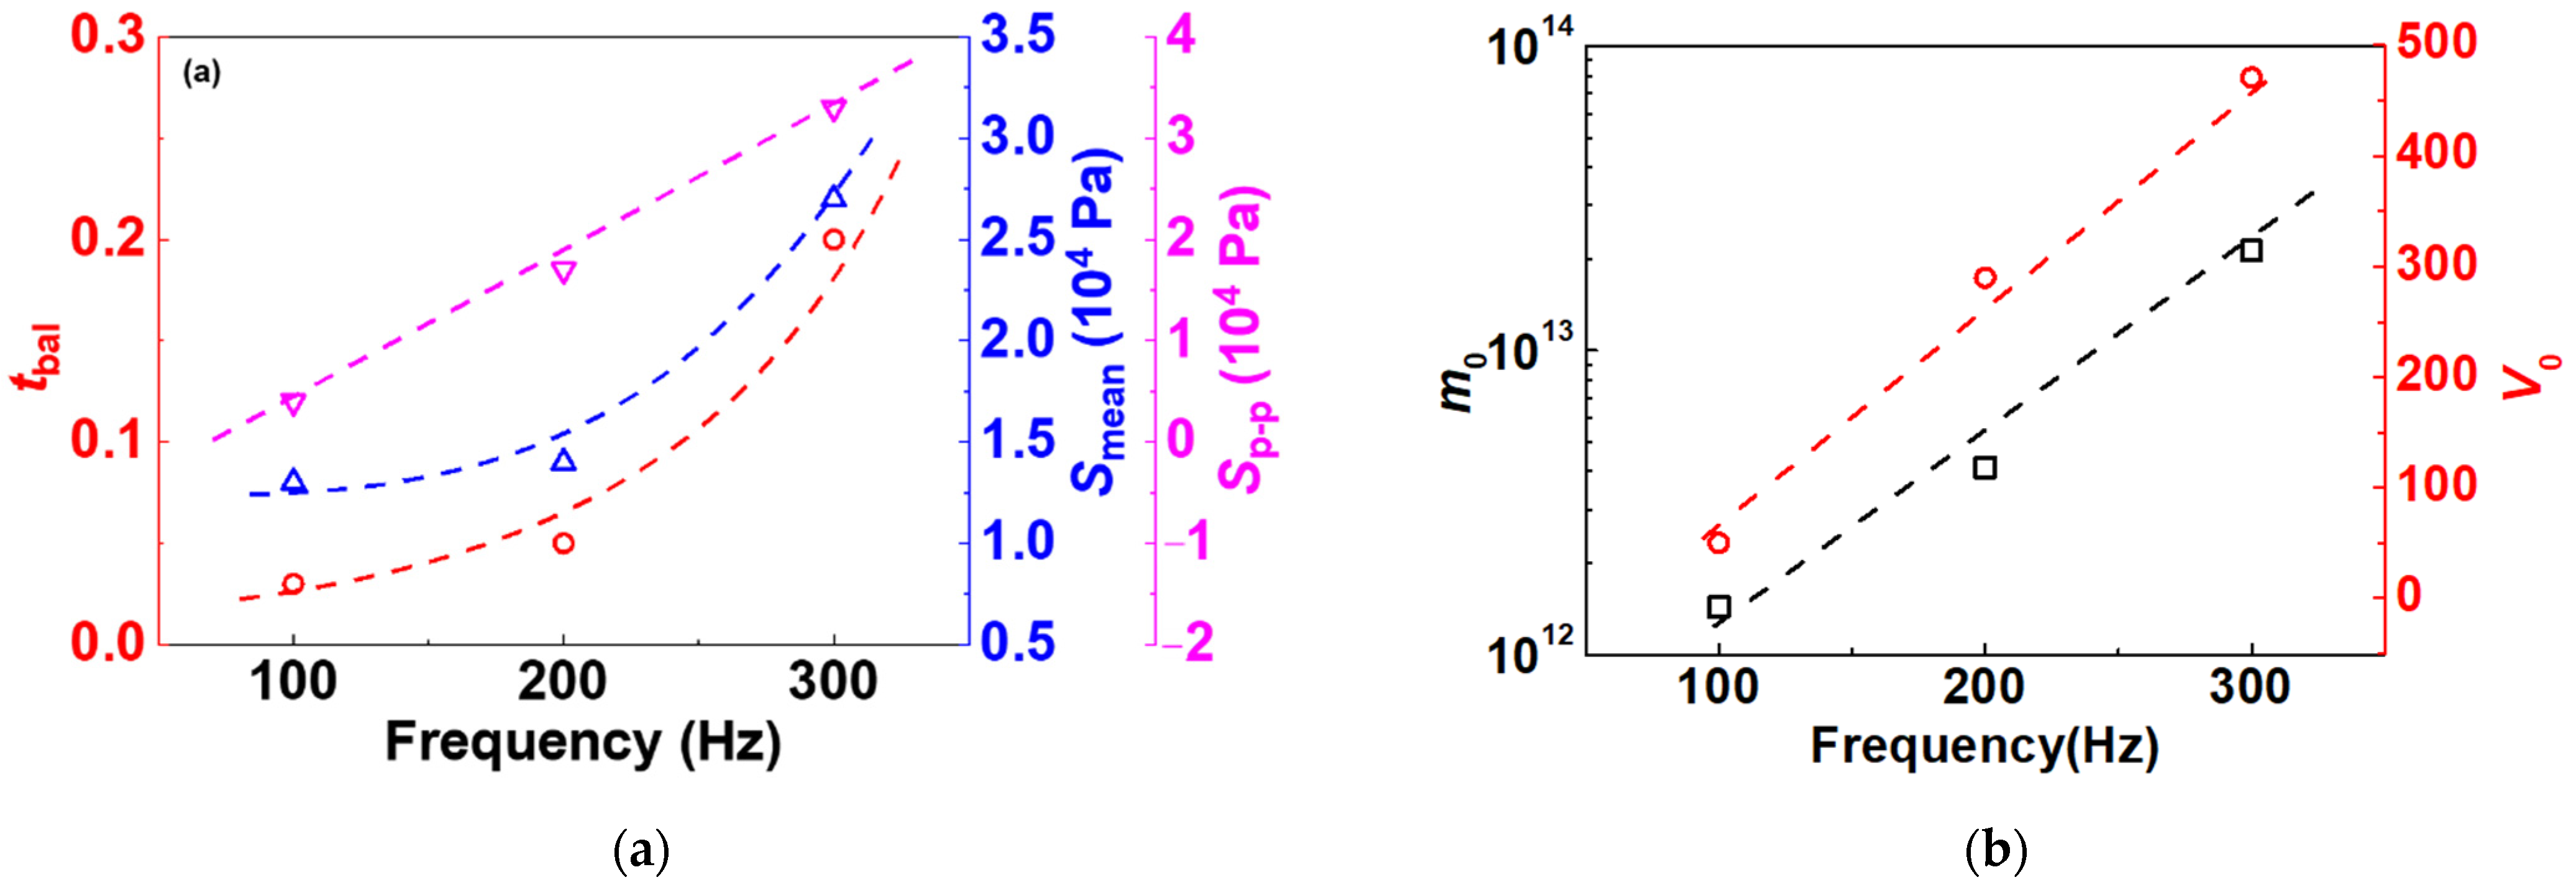
The changes of time and frequency domain characteristic parameters of axial compressive stress on the pressboard under different vibration frequencies are shown in Figure 14a,b, respectively. From axial compressive stress signals of groups (TEM11, TEM31) in Figure 12a,b, the increase of vibration frequency apparently produces higher volatility on the stress signal. Therefore, it has a longer balance time (tbal) in phase 2 and causes higher peak-to-peak stress Sp-p in phase 3, as shown in Figure 14a. Moreover, the Smean in phase 3 is increased along with the vibration frequency. As for the stress spectra shown in Figure 12, the increase in vibration frequency leads to more high-frequency components and enhances their amplitudes, which is the main reason for the higher volatility in the stress signal. The increasing m0 value along with the vibration frequency refers to the increasing variance of the stress signal.

Figure 14.
Changes of (a) time and (b) frequency domain characteristic parameters of axial compressive stress on the pressboard under different vibration frequencies.
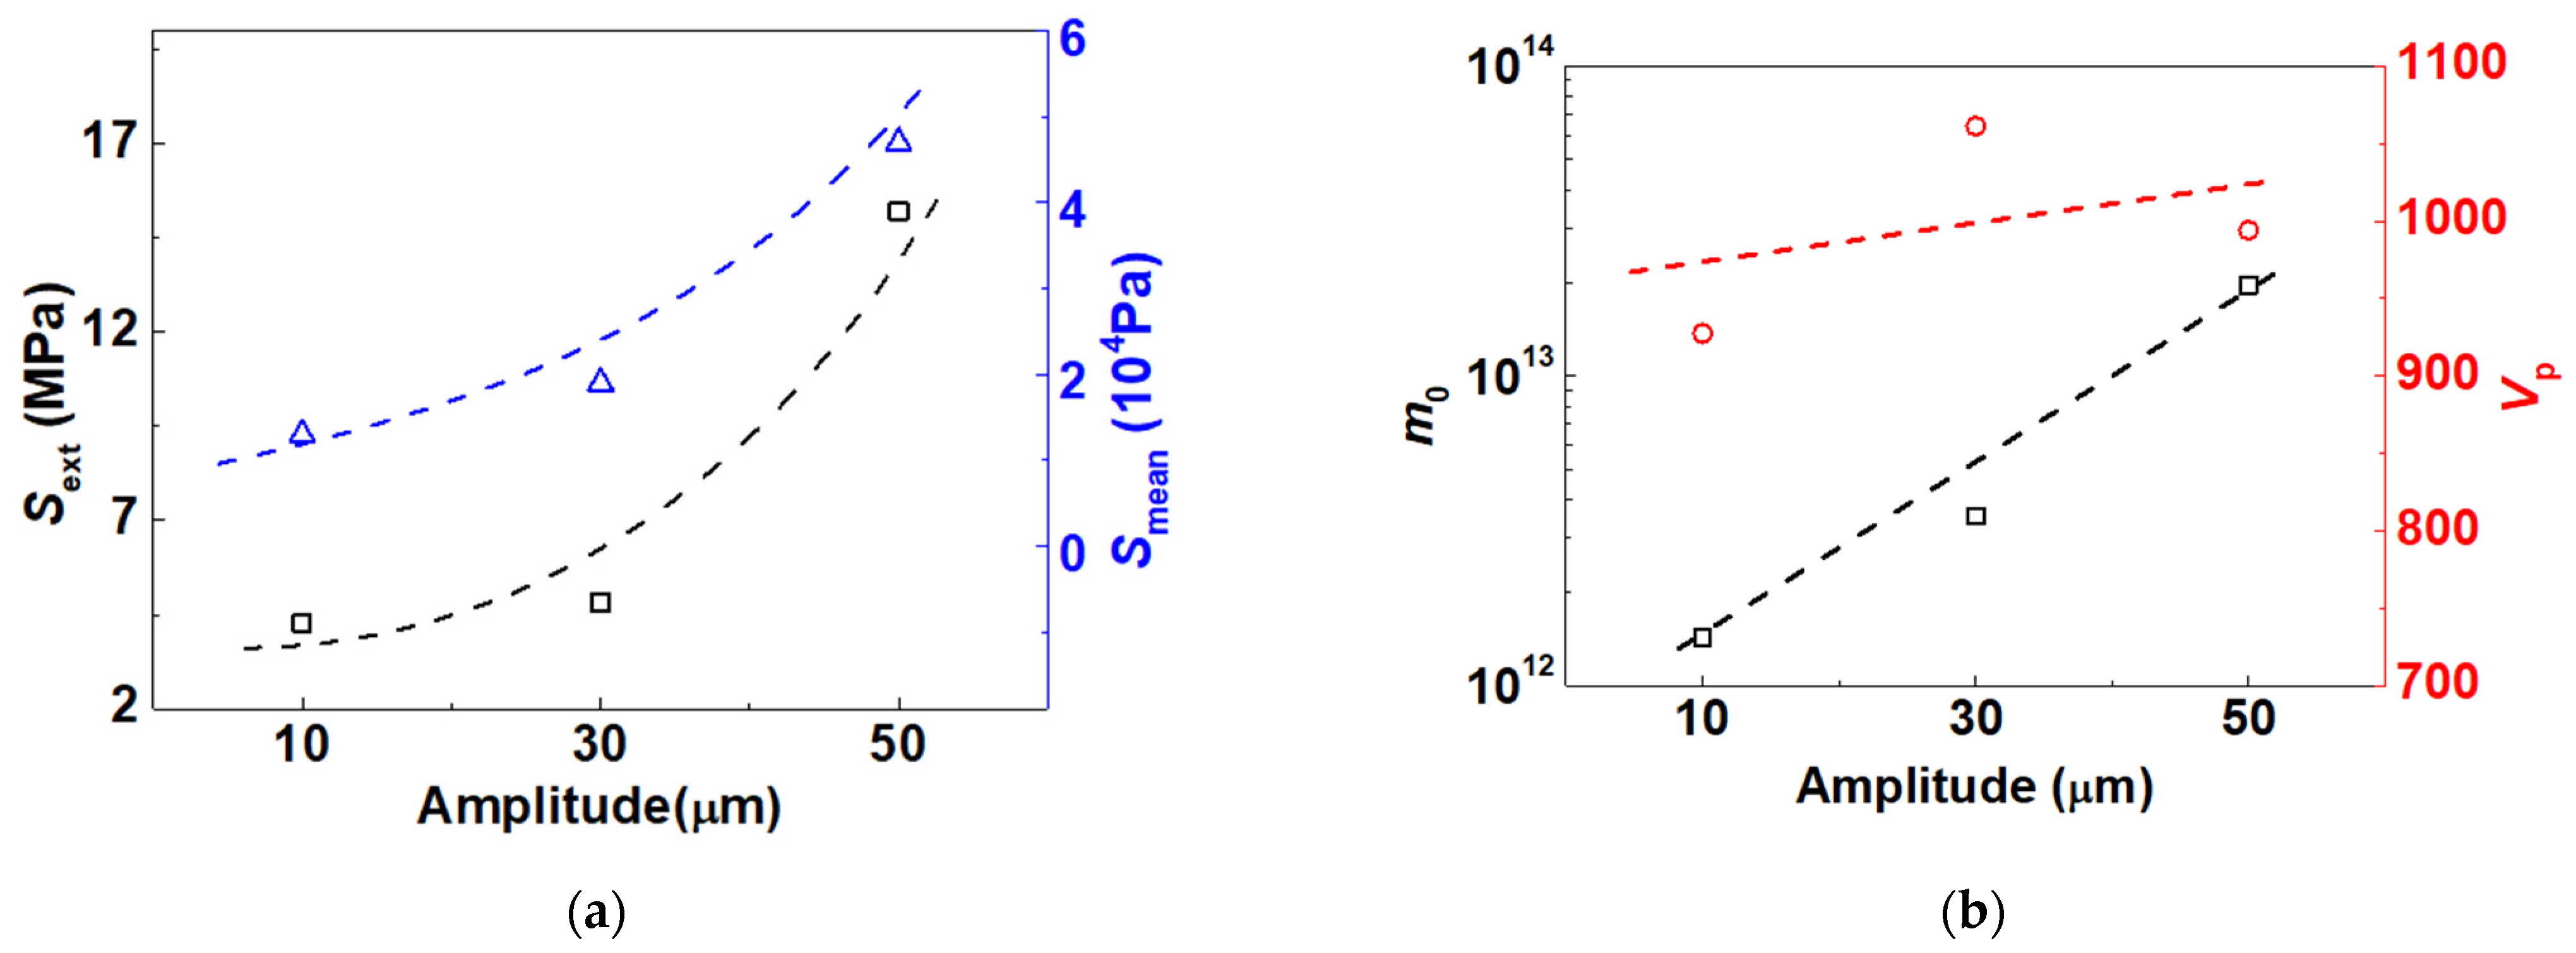
4.4.2. Vibration Amplitude
The changes of the time and frequency domain characteristic parameters of axial compressive stress on the pressboard under different vibration amplitudes are shown in Figure 15a,b, respectively. From Figure 15a, the increase in vibration amplitude directly enhances the compressive stress on the pressboard, including Sext in phase 2 and Smean in phase 3. As for the stress spectrum in Figure 12, the increase in vibration amplitude enhances the 0 Hz component and reduces the other high-frequency components, causing lower volatility in the stress signal.
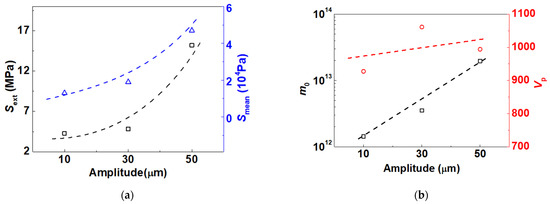
Figure 15.
Changes of (a) time and (b) frequency domain characteristic parameters of axial compressive stress on the pressboard under different vibration amplitudes.
4.5. Compressive Stress on Insulation Spacer in 110 kV Transformer under Long-Term Vibration
The axial compressive stresses on the insulation spacers are calculated under steady-state operating conditions (rated current) and short-circuit fault (six times of the rated current) in a real transformer (SZ-50000/110) by a professional transformer leakage flux program FLD12. The SZ-50000/110 transformer is a type of 110-kV/50000-kVA power transformer manufactured by Qianjiang Electric Group Co., Ltd., which has 46 segments in a low voltage winding and 52 segments in a high voltage winding. The distribution of axial compressive stress on the insulation spacers under steady-state operating conditions is shown in Figure 16. Moreover, the maximum and mean compressive stresses on spacers among all segments in low and high voltage windings under steady-state operating conditions and short-circuit faults are shown in Table 6, respectively. From Figure 16, it is clear that the high compressive stresses on spacers are mainly located on both ends of low-voltage and high-voltage windings. The highest compressive stress is located on the insulation spacer of the 46th segment in a low-voltage winding. From Table 6, the compressive stress under the short-circuit fault is proportional to the square of the current compared with that under the steady-state condition. Moreover, in short-circuit fault, the insulation spacer of the 46th segment in a low voltage winding suffers from an extreme axial compressive stress, which reaches 2.48 MPa. Despite this, this extreme axial compressive stress value is far below the GB 1094.5 allowable maximum stress limitation (80 MPa). As for the steady-state, it is clear that the maximum compressive stress is about 6.9 × 10⁴ Pa, which is close to the value range of Smean in phase 3 shown in Table 4. It means that the compressive stress on the pressboard in this multi-stress aging experiment coincides with the axial compressive stress on the insulation spacers in the real transformer, which demonstrates the engineering significance of the OIP multi-stress aging experimental setup.
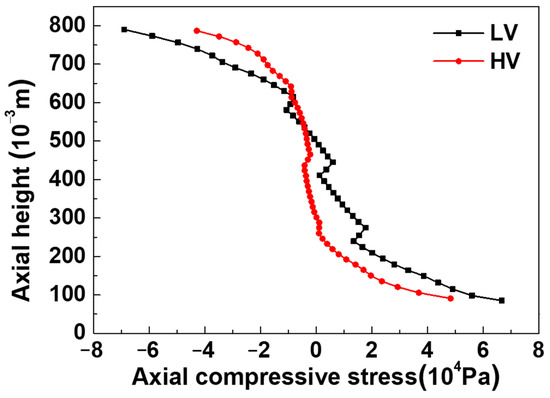
Figure 16.
Distribution of axial compressive stress on the insulation spacers under steady-state operating conditions.
Table 6.
Axial compressive stress on the insulation spacers in the SZ-50000/110 transformer.
5. Effects of Long-Term Vibration on Cellulose Degradation
Our previous research [19] has revealed the characteristics and kinetics of cellulose degradation of the pressboard under simultaneous thermal–electrical–mechanical stress. In this section, correlation analysis is performed between the time–frequency domain characteristic parameters of compressive stress and the kinetics of cellulose degradation in order to analyze the effects of compressive stress on cellulose degradation of the pressboard under multi-stress aging.
5.1. Characteristics and Kinetics of Cellulose Degradation under Multi-Stress Aging
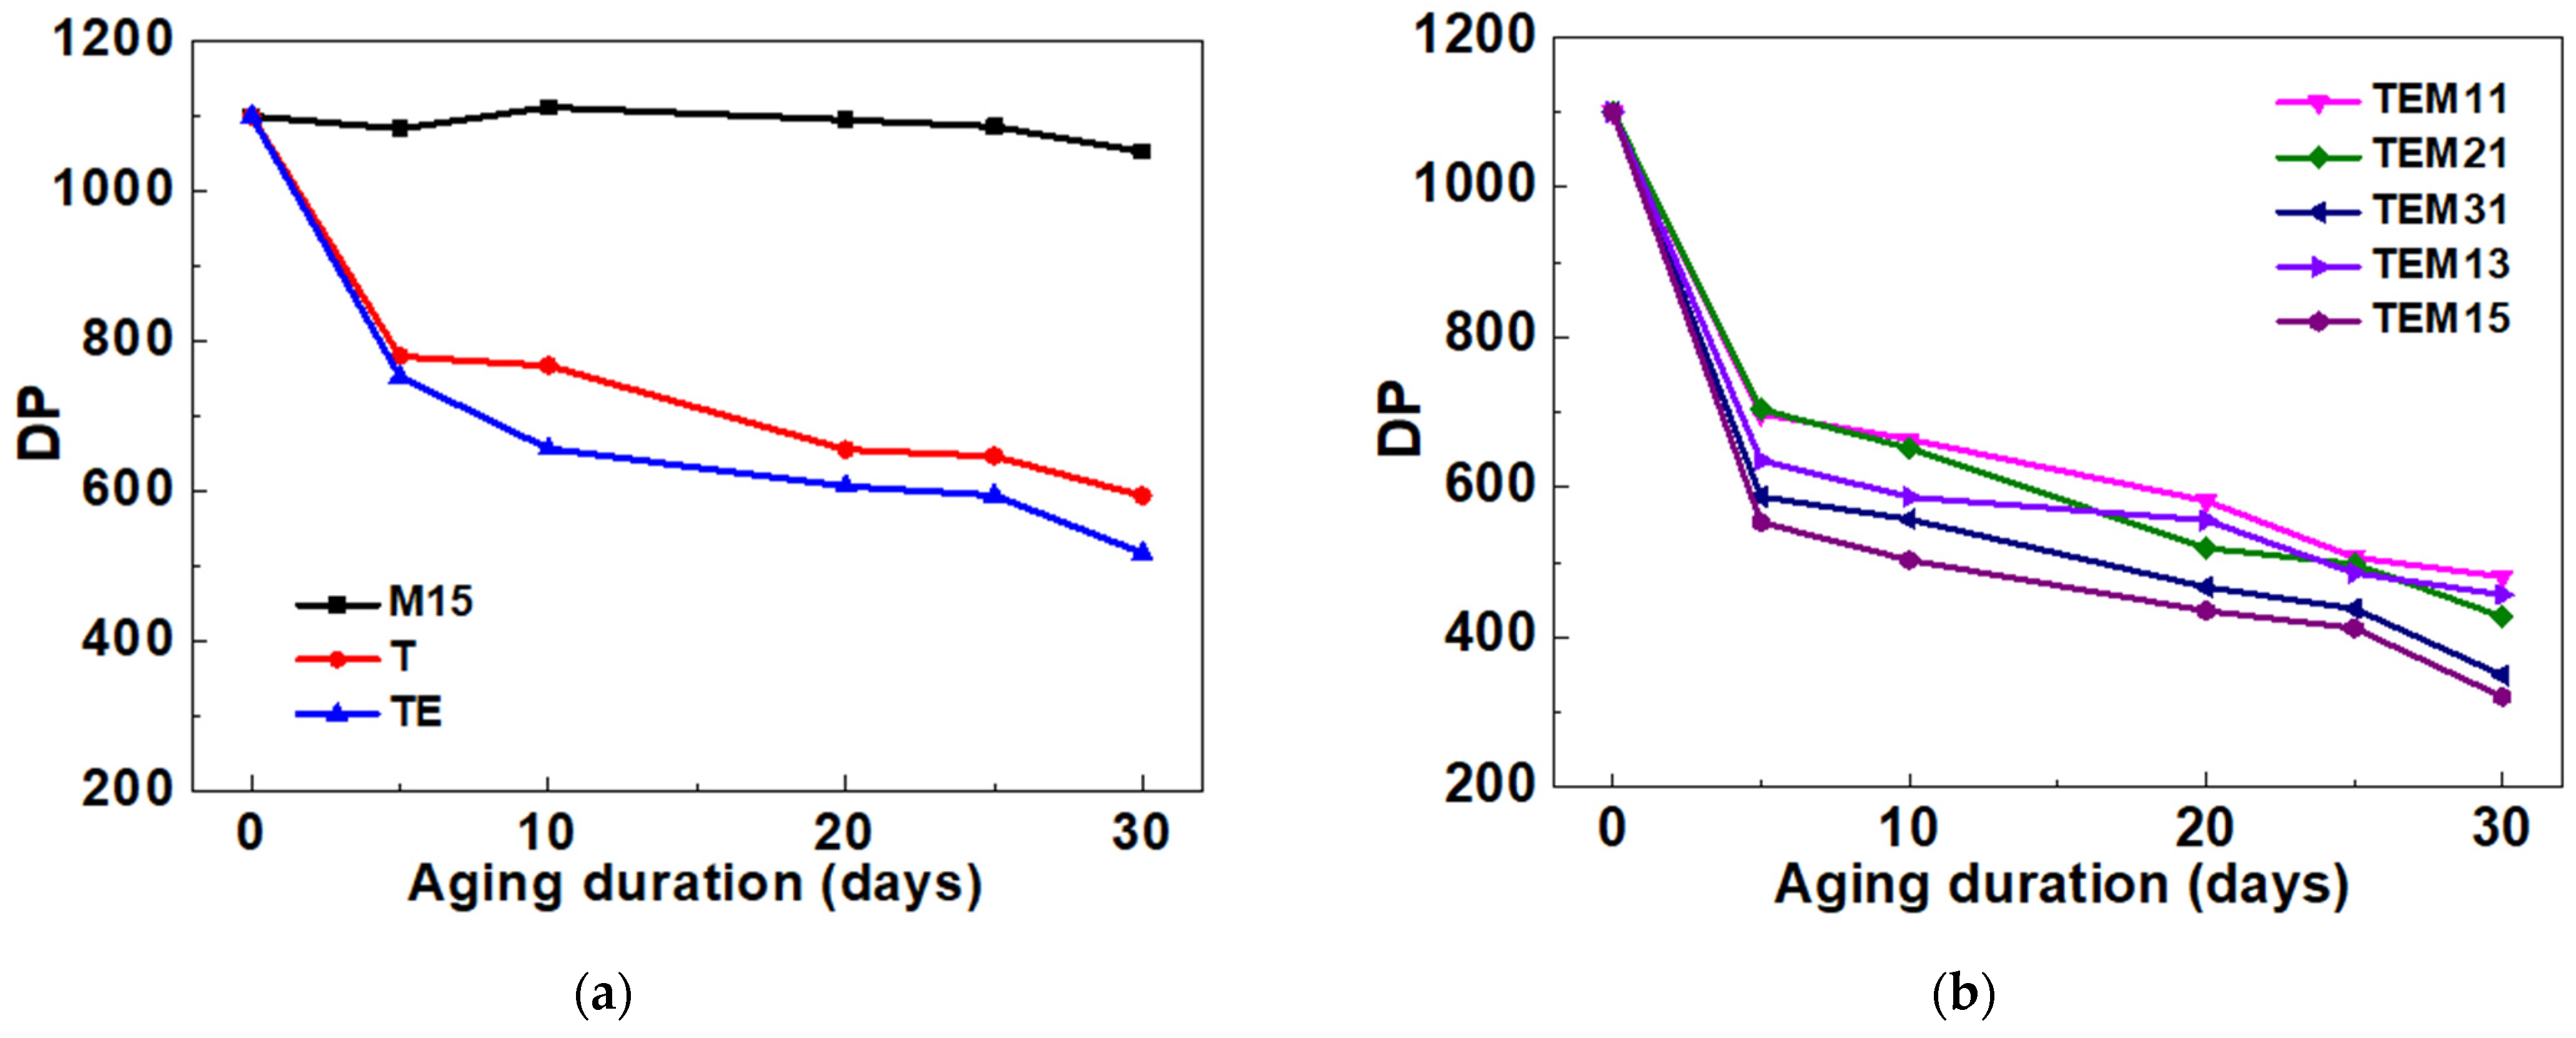
In our previous research [19], the aging characteristics of OIP were measured, including the degree of polymerization (DP), furfural, moisture in oil, etc. Among these aging characteristics, DP is widely considered as the primary aging indicator of an OIP. Figure 17a,b, shows the DP of the pressboard under different aging conditions, respectively. Figure 17a admits a continuous decrease of DP for all groups except group M15, indicating that the OIP hardly degrades under only vibration at room temperature. It demonstrates the conclusion proposed in 4.2 that the compressive stress on the pressboard during aging experiments cannot directly crush the pressboard under vibration. From Figure 17b, it is clear that the OIP degrades more quickly under thermal–electrical–mechanical stress than that under thermal stress and thermal-electrical stress. Moreover, the increase in either vibration amplitudes or frequencies can accelerate the cellulose degradation in OIP.
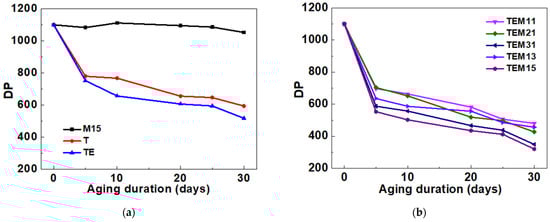
Figure 17.
DP of the pressboard of (a) control groups and (b) experimental groups.
In order to explain the aging reaction that occurs during multi-stress aging experiments, our previous research [19] proposed the kinetics of cellulose degradation based on DP, as shown in Equation (9). This equation means that the cellulose degradation in OIP under a multi-stress aging experiment can be divided into two phases: the weak links phase and the amorphous phase.
where DPt represents the DP of cellulose at the moment of t, 1/D–t − 1/DP0 represents the scission fraction of the cellulose unit, nt represents the number of bond scissions in cellulose molecule at the moment of t, n0 represents the initial number of links available for degradation, k represents the reaction rate constant, w, a refer to weak and amorphous links, respectively.
After fitting Equation (8) with the DP results in Figure 17, the four parameters (nw0, na0, kw, ka) as well as the goodness-of-fitting (R2) for different groups are shown in Table 7. The goodness-of-fittings (R2) for all groups are over 0.95, which means that the proposed kinetics of cellulose degradation is able to reflect the aging reaction of cellulose in OIP under simultaneous multi-stress aging.
Table 7.
Kinetics of cellulose degradation parameters in OIP under simultaneous multi-stress aging [19].
5.2. Correlation Analysis between Long-Term Vibration and Kinetics of Cellulose Degradation
This section advances this investigation by correlating time–frequency parameters (Sext, Smean and Sp-p, m0, m1, m2, m4, v0, vp) of compressive stress on the pressboard with the kinetics of cellulose degradation parameters (nw0, na0, kw, ka). The correlation coefficient (CC) shown in Equation (10) is widely used to estimate the linear correlation between these parameters. CC takes values from −1 to 1. For high correlation, |CC| approaches 1.
where pk represents one parameter in kinetics of cellulose degradation, ps represents one characteristic parameter of axial compressive stress, Cov(pk,ps) represents the covariance between pk and ps, Var(pk) represents the variance of pk.
The correlation coefficients of each parameter of kinetics of cellulose degradation are shown in Figure 18a–d, respectively. From these figures, it is clear that nw0 and na0 is closely correlated with Smean, while kw and ka are closely correlated with Sp-p, v0 and vp. This result clearly explains the effects of the long-term vibration on cellulose degradation in two ways. On the one hand, the increase in long-term compressive stress on the pressboard, represented by Smean in this research, generates more weak or amorphous links available for degradation in the pressboard. In the transformer, the overloading operation condition or short-circuit fault increases the current in the winding, laying higher compressive stress on the OIP, finally leading to the serious cellulose degradation. On the other hand, the increase in vibration frequency, represented by v0 and vp in this research, accelerates the reaction rate in cellulose degradation. From this perspective, higher frequency harmonic currents, especially in the converter transformer, play key roles for more reported failures than the distribution transformer.
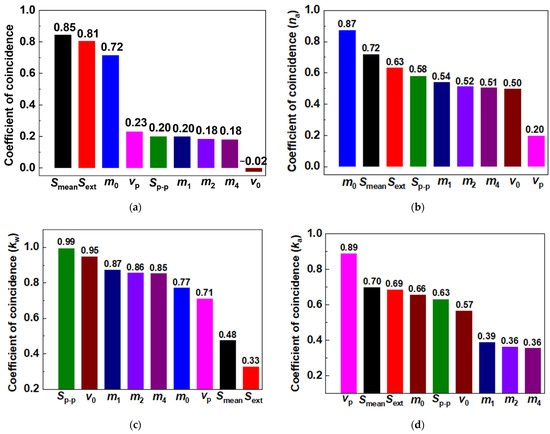
Figure 18.
Correlation coefficients between the parameters in kinetics of cellulose degradation (nw0, na0, kw, ka) and the characteristic parameters of axial compressive stress on the pressboard (Sext, Smean, Sp-p, m0, m1, m2, m4, v0, vp).
Compared with other research [14], this research clearly describes the two aging reaction phases—the weak link phase and amorphous phase. Moreover, this research decouples the aging effect of vibration frequencies and amplitudes, respectively. This helps to investigate and analyze the aging properties of the OIP in a converter transformer and avoid more potential faults and possible failures.
6. Conclusions
This paper analyzes the effects of long-term mechanical vibration on cellulose degradation in an OIP under simultaneous multi-stress aging. The OIP multi-stress aging experiments were firstly conducted at 130 °C, at a DC electric voltage of +6 kV, vibration amplitude of 10–50 μm, and vibration frequency of 100–300 Hz. Moreover, the FEM analysis of axial compressive stress on the aged pressboard was performed to obtain the time–frequency domain characteristic parameters. Combined with the kinetics of cellulose degradation proposed in our previous research, the aging effects of the vibration frequencies and amplitudes were decoupled and analyzed, respectively, with the help of the correlation coefficient.
- (a).
- Based on the FEM analysis results, this paper mainly focuses on long-term axial compressive stress on the stress concentration node of the pressboard rather than the temporary impact. The increase of the vibration frequency produces more high-frequency components in the stress signal, leading to more volatility in the time domain stress signal. The increase of vibration amplitude enhances the 0 Hz component, causing higher compressive stress on the pressboard in phase 3.
- (b).
- The compressive stress on the pressboard in the multi-stress aging experiment measures 1.3–4.7 × 10⁴ Pa, which coincides with the axial compressive stress (1.17–6.90 × 10⁴ Pa) on the insulation spacers in the SZ-50000/110 transformer. It means that the OIP multi-stress aging experiment is sufficiently capable of simulating the long-term working conditions of the pressboard in a real transformer.
- (c).
- The vibration on the OIP accelerates the cellulose degradation during the multi-stress aging experiments. The aging effect of long-term vibration is reflected in two aspects. On the one hand, the increase in compressive stress on the pressboard generates more links available for degradation. On the other hand, more high frequency harmonic components accelerate the reaction rate in cellulose degradation. Moreover, the cellulose does not age only under long-term vibrations at room temperature.
Author Contributions
Conceptualization, S.L. (Shijun Li), L.Y. and S.L. (Shengtao Li); methodology, S.L. (Shijun Li); software, S.L. (Shijun Li); validation, S.L. (Shijun Li); formal analysis, S.L. (Shijun Li); investigation, S.L. (Shijun Li); resources, S.L. (Shengtao Li); data curation, S.L. (Shijun Li); writing—original draft preparation, S.L. (Shijun Li); writing—review and editing, L.Y. and S.L. (Shengtao Li); visualization, S.L. (Shijun Li); supervision, S.L. (Shengtao Li); project administration, S.L. (Shengtao Li); funding acquisition, S.L. (Shengtao Li). All authors have read and agreed to the published version of the manuscript.
Funding
Not applicable.
Institutional Review Board Statement
Not applicable.
Informed Consent Statement
Not applicable.
Data Availability Statement
Not applicable.
Acknowledgments
This work was supported by the National Natural Science Foundation of China (5183000486) and the National Key Research and Development Program of China (2017YFB0902705). We greatly appreciate the assistance provided by Jun Liu from Qianjiang Electric Group Co., Ltd.
Conflicts of Interest
The authors declare no conflict of interest.
References
- Li, S.; Yang, L.; Li, S.; Zhu, Y.; Cui, H.; Yan, W. Effect of AC-voltage harmonics on oil impregnated paper in transformer bushings. IEEE Trans. Dielectr. Electr. Insul. 2020, 27, 26–32. [Google Scholar] [CrossRef]
- Verma, P.; Chauhan, D.S.; Singh, P. Effects on tensile strength of transformer insulation paper under accelerated thermal and electrical stress. In Proceedings of the 2007 Annual Report-Conference on Electrical Insulation and Dielectric Phenomena, Vancouver, BC, Canada, 14–17 October 2007; pp. 619–622. [Google Scholar]
- Li, S.; Ge, Z.; Abu-Siada, A.; Yang, L.; Li, S.; Wakimoto, K. A New Technique to Estimate the Degree of Polymerization of Insulation Paper Using Multiple Aging Parameters of Transformer Oil. IEEE Access 2019, 7, 157471–157479. [Google Scholar] [CrossRef]
- Nie, H.; Wei, X.; Wang, Y.; Chen, Q. A Study of Electrical Aging of the Turn-to-Turn Oil-Paper Insulation in Transformers with a Step-Stress Method. Energies 2018, 11, 3338. [Google Scholar] [CrossRef] [Green Version]
- Yang, L.; Sun, W.; Gao, S.; Hao, J. Thermal aging test for transformer oil–paper insulation under over-load condition temperature. IET Gener. Transm. Distrib. 2018, 12, 2846–2853. [Google Scholar] [CrossRef]
- Sun, L.; Fan, X.; Jiang, S.; Wang, B.; Liu, Y.; Gao, S.; Meng, L. Study on electrical aging characteristics of fiber sheath materials in power transformer oil. J. Electr. Eng. Technol. 2019, 14, 323–330. [Google Scholar] [CrossRef]
- Feng, D.; Hao, J.; Liao, R.; Chen, X.; Cheng, L.; Liu, M. Comparative study on the thermal-aging characteristics of cellulose insulation polymer immersed in new three-element mixed oil and mineral oil. Polymers 2019, 11, 1292. [Google Scholar] [CrossRef] [Green Version]
- Lundgaard, L.E.; Hansen, W.; Ingebrigtsen, S. Ageing of Mineral Oil Impregnated Cellulose by Acid Catalysis. IEEE Trans. Dielectr. Electr. Insul. 2008, 15, 540–546. [Google Scholar] [CrossRef]
- Wang, D.; Zhou, L.; Li, X.; Cui, Y.; Li, H.; Wang, A.; Liao, W. Effects of thermal aging on moisture equilibrium in oil-paper insulation. IEEE Trans. Dielectr. Electr. Insul. 2018, 25, 2340–2348. [Google Scholar] [CrossRef]
- Wang, Y.; Luo, Y.; Wang, Y.; Fei, R. Partial discharge damage mechanisms in laminated oil-paper insulation. Cellulose 2019, 26, 5707–5718. [Google Scholar] [CrossRef]
- Zhang, H.; Yang, B.; Xu, W.; Wang, S.; Wang, G.; Huangfu, Y.; Zhang, J. Dynamic deformation analysis of power transformer windings in short-circuit fault by FEM. Trans. Appl. Supercond. 2013, 24, 1–4. [Google Scholar] [CrossRef]
- Ahn, H.; Oh, Y.; Kim, J.; Song, J.S.; Hahn, S.C. Experimental verification and finite element analysis of short-circuit electromagnetic force for dry-type transformer. IEEE Trans. Magn. 2012, 48, 819–822. [Google Scholar] [CrossRef]
- IEC 60076-5; Power Transformers—Part 5: Ability to Withstand Short Circuit. IEC: Geneva, Switzerland, 2006.
- Ahn, H.; Lee, J.; Kim, J.; Oh, Y.H.; Jung, S.Y.; Hahn, S.C. Finite-element analysis of short-circuit electromagnetic force in power transformer. IEEE Trans. Ind. Appl. 2011, 47, 1267–1272. [Google Scholar]
- Shao, P.; Luo, L.; Li, Y.; Rehtanz, C. Electromagnetic Vibration Analysis of the Winding of a New HVDC Converter Transformer. IEEE Trans. Power Deliv. 2012, 27, 123–130. [Google Scholar] [CrossRef]
- Hashemnia, N.; Abu-Siada, A.; Islam, S. Improved power transformer winding fault detection using FRA diagnostics—Part 2: Radial deformation simulation. IEEE Trans. Dielectr. Electr. Insul. 2015, 22, 564–570. [Google Scholar] [CrossRef] [Green Version]
- Wang, J.; Liao, R.; Cheng, L.; Cheng, Z. Effects of Winding Vibration on the Mechanical-Thermal Aging Properties of Insulating Paper. IEEE Access 2020, 8, 67912–67920. [Google Scholar] [CrossRef]
- Uchiyama, N.; Saito, S.; Kashiwakura, M.; Takizawa, A.; Morooka, H.; Itoh, Y.; Hori, Y. Axial vibration analysis of transformer windings with hysteresis of stress-and-strain characteristic of insulating materials. In Proceedings of the 2000 Power Engineering Society Summer Meeting, Seattle, WA, USA, 16–20 July 2000; pp. 2428–2433. [Google Scholar]
- Li, S.; Li, S.; Yang, L.; Ge, Z.; Tan, B.; Mao, G.; Guo, Q. Characteristics and Kinetics of Cellulose Degradation in Oil Impregnated Pressboard under Simultaneous Thermal-Electrical-Mechanical Stress. IEEE Trans. Dielectr. Electr. Insul. 2021, 28, 1363–1371. [Google Scholar] [CrossRef]
- Liu, G. Research on Key Technology of ZZDFPZ-363400/500-400 Converter Transformer. Master’s Thesis, Shandong University, Jinan, China, 2016. [Google Scholar]
- Zheng, J.; Pan, J.; Huang, H. An experimental study of winding vibration of a single-phase power transformer using a laser Doppler vibrometer. Appl. Acoust. 2015, 87, 30–37. [Google Scholar] [CrossRef]
- Ji, S.; Zhang, F.; Qian, G. Characteristics and Influence Factors of Winding Axial Vibration of Power Transformer in Steady-state Operation Condition. High Volt. Eng. 2016, 42, 3178–3187. [Google Scholar]
- Braccesi, C.; Cianetti, F.; Tomassini, L. Random fatigue. A new frequency domain criterion for the damage evaluation of mechanical components. Int. J. Fatigue 2015, 70, 417–427. [Google Scholar] [CrossRef]
- Bishop, N.; Woodward, N. Fatigue Analysis of a Missile Shaker Table Mounting Bracket; RLD Limited: Manchester, UK; MSC Software: Frimley, UK, 2000. [Google Scholar]
- Lutes, L.D.; Larsen, C.E. Improved spectral method for variable amplitude fatigue prediction. J. Struct. Eng. 1990, 116, 1149–1164. [Google Scholar] [CrossRef]
- Tovo, R. Cycle distribution and fatigue damage under broad-band random loading. Int. J. Fatigue 2002, 24, 1137–1147. [Google Scholar] [CrossRef]


Publisher’s Note: MDPI stays neutral with regard to jurisdictional claims in published maps and institutional affiliations. |
© 2022 by the authors. Licensee MDPI, Basel, Switzerland. This article is an open access article distributed under the terms and conditions of the Creative Commons Attribution (CC BY) license (https://creativecommons.org/licenses/by/4.0/).