
Integration and Verification of PLUG-N-HARVEST ICT Platform for Intelligent Management of Buildings


 ,
,  , ,
, ,
Abstract
:1. Introduction
Related Work
2. System and User Requirements
- “Flexible integrated planning process”. All the building’s information and data of the façade system are usable and accessible within the Building Information Model (BIM) [23]. Therefore, the P-n-H overall system considers wireless metering and various communication protocols and actuating technologies [24] which enable seamless monitoring and acting to all diversified elements of the building automation network in a cost-effective manner while ensuring the system’s interoperability. Furthermore, all modules tailored for managing data coming from and forwarded to the respective connected devices have been designed and thoroughly tested.
- “Low-installation costs and almost-zero operational costs for controlling the Adaptive Dynamic Building Envelops (ADBEs)”. Within this context, P-n-H flexible ICT modules for safety, fault mitigation, control, and optimization have been designed and developed in response to this requirement. All modules stand on remote web servers and cloud servers to minimize the equipment and human effort costs for their local installation and maintenance. Considering that a robust and reliable Internet connection is available, the overall system requires minimum additional operational energy resources: energy consumption of the internet router (i.e., around 20W), energy consumption from wireless sensors (i.e., around max 5W each), and energy consumption of the network gateways (i.e., around 15W each).
- “Optimally control the different ADBE—and Conventional Controllable Building Elements (CCBE)”. In case there are CCBE elements, actions are coordinated towards an integrated manner, while achieving maximum possible energy use reduction and energy harvesting from RES and maintaining user satisfaction and safety of the overall operations. Therefore, the advances in P-n-H have been aligned with the integration of existing building automation elements to increase the degree of freedom of control, enabling a more holistic building management operation within P-n-H solutions. The first and most important issue that the P-n-H framework tries to tackle is the control of safety derived from fault-free data, as well as robust adaptive control designs. Furthermore, the optimization criterion as formulated within the Intelligent Management and Control System (IMCS) tool takes into account three main indices representing total energy consumption, total energy generation, user thermal comfort, and maximum available flexibility.
- “Easily implemented, low-cost, upgradable, and interoperable”. The system enables the easy and cost-effective incorporation of new ADBE technologies. Moreover, it is easily and inexpensively upgradable and interoperable to enable the easy and cost-effective incorporation of new ADBE technologies.
- “Optimal Energy Management System (OEMS) at District/Grid Level”. The plug-and-play nature can be deployed in districts containing buildings with highly different characteristics and usage, as well as different types of occupants and financial capabilities. Therefore, the cloud ecosystem consists of the OEMS module, which is dedicated to integrating information from every P-n-H-equipped building to feed the support with district aggregated information. Therefore, decisions are made by local building optimizers and controllers (IMCS). The idea behind the district optimizer is to provide each of the local IMCS with essential hints regarding the overall district situation, i.e., energy consumption, energy generation, energy stored, and available flexibility, in order to take mutually beneficial decisions at the building level and create a synergistic district aggregated block of smart buildings/neighborhoods.
- “Connection and integration with various energy networks”. Buildings within the P-n-H system are connected and integrated with various energy networks (e.g., electricity, heating/cooling, domestic hot water). As a result, the OEMS module collects data and aggregates information from different power supply domains, which may affect the performance and utilization levels of each other. Specifically, to optimize the indoor thermal comfort of the building occupants, both district heating systems and locally driven heating systems (e.g., gas boilers, electric heaters, air conditioners) are integrated and managed in a coordinated manner.
- “Shift demand among consumers and optimization of energy trading”. The P-n-H ICT system properly shifts the demand among consumers at different times and optimizes energy trade between consumers, storage systems, and both the thermal and electrical grid. Additionally, the district energy management system predicts and monitors both energy generation from integrated neighborhood systems and user consumption while providing information to end users and allowing them to participate in the management of their energy demand. As a result, the OEMS collaborate with the Demand Response Flexibility Forecasting and Optimization (DRFFO) module, which is responsible for calculating and forecasting, based on real-time data, the available flexibility at a building and aggregated district scale. Such functionality allows the respective building operators (e.g., energy aggregators, homeowners) to actively adjust the level of their compliance and, consequently, their benefits, with the demand response strategies (demand shifting and shaping) implied by the Distribution System Operators (DSOs) in different power supply domains. Moreover, within the P-n-H cloud ICT ecosystem, an auxiliary, yet able to provide quite informative situation insights, user visualization platform grants different levels of access to different users (occupants, building operators, DSOs, etc.), allowing simple actions/strategies to be selected by them.
- “District/Smart grid Cyber Security”. Cyber security measures include fault identification mechanisms to allow an easier reconfiguration and improved resilience of the distribution grid when the RES harvested within the ADBE solutions is provided in the grid. Therefore, the safety mechanisms foreseen with the cloud ecosystem are dedicated to preserve data quality and fault filtering in emergent or abnormal occasions such as sensor malfunctions/lags or power shut downs. Fault-free data enable a more resilient and reliable operation of the overall system, allowing the control mechanisms to react to reliable data reflecting the real-life situation of the building plant.
- “Protect the infrastructure elements”. To ensure the protection of the infrastructure elements based on sensors and gateways from attacks and possible threats, a security framework is defined to bootstrap and commission possible components of the P-n-H architecture and its integration with the ADBE and IMCS/OEMS applications. Therefore, BMS middleware, which is responsible for routing and transmitting data and information to and from every interconnected ICT module, has been designed and developed to enable specially designed JAVA-based security protocols and interfaces. Moreover, the strongly and securely shielded BMS middleware platform serves as the cloud end-point to the local building automation network (internet router), which establishes a reliable and secure communication channel with all other ICT modules.
- “Support privacy for data collection in the IMCS/OEMS modules”. To support privacy-preserving solutions for data collections on the IMCS/OEMS modules and in between points of data aggregation, the end users have the capability to have control over how his/her data are disclosed. Therefore, the data privacy schema has been implemented within the Building Management System (BMS) middleware framework, granting different levels of access to different potential actors of the energy grid where needed according to the preferences and consent of the data owners (i.e., end-users, occupants).
- “Low-cost installations for IMCS”. The ICT P-n-H activities take into account the requirements of low intervention and low installation costs, considering a fully wireless deployment of the necessary automation equipment. To this end, only the metering and actuating devices need to be deployed physically at the building level, while no local server for hosting the software ecosystem is needed since the software deployment is fully on a cloud server. Furthermore, the IMCS software tool, along with the collaborating BMS, OEMS, DRFFO, and Security and Safety Security Mechanisms (SSM) platforms, are designed and implemented to be easily reconfigurable on-the-fly. In addition, they are also capable of re-adjusting their operation according to the scale of the building plant.
- “Reusable and recyclable materials”. Within this context, special measures for careful material assessment, both for ADBE and building automation devices and increasing recyclability and reusability, were taken after the final selection and purchase of the respective devices by the pilot owners. This assessment is carried out according to the advances in the circular economy business model and the exploitation plan. Moreover, installing, maintaining, and replacing automation devices has already been extensively documented online, providing instructions for Do-It Yourself (DIY) deployment.
- “Maximum energy reductions and energy harvesting”. The ICT mechanisms have been proven capable, within previous European-funded projects, to drastically reduce the overall energy consumption (>30%) while maximizing the harvested energy exploitation and preserving indoor comfort.
- “Different modules of the P-n-H solution installation in different buildings to optimally exchange renewable energy”. The P-n-H ICT ecosystem is consisting of several collaborating sub-modules which have already become available as standalone tools from previous P-n-H contributors, activities, and projects. As a result, each part of the ICT cloud ecosystem can be individually selected according to the needs of each building operator. Being versatile and flexible extends to selecting from a collection of enabling functionalities by the potential users/customers. Moreover, the same P-n-H solution is flexible and easily configurable to expand—by defining the scale of the building plant—its applicability to diversified types and sizes of building-plants.
- “Deployment and tests with many different real-life pilots”. The selected pilots also cover a wide range of building properties as those of various sizes, energy labels, insulation, operational with or without additional conventional RES harvesting systems, glazing materials, materials for frames (steel, aluminium), systems for heating and hot water production, and low- or high-energy-consuming buildings. As a result, P-n-H ICT modules have taken the appropriate measures to ensure compatibility and interoperability with commercially available and certified wireless building automation devices through well-established and widely used communication channels and protocols. Diversity and versatility have already been considered as one of the main differentiating features of P-n-H by tailoring scalable and reconfigurable standalone software tools which had already reached medium Technical/Technological Readiness Levels (TRLs).
3. Integration of Core Architecture Components
3.1. Data Models and Interfaces
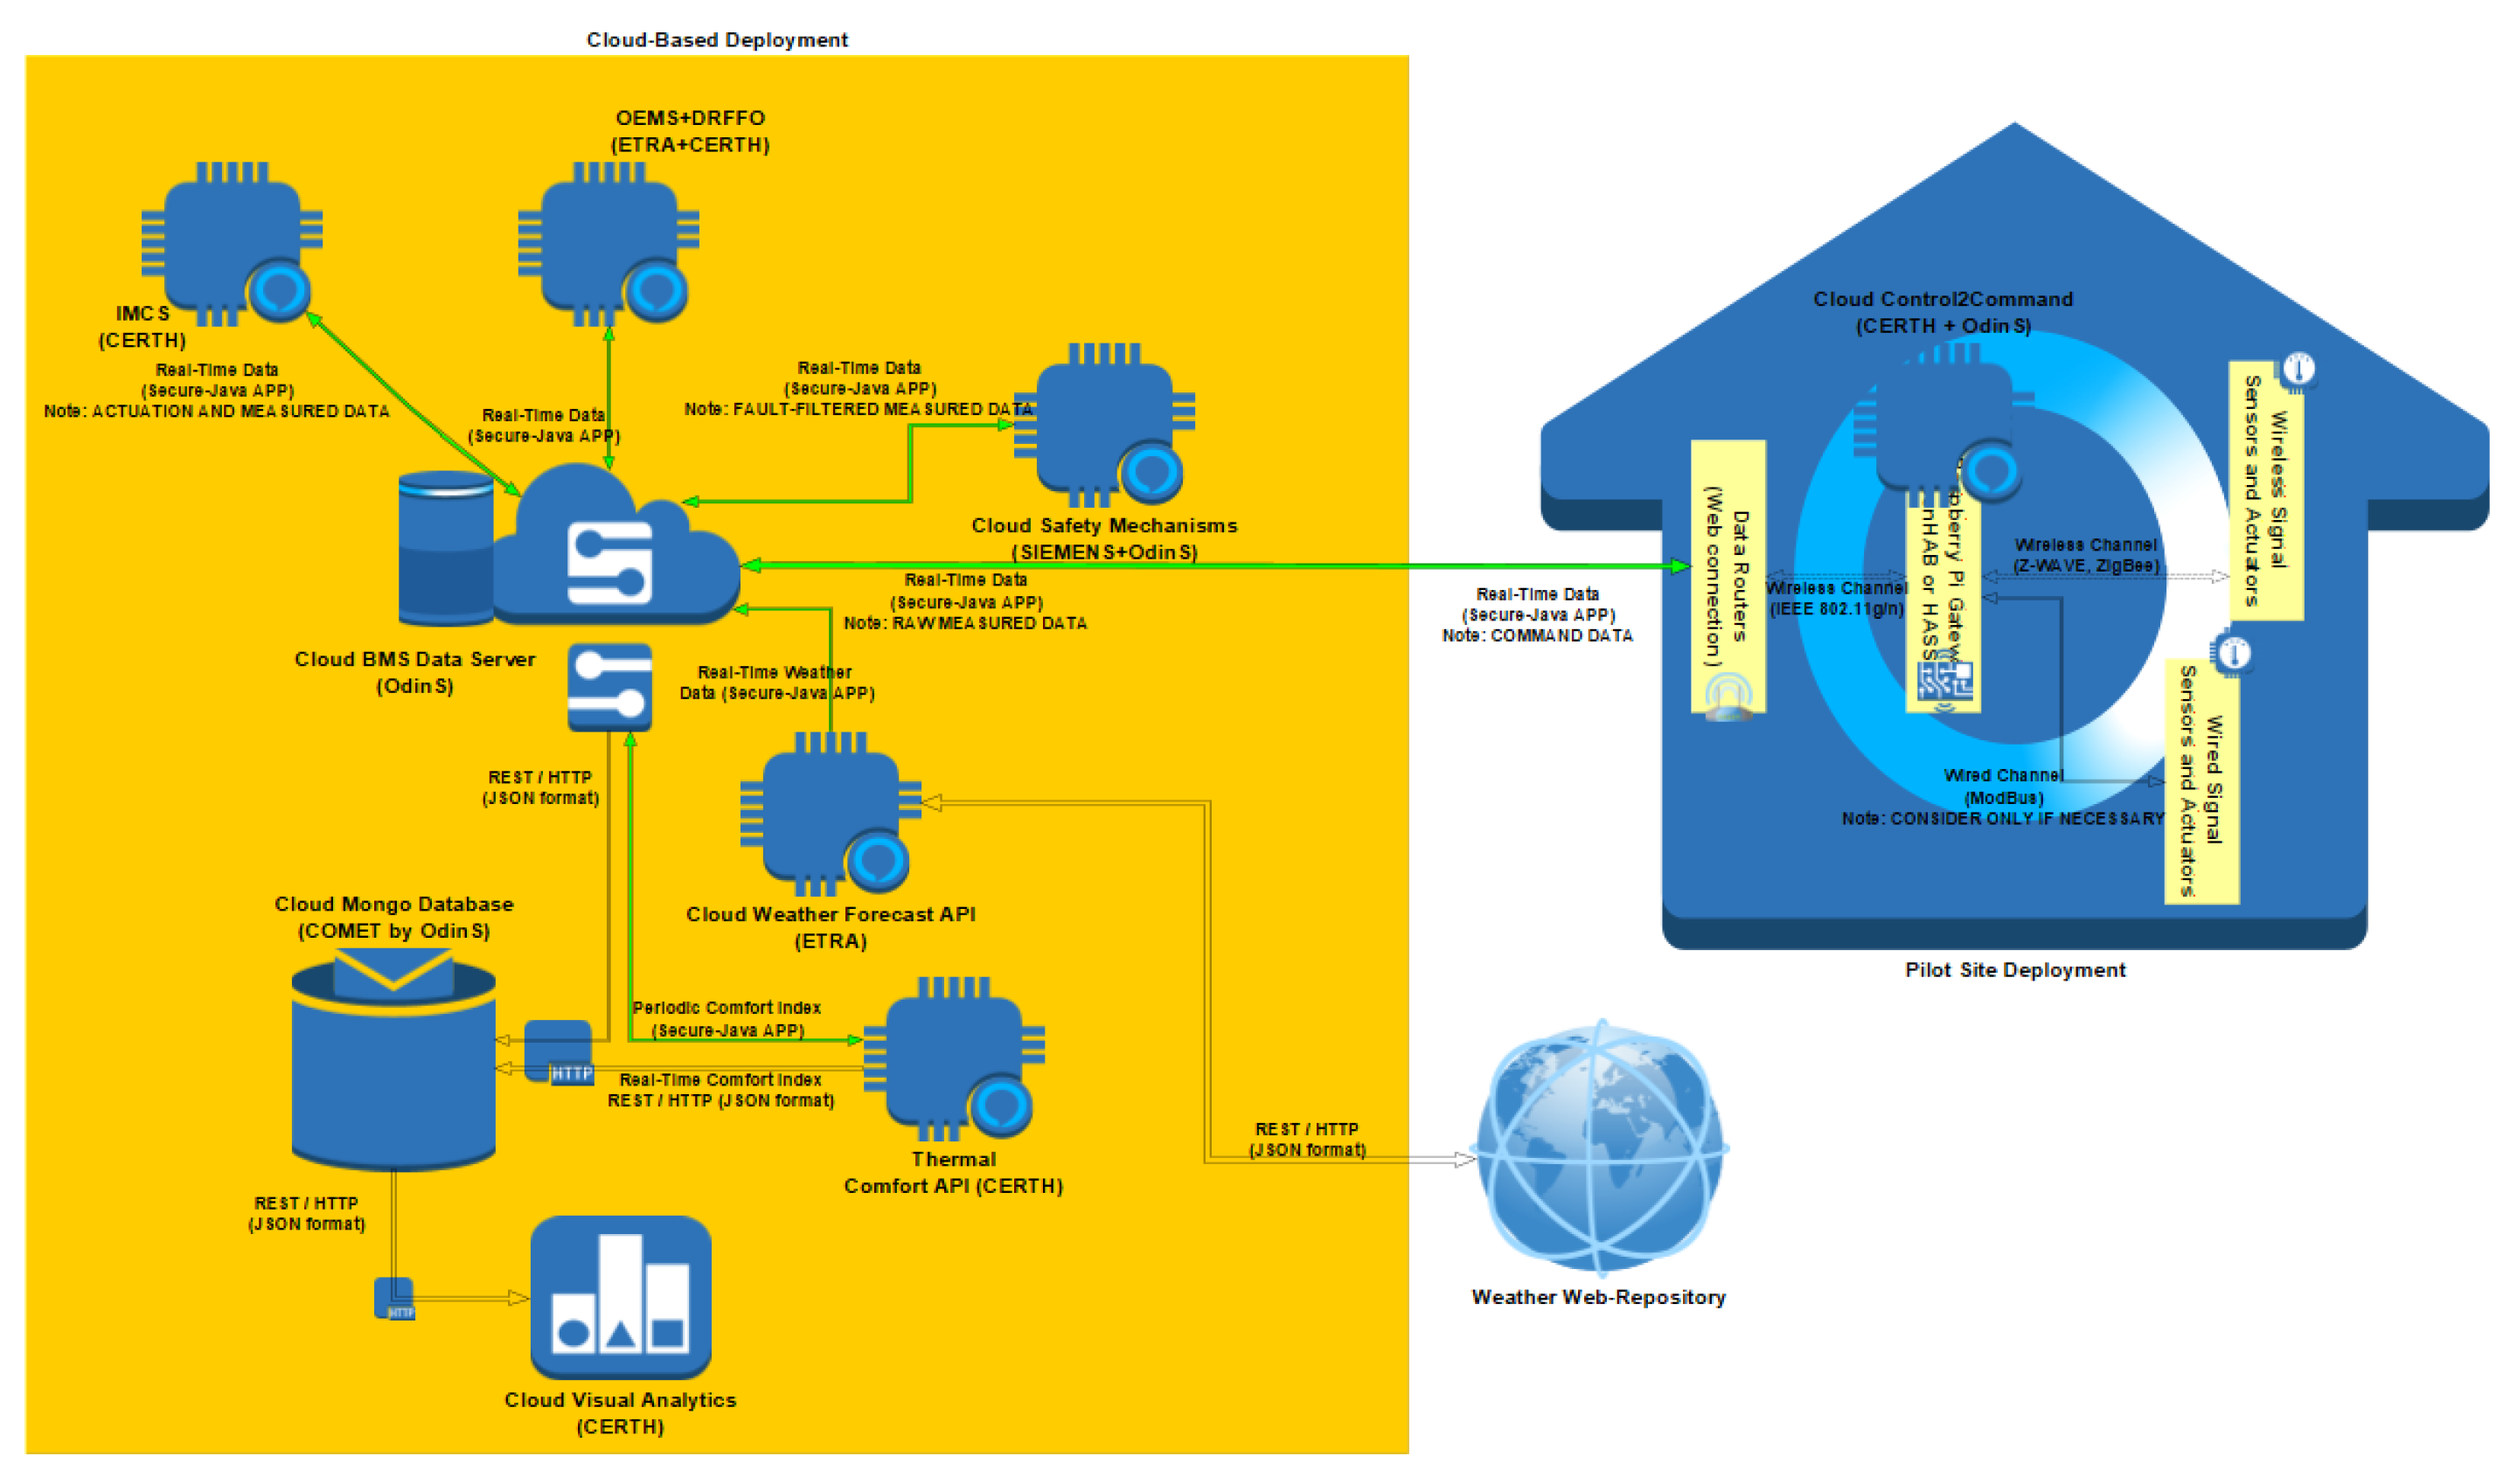
3.2. Cloud Ecosystem Architecture
3.2.1. Building Automation Network Layer
3.2.2. Cloud Ecosystem Layer
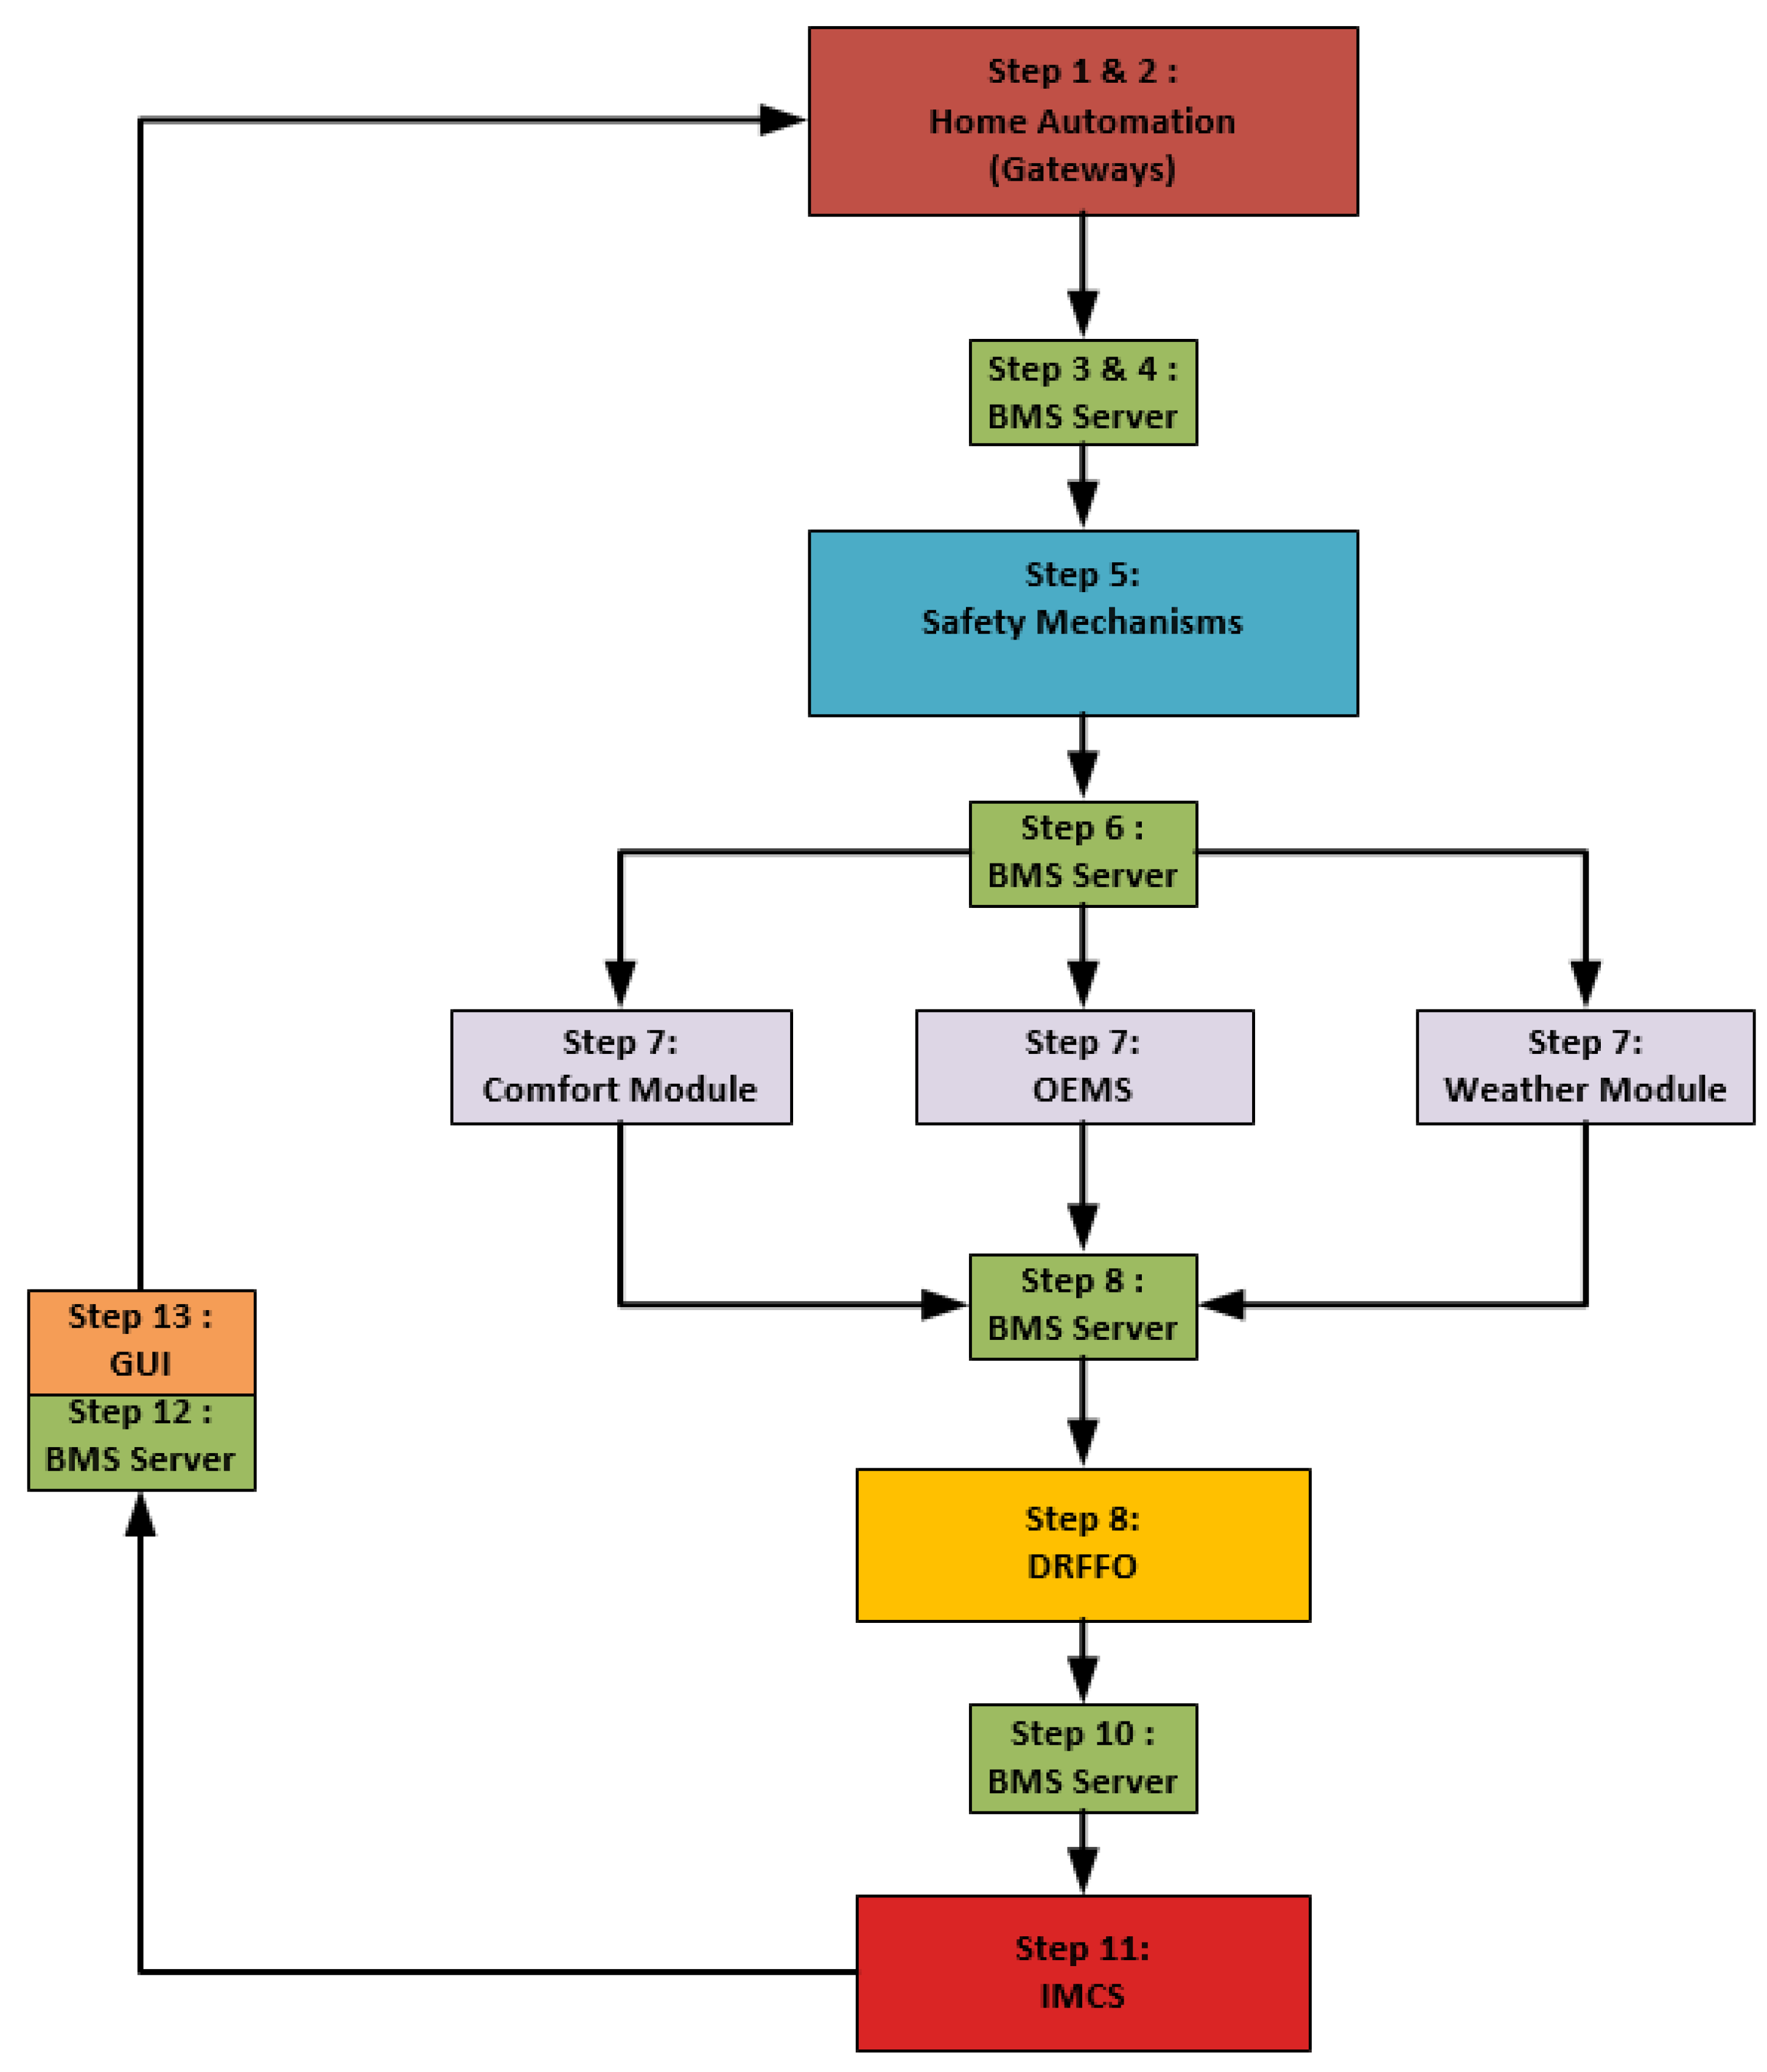
3.2.3. Workflow Description
- Initially, the restricted or open-source device managers (hardware accelerators) will be tailored according to the needs of the PnH project, hosted at the level of the gateways. These mechanisms will implement an iterative procedure until all expected devices have replied to their state (measurements) publishing queries. If at any point some of the devices expected to respond did not, then the respective entry in the stream of data readings will be replaced by an indicative value (e.g., a negative or NULL) denoting the problem which should be mitigated by the dedicated SSM mechanism in the cloud ecosystem framework. This mechanism will be triggered every few minutes according to the control-cycle-defined duration. For this matter, wireless Z-WAVE (or ZigBee if needed) communication protocols and respective data parsers have been considered.
- The received data readings are then structured at the gateway level in order to meet the common data model attributes and structure as described in Section 3.1. The data objects created at this level meet the design attributes of “Gateway: Zone Sensors” and “Gateway: Zones-Block Sensors” depending on the actual role of each respective gateway.
- The structured data are forwarded through a secure JAVA-based channel through the available Internet data routers to a certain static IP on the Internet denoting the BMS server acting as the middleware.
- The structured data are parsed and buffered locally at the BMS middleware level, while an indicative token is created by the execution manager which triggers the following: the SSM in order to heal/cleanse any faulty data or patterns recognized according to the historic data patterns identified, as well as the weather-forecast-retrieving API in parallel, adopting the same secure JAVA-based encryption mechanism as in step 3 above.
- The SSM filters faulty data using commonly used curing techniques driven by pattern recognition methodologies to detect and recognize the type of the fault. Moreover, already easily recognizable errors (recognized at the gateway level—see Step 1) indicated with certain imposed values are also treated appropriately at this point. Moreover, in severe error incidents, specific alarms are logged as important events and notifications are triggered for the system operator.
- After the completion of step 5, the reception of weather prediction data as well as fault-free measurements, the BMS Middleware temporarily buffers the data objects needed for the other ICT modules. Evidently, the respective flag-token triggers step 7’s mechanisms: thermal-comfort-calculating API, weather API, and OEMS service initiation.
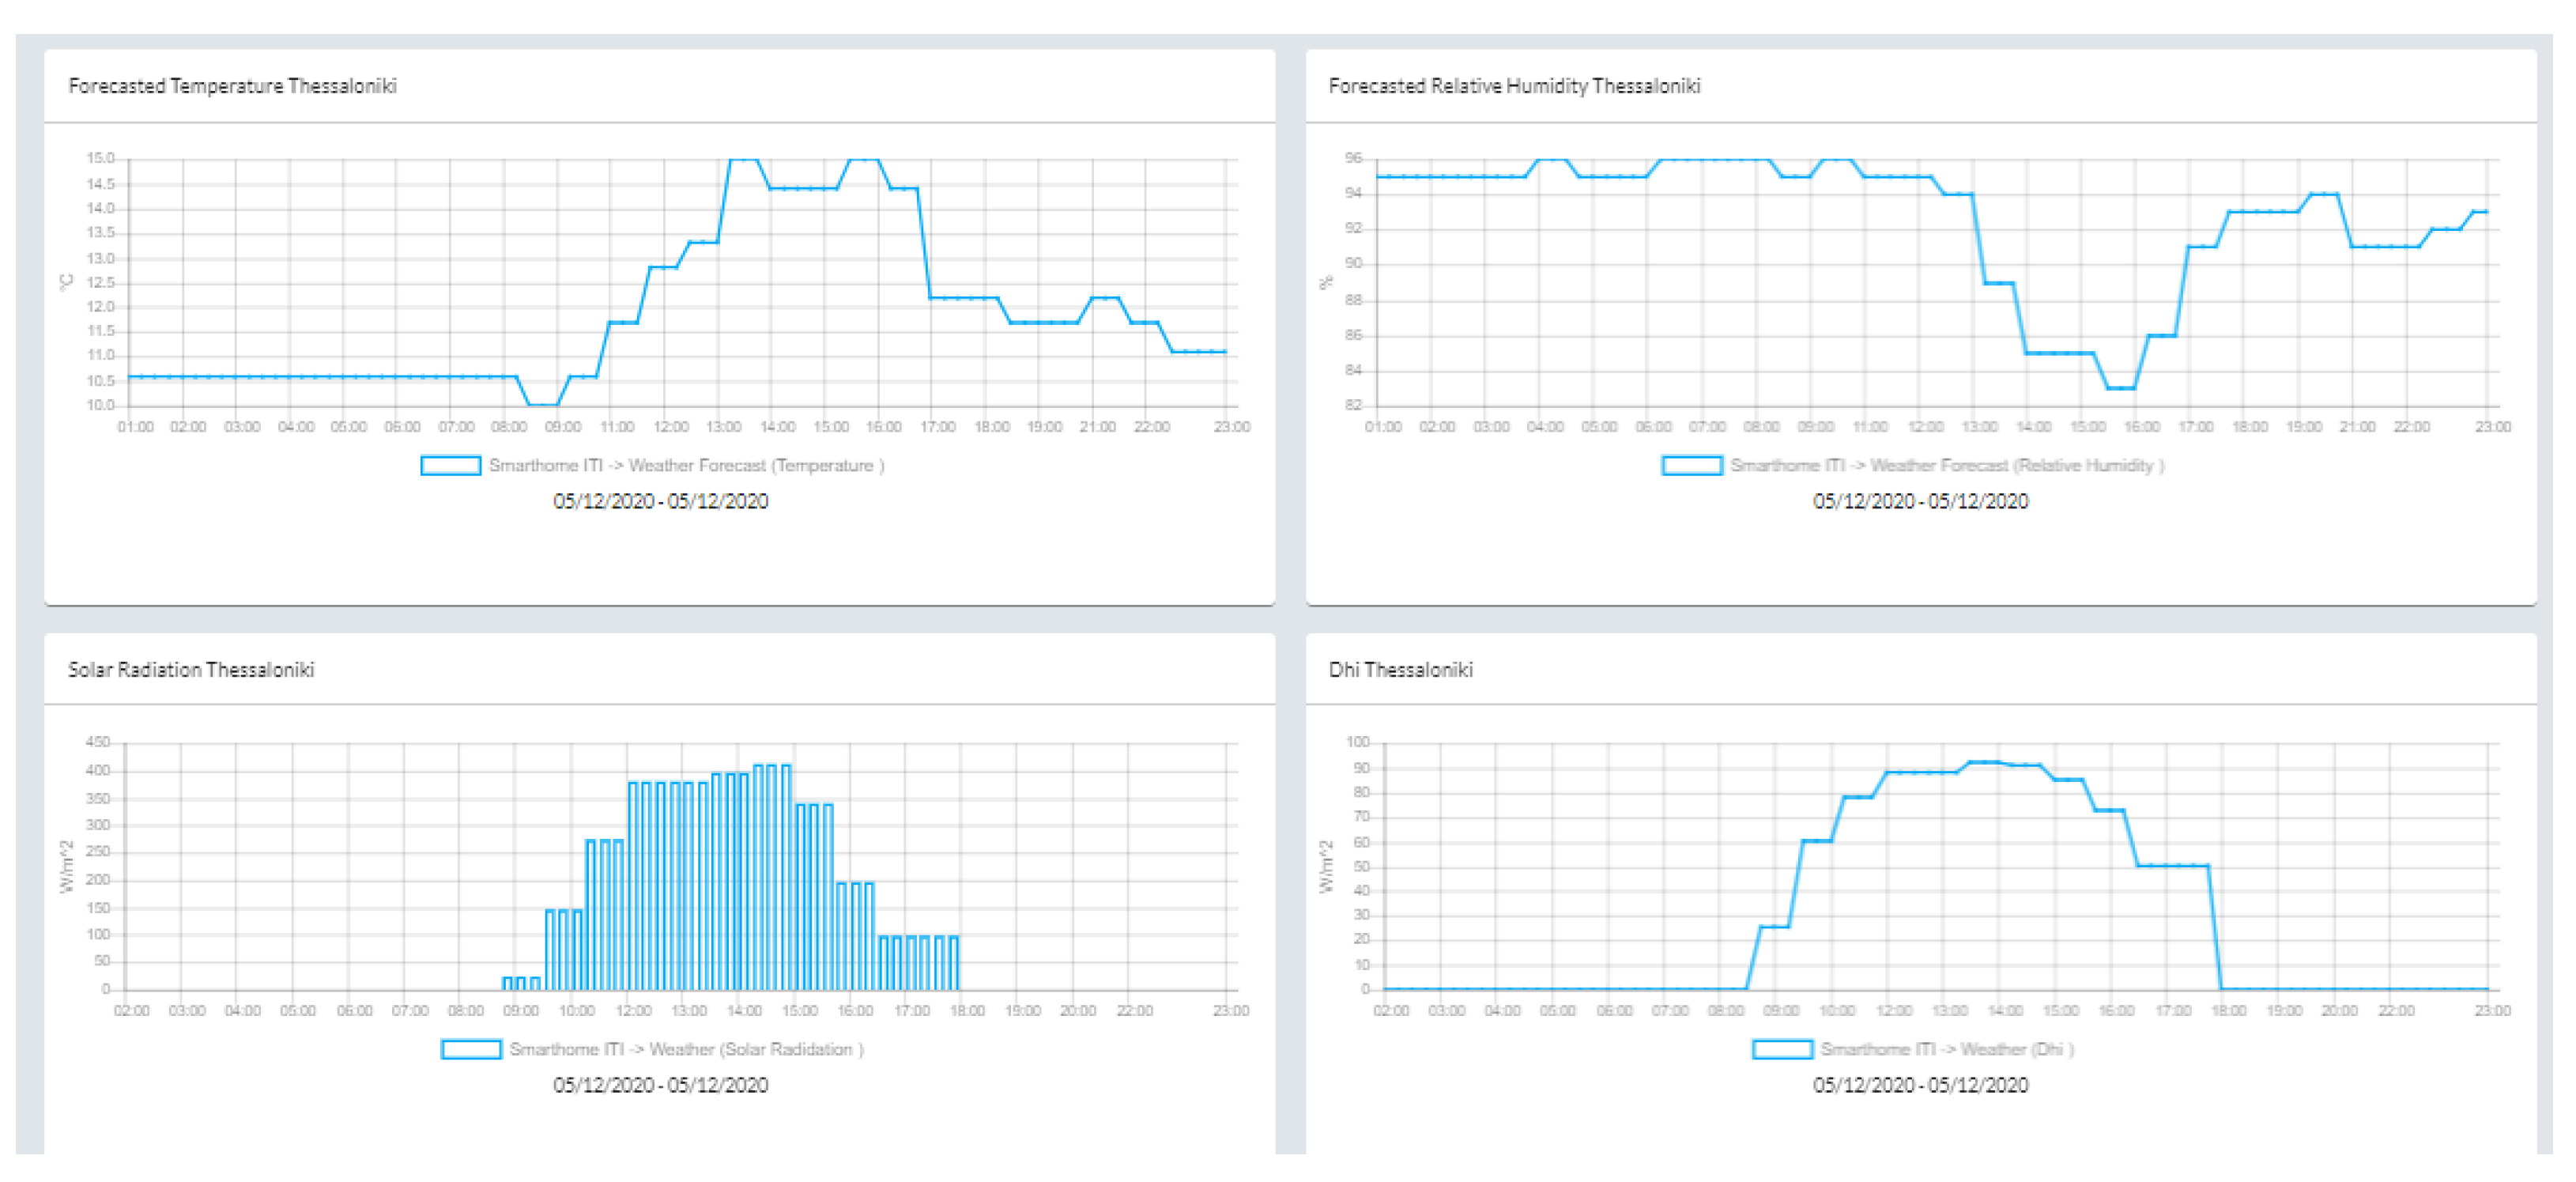
- The thermal-comfort-calculating API, based on the buffered data, and the database manager, which permanently stacks the respective new entries—reflecting the current control cycle—for evaluation purposes in the central data base, are executed while their responses are sent back to the BMS Middleware through the overarching secure JAVA-based channel considered for all data exchanges through the BMS. The input data objects at this level meet the design attributes of “Gateway: Zone Sensors” while the output data objects meet that of “Gateway: Optimization Criterion”. Moreover, in parallel, the OEMS—responsible for emulating the grid behavior, as well as the demand requests of the operator of the grid at the district level—and the weather retrieving API are also initiated in order to collect forecasted weather data for the specified building plant location available in open web repositories (e.g., www.tutiempo.net, accessed on 10 February 2022). Both modules communicate through the same JAVA-based secure channel (as presented in Step 3) with the BMS Middleware. The input data objects as well as the output ones at this level meet the design attributes of “Gateway: Zone Sensors” and “Gate-way: Zones-Block Sensors”, respectively, while the weather forecast API considers void/NULL inputs and “Gateway: WebSource” output objects, respectively.
- The DRFFO is responsible for calculating the current flexibility, as well as predicting the future available flexibility, at a building and emulated district level—modules are also executed in a closely cooperative manner. The input data objects at this level meet the design attributes of “Gateway: Zone Sensors” while the output objects meet those of “Gateway: Optimization Criterion”.
- After the completion of step 8 and the reception of the thermal comfort index, as well as the availability of demand flexibility index, the BMS Middleware temporarily buffers the data that are necessary for the optimization criterion calculation in the local building optimizer module IMCS. Evidently, the respective flag/token which triggers the IMCS module in step 9 is generated.
- The IMCS module is executed, being responsible for calibrating the control strategy on-the-fly based on the real-time accumulated optimization criterion values on a periodic basis, i.e., usually every few hours. The optimization criterion considered in a weighed summation of the normalized climate (HVAC) devices energy consumption (available directly from the sensor network), the thermal comfort index (available through step 7), and the available flexibility index (available through step 7 also). Moreover, based on the buffered cured data measurements (originating from step 5) and the calibrated control strategy, the optimized control decisions for every controllable climate (HVAC) device are generated by implementing a closed loop piece-wise linear control schema. Similar to the above, a secure JAVA-based channel is considered for parsing the resulting decisions back to the BMS. The input data objects at this level meet the design attributes of “Gateway: Zone Sensors” and “Gate-way: Optimization Criterion”, while the output ones meet those of “Gateway: Zone Actuators” and “Gateway: Zones-Block Actuators”.
- After the completion of step 9 and the reception of the control decision data, the BMS Middleware temporarily buffers the data objects while the database manager is triggered in order to populate the database with the results from OEMS, DRFFO (i.e., flexibility forecasts, demand requests), and the IMCS (i.e., control decisions) necessary for the operational evaluation of the system. Evidently, the respective flag/tokens which trigger step 11 and 12’s mechanisms, the data manager token at the gateway level, are generated.
- The data manager sends a data query requesting the structured control decisions buffered at the BMS middleware level already. Similar to the above, the query is sent via a secure JAVA-based Internet channel. The input data objects at this level meet the design attributes of “Gateway: Zone Sensors” and “Gateway: Optimization Criterion”, while the output ones meet those of “Gateway: Zone Actuators” and “Gateway: Zones-Block Actuators”.
- The structured control decision data are parsed back to the respective gateways according to their granted level of access to certain data objects. At this point, a specially designed module, namely, the Control2Command API, is triggered in order to interpret the optimized control decisions, generated by the IMCS module at step 9, into device-acceptable and -understandable actuation signals and commands.
- Finally, the actuation signals are compared with the previous ones in order to identify which actuators should and should not change their state. The respective actuation signals, only for the devices identified, are sent wirelessly through the device manager end-point service while an iterative procedure ensuring their actual application on the controllable devices completes step 13’s activities.

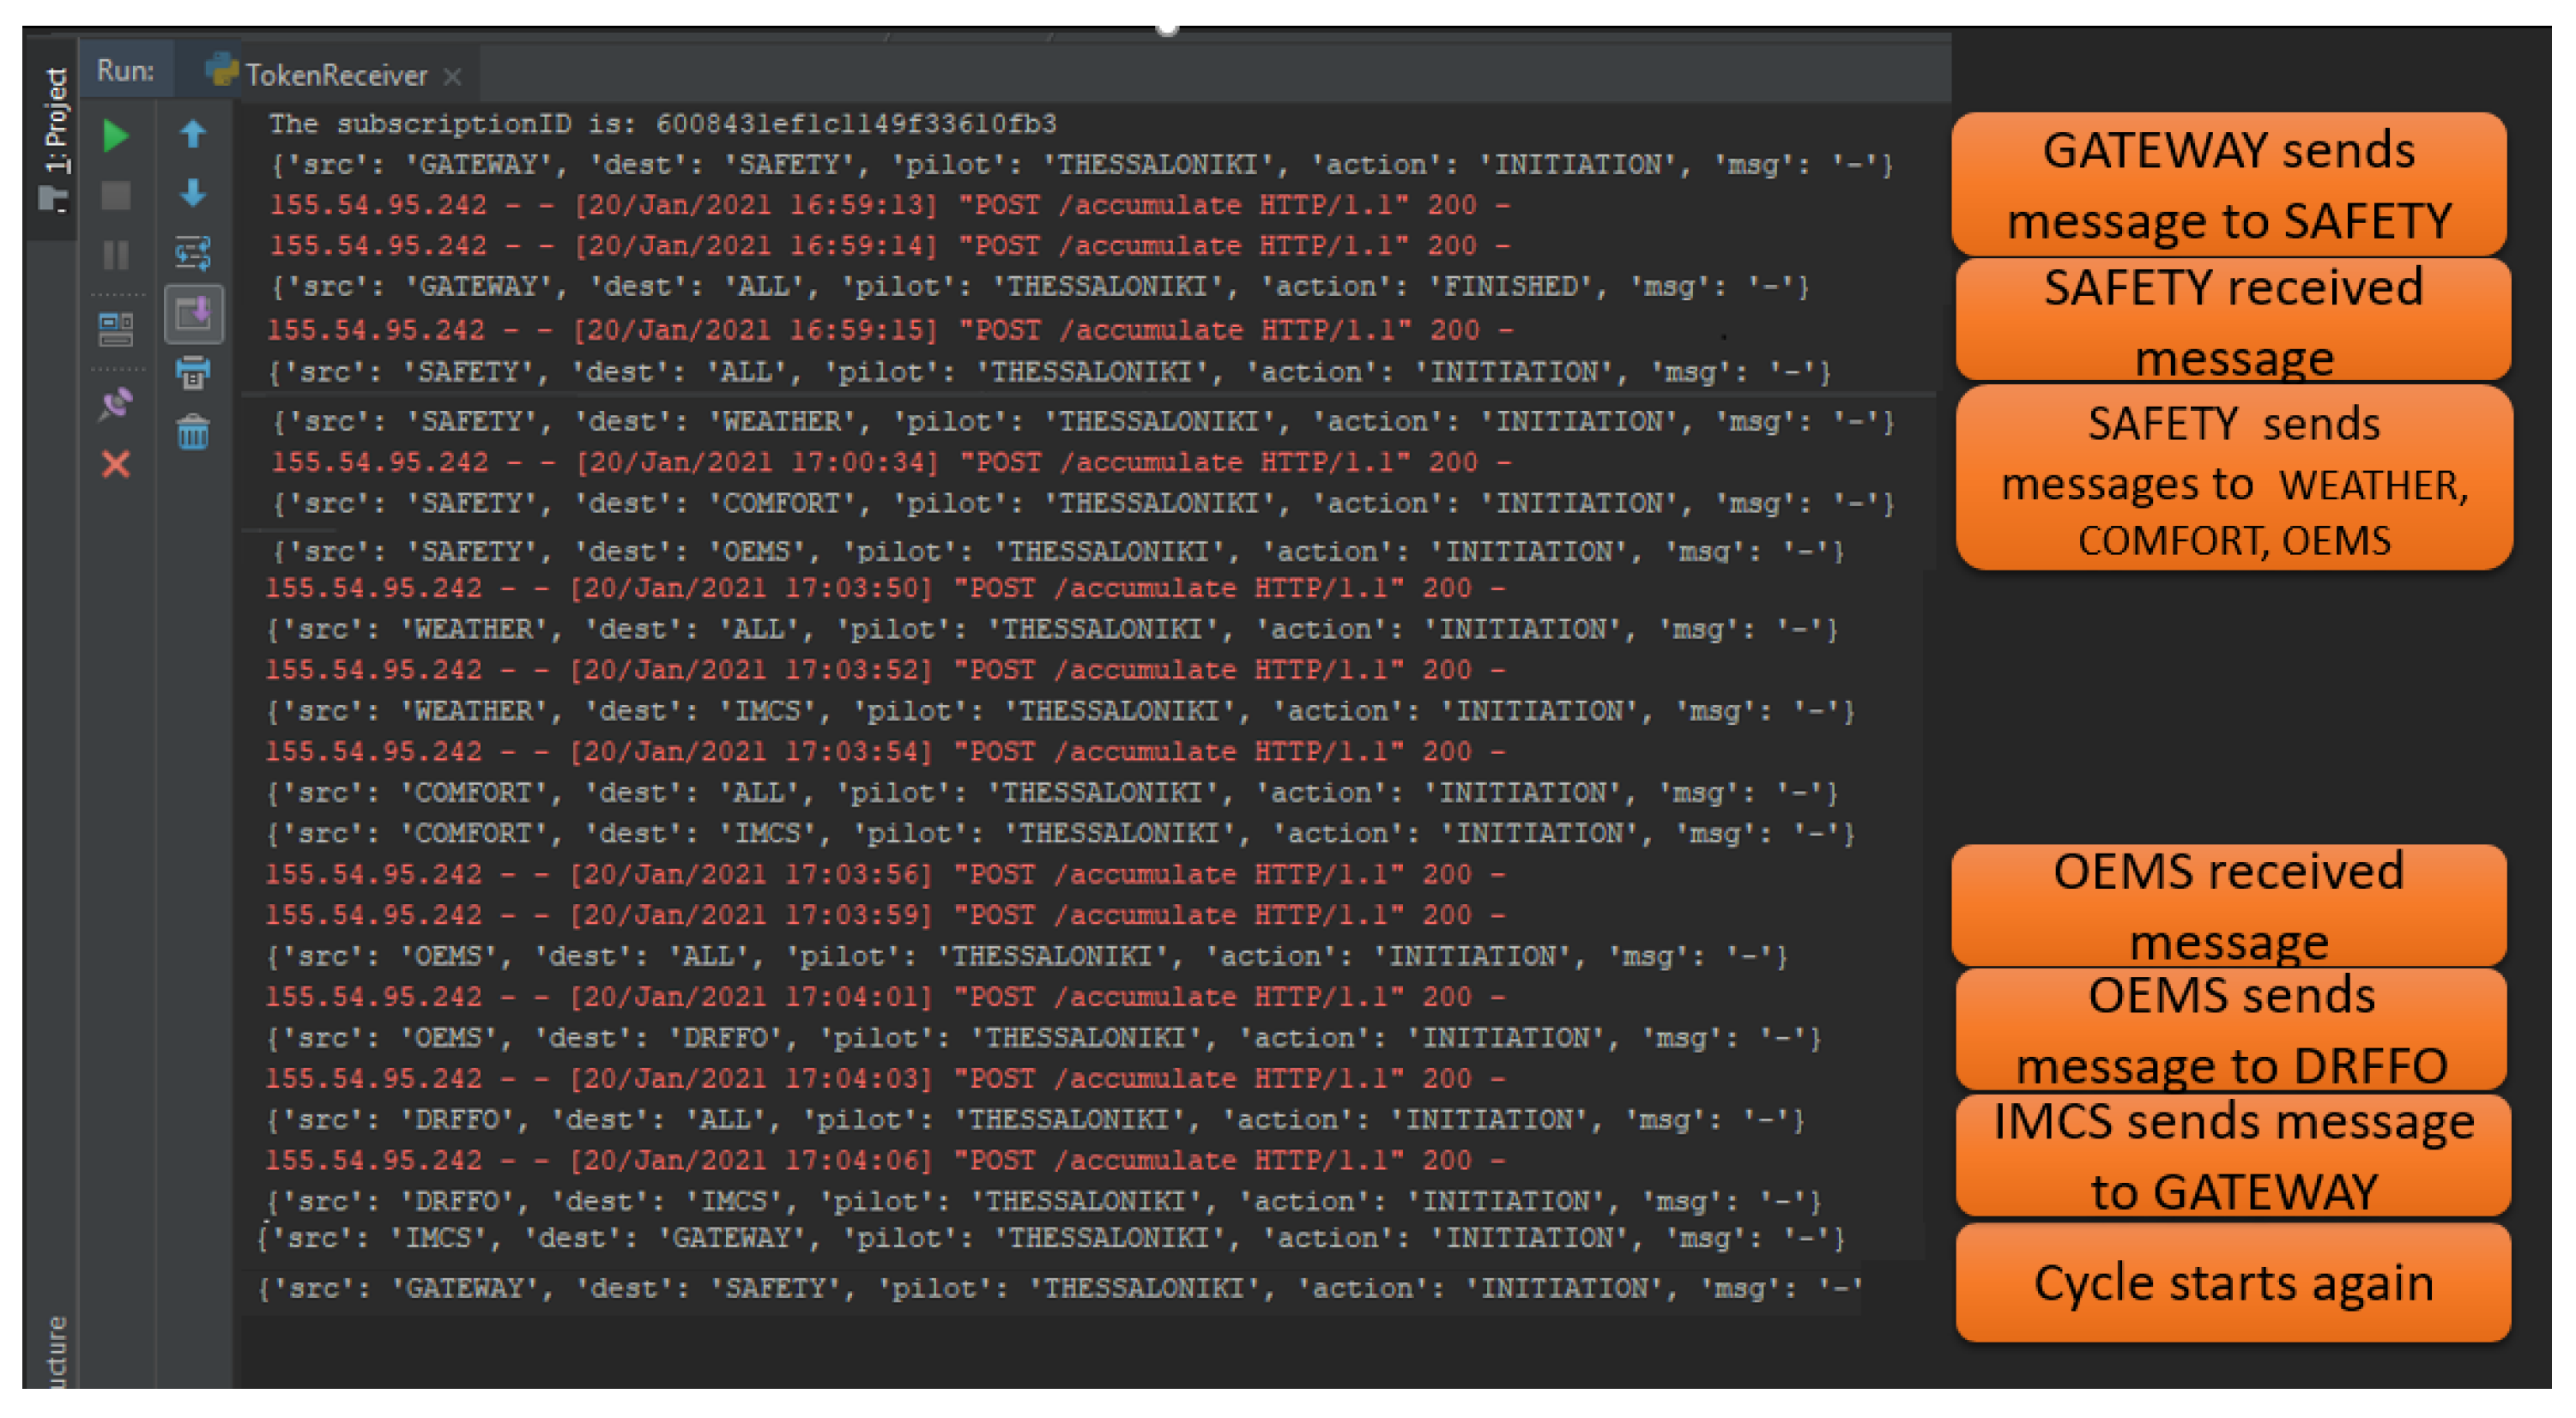
3.3. Token-Based Execution Manager

4. Validation Results in Pilot Cases
- Support for different IoT Gateways is used in a variety of domains to support seamless data collection and aggregation;
- OEM platform is easily configurable and adaptable to user needs and preferences. Multi-hierarchical-level support for user authentication and category management;
- Innovative low-power, embedded-intelligence-incorporating next-generation communication protocols (i.e., LoRa);
- Open reference Connectors API (customized REST services) for enabling third parties to collect, analyze, and store big data in platform instances (either on the premises or on the cloud);
- Based on Open Architecture and existing standards such as MQTT to ensure interoperability and industrial-grade performance;
- Deployment agnostic solution (Cloud/On Premises).
- i
- Validate the connection between the different ICT components through the common communication and tokenized channel;
- ii
- Test their connection with the BMS server, facilitating the posting and retrieval of building data;
- iii
- Test the technical properties and the functionality of each technical component.
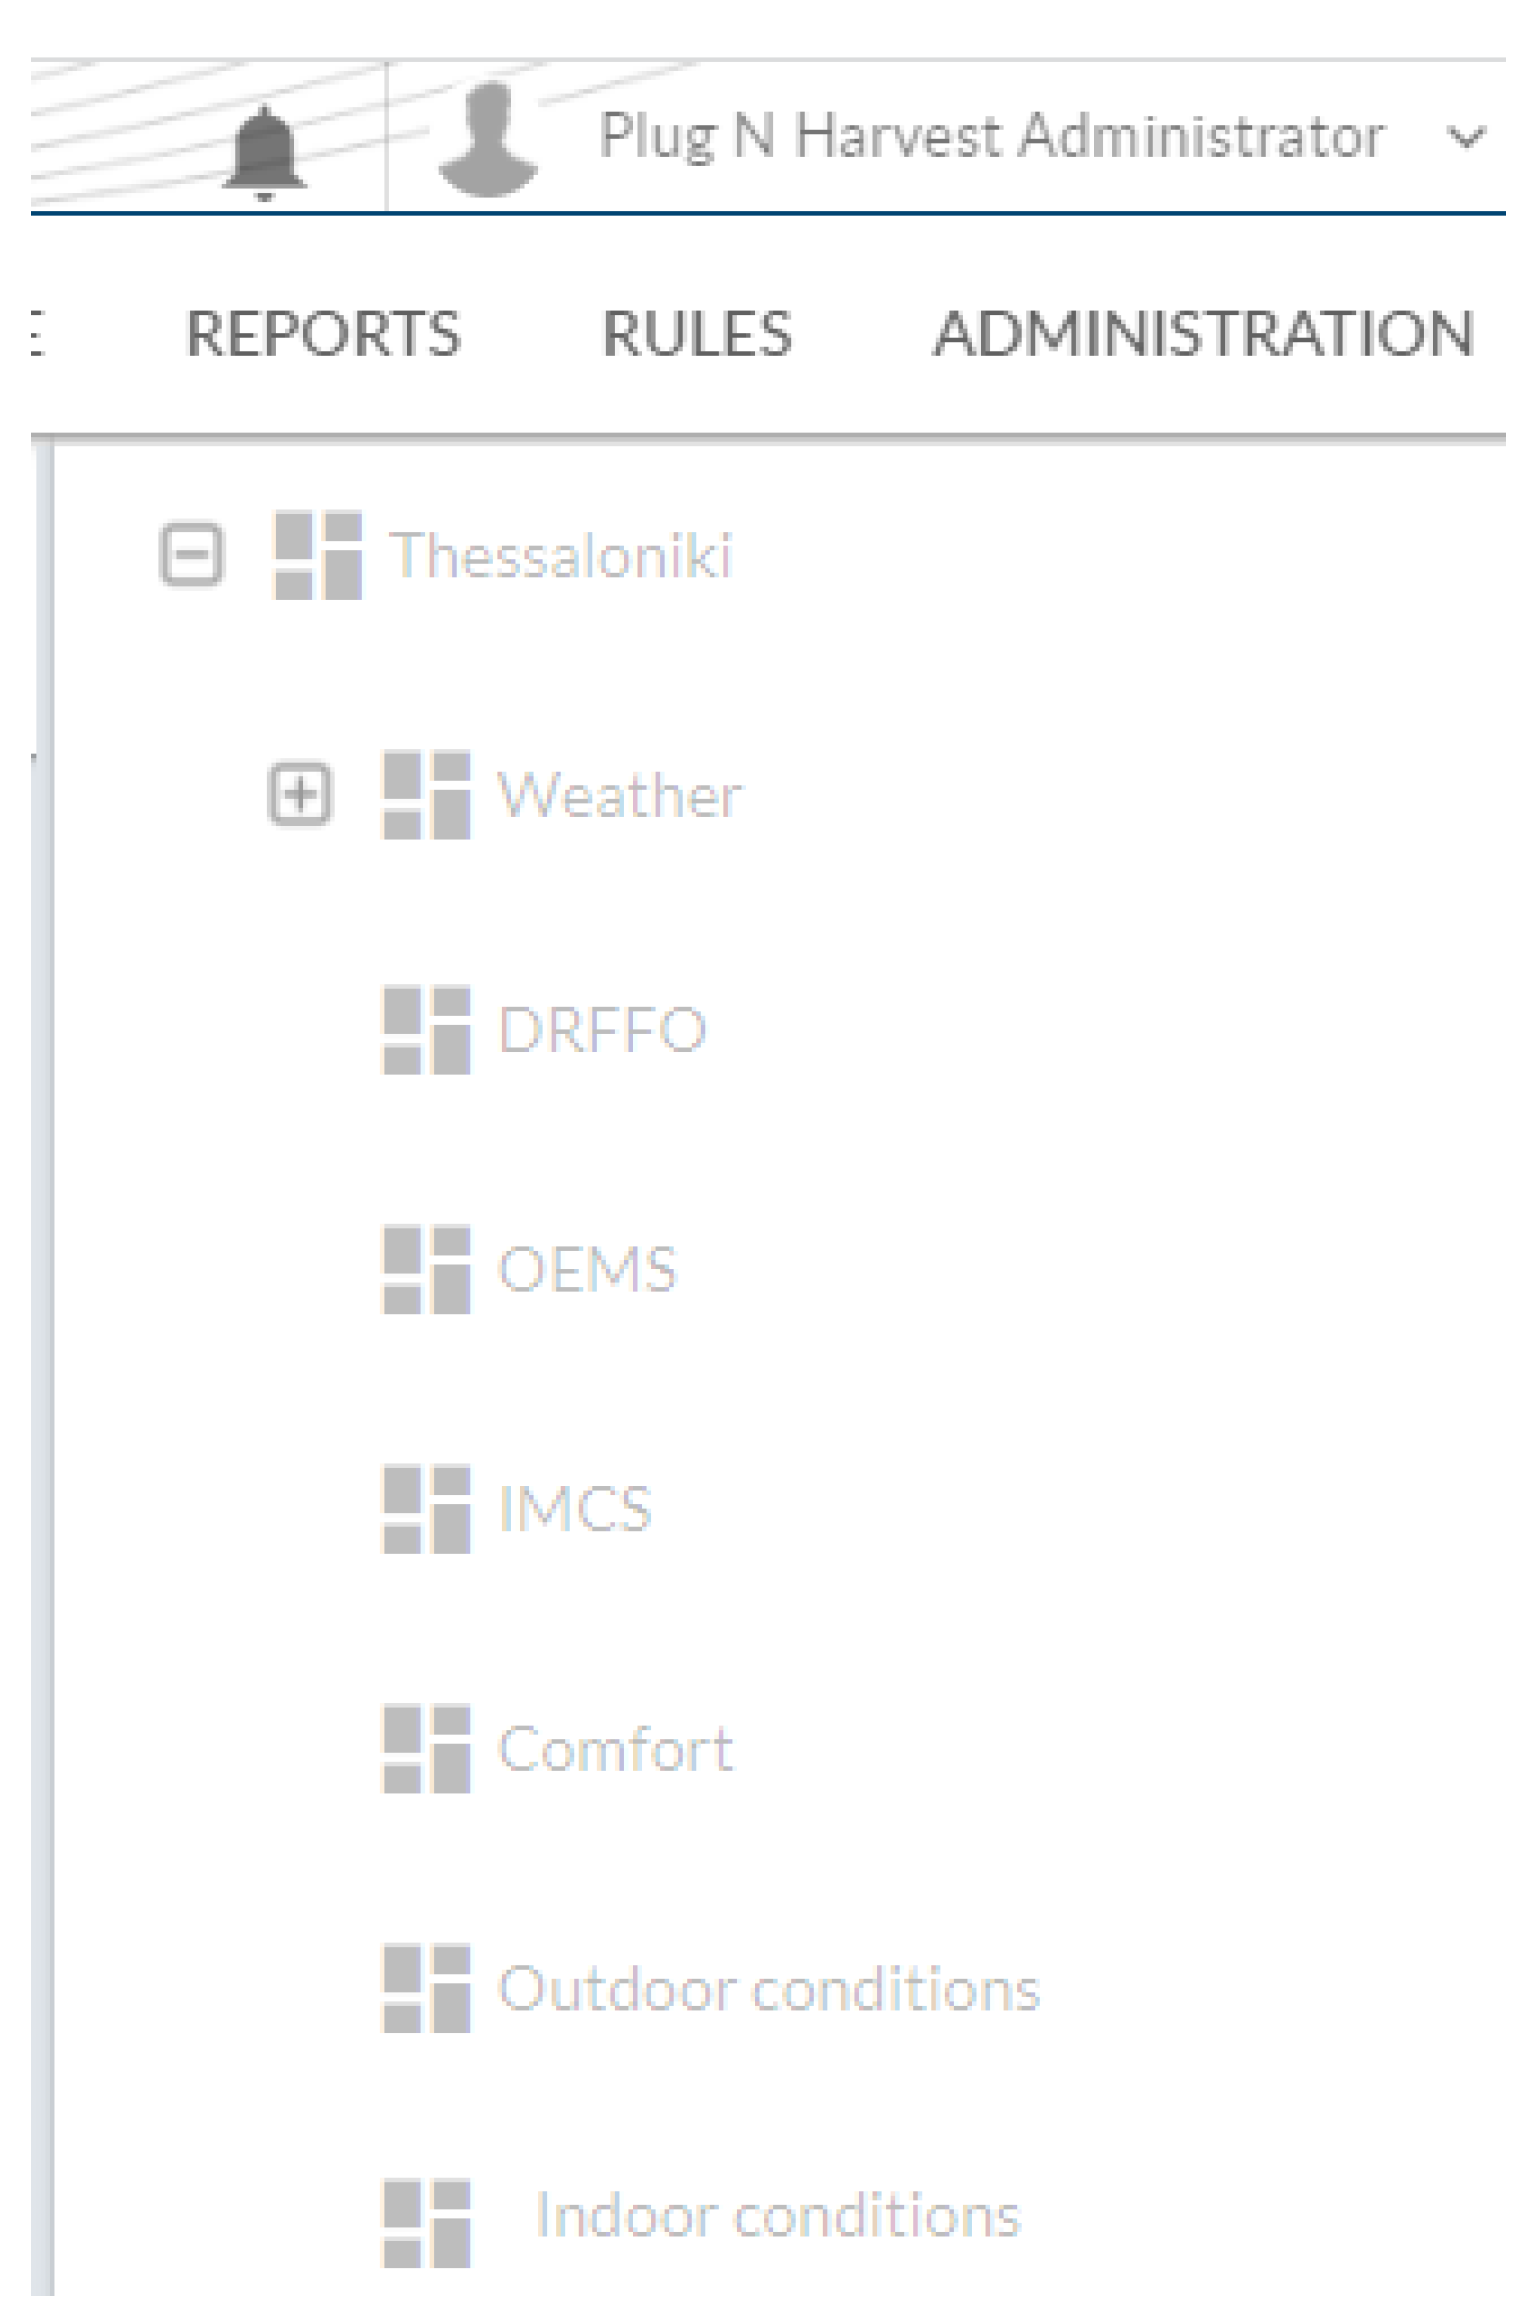
4.1. PLUG-N-HARVEST Dashboard Menu
4.2. Validation Results: Gateway
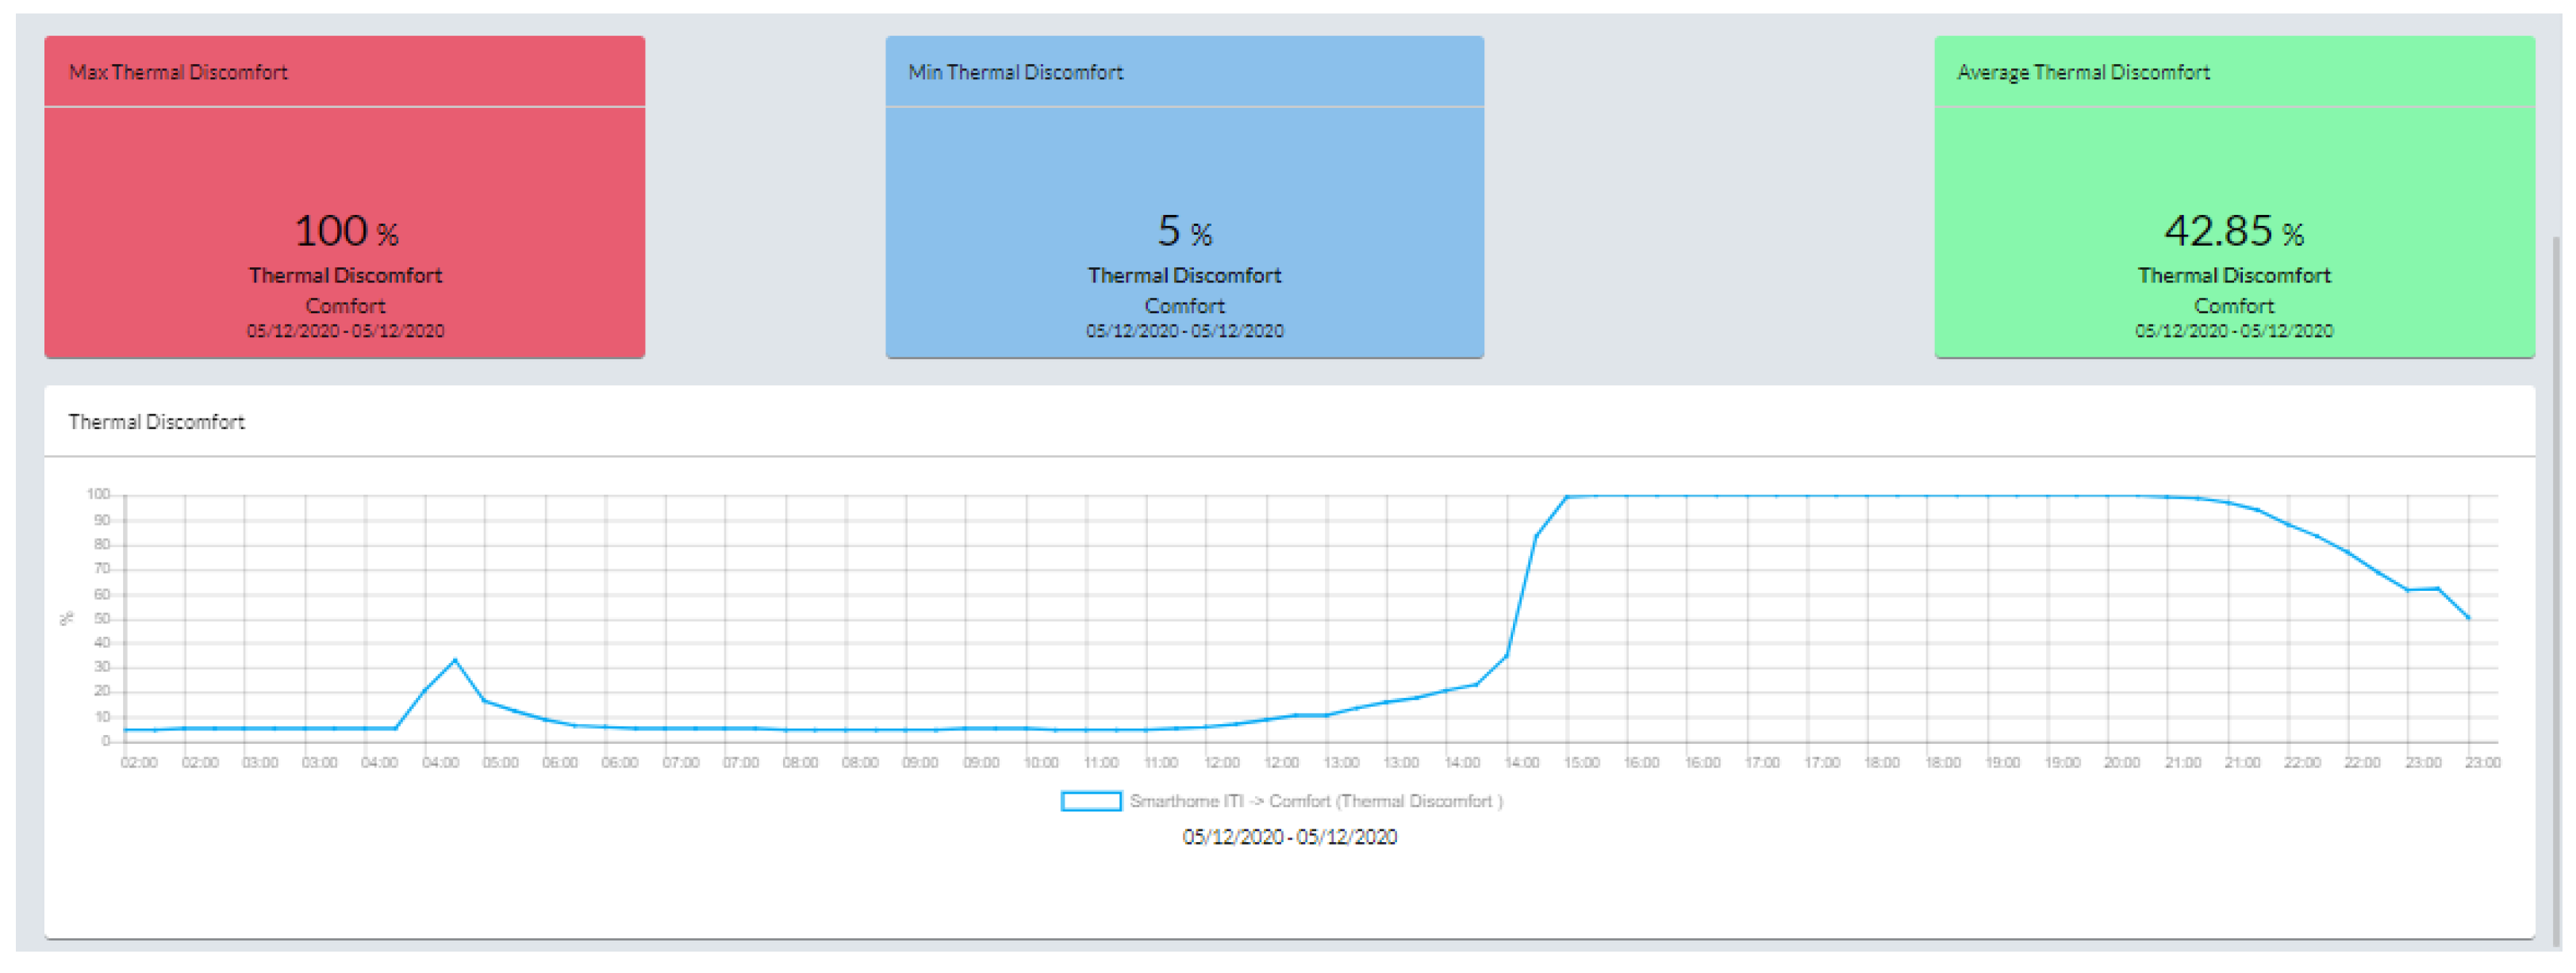
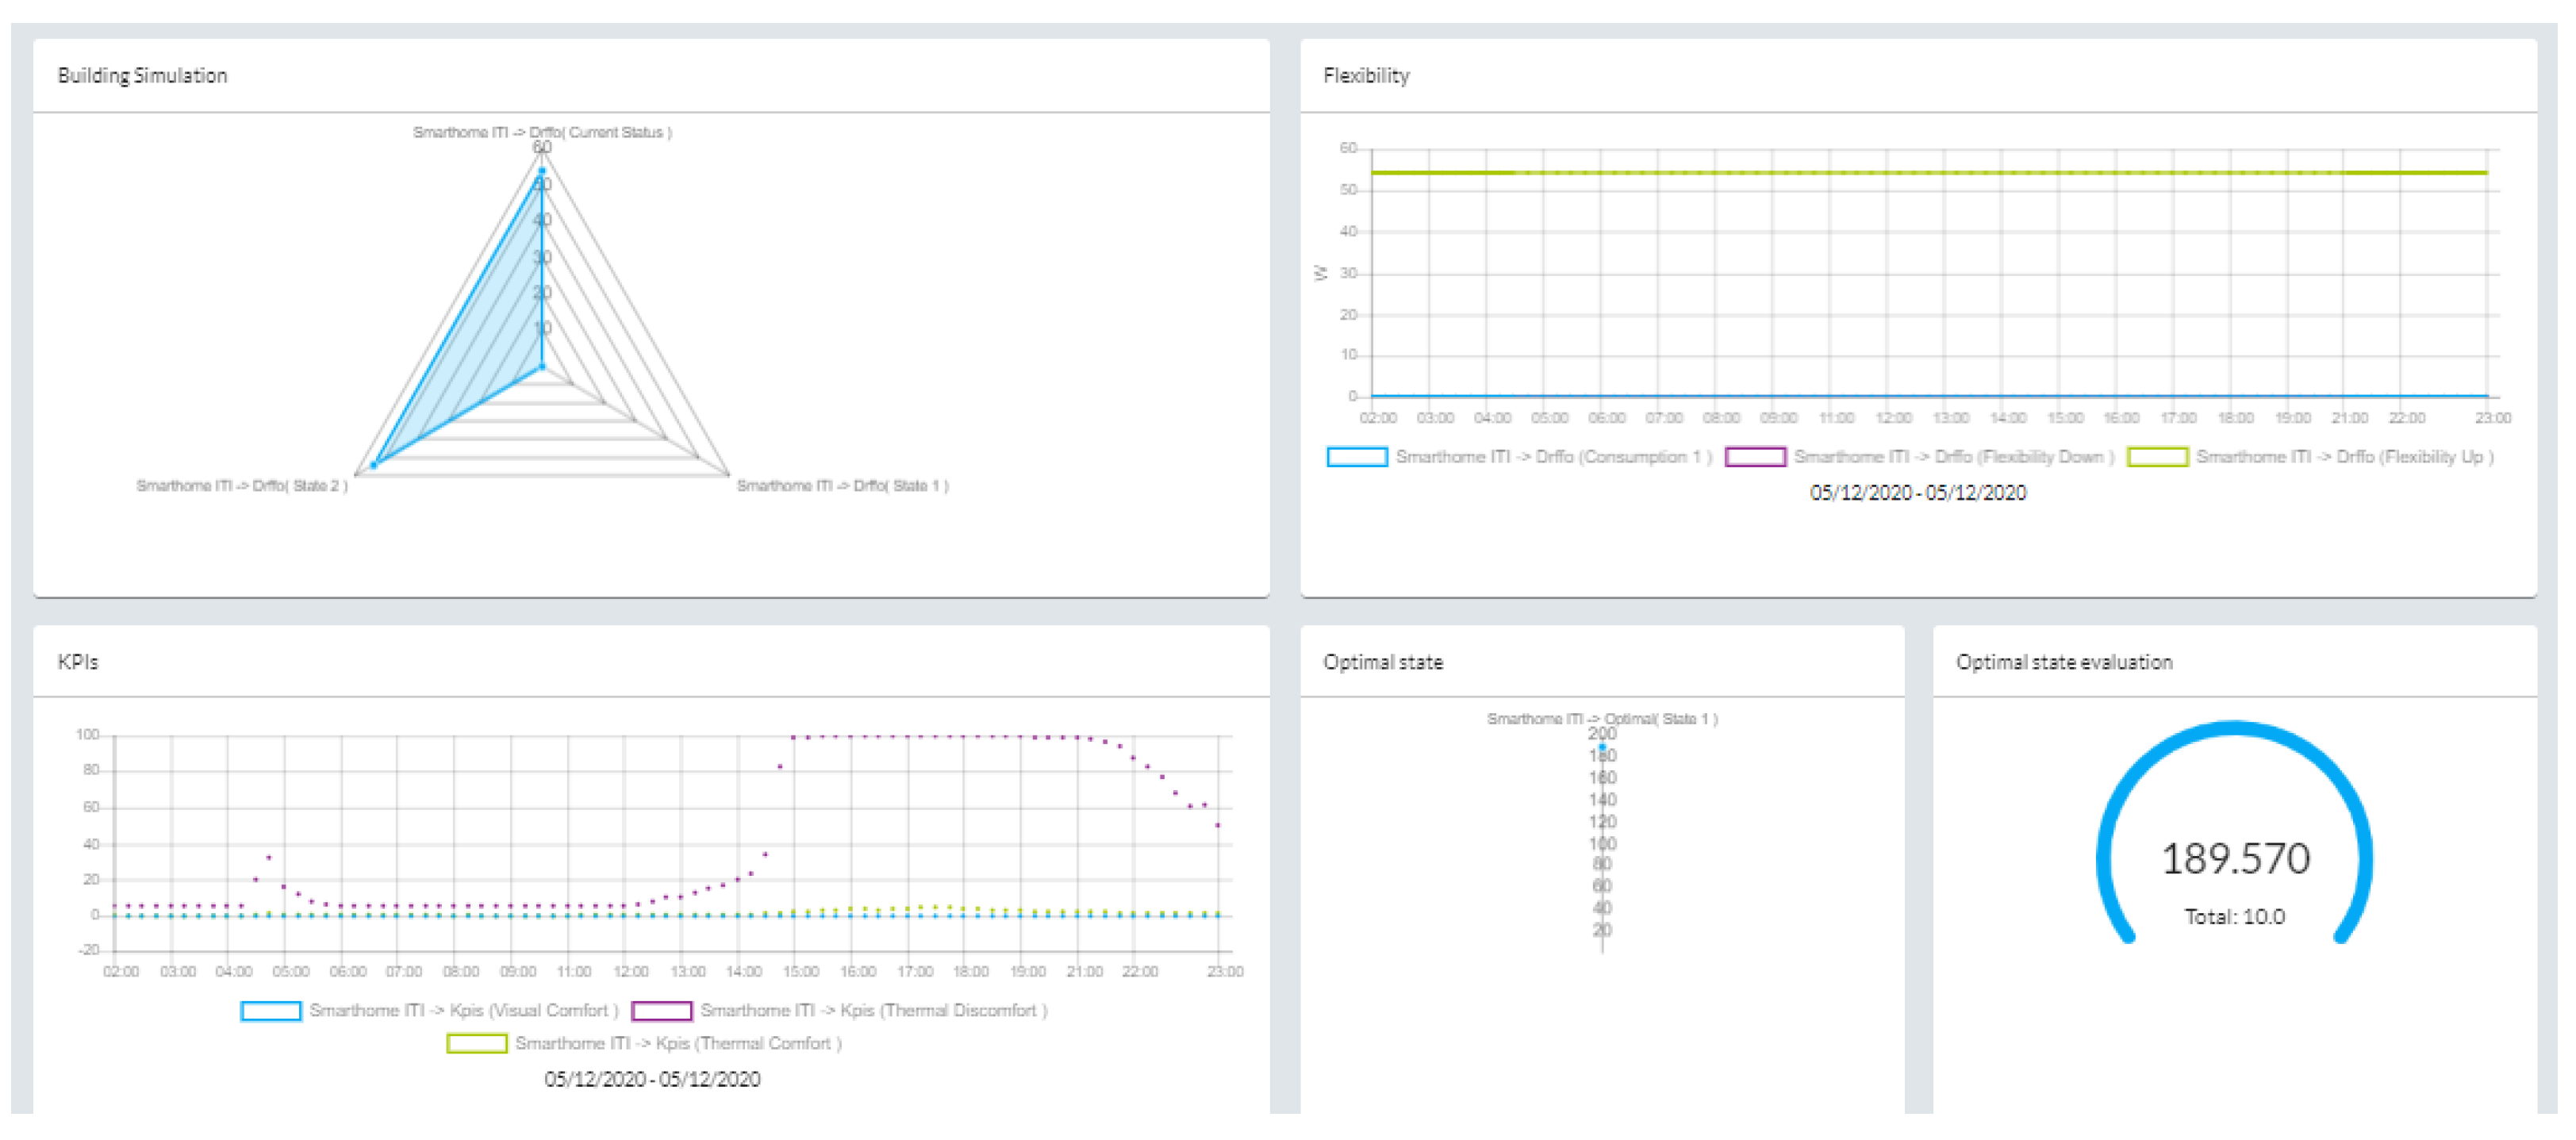
4.3. Validation Results: P-n-H Modules
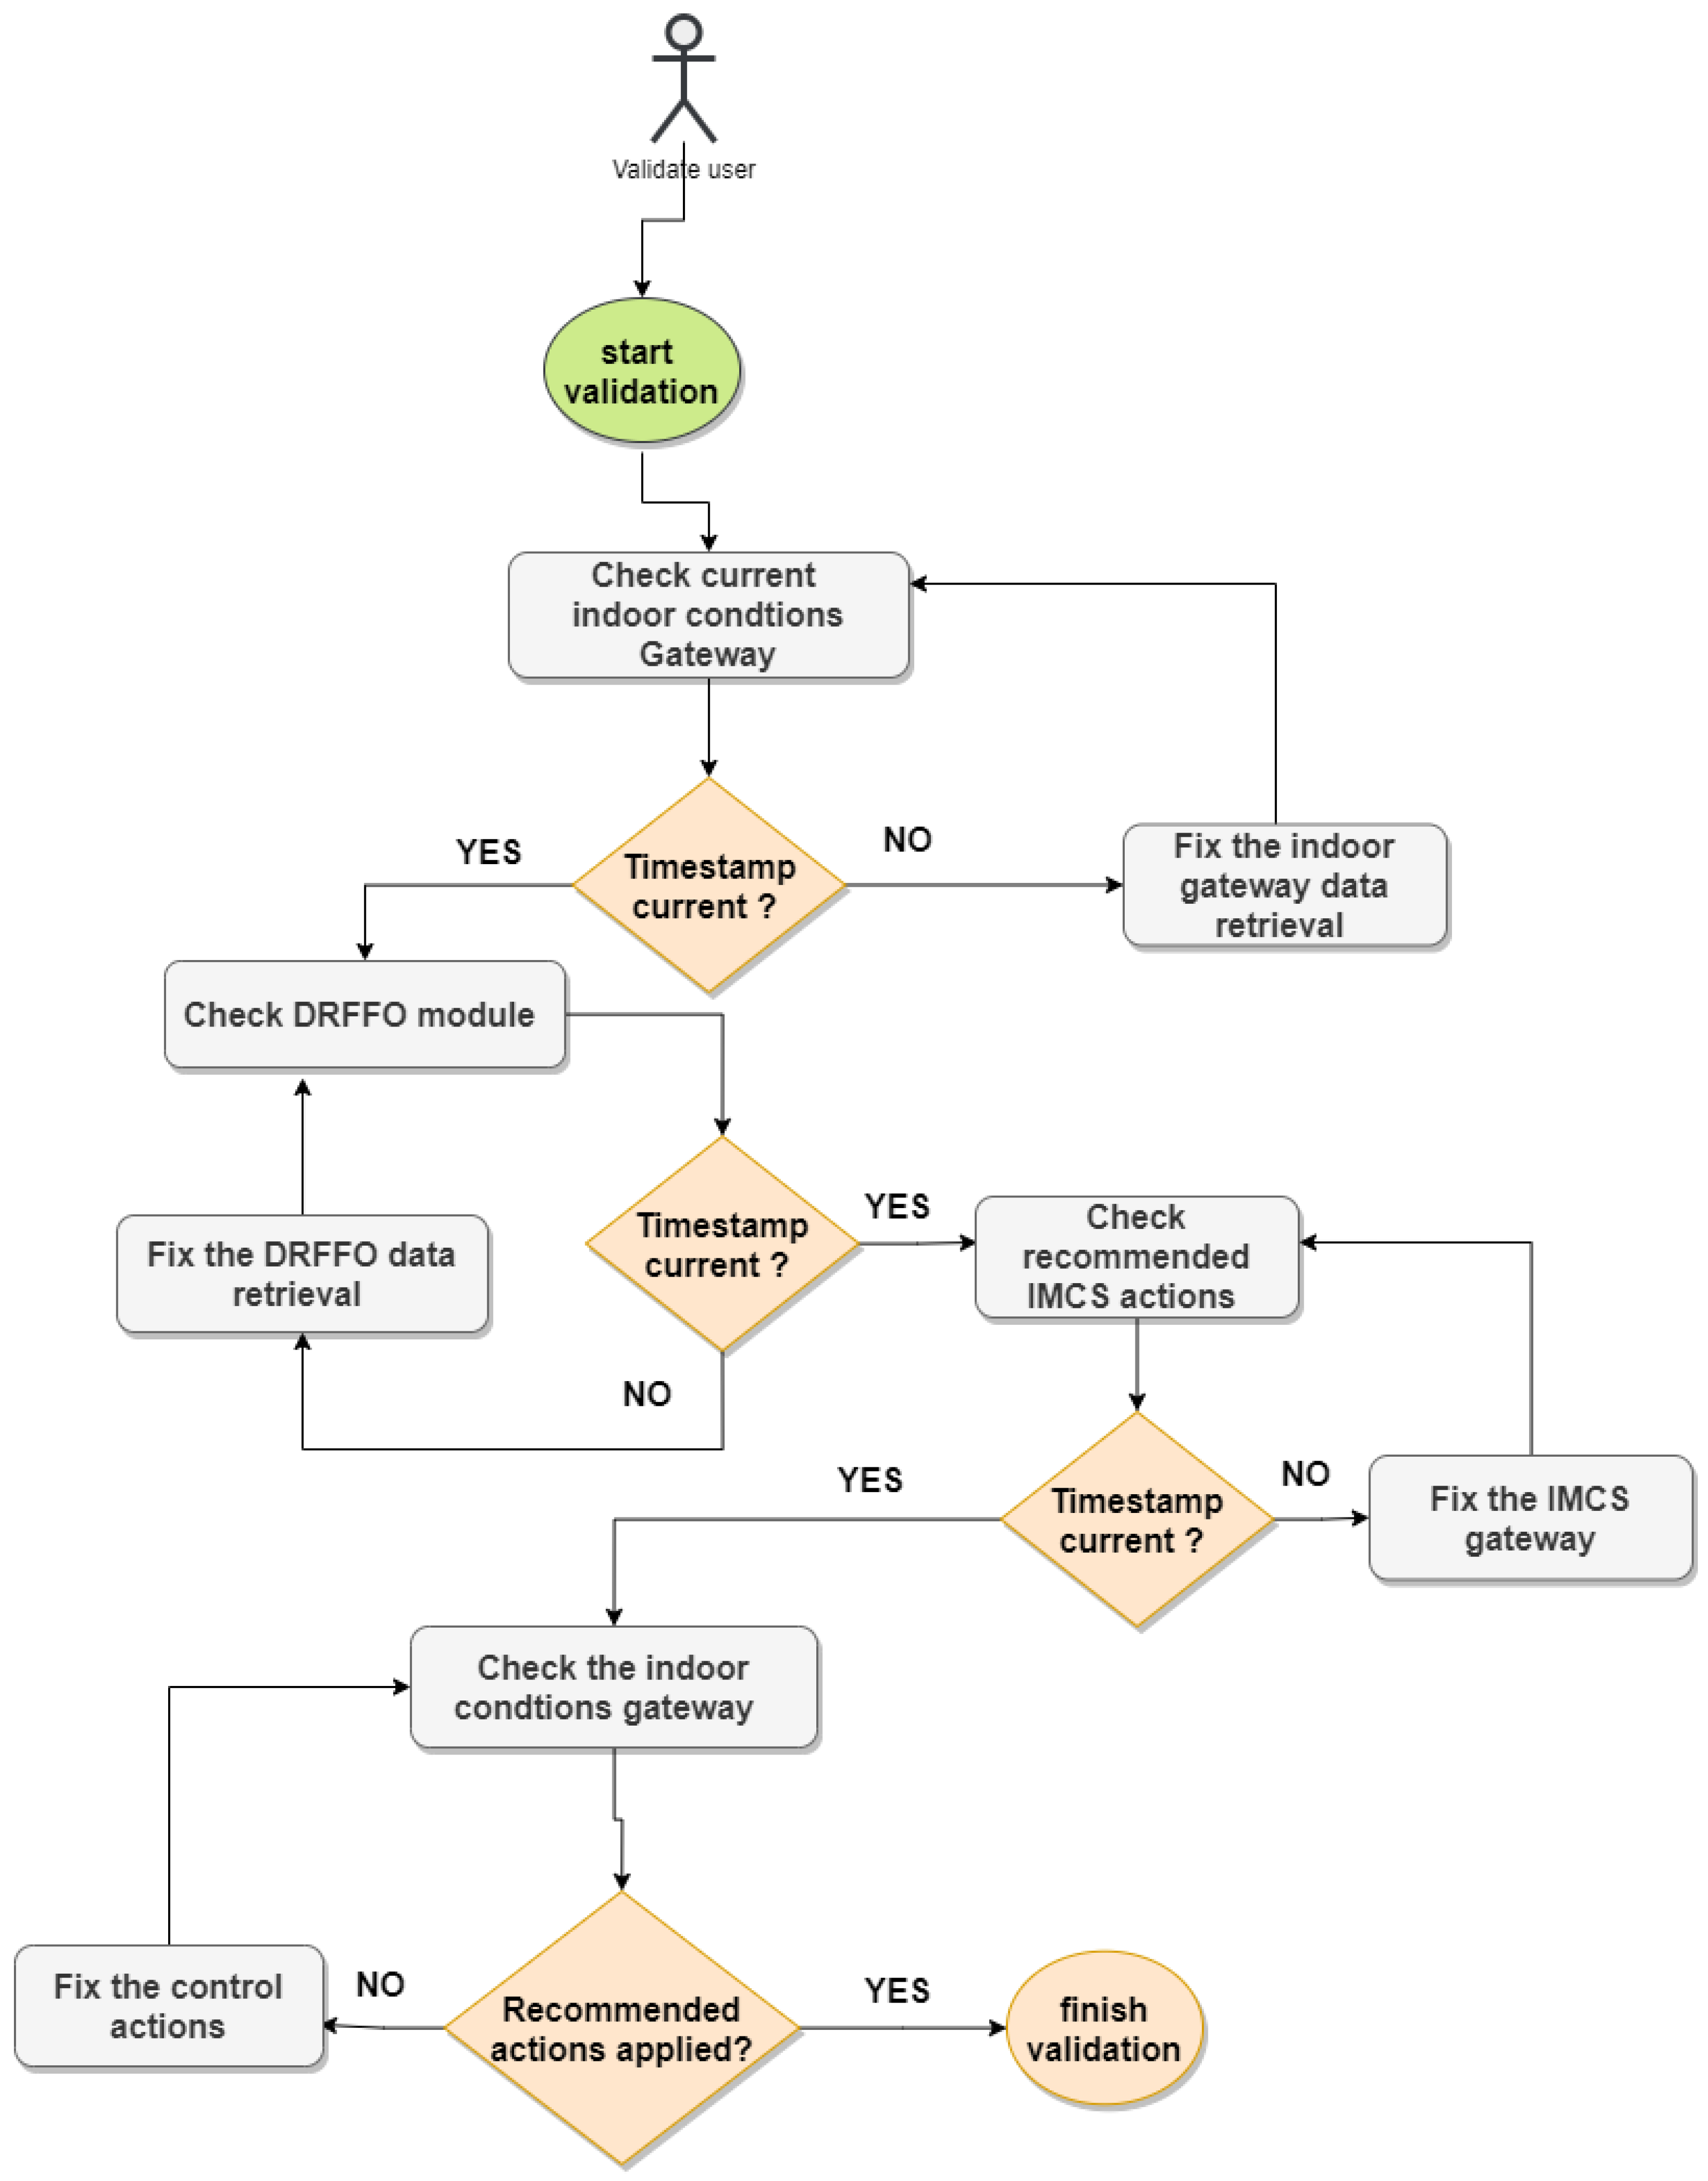
4.4. Validation Results: Intelligent Management Flow
5. Conclusions
Author Contributions
Funding
Institutional Review Board Statement
Informed Consent Statement
Acknowledgments
Conflicts of Interest
Abbreviations
| ADBE | Adaptable/Dynamic Building Envelopes |
| AMIs | Advanced Metering Infrastructures |
| DIY | Do It Yourself |
| EMSs | Energy Management Systems |
| RES | Renewable Energy Sources |
| BA | Building Automation |
| ICT | Information Communication Technologies |
| KOs | Key Objectives |
| P-n-H | PLUG-N-HARVEST |
| BEM | Building Energy Management |
| ADBEs | Adaptive Dynamic Building Envelops |
| CCBE | Conventional Controllable Building Elements |
| IoT | Internet of Things |
| IMCS | Intelligent Management and Control System |
| OEMS | Optimal Energy Management System |
| DRFFO | Demand Response Flexibility Forecasting and Optimization |
| DSOs | Distribution System Operators |
| BMS | Building Management System |
| SSM | Safety Security Mechanisms |
| TRLs | Technological Readiness Levels |
| JSON | JavaScript Object Notation |
| PMV | Predicted Mean Vote |
| PPD | Predicted Percentage of Dissatisfied |
| GUI | Graphical User Interface |
References
- Brambley, M.R.; Haves, P.; McDonald, S.C.; Torcellini, P.; Hansen, D.; Holmberg, D.; Roth, K.W. Advanced Sensors and Controls for Building Applications: Market Assessment and Potential R&D Pathways; Technical Report; EERE Publication and Product Library: Washington, DC, USA, 2005. Available online: https://www.osti.gov/servlets/purl/1217909 (accessed on 10 January 2022).
- EU-Commission. Progress by Member States towards Nearly Zero-Energy Buildings; European Commission: Brussels, Belgium, 2013. [Google Scholar]
- Paulou, J.; Lonsdale, J.; Jamieson, M.; Neuweg, I.; Trucco, P.; Maio, P.; Blom, M.; Warringa, G. Financing the Energy Renovation of Buildings with Cohesion Policy Funding; Technical Guidance; European Commission: Paris, France, 2014. [Google Scholar]
- Guan, X.; Xu, Z.; Jia, Q.S. Energy-Efficient Buildings Facilitated by Microgrid. IEEE Trans. Smart Grid 2010, 1, 243–252. Available online: https://ieeexplore.ieee.org/document/5628267 (accessed on 15 January 2022). [CrossRef]
- Pérez-Lombard, L.; Ortiz, J.; Pout, C. A review on buildings energy consumption information. Energy Build. 2008, 40, 394–398. [Google Scholar] [CrossRef]
- Domingues, P.; Carreira, P.; Vieira, R.; Kastner, W. Building automation systems: Concepts and technology review. Comput. Stand. Interfaces 2016, 45, 1–12. [Google Scholar] [CrossRef]
- Korkas, C.D.; Baldi, S.; Michailidis, P.; Kosmatopoulos, E.B. A Cognitive Stochastic Approximation Approach to Optimal Charging Schedule in Electric Vehicle Stations. In Proceedings of the 2017 25th Mediterranean Conference on Control and Automation (MED), Valletta, Malta, 3–6 July 2017; IEEE: Piscataway, NJ, USA, 2017; pp. 484–489. Available online: https://ieeexplore.ieee.org/document/7984164 (accessed on 18 January 2022).
- Korkas, C.D.; Terzopoulos, M.; Tsaknakis, C.; Kosmatopoulos, E.B. Nearly optimal demand side management for energy, thermal, EV and storage loads: An Approximate Dynamic Programming approach for smarter buildings. Energy Build. 2022, 255, 111676. [Google Scholar] [CrossRef]
- Kosmatopoulos, E.B.; Michailidis, I.; Korkas, C.D.; Ravanis, C. Local4Global Adaptive Optimization and Control for System-of-Systems. In Proceedings of the 2015 European Control Conference (ECC), Linz, Austria, 15–17 July 2015; IEEE: Piscataway, NJ, USA, 2015; pp. 3536–3541. Available online: https://ieeexplore.ieee.org/document/7331081 (accessed on 20 January 2022).
- Dimeas, A.L.; Hatziargyriou, N.D. Operation of a Multiagent System for Microgrid Control. IEEE Trans. Power Syst. 2005, 20, 1447–1455. Available online: https://ieeexplore.ieee.org/document/1490598 (accessed on 24 January 2022). [CrossRef]
- Wang, S. Intelligent Buildings and Building Automation; Routledge: New York, NY, USA, 2009. [Google Scholar] [CrossRef]
- Jung, M.; Reinisch, C.; Kastner, W. Integrating Building Automation Systems and ipv6 in the Internet of Things. In Proceedings of the 2012 Sixth International Conference on Innovative Mobile and Internet Services in Ubiquitous Computing, Palermo, Italy, 4–6 July 2012; IEEE: Piscataway, NJ, USA, 2012; pp. 683–688. Available online: https://ieeexplore.ieee.org/document/6296937 (accessed on 20 January 2022).
- Finch, E. Is IP Everywhere the Way Ahead for Building Automation? Facilities 2001, 19, 396–403. Available online: https://www.emerald.com/insight/content/doi/10.1108/02632770110403365/full/html (accessed on 20 January 2022). [CrossRef] [Green Version]
- Point, A.; Time, A. End-to-End Solutions with LONWORKS® Control Technology. Available online: https://link.springer.com/article/10.1007/s11370-018-00271-6 (accessed on 20 January 2022).
- Gershenfeld, N.; Cohen, D. Internet 0: Interdevice Internetworking-End-to-End Modulation for Embedded Networks. IEEE Circuits Devices Mag. 2006, 22, 48–55. Available online: https://ieeexplore.ieee.org/document/4049881 (accessed on 20 January 2022). [CrossRef]
- Bode, G.; Baranski, M.; Schraven, M.; Kümpel, A.; Storek, T.; Nürenberg, M.; Müller, D.; Rothe, A.; Ziegeldorf, J.H.; Fütterer, J.; et al. Cloud, Wireless Technology, Internet of Things: The Next Generation of Building Automation Systems. J. Phys. Conf. Ser. 2019, 1343, 12059. Available online: https://iopscience.iop.org/article/10.1088/1742-6596/1343/1/012059/meta (accessed on 20 January 2022).
- Zhang, X.; Adhikari, R.; Pipattanasomporn, M.; Kuzlu, M.; Rahman, S. Deploying IoT Devices to Make Buildings Smart: Performance Evaluation and Deployment Experience. In Proceedings of the 2016 IEEE 3rd World Forum on Internet of Things (WF-IoT), Reston, VA, USA, 12–14 December 2016; IEEE: Piscataway, NJ, USA, 2016; pp. 530–535. Available online: https://ieeexplore.ieee.org/document/7845464 (accessed on 20 January 2022).
- Schraven, M.; Guarnieri, C.; Baranski, M.; Müller, D.; Monti, A. Designing a development board for research on IoT applications in building automation systems. In Proceedings of the International Symposium on Automation and Robotics in Construction (ISARC), Banff, AB, Canada, 21–24 May 2019; IAARC Publications: Banff, AB, Canada, 2019; Volume 36, pp. 82–90. [Google Scholar] [CrossRef] [Green Version]
- Coates, A.; Hammoudeh, M.; Holmes, K.G. Internet of things for buildings monitoring: Experiences and challenges. In Proceedings of the International Conference on Future Networks and Distributed Systems, Cambridge, UK, 19–20 July 2017. [Google Scholar] [CrossRef] [Green Version]
- Lvovich, I.; Lvovich, Y.; Preobrazhenskiy, A.; Preobrazhenskiy, Y.; Choporov, O. Managing Developing Internet of Things Systems Based on Models and Algorithms of Multi-Alternative Aggregation. In Proceedings of the 2019 International Seminar on Electron Devices Design and Production (SED), Prague, Czech Republic, 23–24 April 2019; IEEE: Piscataway, NJ, USA, 2019; pp. 1–6. Available online: https://ieeexplore.ieee.org/document/8798413 (accessed on 16 January 2022).
- Minoli, D.; Sohraby, K.; Kouns, J. IoT Security (IoTSec) Considerations, Requirements, and Architectures. In Proceedings of the 2017 14th IEEE Annual Consumer Communications & Networking Conference (CCNC), Las Vegas, NV, USA, 8–11 January 2017; IEEE: Piscataway, NJ, USA, 2017; pp. 1006–1007. Available online: https://ieeexplore.ieee.org/document/7983271 (accessed on 17 January 2022).
- Marin-Perez, R.; Michailidis, I.T.; Garcia-Carrillo, D.; Korkas, C.D.; Kosmatopoulos, E.B.; Skarmeta, A. PLUG-N-HARVEST architecture for secure and intelligent management of near-zero energy buildings. Sensors 2019, 19, 843. [Google Scholar] [CrossRef] [PubMed] [Green Version]
- Hetemi, E.; Ordieres-Meré, J.; Nuur, C. An institutional approach to digitalization in sustainability-oriented infrastructure projects: The limits of the building information model. Sustainability 2020, 12, 3893. [Google Scholar] [CrossRef]
- Vasilopoulos, V.G.; Dimara, A.; Krinidis, S.; Almpanis, P.; Margaritis, N.; Nikolopoulos, N.; Ioannidis, D.; Tzovaras, D. An IoT M2M Architecture for BMS Using Multiple Connectivity Technologies: A Practical Approach. In Proceedings of the 2021 6th International Conference on Smart and Sustainable Technologies (SpliTech), Bol and Split, Croatia, 8–11 September 2021; IEEE: Piscataway, NJ, USA, 2021; pp. 1–6. Available online: https://ieeexplore.ieee.org/document/9566336 (accessed on 19 January 2022).
- ECMA. The JSON Data Interchange Syntax. 2017. Available online: http://www.ecma-international.org/publications/files/ECMA-ST/ECMA-404.pdf (accessed on 25 January 2022).
- How To: Create a Z-Wave Smart Home Hub Using a Raspberry Pi | Raspberry Pi HQ. Available online: http://raspberrypihq.com/how-to-create-a-z-wave-smart-home-hub-using-a-raspberry-pi/ (accessed on 17 January 2022).
- Teach, Learn, and Make with Raspberry Pi. Available online: https://www.raspberrypi.org/ (accessed on 17 January 2022).
- Li, J. Research and Application of Dynamic Load Balancing in MQTT Server. Softw. Eng. Appl. 2020, 9, 262–271. [Google Scholar] [CrossRef]
- Selander, G.; Mattsson, J.; Palombini, F.; Seitz, L. Object security for constrained restful environments. arXiv 2019, arXiv:2203.03450. [Google Scholar]
- Jose, B.; Abraham, S. Performance analysis of NoSQL and relational databases with MongoDB and MySQL. Mater. Today Proc. 2020, 24, 2036–2043. [Google Scholar] [CrossRef]
- Gangadhar, S.; Sowmya. The Real Time Environmental Time Series Data Analysis Using Influx DB. Int. J. Adv. Sci. Innov. 2020, 1, 780–783. [Google Scholar] [CrossRef]
- Novac, O.C.; Madar, D.E.; Novac, C.M.; Bujdosó, G.; Oproescu, M.; Gal, T. Comparative study of some applications made in the Angular and Vue. js frameworks. In Proceedings of the 2021 16th International Conference on Engineering of Modern Electric Systems (EMES), Oradea, Romania, 10–11 June 2021; IEEE: Piscataway, NJ, USA, 2021; pp. 1–4. [Google Scholar] [CrossRef]


| Requirement | Actions |
|---|---|
| Flexible integrated planning process | Integration of various communication protocol and actuators, seamless monitoring, interoperability. |
| Low-installation costs and operational cost | Remote web servers and cloud servers, minimization of equipment, minimum operational costs. |
| Optimal control of the different ADBE elements | Holistic building management operation, robust adaptive control designs. |
| Cost-efficient incorporation of new ADBE technologies | Easily implemented, low-cost, upgradable, and interoperable system. |
| Optimal Energy Management System | Contain buildings with highly different characteristics and usage, contain different types of occupants’ and financial capabilities, district aggregated information. |
| Connection and integration with various energy networks | Collection of data and aggregation of information from different power supply domains. |
| Shift demand among consumers and optimization of energy trading | Optimization of the energy trading between consumers, storage systems, and both the thermal and electrical grid. |
| District/Smart grid Cyber Security | Safety mechanisms with the cloud ecosystem, preservation of data quality and fault filtering. |
| Protection of the infrastructure elements | security framework, strongly and securely shielded BMS middleware platform |
| Support privacy for data collections in the IMCS/OEMS modules | Data privacy schema implementation within the BMS middleware. |
| Low-cost installations for IMCS | Wireless deployment of the necessary automation equipment, no local server for hosting the software ecosystem. |
| Reusable and recyclable materials | Careful material assessment both for the ADBE and the building automation devices, circular economy business model, and exploitation plan advance. |
| Maximum energy reductions and energy harvesting | Reduce the overall energy consumption, maximizing the harvested energy exploitation, and preserving indoor comfort. |
| Different modules of the P-n-H solution installation in different buildings | Several collaborating sub-modules. |
| Deployment and tests with many different real-life pilots | Wide range of building properties, diversity and versatility, scalable and reconfigurable standalone software tools. |
| Type | Description |
|---|---|
| Gateway: Zone Sensors | Group of data attributes originating from sensors installed per zone. |
| Gateway: Zones-Block Sensors | Group of data attributes originating from sensors installed per block of zones (or building) case. |
| Gateway: Zone Actuators | Group of data attributes originating from actuators installed per zone. |
| Gateway: Zones-Block Actuators | Group of data attributes originating from actuators installed per block of zones (or building) case. |
| Gateway: Optimization Criterion | Group of processed and aggregated data attributes originating from post-processing of the real-time data objects “Gateway: Zones-Block Sensors” and “Gateway: Zone Sensors” for calculating certain metrics and indices necessary for calculating the optimization criterion. |
| Gateway: WebSource | Group of data attributes originating from virtual/fictitious sensors retrieved from the web (e.g., virtual sensors for outdoor temperature prediction) per building case. |
| System Validation | ||||
|---|---|---|---|---|
| Actions | Timestamp | Result | Comments | |
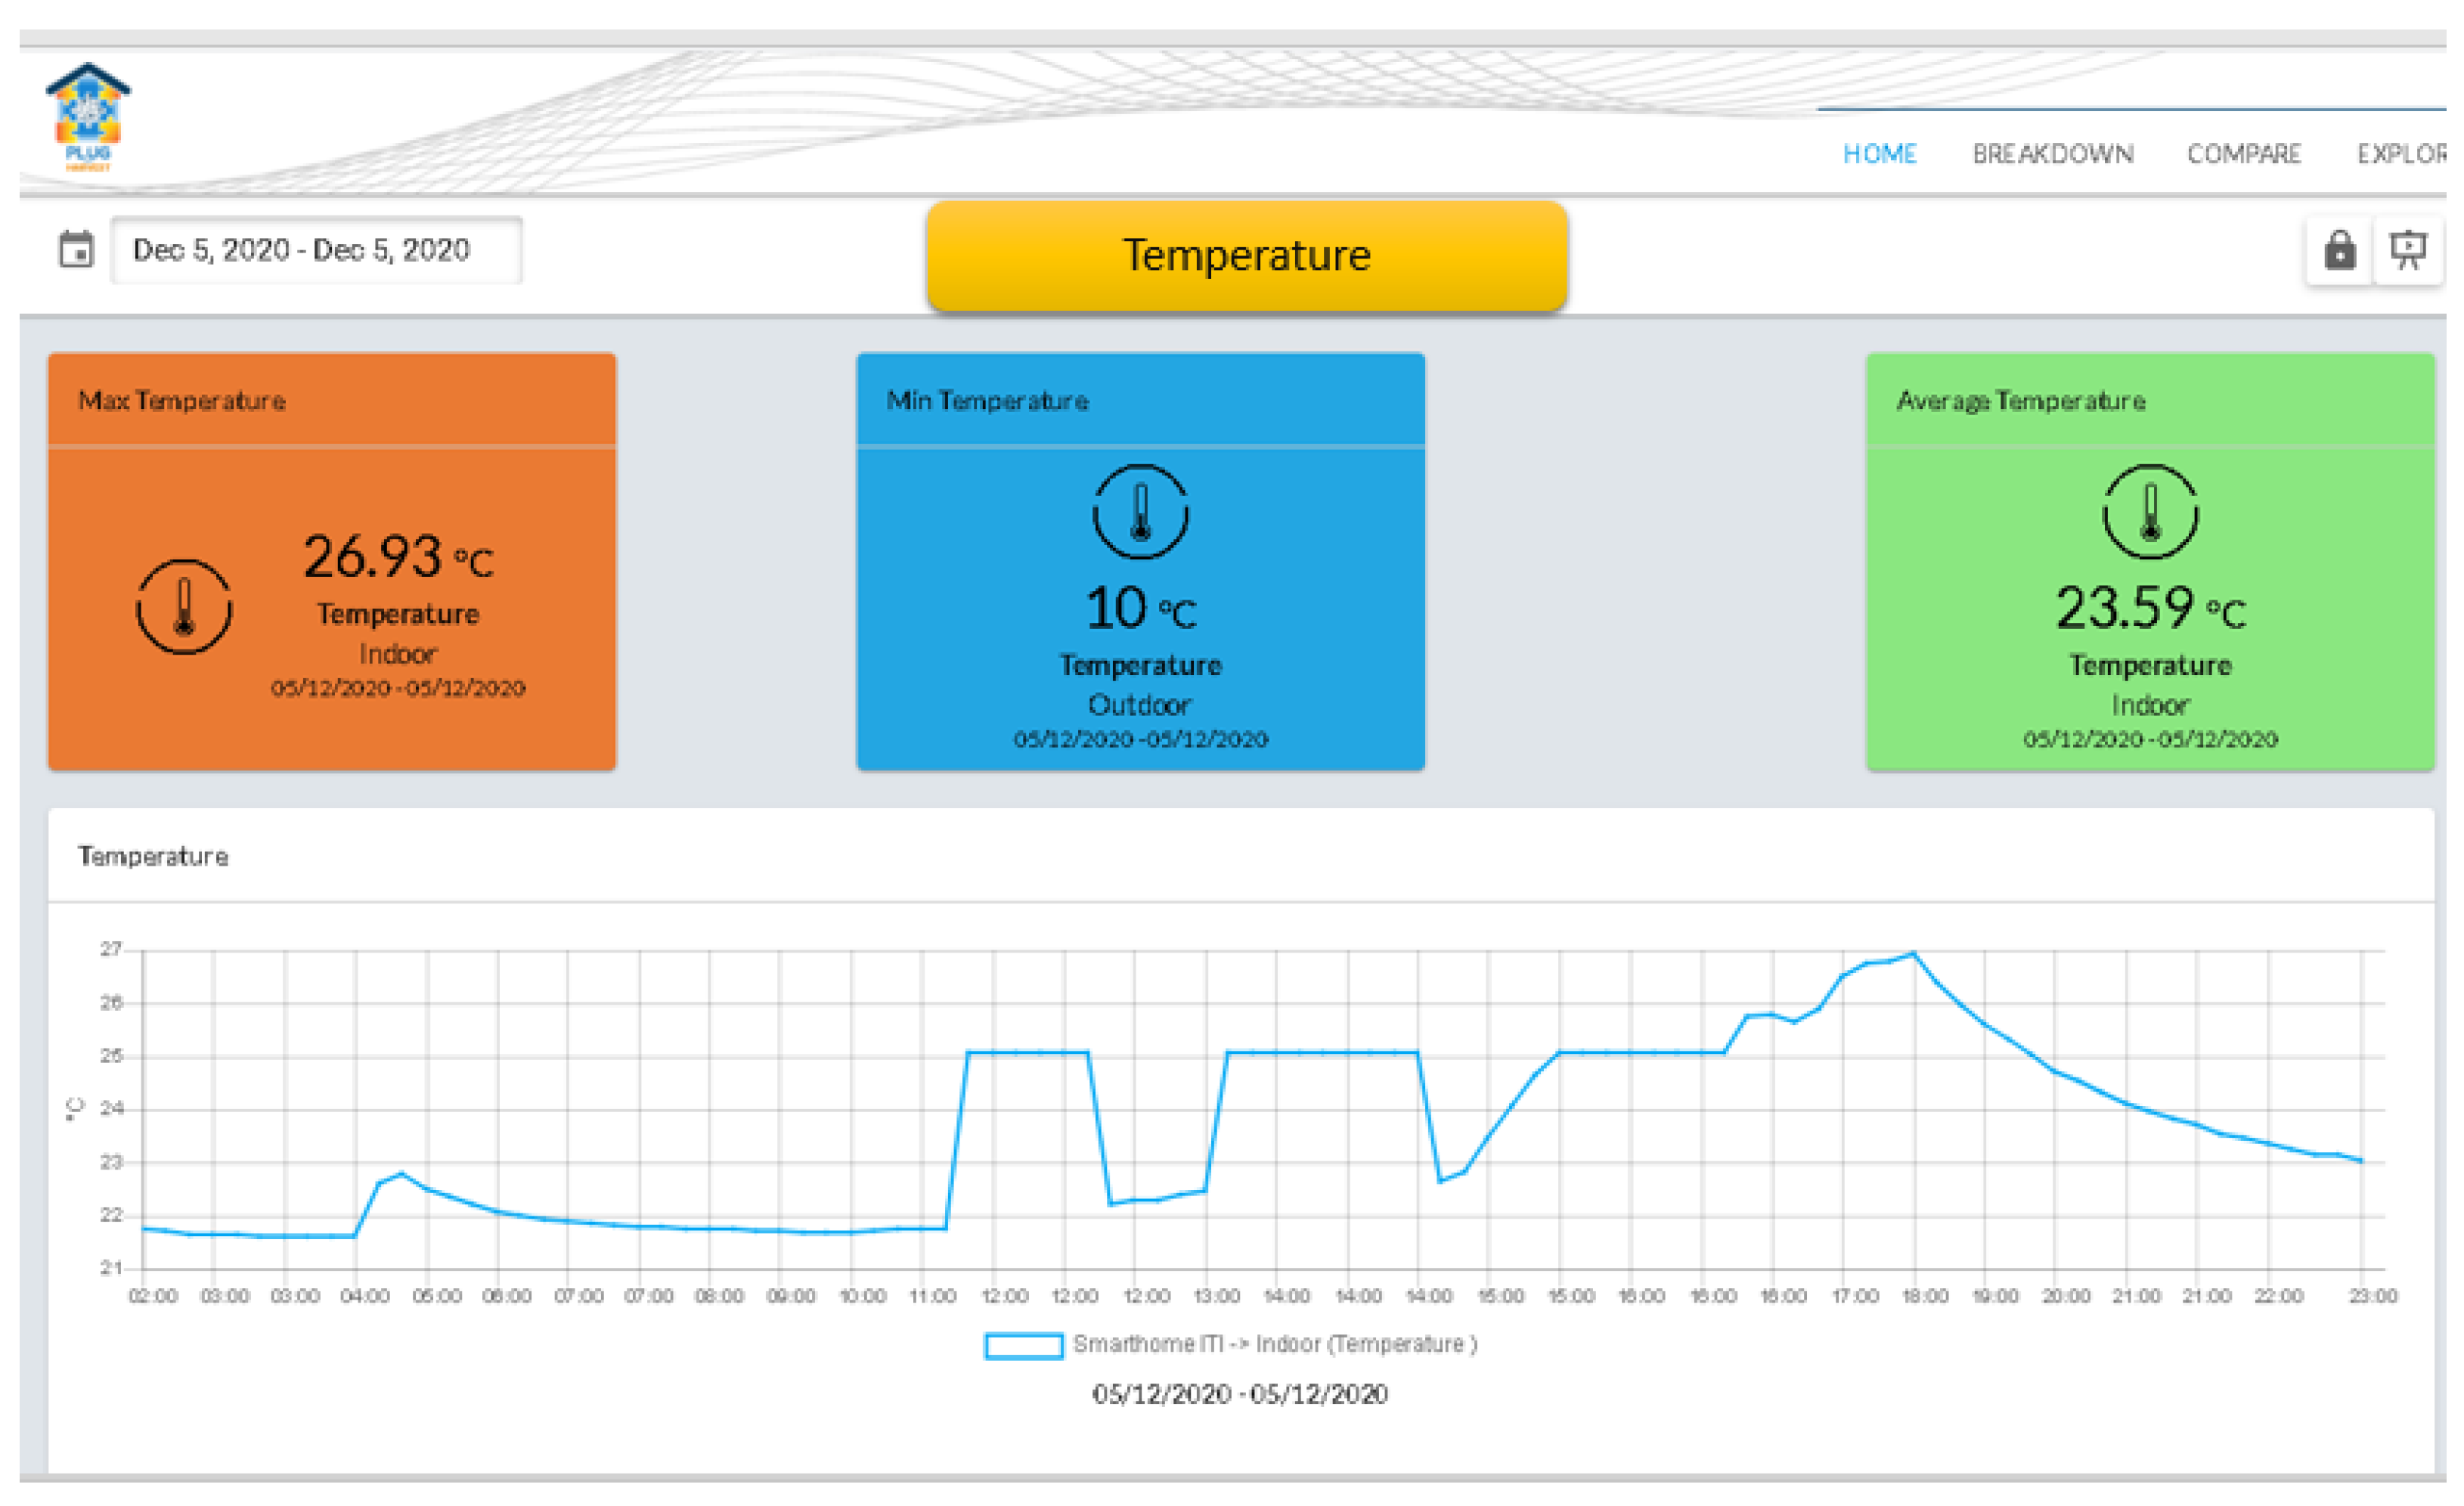
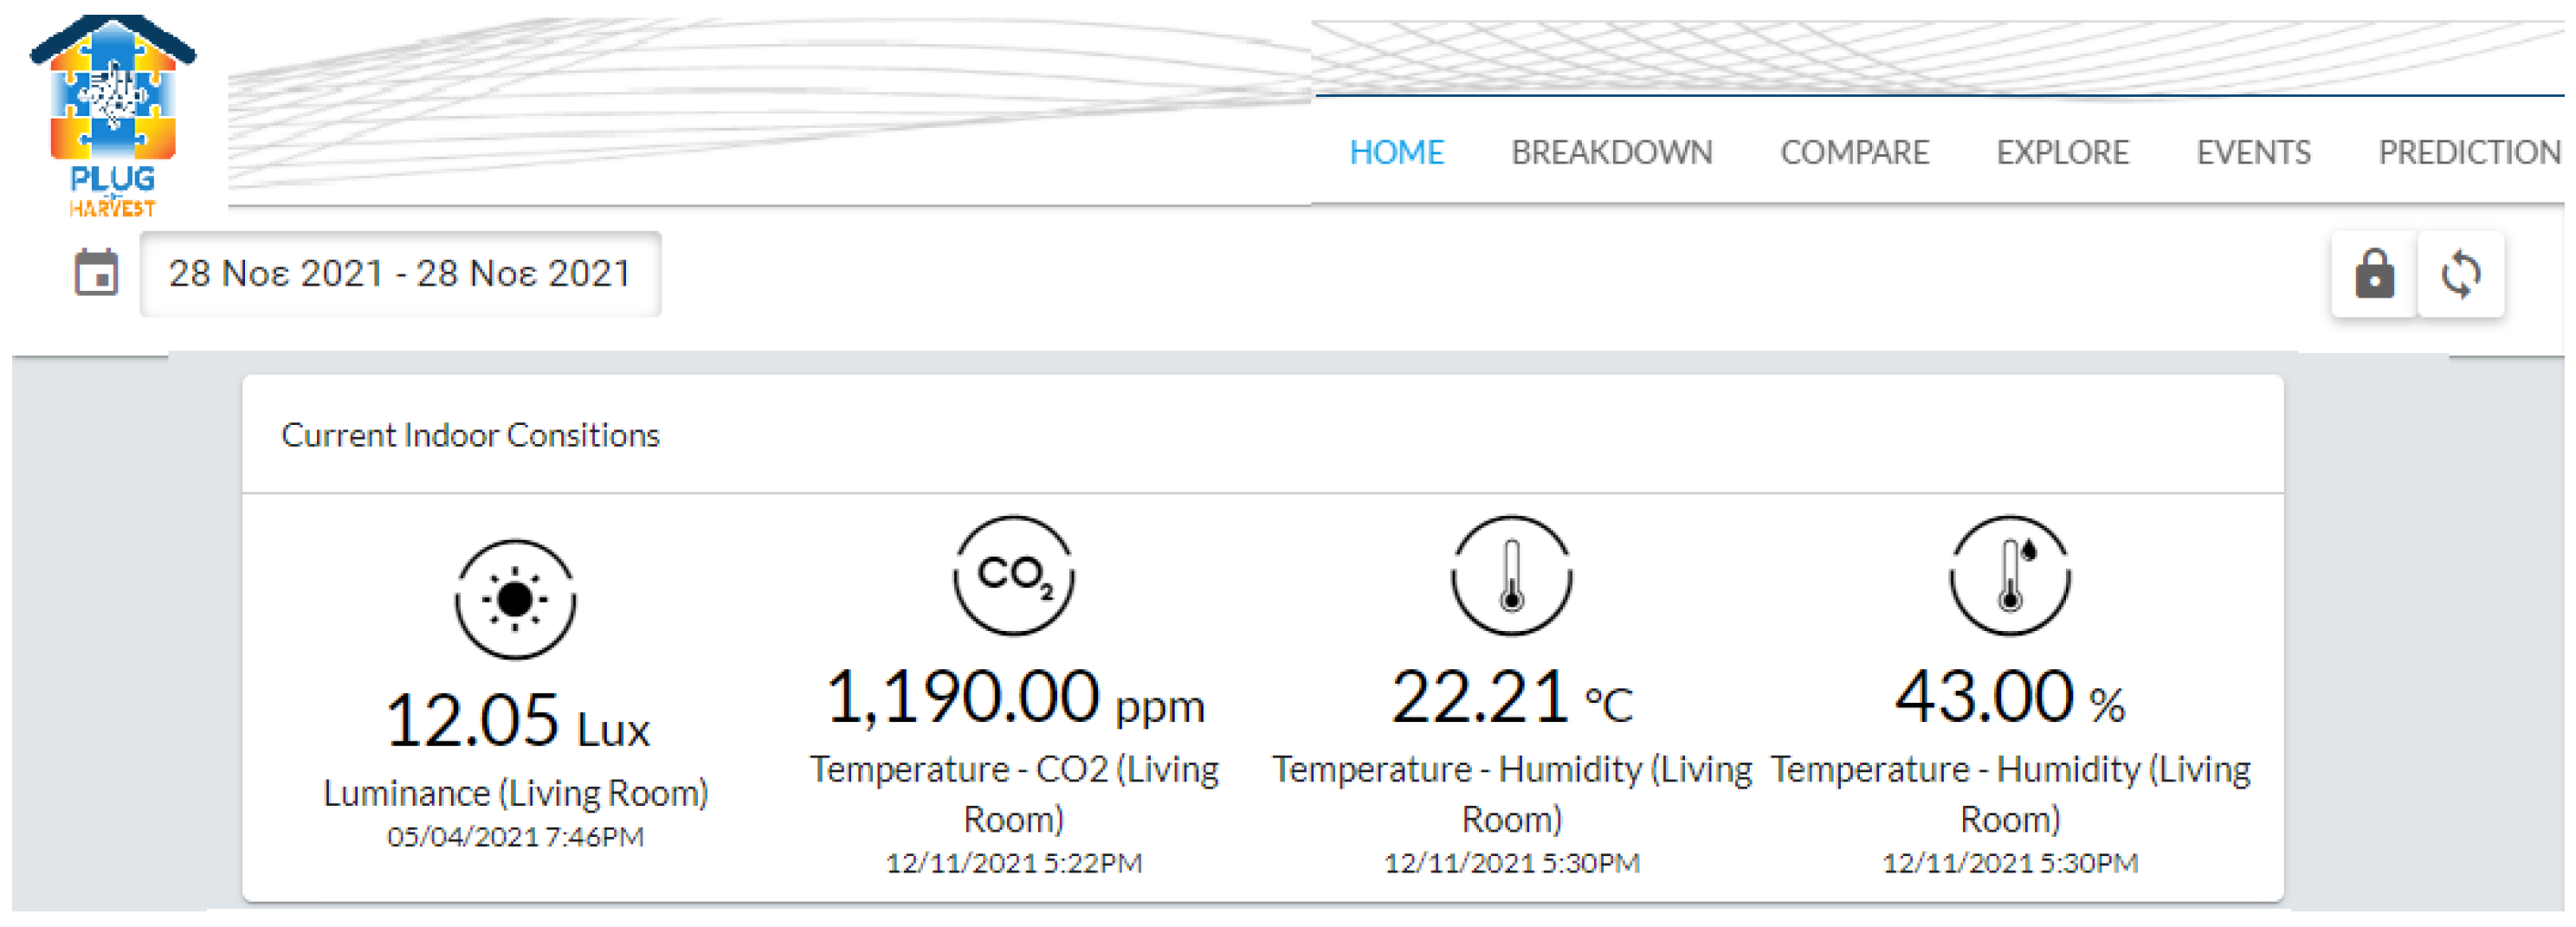
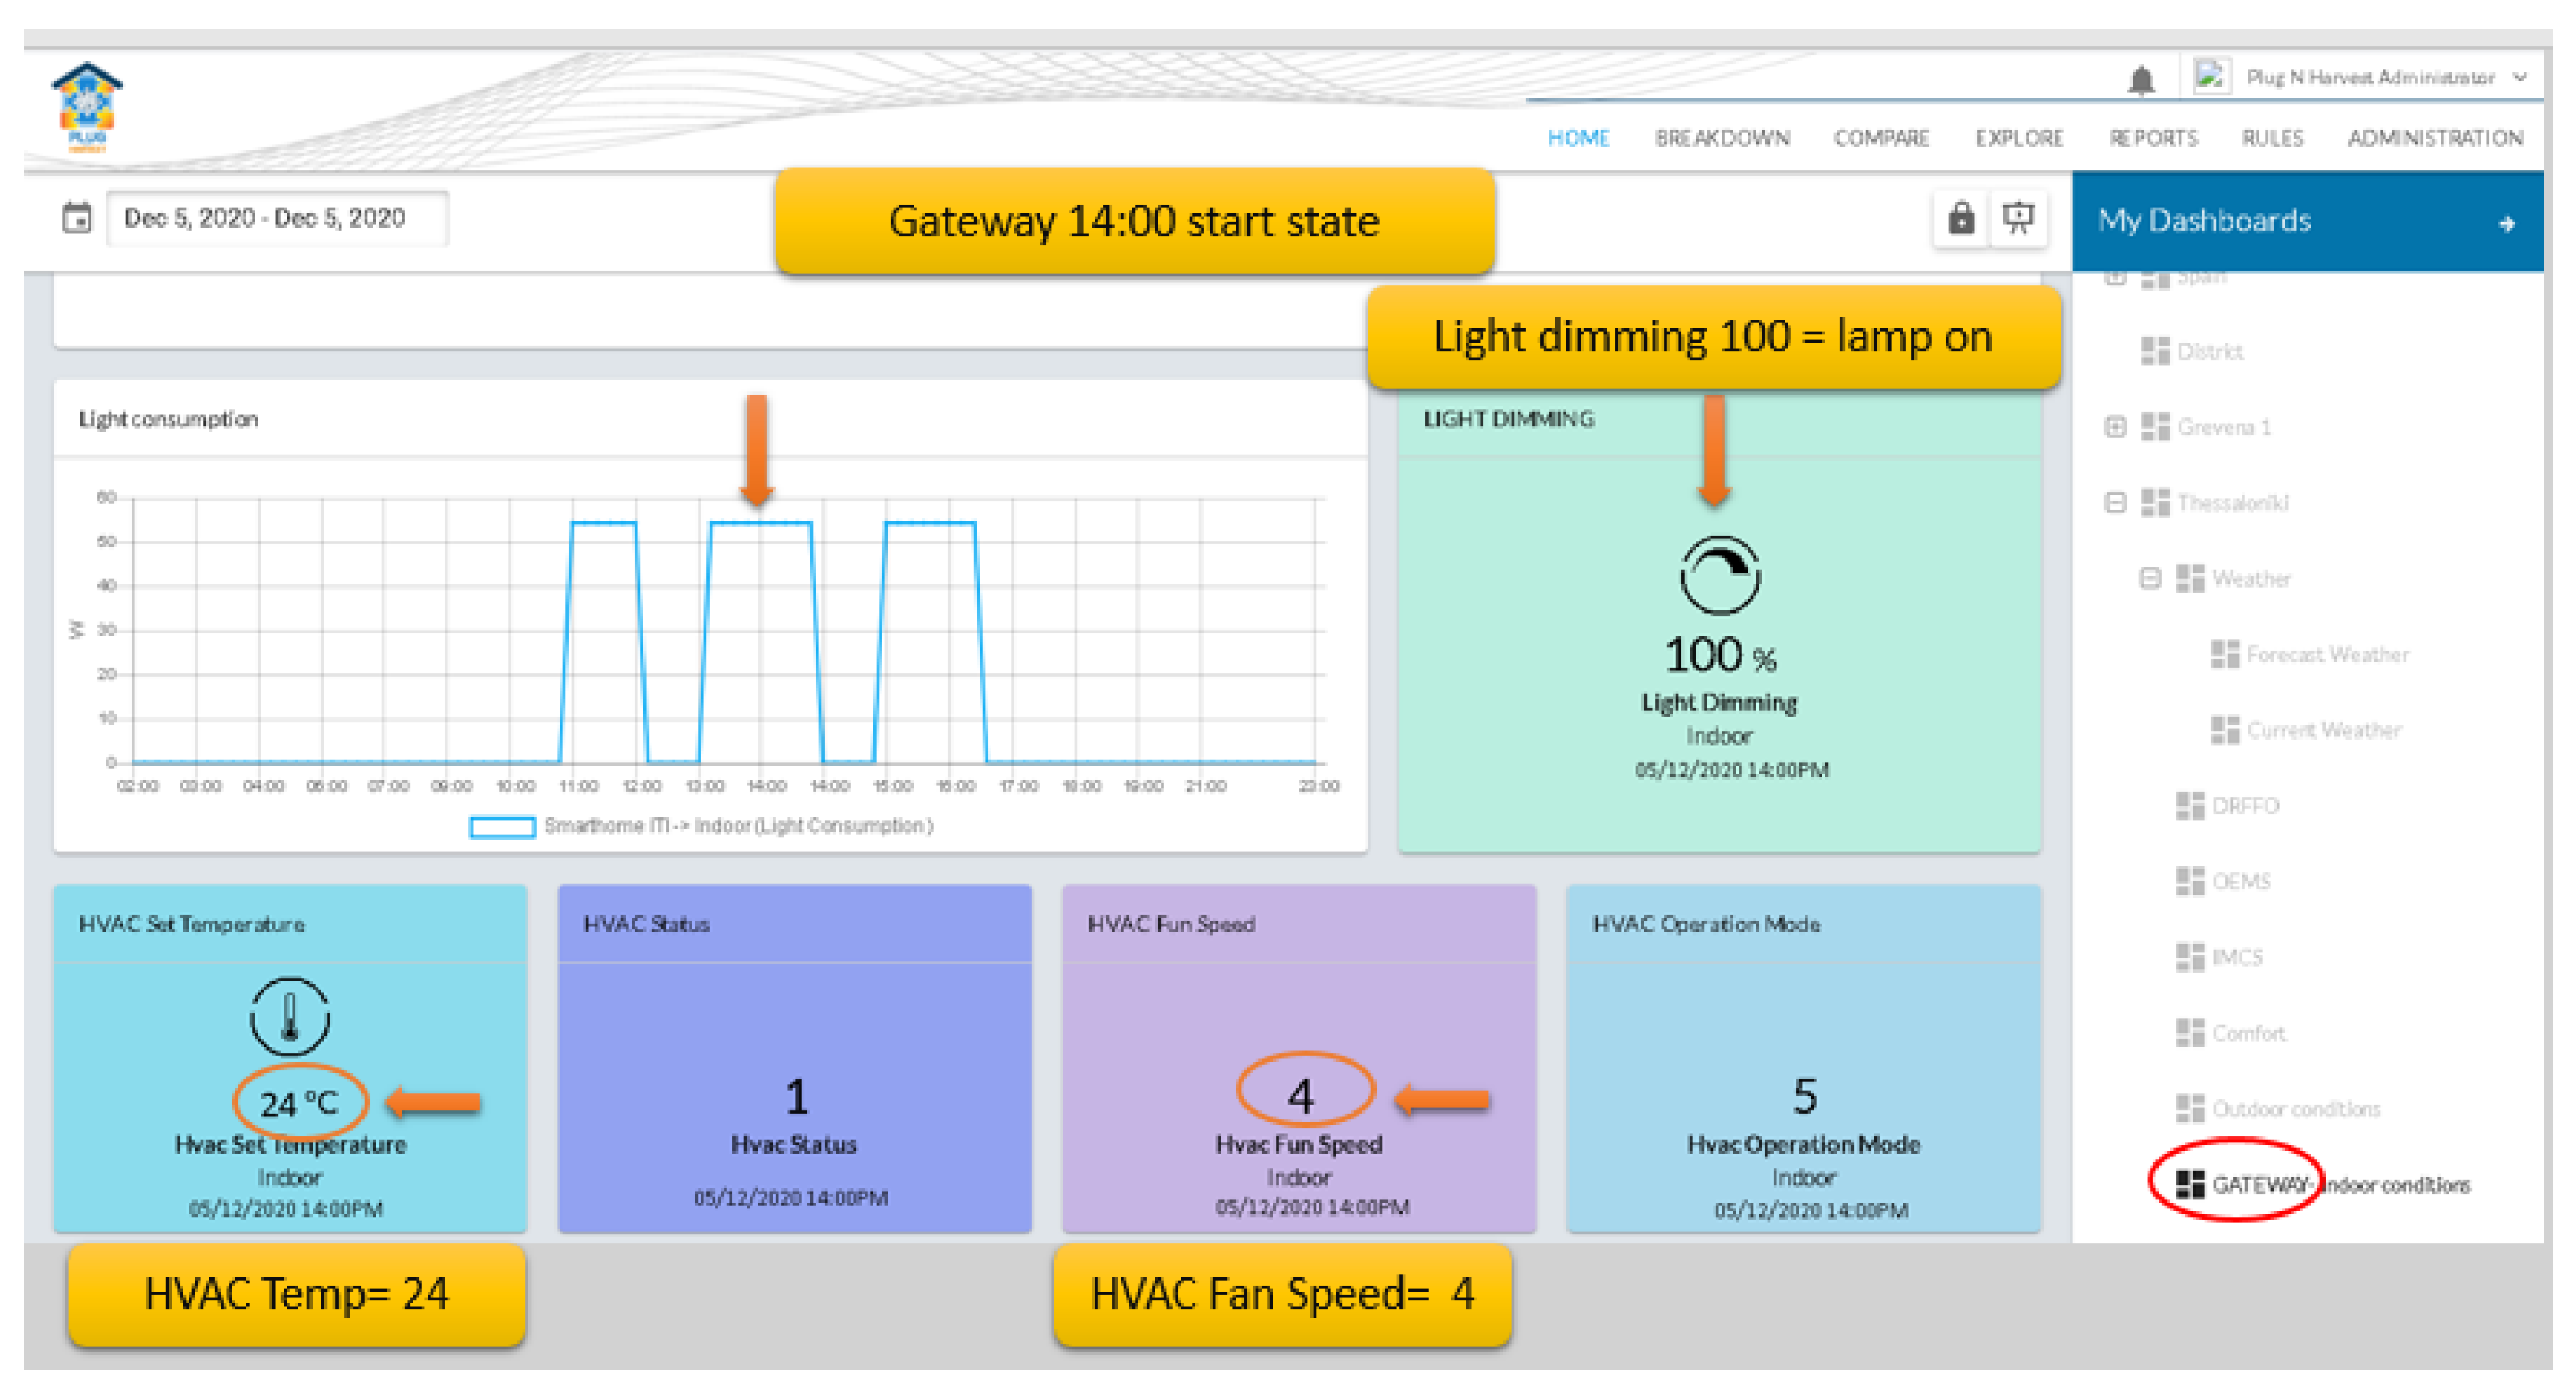
| 1 | Check current indoor conditions | current | Light dimming = 100 %, Light consumption = 54 W, HVAC set Temp = 24 , HVAC mode = 5, HVAC fan speed = 4 | successful |
| 2 | Check DRFFO module | current | Building simulation: current state: lights on state1 = lights off state2 = lights off Optimal state: STATE 1 | successful |
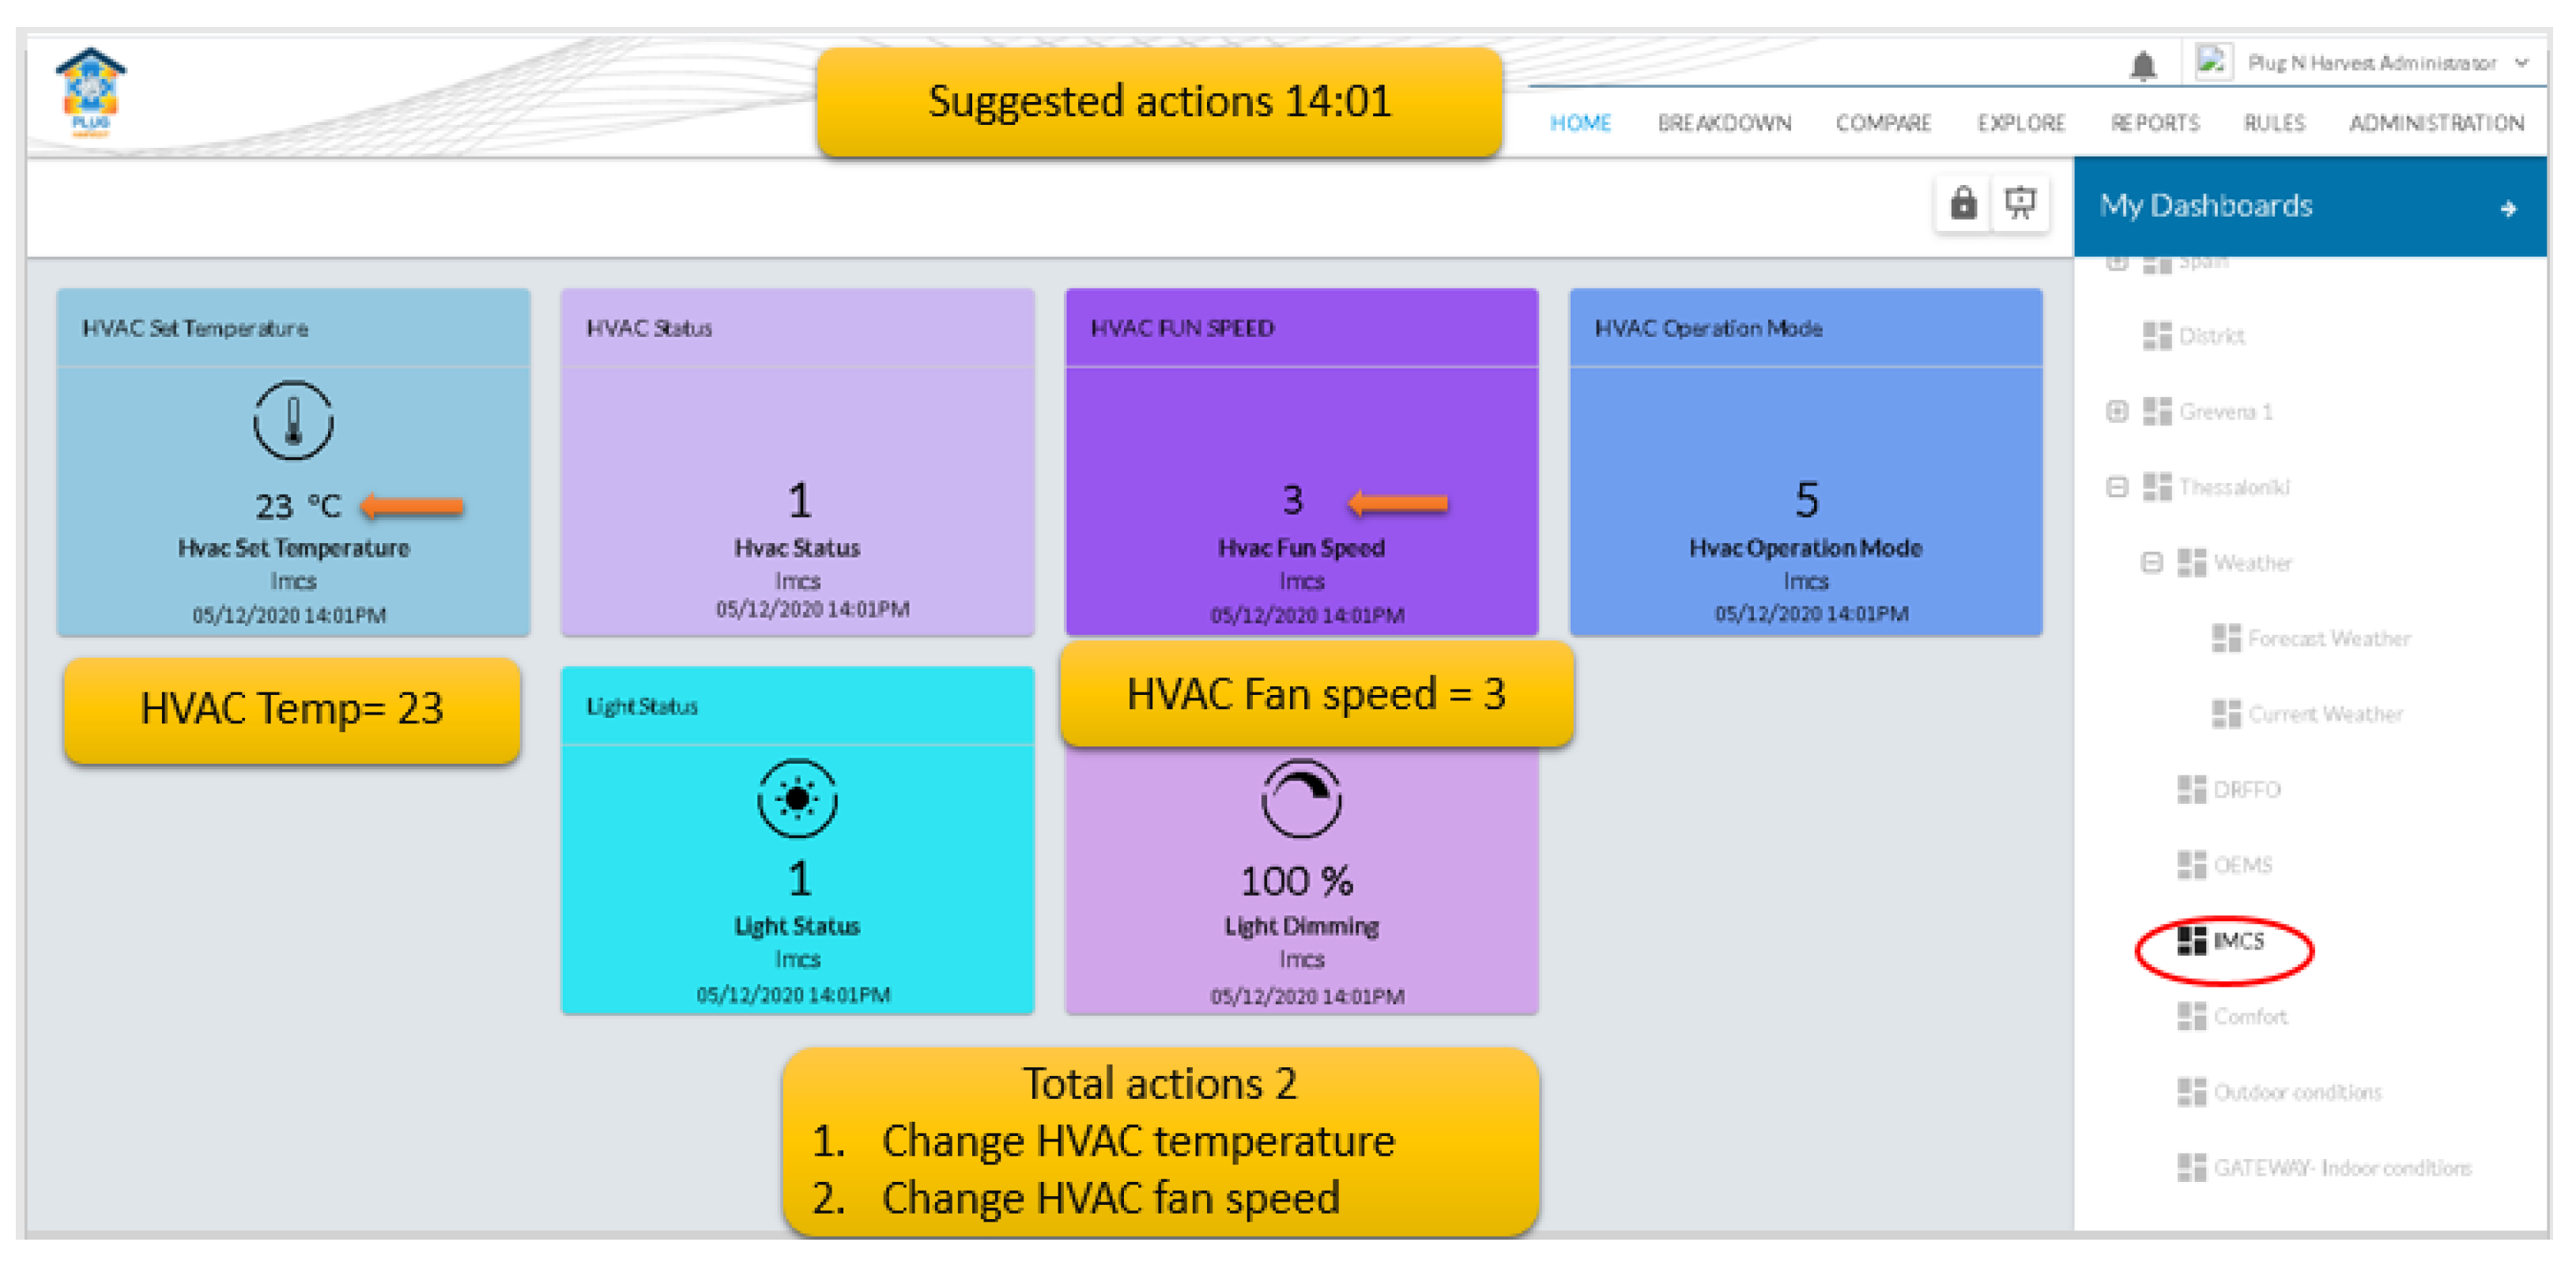
| 3 | Check IMCS | current | HVAC set Temp = 23 , HVAC mode = 5, HVAC fan speed = 3 | successful |
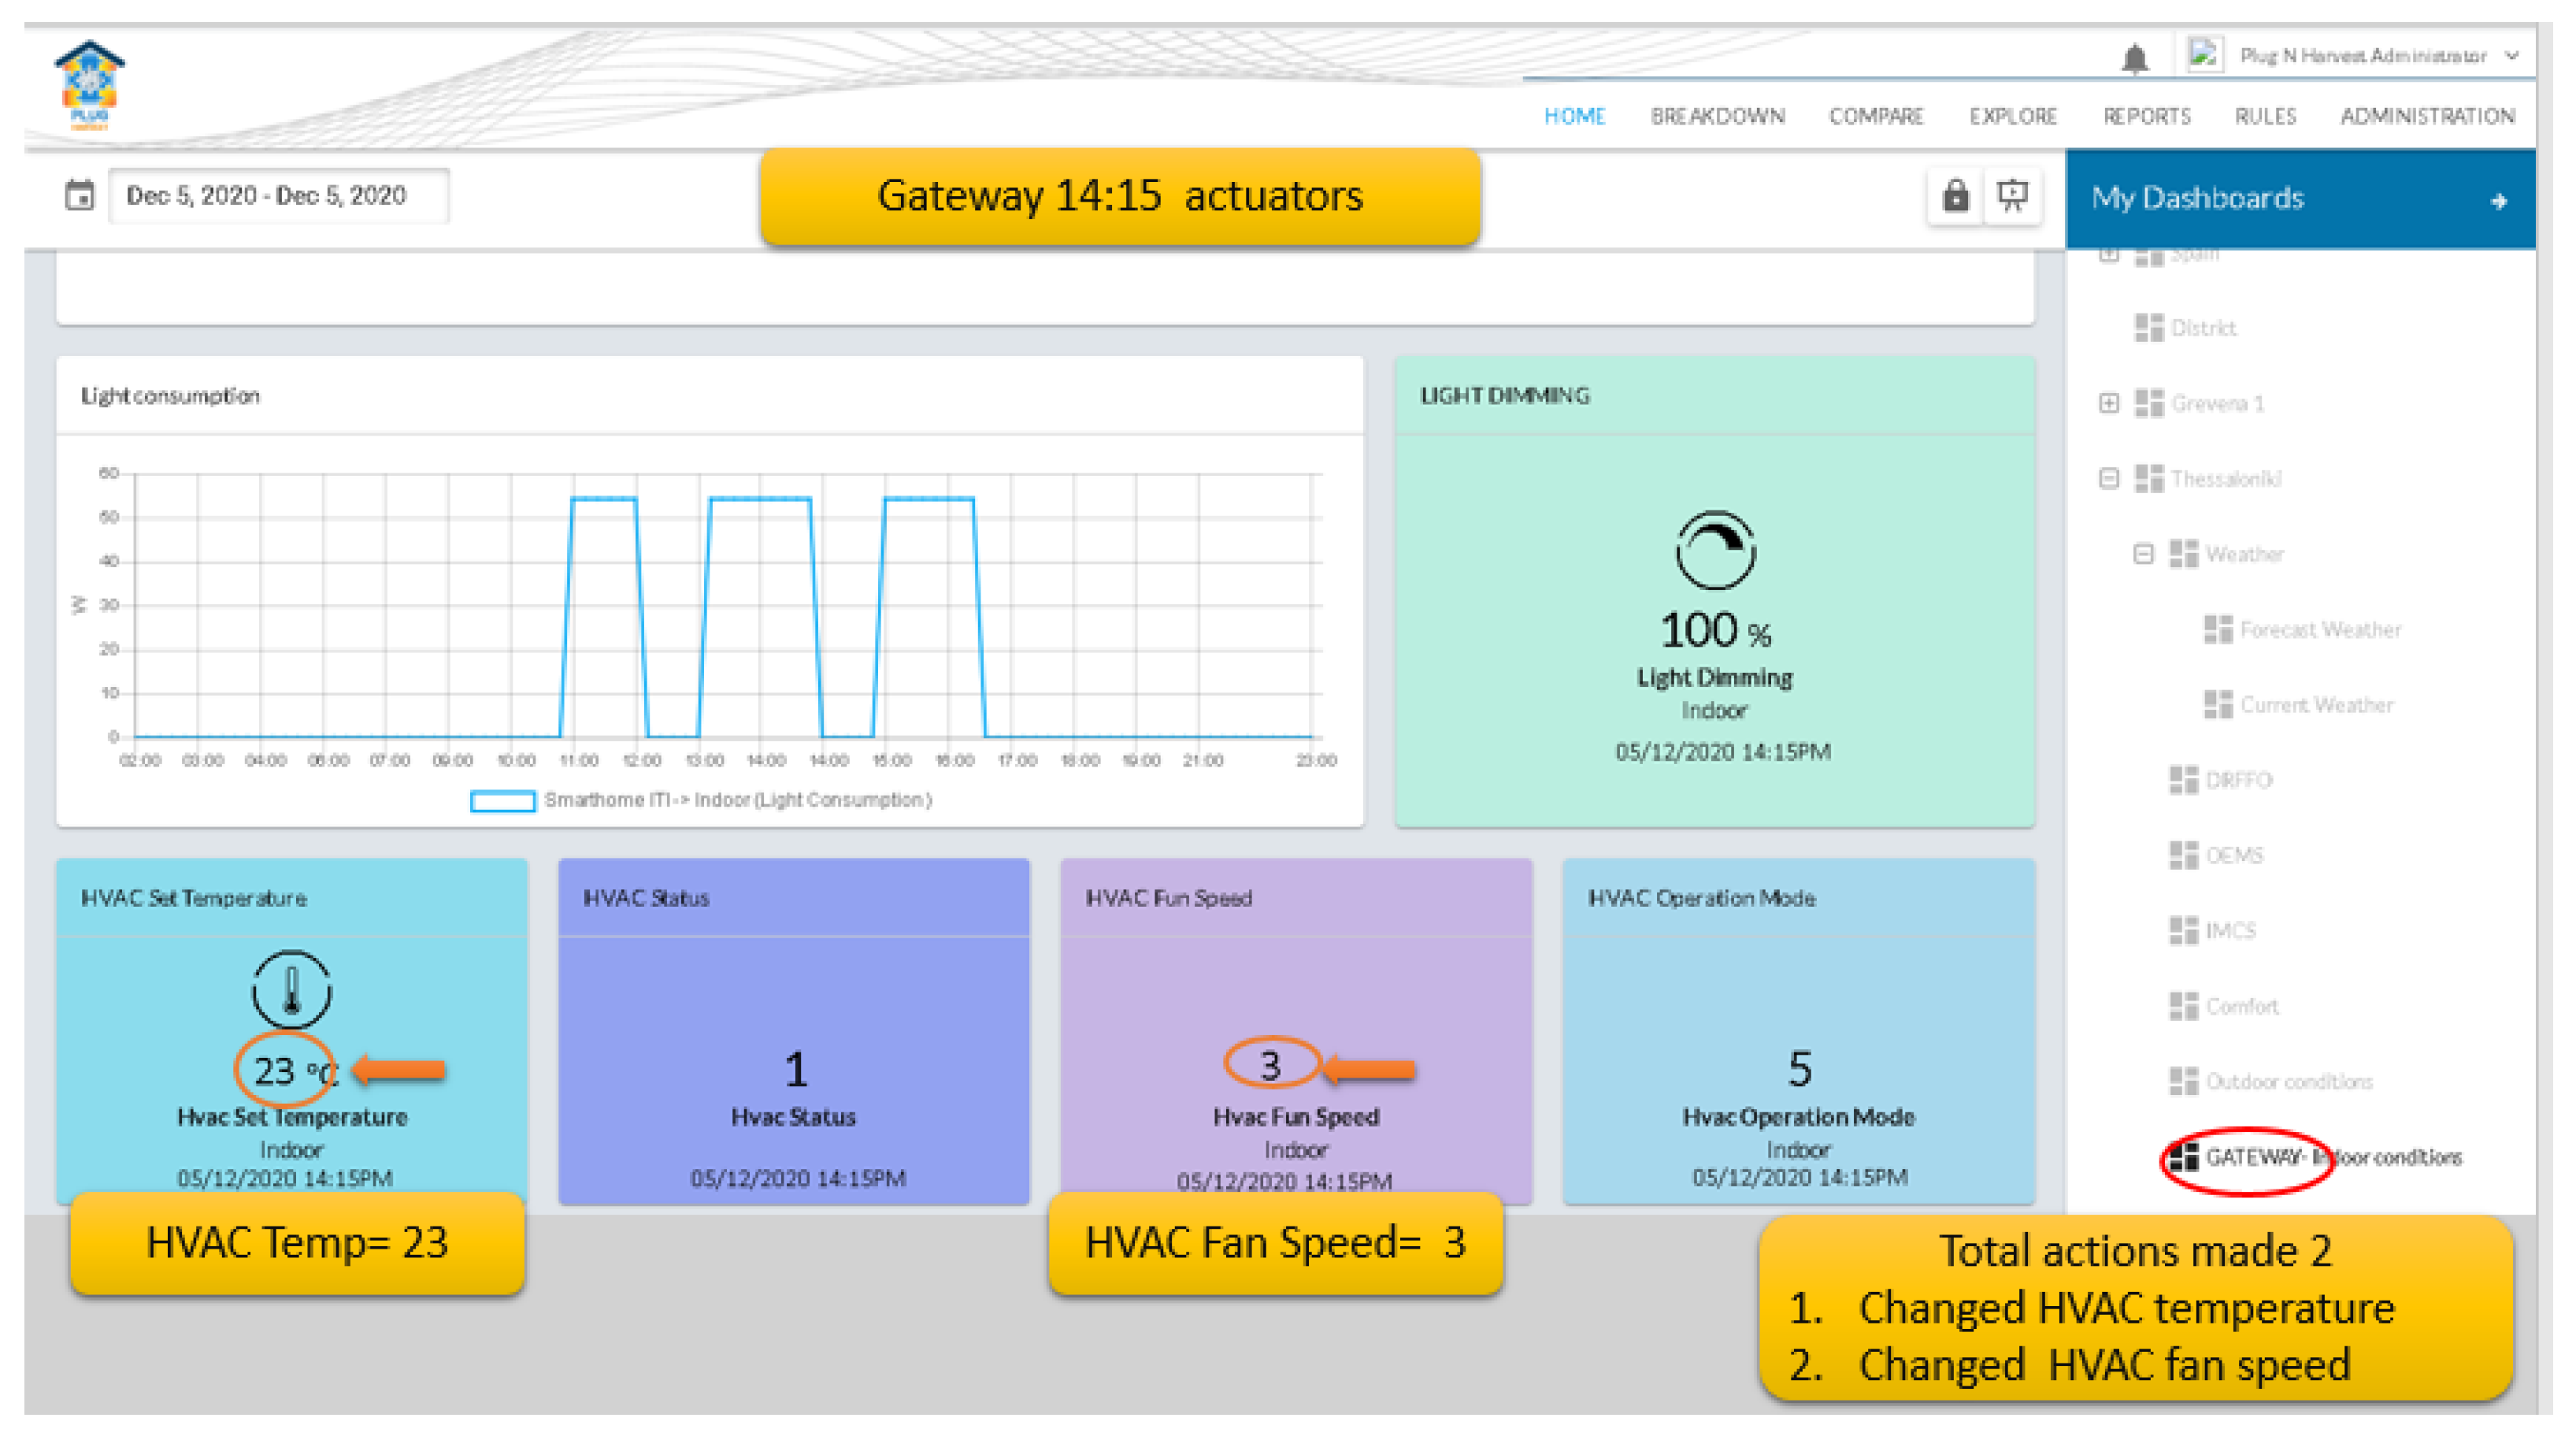
| 4 | Check next quarter indoor conditions | current | Light dimming = 100 %, Light consumption = 54 W, HVAC set Temp = 23 , VAC mode = 5 , VAC fan speed = 3 | successful |
| Overall assessment | successful | |||
Publisher’s Note: MDPI stays neutral with regard to jurisdictional claims in published maps and institutional affiliations. |
© 2022 by the authors. Licensee MDPI, Basel, Switzerland. This article is an open access article distributed under the terms and conditions of the Creative Commons Attribution (CC BY) license (https://creativecommons.org/licenses/by/4.0/).
Share and Cite
Korkas, C.; Dimara, A.; Michailidis, I.; Krinidis, S.; Marin-Perez, R.; Martínez García, A.I.; Skarmeta, A.; Kitsikoudis, K.; Kosmatopoulos, E.; Anagnostopoulos, C.-N.; et al. Integration and Verification of PLUG-N-HARVEST ICT Platform for Intelligent Management of Buildings. Energies 2022, 15, 2610. https://doi.org/10.3390/en15072610
Korkas C, Dimara A, Michailidis I, Krinidis S, Marin-Perez R, Martínez García AI, Skarmeta A, Kitsikoudis K, Kosmatopoulos E, Anagnostopoulos C-N, et al. Integration and Verification of PLUG-N-HARVEST ICT Platform for Intelligent Management of Buildings. Energies. 2022; 15(7):2610. https://doi.org/10.3390/en15072610
Chicago/Turabian StyleKorkas, Christos, Asimina Dimara, Iakovos Michailidis, Stelios Krinidis, Rafael Marin-Perez, Ana Isabel Martínez García, Antonio Skarmeta, Konstantinos Kitsikoudis, Elias Kosmatopoulos, Christos-Nikolaos Anagnostopoulos, and et al. 2022. "Integration and Verification of PLUG-N-HARVEST ICT Platform for Intelligent Management of Buildings" Energies 15, no. 7: 2610. https://doi.org/10.3390/en15072610