
Phase Behavior of Carbon Dioxide + Isobutanol and Carbon Dioxide + tert-Butanol Binary Systems


Abstract
:1. Introduction
2. Materials and Methods
2.1. Materials
2.2. Methods
3. Modeling
4. Results and Discussion
4.1. Experimental Results
4.2. Modelling Results

| T/K | P/bar | X1 | T/K | P/bar | X1 |
|---|---|---|---|---|---|
| carbon dioxide + isobutanol | cabon dioxide + tert-butanol | ||||
| 304.21 b | 73.83 | 1.0000 | 304.21 b | 73.83 | 1.0000 |
| 316.65 | 87.20 | 320.45 | 87.40 | 0.9715 | |
| 317.05 | 87.50 | 323.15 c | 89.90 | 0.9687 | |
| 318.15 | 89.00 | 326.25 | 92.90 | 0.9630 | |
| 320.15 | 91.60 | 330.75 | 96.80 | 0.9570 | |
| 327.60 | 101.60 | 333.15 c | 99.20 | 0.9528 | |
| 332.95 | 109.60 | 337.85 | 102.30 | 0.9477 | |
| 335.25 | 112.30 | 341.85 | 105.40 | 0.9420 | |
| 339.25 | 117.30 | 343.15 c | 106.80 | 0.9408 | |
| 348.50 | 128.65 | 346.75 | 109.20 | 0.9332 | |
| 353.35 | 133.80 | 352.35 | 112.50 | 0.9218 | |
| 353.50 | 134.05 | 353.15 c | 112.90 | 0.9215 | |
| 356.85 | 137.00 | 362.65 | 118.20 | 0.8994 | |
| 359.05 | 138.40 | 363.15 | 118.90 | 0.8980 | |
| 363.15 | 142.10 | 0.8781 | 373.15 | 121.80 | 0.8798 |
| 364.15 | 142.40 | 375.95 | 122.90 | 0.8738 | |
| 367.65 | 144.70 | 381.35 | 124.00 | 0.8563 | |
| 369.35 | 145.70 | 387.65 | 124.60 | 0.8371 | |
| 371.65 | 146.90 | 395.55 | 124.70 | 0.8047 | |
| 373.15 | 147.30 | 0.8564 | 399.75 | 124.50 | 0.7821 |
| 547.80 b | 42.95 | 0.0000 | 405.15 | 121.40 | 0.7417 |
| 506.20 b | 39.72 | 0.0000 | |||
| EoS | k12 | l12 |
|---|---|---|
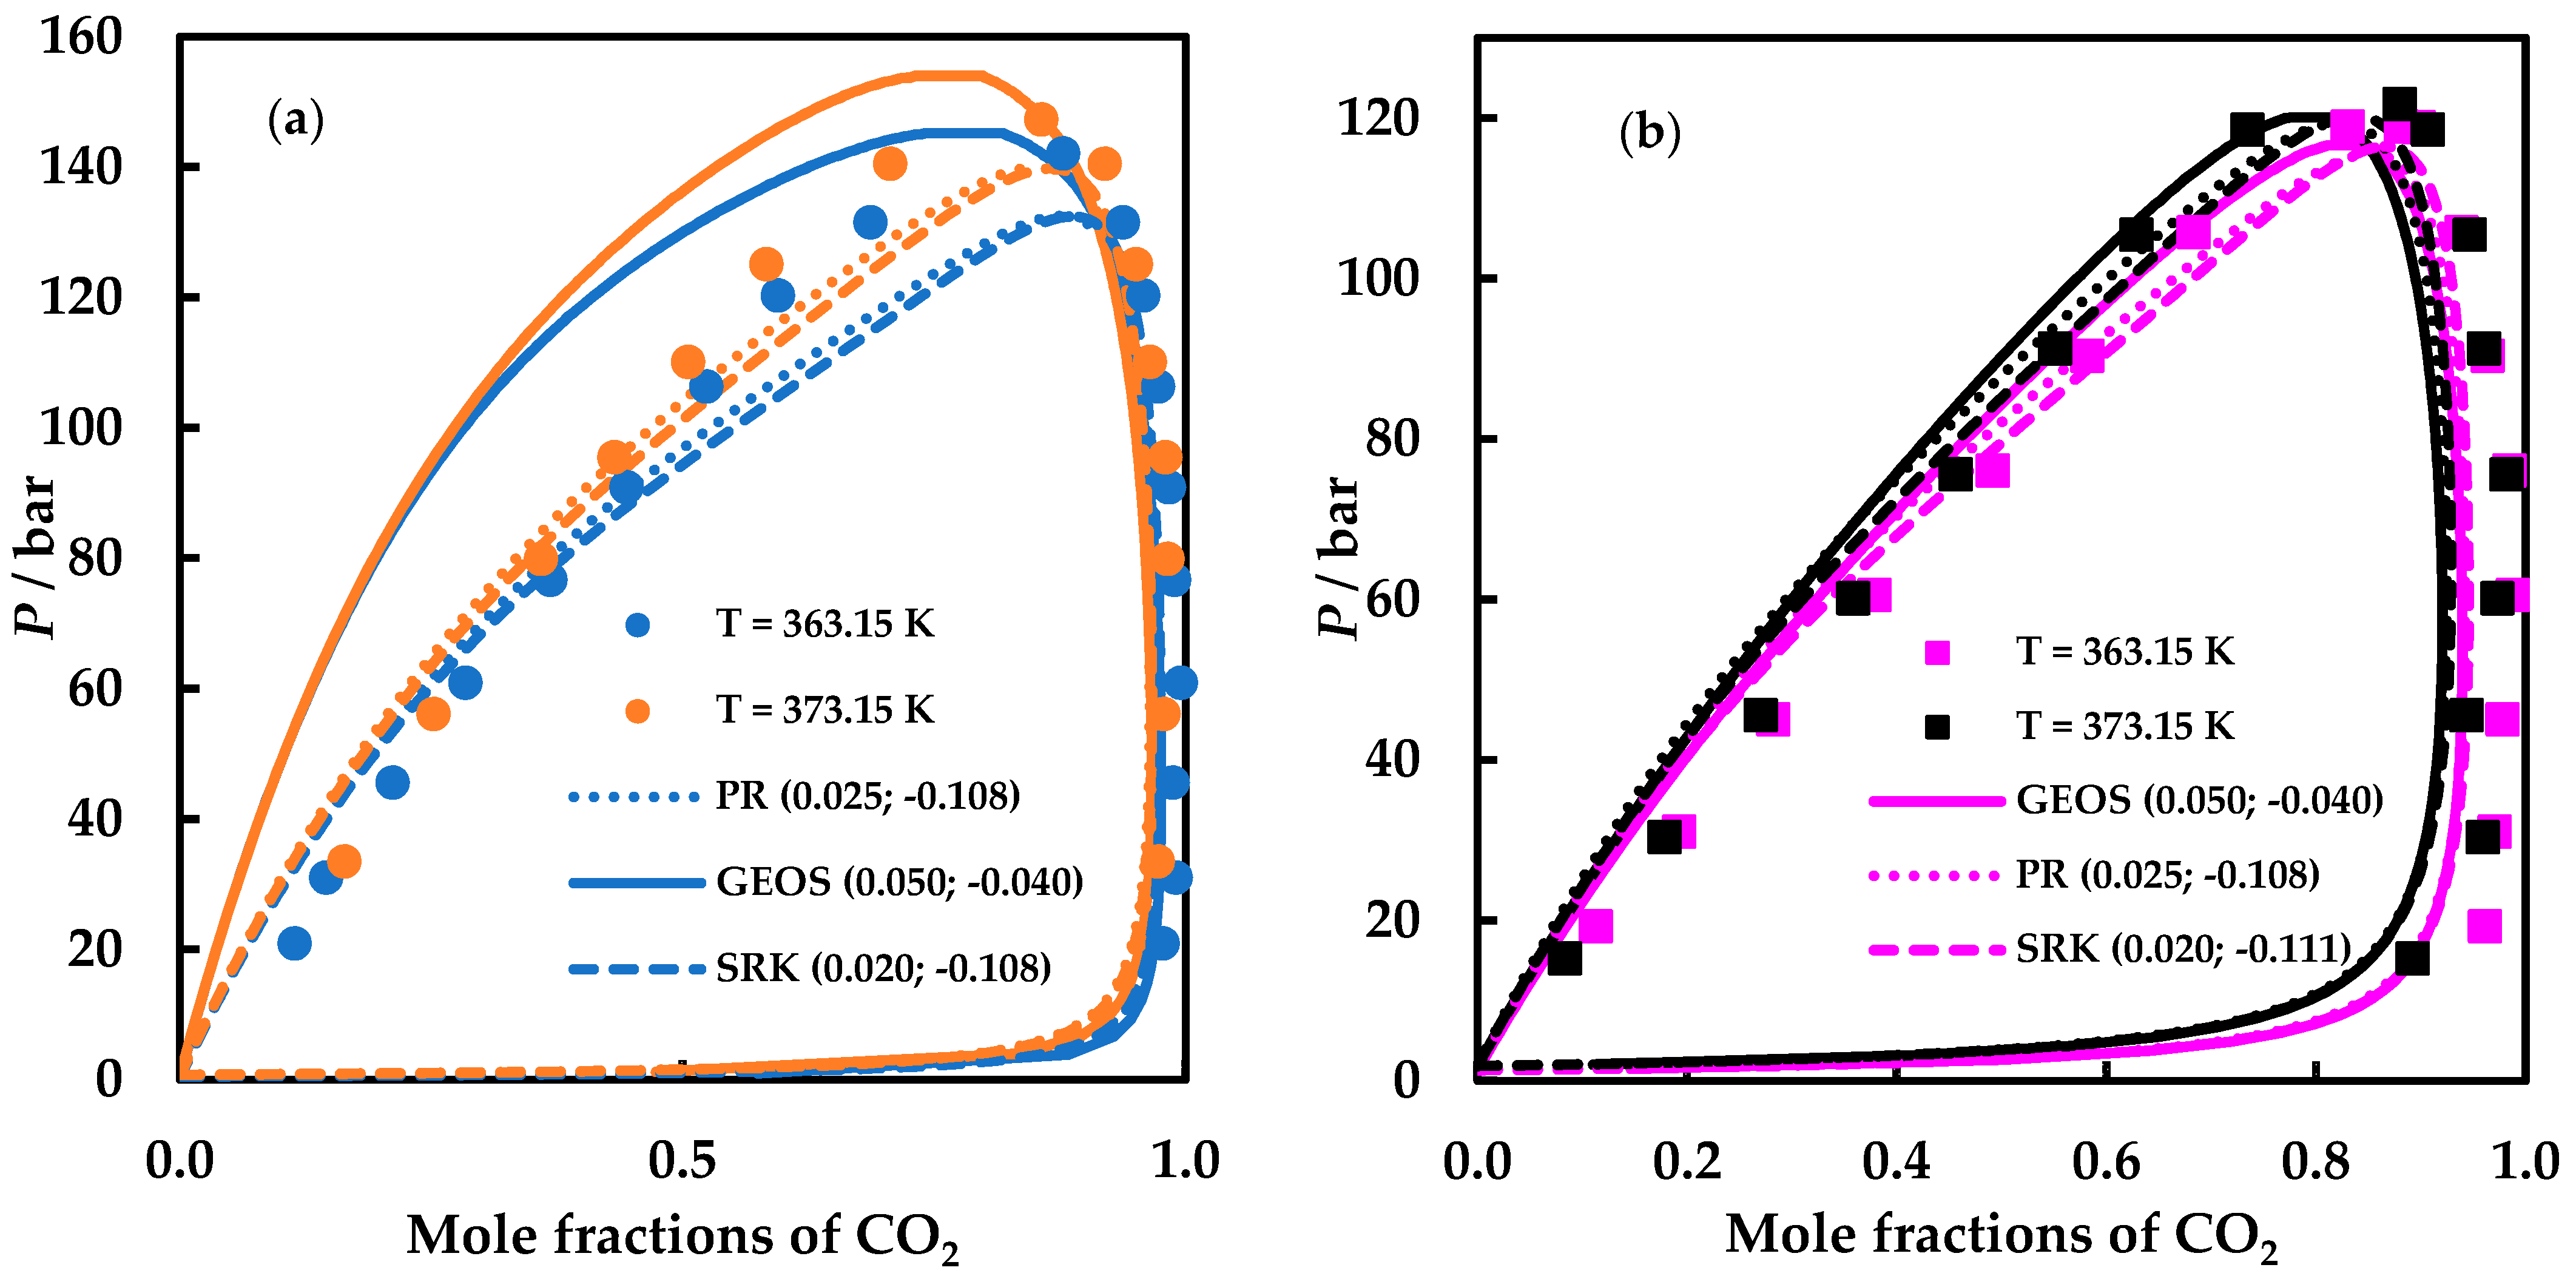
| GEOS | 0.050 | −0.040 |
| PR | 0.025 | −0.108 |
| SRK | 0.020 | −0.111 |

5. Conclusions
Author Contributions
Funding
Institutional Review Board Statement
Informed Consent Statement
Data Availability Statement
Acknowledgments
Conflicts of Interest
References
- Abanades, J.C.; Rubin, E.S.; Mazzotti, M.; Herzog, H.J. On the climate change mitigation potential of CO2 conversion to fuels. Energy Environ. Sci. 2017, 10, 2491–2499. [Google Scholar] [CrossRef]
- Peper, S.; Fonseca, J.M.S.; Dohrn, R. High-pressure fluid-phase equilibria: Trends, recent developments and systems investigated (2009–2012). Fluid Phase Equilib. 2019, 484, 126–224. [Google Scholar] [CrossRef]
- Uhlemann, J.; Costa, R.; Charpentier, J.-C. Product design and engineering—past, present, future trends in teaching, research and practices: Academic and industry points of view. Curr. Opin. Chem. Eng. 2020, 27, 10–21. [Google Scholar] [CrossRef]
- Kontogeorgis, G.M.; Dohrn, R.; Economou, I.G.; de Hemptinne, J.-C.; ten Kate, A.; Kuitunen, S.; Mooijer, M.; Zilnik, L.F.; Vesovic, V. Industrial Requirements for Thermodynamic and Transport Properties: 2020. Ind. Eng. Chem. Res. 2021, 60, 4987–5013. [Google Scholar] [CrossRef] [PubMed]
- Sima, S.; Secuianu, C. The Effect of Functional Groups on the Phase Behavior of Carbon Dioxide Binaries and Their Role in CCS. Molecules 2021, 26, 3733. [Google Scholar] [CrossRef] [PubMed]
- Sima, S.; Secuianu, C.; Nichita, D.V. High-pressure phase equilibria of carbon dioxide + 1,4-dioxane binary system. Fluid Phase Equilib. 2021, 547, 113181. [Google Scholar] [CrossRef]
- Sima, S.; Cismondi, M.; Secuianu, C. High-Pressure Phase Equilibrium for Carbon Dioxide + Ethyl n-Butyrate Binary System. J. Chem. Eng. Data 2021, 66, 4094–4102. [Google Scholar] [CrossRef]
- Ioniţă, M.; Crişciu, A.; Racoviţă, R.C.; Sima, S.; Secuianu, C. Phase diagram predictions for carbon dioxide + different classes of organic substances at high pressures. U.P.B. Sci. Bull. Ser. B 2021, 83, 117–132. [Google Scholar]
- Latsky, C.; Schwarz, C.E. Measurement and modelling of high pressure bubble- and dew-point data for the CO2 + 1-decanol + 3,7-dimethyl-1-octanol system. Fluid Phase Equilib. 2019, 488, 87–98. [Google Scholar] [CrossRef]
- Latsky, C.; Mabena, N.S.; Schwarz, C.E. High pressure phase behaviour for the CO2 + n-dodecane + 3,7-dimethyl-1-octanol system. J. Supercrit. Fluids 2019, 149, 138–150. [Google Scholar] [CrossRef]
- van Konynenburg, P.H.; Scott, R.L. Critical lines and phase equilibria in binary van der Waals mixtures. Philos. Trans. R. Soc. Lond. Ser. A 1980, 298, 495–540. [Google Scholar] [CrossRef]
- Privat, R.; Jaubert, J.N. Classification of global fluid-phase equilibrium behaviors in binary systems. Chem. Eng. Res. Des. 2013, 91, 1807–1839. [Google Scholar] [CrossRef]
- Schwarz, C.E. High Pressure Phase Behavior of the Homologous Series CO2 + 1-Alcohols. J. Chem. Eng. Data 2018, 63, 2451–2466. [Google Scholar] [CrossRef]
- Secuianu, C.; Feroiu, V.; Geana, D. Measurements and Modeling of High-Pressure Phase Behavior of the Carbon Dioxide +Pentan-1-ol Binary System. J. Chem. Eng. Data 2011, 56, 5000–5007. [Google Scholar] [CrossRef]
- Sima, S.; Ioniţă, S.; Secuianu, C.; Feroiu, V.; Geana, D. High pressure phase equilibria of carbon dioxide + 1-octanol binary system. J. Chem. Eng. Data 2018, 63, 1109–1122. [Google Scholar] [CrossRef]
- Dohrn, R.; Brunner, G. High-pressure fluid phase equilibria: Experimental methods and systems investigated (1988–1993). Fluid Phase Equilib. 1995, 106, 213–282. [Google Scholar] [CrossRef]
- Christov, M.; Dohrn, R. Review. High-pressure fluid phase equilibria. Experimental methods and systems investigated (1994–1999). Fluid Phase Equilib. 2002, 202, 153–218. [Google Scholar] [CrossRef]
- Dohrn, R.; Peper, S.; Fonseca, J.M.S. High-pressure fluid-phase equilibria: Experimental methods and systems investigated (2000–2004). Fluid Phase Equilib. 2010, 288, 1–54. [Google Scholar] [CrossRef]
- Fonseca, J.M.S.; Ralf Dohrn, R.; Peper, S. High-pressure fluid-phase equilibria: Experimental methods and systems investigated (2005–2008). Fluid Phase Equilib. 2011, 300, 1–69. [Google Scholar] [CrossRef]
- DETHERM Database; DECHEMA Chemistry Data Series; DECHEMA: Frankfurt, Germany, 1991–2021.
- Sima, S.; Secuianu, C.; Feroiu, V.; Geană, D. New high-pressures vapor-liquid equilibrium data for the carbon dioxide + 2-methyl-1-propanol (isobutanol) binary system. Cent. Eur. J. Chem. 2014, 12, 953–961. [Google Scholar] [CrossRef]
- Sima, S.; Secuianu, C.; Feroiu, V.; Geană, D. New high-pressures vapor-liquid equilibrium data for the carbon dioxide + 2-methyl-2-propanol binary system. Cent. Eur. J. Chem. 2014, 12, 893–900. [Google Scholar] [CrossRef]
- Kodama, D.; Kato, M.; Kaneko, T. Volumetric behavior of carbon dioxide + 2-methyl-1-propanol and carbon dioxide + 2-methyl-2-propanol mixtures at 313.15 K. Fluid Phase Equilib. 2013, 357, 57–63. [Google Scholar] [CrossRef]
- Ferreira, M.O.; Ferreira-Pinto, L.; Souza, E.M.B.D.; Castier, M.; Voll, F.A.P.; Cabral, V.F.; Cardozo-Filho, L. Experimental Vapor-Liquid Equilibria for the Systems 2-Ethyl-1-hexanol + Glycerol + CO2 and 2-Methyl-2-propanol + Glycerol + CO2. J. Chem. Eng. Data 2013, 58, 2506–2512. [Google Scholar] [CrossRef]
- Aida, T.; Aizawa, T.; Kanakubo, M.; Nanjo, H. Relation between Volume Expansion and Hydrogen Bond Networks for CO2-Alcohol Mixtures at 40 °C. J. Phys. Chem. B 2010, 114, 13628–13636. [Google Scholar] [CrossRef] [PubMed]
- Semenova, A.I.; Emelyanova, E.A.; Tsimmerman, S.S.; Tsiklis, D.S. Phase equilibria in the system isobutyl alcohol-carbon dioxide. Zhurnal Fizicheskoi Khimii 1978, 52, 1149–1152, (accessed via DETHERM). [Google Scholar]
- Wang, L.; Hao, X.; Zheng, L.; Chen, K. Phase Equilibrium of Isobutanol in Supercritical CO2. Chin. J. Chem. Eng. 2009, 17, 642–647. [Google Scholar] [CrossRef]
- Wang, L.; Li, R.L.; Sun, L.T.; Chen, K.X. Studies on Phase Equilibrium of Tertbutanol in Supercritical CO2. Chem. J. Chin. Univ. 2009, 30, 1631–1635. [Google Scholar]
- Chen, H.-I.; Chen, P.-H.; Chang, H.-Y. High-Pressure Vapor-Liquid Equilibria for CO2 + 2-Butanol, CO2 + Isobutanol, and CO2 + tert-Butanol Systems. J. Chem. Eng. Data 2003, 48, 1407–1412. [Google Scholar] [CrossRef]
- Kim, J.S.; Yoon, J.H.; Lee, H. High-Pressure Phase Equilibria for Carbon Dioxide2-Methyl-2-propanol and Carbon Dioxide-2-Methyl-2-propanol-Water: Measurement and Prediction. Fluid Phase Equilib. 1994, 101, 237–245. [Google Scholar] [CrossRef]
- Geană, D. A new equation of state for fluids. I. Applications to PVT calculations for pure fluids. Rev. Chim. 1986, 37, 303–309. [Google Scholar]
- Geană, D. A new equation of state for fluids. II. Applications to phase equilibria. Rev. Chim. 1986, 37, 951–959. [Google Scholar]
- Peng, D.Y.; Robinson, D.B. A new two-constant Equation of State. Ind. Eng. Chem. Fundam. 1976, 15, 59–64. [Google Scholar] [CrossRef]
- Soave, G. Equilibrium constants from a modified Redlich-Kwong equation of state. Chem. Eng. Sci. 1972, 27, 1197–1203. [Google Scholar] [CrossRef]
- Polishuk, I.; Wisniak, J.; Segura, H. Simultaneous prediction of the critical and sub-critical phase behavior in mixtures using equation of state I. Carbon dioxide-alkanols. Chem. Eng. Sci. 2001, 56, 6485–6510. [Google Scholar] [CrossRef]
- Secuianu, C.; Feroiu, V.; Geană, D. Phase behavior for carbon dioxide + ethanol system: Experimental measurements and modeling with a cubic equation of state. J. Supercrit. Fluids 2008, 47, 109–116. [Google Scholar] [CrossRef]
- Secuianu, C.; Feroiu, V.; Geană, D. Phase Behavior for the Carbon Dioxide + 2-Butanol System: Experimental Measurements and Modeling with Cubic Equations of State. J. Chem. Eng. Data 2009, 54, 1493–1499. [Google Scholar] [CrossRef]
- Secuianu, C.; Feroiu, V.; Geană, D. High-pressure vapor-liquid equilibria in the system carbon dioxide and 2-propanol at temperatures from 293.25 K to 323.15 K. J. Chem. Eng. Data 2003, 48, 1384–1386. [Google Scholar] [CrossRef]
- Sima, S.; Feroiu, V.; Geană, D. New High Pressure Vapor-Liquid Equilibrium and Density Predictions for the Carbon Dioxide plus Ethanol System. J. Chem. Eng. Data 2011, 56, 5052–5059. [Google Scholar] [CrossRef]
- Guilbot, P.; Valtz, A.; Legendre, H.; Richon, D. Rapid on-line sampler-injector: A reliable tool for HT-HP sampling and online GC analysis. Analusis 2000, 28, 426–431. [Google Scholar] [CrossRef] [Green Version]
- Geană, D.; Rus, L. Phase equilibria database and calculation program for pure components systems and mixtures. In Proceedings of the Romanian International Conference on Chemistry and Chemical Engineering (RICCCE XIV), Bucharest, Romania, 22–24 September 2005; Volume 2, pp. 170–178. [Google Scholar]
- Cismondi, M.; Michelsen, M.L. Global Phase Equilibrium Calculations: Critical Lines, Critical End Points and Liquid−liquid−vapour Equilibrium in Binary Mixtures. J. Supercrit. Fluids 2007, 39, 287–295. [Google Scholar] [CrossRef]
- Cismondi, M.; Michelsen, M. Automated Calculation of Complete Pxy and Txy Diagrams for Binary Systems. Fluid Phase Equilib. 2007, 259, 228–234. [Google Scholar] [CrossRef]
- Cismondi, M.; Michelsen, M.L.; Zabaloy, M.S. Automated Generation of Phase Diagrams for Binary Systems with Azeotropic Behavior. Ind. Eng. Chem. Res. 2008, 47, 9728–9743. [Google Scholar] [CrossRef]
- Heidemann, R.A.; Khalil, A.M. The calculation of critical points. AIChE J. 1980, 26, 769–779. [Google Scholar] [CrossRef]
- Stockfleth, R.; Dohrn, R. An algorithm for calculating critical points in multicomponent mixtures which can easily be implemented in existing programs to calculate phase equilibria. Fluid Phase Equilib. 1998, 145, 43–52. [Google Scholar] [CrossRef]
- Elizalde-Solis, O.; Galicia-Luna, L.A. Vapor-liquid equilibria and phase densities at saturation of carbon dioxide + 1-butanol and carbon dioxide + 2-butanol from 313 to 363. Fluid Phase Equilib. 2010, 296, 66–71. [Google Scholar] [CrossRef]
- Stevens, R.M.M.; Shen, X.M.; de Loos, T.W.; de Swaan Arons, J. A new apparatus to measure the vapor-liquid equilibria of low-volatility compounds with near-critical carbon dioxide. Experimental and modelling results for carbon dioxide+n-butanol, +2-butanol, +2-butyl acetate and +vinyl acetate systems. J. Supercrit. Fluids 1997, 11, 1–14. [Google Scholar] [CrossRef]
- Silva-Oliver, G.; Galicia-Luna, L.A. Vapor–liquid equilibria near critical point and critical points for the CO2 + 1-butanol and CO2 + 2-butanol systems at temperatures from 324 to 432 K. Fluid Phase Equilib. 2001, 182, 145–156. [Google Scholar] [CrossRef]
- Ziegler, J.W.; Chester, T.L.; Innis, D.P.; Page, S.H.; Dorsey, J.G. Supercritical fluid flow injection method for mapping liquid–vapor critical loci of binary mixtures containing CO2. In Innovations in Supercritical Fluids. Science and Technology; ACS Symposium Series; Hutchenson, E.K.H., Foster, N.R., Eds.; American Chemical Society: Washington, DC, USA, 1995; Volume 608, pp. 93–110. [Google Scholar] [CrossRef]
- Yeo, S.-D.; Park, S.-J.; Kim, J.-W.; Kim, J.-C. Critical Properties of Carbon Dioxide + Methanol, + Ethanol, + 1-Propanol, and + 1-Butanol. J. Chem. Eng. Data 2000, 45, 932–935. [Google Scholar] [CrossRef]
- Gurdial, G.S.; Foster, N.R.; Yun, S.L.J.; Tilly, K.D. Phase Behavior of Supercritical Fluid—Entrainer Systems. In Spercritical Fluid Engineering Science. Fundamentals and Applications; ACS Symposium Series; Kiran, E., Brennecke, J.F., Eds.; American Chemical Society: Washington, DC, USA, 1992; Volume 514, pp. 34–45. [Google Scholar] [CrossRef]
- Sima, S.; Racoviţă, R.C.; Dincă, C.; Feroiu, V.; Secuianu, C. Phase equilibria calculations for carbon dioxide + 2-propanol system. U.P.B. Sci. Bull. Ser. B 2017, 79, 11–24. [Google Scholar]
- Reid, R.C.; Prausnitz, J.M.; Poling, B.E. The Properties of Gases and Liquids, 4th ed.; McGraw-Hill: New York, NY, USA, 1987. [Google Scholar]
- Poling, B.E.; Prausnitz, J.M.; O’Connell, J.P. The Properties of Gases and Liquids, 5th ed.; McGraw-Hill Education: New York, NY, USA, 2001. [Google Scholar]
- Design Institute for Physical Properties, Sponsored by AIChE. (2005; 2008; 2009; 2010; 2011; 2012; 2015; 2016; 2017; 2018; 2019; 2020). DIPPR Project 801-Full Version. Design Institute for Physical Property Research/AIChE. Available online: https://app.knovel.com/hotlink/toc/id:kpDIPPRPF7/dippr-project-801-full/dippr-project-801-full (accessed on 20 January 2022).
- Jaubert, J.-N.; Le Guennec, Y.; Pina-Martinez, A.; Ramirez-Velez, N.; Lasala, S.; Schmid, B.; Nikolaidis, I.K.; Economou, I.G.; Privat, R. Benchmark Database Containing Binary-System-High-Quality-Certified Data for Cross-Comparing Thermodynamic Models and Assessing Their Accuracy. Ind. Eng. Chem. Res. 2020, 59, 14981–15027. [Google Scholar] [CrossRef]
- Büchner, E.H. Liquid Carbonic Acid as a Solvent. Z. Phys. Chem. Stoechiom. Verwandtschaftsl. 1906, 54, 665–688. [Google Scholar] [CrossRef]


| P or Prange/bar | T or Trange/K | Nexp | Observations | Ref. |
|---|---|---|---|---|
| carbon dioxide (1) + isobutanol (2) | ||||
| 18.26 ÷ 81.40 | 313.15 | 10 | P-x | [23] |
| 17.30 ÷130.0 | 333.15 ÷ 353.15 | 23 | P-x,y | [21] |
| carbon dioxide (1) + tert-butanol (2) | ||||
| 70.0 ÷ 115.2 103.5 ÷ 120.3 | 333 ÷ 368 343 ÷ 368 | 14 6 | P-x P-y | [24] |
| 19.5 ÷ 112.9 | 323.15 ÷ 353.15 | 30 | P-x,y | [22] |
| 10.3 ÷ 75.5 | 313.15 | 13 | P-x | [25] |
| 14.5 ÷ 79.16 | 313.15 | 10 | P-x | [23] |
| Prange/bar | Trange/K | Nexp | Observations | Reference |
|---|---|---|---|---|
| carbon dioxide (1) + isobutanol (2) | ||||
| 147.4 ÷ 122.00 | 373.15 ÷ 493.15 | 4 | LV | [26] |
| 80.30 ÷143.1 | 313.20 ÷ 353.20 | 5 | LV | [27] |
| carbon dioxide (1) + tert-butanol (2) | ||||
| 101.7 ÷ 120.4 | 323.20 ÷ 353.20 | 4 | LV | [28] |
| 19.5 ÷ 112.9 | 341.60 ÷ 351.30 | 2 | LV | [29] |
| 92.3 ÷ 111.6 | 323.20 ÷ 343.20 | 2 | LV | [30] |
| Compound | Chemical Formula | CAS Registry Number | Source | Purification Method | Minimum Mass Fraction Purity |
|---|---|---|---|---|---|
| carbon dioxide | CO2 | 124-38-9 | Linde Gaz Romania | None | 0.99995 |
| isobutanol | C4H10O | 78-83-1 | Sigma-Aldrich | None | >0.995 |
| tert-butanol | C4H10O | 75-65-0 | Sigma-Aldrich | None | >0.995 |
| P/bar | X1 | Y1 | P/bar | X1 | Y1 |
|---|---|---|---|---|---|
| carbon dioxide (1) + isobutanol (2) | carbon dioxide (1) + tert-butanol (2) | ||||
| T/K = 363.15 ± 0.1 | |||||
| 20.90 | 0.1139 | 0.9770 | 19.30 | 0.1129 | 0.9612 |
| 31.00 | 0.1454 | 0.9901 | 31.10 | 0.1926 | 0.9706 |
| 45.60 | 0.2115 | 0.9872 | 45.10 | 0.2822 | 0.9779 |
| 60.90 | 0.2838 | 0.9953 | 60.60 | 0.3790 | 0.9879 |
| 76.70 | 0.3683 | 0.9887 | 76.10 | 0.4919 | 0.9846 |
| 90.90 | 0.4439 | 0.9834 | 90.40 | 0.5819 | 0.9638 |
| 106.35 | 0.5232 | 0.9726 | 105.80 | 0.6834 | 0.9389 |
| 120.30 | 0.5947 | 0.9578 | 119.00 | 0.8303 | 0.8812 |
| 131.50 | 0.6867 | 0.9377 | 118.90a | 0.8980 | 0.8980 |
| 142.10 a | 0.8781 | 0.8781 | |||
| T/K = 373.15 ± 0.1 | |||||
| 33.50 | 0.1634 | 0.9724 | 15.30 | 0.0838 | 0.8922 |
| 56.10 | 0.2521 | 0.9782 | 30.40 | 0.1786 | 0.9591 |
| 79.90 | 0.3590 | 0.9819 | 45.60 | 0.2703 | 0.9434 |
| 95.50 | 0.4320 | 0.9800 | 60.20 | 0.3586 | 0.9729 |
| 110.10 | 0.5054 | 0.9646 | 75.60 | 0.4566 | 0.9817 |
| 125.10 | 0.5832 | 0.9508 | 91.30 | 0.5510 | 0.9602 |
| 140.50 | 0.7062 | 0.9194 | 105.50 | 0.6287 | 0.9466 |
| 147.30 a | 0.8564 | 0.8564 | 118.60 | 0.7344 | 0.9067 |
| 121.80 a | 0.8798 | 0.8798 | |||
| Database | Reid et al. [54] | Poling et al. [55] | DIPPR [56] | |||||||||
|---|---|---|---|---|---|---|---|---|---|---|---|---|
| Substance | Tc/K | Pc/bar | Vc/cm3/mol | ω | Tc/K | Pc/bar | Vc/cm3/mol | ω | Tc/K | Pc/bar | Vc/cm3/mol | ω |
| carbon dioxide | 304.10 | 73.80 | 93.9 | 0.239 | 304.12 | 73.74 | 94.07 | 0.225 | 304.21 | 73.83 | 94 | 0.223621 |
| 1-butanol | 563.10 | 44.20 | 275 | 0.593 | 563.05 | 44.23 | 275 | 0.590 | 563.1 | 44.14 | 273 | 0.588280 |
| 2-butanol | 536.10 | 41.80 | 269 | 0.577 | 536.05 | 41.79 | 269 | 0.574 | 535.9 | 42.02 | 270 | 0.580832 |
| isobutanol | 547.80 | 43.00 | 273 | 0.592 | 547.78 | 43.00 | 273 | 0.590 | 547.8 | 42.95 | 274 | 0.585710 |
| tert-butanol | 506.20 | 39.70 | 275 | 0.612 | 506.21 | 39.73 | 275 | 0.613 | 506.2 | 39.72 | 275 | 0.615203 |
| Substance | m | αc |
|---|---|---|
| carbon dioxide | 0.3146 | 7.0517 |
| 1-butanol | 0.6437 | 9.0580 |
| 2-butanol | 0.6533 | 9.0298 |
| isobutanol | 0.6005 | 9.9243 |
| tert-butanol | 0.6814 | 9.1161 |
| EoS | GEOS | PR | SRK | ||||
|---|---|---|---|---|---|---|---|
| Substance | CO2 | 1-butanol | 2-butanol | isobutanol | tert-butanol | all | all |
| B | 0.1785 | 1.3342 | 1.3396 | 0.1521 | 0.1716 | 0.2467 | 0.2296 |
| Zc | 0.2746 | 0.2576 | 0.2540 | 0.2586 | 0.2597 | 0.3333 | 0.3074 |
| Ωa | 0.5545 | −0.0373 | −0.0392 | 0.6097 | 0.5685 | 0.4275 | 0.4572 |
| Ωb | 0.0961 | −1.0766 | −1.0857 | 0.1065 | 0.0881 | 0.0866 | 0.0778 |
| Ωc | −0.0483 | 0.1211 | 0.1257 | −0.0704 | −0.0538 | −0.0187 | −0.0121 |
| Ωd | −0.1362 | 0.4247 | 0.4238 | −0.1654 | −0.1545 | −0.0434 | −0.0778 |
Publisher’s Note: MDPI stays neutral with regard to jurisdictional claims in published maps and institutional affiliations. |
© 2022 by the authors. Licensee MDPI, Basel, Switzerland. This article is an open access article distributed under the terms and conditions of the Creative Commons Attribution (CC BY) license (https://creativecommons.org/licenses/by/4.0/).
Share and Cite
Sima, S.; Crişciu, A.V.; Secuianu, C. Phase Behavior of Carbon Dioxide + Isobutanol and Carbon Dioxide + tert-Butanol Binary Systems. Energies 2022, 15, 2625. https://doi.org/10.3390/en15072625
Sima S, Crişciu AV, Secuianu C. Phase Behavior of Carbon Dioxide + Isobutanol and Carbon Dioxide + tert-Butanol Binary Systems. Energies. 2022; 15(7):2625. https://doi.org/10.3390/en15072625
Chicago/Turabian StyleSima, Sergiu, Adrian Victor Crişciu, and Catinca Secuianu. 2022. "Phase Behavior of Carbon Dioxide + Isobutanol and Carbon Dioxide + tert-Butanol Binary Systems" Energies 15, no. 7: 2625. https://doi.org/10.3390/en15072625
APA StyleSima, S., Crişciu, A. V., & Secuianu, C. (2022). Phase Behavior of Carbon Dioxide + Isobutanol and Carbon Dioxide + tert-Butanol Binary Systems. Energies, 15(7), 2625. https://doi.org/10.3390/en15072625