Article

Sliding Mode Observer for State-of-Charge Estimation Using Hysteresis-Based Li-Ion Battery Model

1
School of Computing Technologies, RMIT University, Melbourne, VIC 3000, Australia
2
School of Engineering, RMIT University, Melbourne, VIC 3000, Australia
3
School of Electrical Engineering, Harbin Institute of Technology, Harbin 150001, China
4
Beijing Intell-Sun Technology Limited, Beijing 100012, China
5
Research and Development Center, Anhui Huasun Energy Co., Ltd., Xuancheng 242000, China
*
Author to whom correspondence should be addressed.
Energies 2022, 15(7), 2658; https://doi.org/10.3390/en15072658
Submission received: 14 February 2022 / Revised: 23 March 2022 / Accepted: 31 March 2022 / Published: 5 April 2022

Abstract

:
Lithium-ion battery devices are essential for energy storage and supply in distributed energy generation systems. Robust battery management systems (BMSs) must guarantee that batteries work within a safe range and avoid the damage caused by overcharge and overdischarge. The state-of-charge (SoC) of Li-ion batteries is difficult to observe after batteries are manufactured. The hysteresis phenomenon influences the existing battery modeling and SoC estimation accuracy. This research applies a terminal sliding mode observer (TSMO) algorithm based on a hysteresis resistor-capacitor (RC) equivalent circuit model to enable accurate SoC estimation. The proposed method is evaluated using two dynamic battery tests: the dynamic street test (DST) and the federal urban driving schedule (FUDS) test. The simulation results show that the proposed method achieved high estimation accuracy and fast response speed. Additionally, real-time battery information, including battery output voltage and SoC, was acquired and displayed by an automatic monitoring system. The designed system is valuable for all battery application cases.

1. Introduction

The conventional centralized electricity distribution mode and existing electric power generation are challenged to meet the ever-changing and growing energy requirements of the 21st century due to increasing population and economic growth. Traditionally, fossil fuels are the primary energy sources used for electricity generation. The combustion of fossil fuels leads to greenhouse gas emissions, which cause global warming. Therefore, there is an urgent need for an energy transition from fossil fuels to renewable energy sources, such as solar energy, to alleviate atmospheric contamination and maximize the efficiency of energy utilization.
Since most renewable energy sources are intermittent in nature, battery storage systems always couple with energy generators to store excess power and supply appliances when it is needed. Lithium-ion (Li-ion) batteries and lead-acid batteries are recognized as having the most mature technologies employed as energy storage devices in photovoltaics solar systems. Compared with lead-acid batteries, Li-ion batteries have advantages with high power density, quick charging, long lifespan, and low maintenance [1]. However, Li-ion batteries have a safe working zone, e.g., overcharge accelerates the temperature increase in batteries, which may induce a fire. Thus, robust battery management systems (BMSs) are required to guarantee that batteries work within a safe range.
A Li-ion battery cell can be regarded as a nonlinear system where internal state parameters are unknown and only the external input and output can be measured. The state-of-charge (SoC) of Li-ion batteries is one of the most important internal metrics that indicates the current remaining capacity of batteries in use. Therefore, it is difficult to observe after batteries are manufactured. Many studies and algorithms have been proposed for battery SoC estimation, from the non-model-based methods (e.g., the coulomb counting method [2] and the open-circuit voltage method [3,4]) and machine learning approaches (e.g., artificial neural networks (ANN) [5], fuzzy logic [6,7], and support vector regression (SVR) [8]) to model-based methods (e.g., Kalman filter (KF) algorithms and its related methods [9,10,11], the Luenberger observer [12,13,14], and sliding mode observer (SMO) [15,16,17,18]).
Among these methods, the coulomb counting method calculates battery SoC by accumulating the battery current. Since it applies open-loop control, the estimation error will be accumulated with time. The open-circuit voltage method is one of the alternatives which requires batteries to be static for a period of time after being used. Thus, these methods cannot achieve real-time observation under dynamic working conditions. Machine learning approaches require large amounts of training data to establish the relationship between inputs and outputs, resulting in a computational burden. In addition, getting a sufficient amount of data is time-consuming.
Model-based methods allow battery models to self-correct and tackle unexpected disturbances through closed-loop observers [19]. The Kalman filter (KF) related methods, including the unscented Kalman filter (UKF) [20,21] and the extended Kalman filter (EKF) [22,23], are commonly used to conduct the battery SoC estimation. Kalman filter-based estimation methods assume that the system noises and the covariance of measurements have to be known [24]. However, parameters initialized using static battery models may conflict with various actual applications [18]. Moreover, these methods are less robust due to model uncertainty and system disturbance. Luenberger observers could be easily implemented with a feedback term. In our previous study [19], three Luenberger observers were designed based on a hysteresis resistor–capacitor (RC) equivalent circuit battery model (ECM), which provides good performance in terms of SoC estimation accuracy. However, the convergence speed is highly influenced by the observer gain. Although with a high observer gain the estimates can quickly converge to the system, the initially estimated error can be extremely large, resulting in a peaking phenomenon. This peaking phenomenon is impractical and unsafe to use. Additionally, Luenberger observer states errors can approach zero in the form of an exponential function but cannot converge to zero.
The sliding mode observer adds switching control signals at the end of state equations. Therefore, it can force estimates to converge to real values quickly without the peaking phenomenon. In [25], a sliding mode observer was used, which shows robust control property against modeling errors and uncertainties. In [14,26], state observers were designed consisting of a Luenberger term to guarantee the nominal error convergence and a sliding mode term to add robustness to the uncertainties. However, the low-pass filters used in the traditional SMO to extract estimated signals from output signals will incur phase lag and affect the estimation accuracy and speed [15]. The terminal sliding mode observer (TSMO) has been developed by using continuous output injection signals. Thus, it can suppress the chattering problems of the traditional SMO. In [15], Feng et al. proposed an accurate real-time SoC estimation algorithm based on an ECM using three TSMOs. The proposed algorithm attenuates the chattering, eliminates the low-pass filter, and allows finite time convergence, which could force the error to equal zero promptly. Therefore, it can achieve higher estimation accuracy and faster response speed.
Model-based estimation methods require a precise battery model to depict internal battery parameters. The model accuracy strongly influences the SoC estimation accuracy. Hysteresis phenomenon refers to the lag between input and output in a system upon a change in direction. The hysteresis effect is reflected as the memristors “remember” changes when the current is passing through them by changing their resistance. In reality, during battery charge and discharge stages, the open-circuit voltage (OCV) curves, which describe the relationship between OCV and SoC, are discrepant due to the hysteresis effect. The majority of the model-based research on Li-ion battery management ignores this discrepancy, which potentially incurs high error during the SoC estimation. In this research, the hysteresis effect is integrated into the resistor–capacitor (RC) equivalent circuit model of the Li-ion battery to improve the SoC estimation accuracy, and terminal sliding mode observers (TSMOs) are deployed to rapidly and accurately calculate real-time battery SoC. The contribution of this paper includes:
  • Formalizing the hysteresis-based equivalent circuit model for Li-ion battery, based on which the charging and discharging processes are treated differently during the SoC estimation.
  • A terminal sliding mode observer is designed with theoretical proof for estimating the SoC of a Li-ion battery in real time.
Extensive simulations using the practical database have shown that higher accuracy and faster response speed can be achieved simultaneously for the SoC estimation through integrating the hysteresis effect into the battery model, while the computational complexity remains roughly the same as that of the resistor–capacitor (RC) equivalent circuit model.
To the best of our knowledge, this study is the first to consider the hysteresis effect to improve the SoC estimation accuracy using the TSMO-based estimation method. In addition, this paper has also designed an automatic battery state monitoring system to acquire and display real-time battery information, including voltage and SoC.
The rest of this paper is organized as follows: Section 2 describes the hysteresis effect during battery charge and discharge and battery model establishment. Section 3 applies three TSMOs to observe a hysteresis-based battery model. Section 4 presents simulation results using two dynamic battery tests. Section 5 depicts the design of an automatic battery state monitoring system. Section 6 concludes the study and shows the future roadmap.

2. Rechargeable Battery Model

The electrochemical reaction process in Li-ion batteries is complex. A precise battery model is a prerequisite for an accurate battery SoC estimation. An equivalent circuit model can be seen as one of the best choices due to less computation and simple structure. However, due to the hysteresis phenomenon during battery charge and discharge, an equivalent circuit model cannot comprehensively depict the electrochemical characteristics. Hysteresis models usually combine with other types of battery models to depict the OCV discrepancy. Our previous study [19] investigated the performance of battery SoC estimation with and without hysteresis included based on the Luenberger observer. Simulation results showed better battery modeling and SoC estimation accuracy performance when adding a hysteresis model. Therefore, the same battery model that includes hysteresis terms will be used in this research.

2.1. State-of-Charge and Open-Circuit Voltage Curve

Battery state-of-charge (SoC) indicates the residual capacity of a battery device, which can be defined as charges accumulated with time:
Z t = Z t 0 t 0 t I / C n d τ ,
Z ˙ t = I C n ,
where Z denotes SoC and Z ˙ is the changing rate of SoC; t 0 is the initial time and t is the current time; C n is the capacity of the battery; and I is the input current.
Accurate and fast battery SoC estimation ensures efficient battery charge and discharge and allows battery life extension. However, battery SoC is hard to observe under dynamic operating conditions. The battery voltage is a known function of SoC during open-circuit conditions. The SoC value could be obtained from the open-circuit voltage (OCV) curve.
Taking a 18650 type battery [27] as an example, it can be seen in Figure 1a that the OCV curves are discrepant during charge and discharge due to the hysteresis effect, denoted by O C V u p and O C V l w . SoC values are different at the same voltage value. The gap between SoC values during charge and discharge is illustrated in Figure 1b and indicated using red arrows in Figure 1a. This gap influences battery SoC estimation accuracy and could cause approximately a maximum of 5% SoC error.

2.2. Hysteresis Based Li-ion Battery Model

The hysteresis model [28] is used to depict the battery hysteresis phenomenon:
V ˙ h = I γ C n [ H Z , Z ˙ V h ] ,
where γ is a positive constant used to influence the rate of decay; V h denoted hysteresis voltage is affected by battery SoC value and operation time; and H Z , Z ˙ is related to the SoC and the rate of SoC used to express the maximum deviation from O C V a v g Z . H Z , Z ˙ can be formed as follows:
H Z , Z ˙ = O C V u p O C V l w / 2
Since the hysteresis affects battery open-circuit voltage during charge and discharge, hysteresis voltage ( V h ) is considered in the equation of open-circuit voltage to improve battery model accuracy. Thus, the equation of open-circuit voltage with hysteresis included becomes:
V o c Z = O C V a v g Z + s g n I V h ,
where O C V a v g Z denotes the average value; s g n x is a signum function: s g n x = 1 for battery charge and 1 for battery discharge.
Because involving the hysteresis model could increase model accuracy, we use the same battery model as in our previous study [19]. The model combines a hysteresis model and a first-order resistor–capacitor (RC) equivalent circuit model (ECM) (Figure 2). The hysteresis model is circled by a dotted line (Figure 2) which consists of average OCV and hysteresis voltage.
The combined battery model can be expressed using several mathematical equations relating to three battery states: the output voltage ( V t ), the open-circuit voltage with hysteresis included ( V o c Z ), and the polarization voltage ( V p );
V ˙ t = a 1 V t + a 1 V o c Z + R t I ˙ + b 1 I ,
V ˙ o c Z = k a 2 V t k a 2 V o c Z k a 2 V p ,
V ˙ p = a 1 V p + b 2 I + f ,
where a 1 = 1 / R p C p ; a 2 = 1 / R t C n ; b 1 = k / C n + 1 / C p + R t / R p C p ; and b 2 = 1 / C p . In Equations (5)–(7), battery parameters, including the capacity of the battery ( C n ), capacitor ( C p ), diffusion resistance ( R p ), and Ohmic resistance ( R t ), can be obtained via the recursive least square (RLS) method. f denotes the model uncertainty and I denotes the input current. Since V o c Z is a function of SoC, the rate of SoC is expressed by Z ˙ = k V ˙ o c Z , where Z denotes SoC and k is the slope of the SoC function.

3. Real-Time Battery SoC Estimation Based on Terminal Sliding Mode Observer

The Luenberger and sliding mode observers are insensitive to measurement noises, external disturbances, and internal parameter uncertainties, generally used for battery SoC estimation. However, keeping the balance of the convergence speed and model accuracy is challenging in terms of the Luenberger observer. The terminal sliding mode observer (TSMO) proposed in [15] used continuous high-gain feedback to force estimated states to a designed non-linear hypersurface. Thus, three battery states ( V t , V o c Z , and V p ) can converge to real values in finite time after reaching the hypersurface, rather than an asymptotical convergence. In addition, the TSMO avoids the utilization of low-pass filters that incur phase lag. Therefore, higher estimation accuracy and faster response speed can be obtained simultaneously compared with the Luenberger observer-based method. This paper improves the battery SoC estimation accuracy by considering the hysteresis phenomenon.
Three TSMOs based on the hysteresis RC ECM were designed to estimate three battery states ( V t , V o c Z , and V p ). The output voltage ( V t ) and input current ( I ) are external measurements. The open-circuit voltage ( V o c Z ) and polarization voltage ( V p ) are internal states, which work as intermediate variables. Three observation errors are expressed by e t = V t V ^ t ; e o c = V o c Z V ^ o c Z ; and e p = V p V ^ p , where estimated values can be defined by a “hat”.

3.1. Estimation of the Output Voltage

For the output voltage observer, the control signal u t is added at the end of the output voltage state equation to drive the output voltage to the real value:
V ^ ˙ t = a 1 V ^ t + a 1 V ^ o c Z + R t I ˙ + b 1 I + u t ,
The error system for the output voltage is:
e ˙ t = a 1 e t + a 1 e o c u t ,
The sliding hyperplane for output voltage is chosen as follows:
S t = e ˙ t + β t e t ρ t 1 / ρ t 2 ,
where β t , ρ t 1 , and ρ t 2 are positive constants.
The sliding hyperplanes and appropriate control signals allow the estimates to converge to the actual system in a finite time. The control signal of the output voltage observer consists of a non-linear control term ( u n ) and equivalent control term ( u e q ). The non-linear control term ( u n ) forces the estimated state errors to reach the designed hypersurface, while the equivalent control term ( u e q ) allows them to slide along with the desired dynamic behavior and to converge to zero:
u t = u t e q + u t n ,
u t e q = a 1 e t + β t e t ρ t 1 / ρ t 2 ,
u t n = 0 t k t s g n S t τ d τ ,
where k t = a 1 F o c + η t , F o c V ˙ o c Z V ^ ˙ o c Z and η t is a positive constant.
When plugging (9)–(13) into (10), the following equations can be formed as below:
S t = a 1 e o c 0 t k t s g n S t τ d τ ,
S ˙ t = a 1 e ˙ o c k t s g n S t ,
The system stability can be verified by choosing the Lyapunov candidate function as V t 1 = 1 / 2 · S t 2 . Since V ˙ t 1 = S t S t ˙ = a 1 e ˙ o c S t k t S t η t S t 0 , for S t 0 , the output voltage could converge to the true value in finite time. When the output voltage reaches the sliding surface, the open-circuit voltage error can be calculated as e o c = u t n / a 1 .

3.2. Estimation of the Open-Circuit Voltage

Instead of using the average OCV value ( O C V a v g Z ) to design an open-circuit voltage observer proposed in [14], this paper applies a more accurate open-circuit voltage value to form an observer by considering hysteresis, which can be expressed by V ^ o c Z = O C V ^ a v g Z + s g n I V h . Then, the open-circuit voltage observer can be obtained after getting the open-circuit voltage error, where u o c is the control signal of the open-circuit voltage observer:
V ^ ˙ o c Z = k a 2 V ^ t k a 2 V ^ o c Z k a 2 V ^ p + u o c ,
The error system for the open-circuit voltage is:
e ˙ o c = k a 2 e t k a 2 e o c k a 2 e p u o c ,
The sliding hyperplane for the open-circuit voltage is chosen as follows:
S o c = e ˙ o c + β o c e o c ρ o c 1 / ρ o c 2 ,
where β o c , ρ o c 1 , and ρ o c 2 are positive constants.
The following control signal forces the open-circuit voltage error to the sliding hyperplane, and then pushes it to zero:
u o c = u o c e q + u o c n ,
u o c e q = k a 2 e t k a 2 e o c + β o c e o c ρ o c 1 / ρ o c 2 ,
u o c n = 0 t k o c s g n S o c τ d τ ,
where k o c = k a 2 F p + η o c , F p V ˙ p V ^ ˙ p , and η o c is a positive constant.
When plugging (15–19) into (16), the following equations can be formed as below:
S o c = k a 2 e p 0 t k o c s g n S o c τ d τ ) ,
S ˙ o c = k a 2 e ˙ p k o c s g n S o c ,
The Lyapunov candidate function for the open-circuit voltage can be designed as V o c 1 Z = 1 / 2 · S o c 2 to evaluate the stability. Since V ˙ o c 1 Z = S o c S o c ˙ = k a 2 e ˙ p S o c k o c S o c η o c S o c 0 , for S o c 0 , the open-circuit voltage could converge to the true value in finite time. When the open-circuit voltage approaches the sliding surface, the polarization voltage error can be obtained as e p = u o c n / k a 2 .

3.3. Estimation of the Polarization Voltage

After getting the polarization voltage error, the polarization voltage observer can be chosen as follows, where u p is the control signal of the polarization voltage observer:
V ^ ˙ p = a 1 V ^ p + b 2 I + u p ,
The error system for the polarization voltage is:
e ˙ p = a 1 e p + f u p ,
The sliding hyperplane for the polarization voltage is chosen as follows:
S p = e ˙ p + β p e p ρ p 1 / ρ p 2 ,
where β p , ρ p 1 , and ρ p 2 are positive constants.
Then the control signals of the polarization voltage can be designed as follows:
u p = u p e q + u p n ,
u p e q = a 1 e p + β p e p ρ p 1 / ρ p 2 ,
u p n = 0 t k p s g n S p τ d τ ,
where k p = F 1 + η p , F 1 f ˙ and η p is a positive constant.
When plugging (21–25) into (22), the following equations can be formed as below:
S p = f 0 t k p s g n S p τ d τ ,
S ˙ p = f ˙ k p s g n S p τ ,
The Lyapunov candidate function for the polarization voltage can be chosen as V p 1 = 1 / 2 S p 2 . Since V ˙ p 1 = S p S p ˙ = f ˙ S p k p S p η p S p 0 , for S p 0 , the polarization voltage could converge to the true values in finite time. Battery SoC is obtained through the OCV curve after three estimated states converge to actual battery states.
Compared with the Luenberger observer-based SoC estimation method, the TSMO-based method introduces switching control signals to quickly force estimated states to approach actual values and the designed hyperplanes to converge states to real values in finite time so that the estimation accuracy has been increased.

4. Results and Discussion

The experimental data used in this paper were collected from the database provided by the Center for Advanced Life Cycle Engineering (CALCE) at the University of Maryland [27]. The battery tests were carried out at room temperature (25 °C). The parameters of the battery are shown in Table 1. Temperature is another factor that impacts battery SoC. The methodology proposed in this study is valuable for other temperature cases.

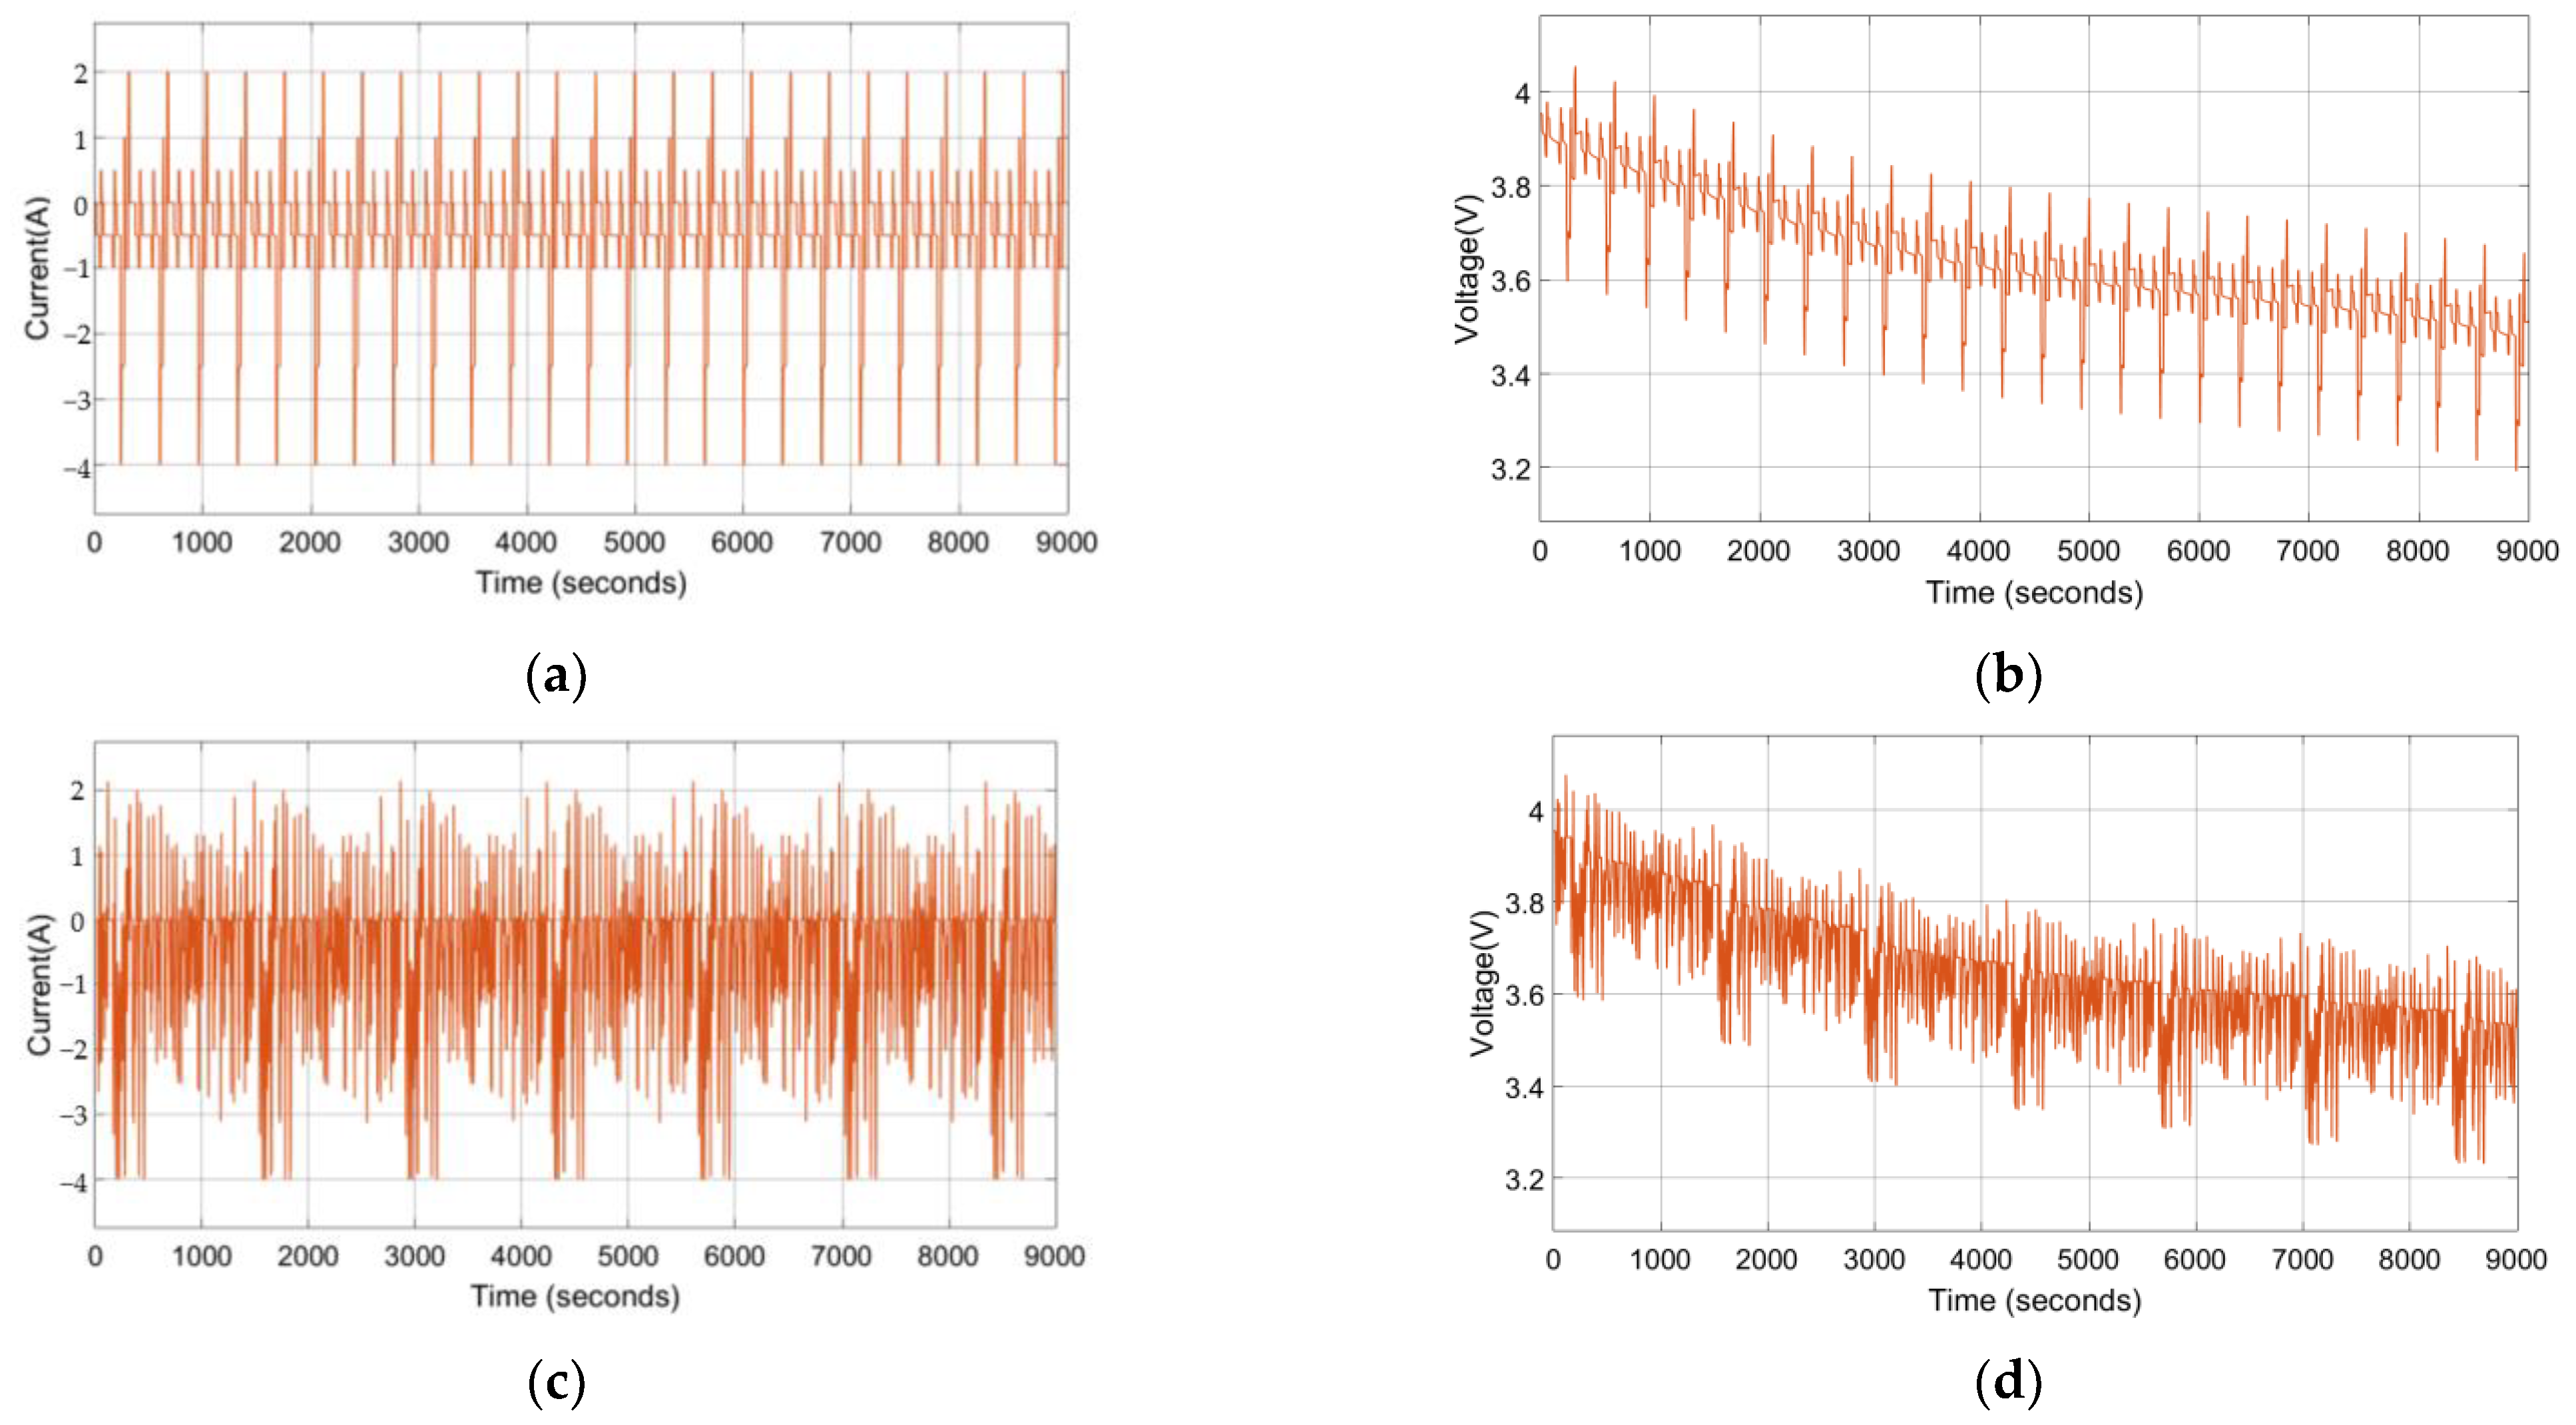
4.1. Li-ion Battery Test Samples

We evaluate the performance of battery SoC estimation using two dynamic battery tests: the dynamic street test (DST) and the federal urban driving schedule (FUDS) test [27]. The DST simulates simple dynamic loading conditions of a Li-ion battery, while the FUDS represents more complex power demands of higher standard battery applications [27]. The voltage and current profiles of the 18650 Li-ion battery under DST and FUDS are shown in Figure 3. From Figure 3, it can be seen that DST and DUDS have the same voltage variation trend and current variation range, while the FUDS has more complex and frequent test profiles.

4.2. Performance Evaluation between Different Battery Models

To verify the accuracy of estimating battery SoC by TSMO based on the hysteresis RC model, we compare the performance of the TSMO-based battery SoC estimation method with and without hysteresis included [15] under two dynamic batteries tests (DST and FUDS). The red dotted line indicates estimated results based on the hysteresis RC battery model, while the solid blue line indicates estimated results based on the nominal electrical circuit mode (without considering the hysteresis effect) (Figure 4).
The estimated SoC is compared with the measured SoC (solid green line) using DST and FUDS, which are shown in Figure 4b,d. Their corresponding simulation results from 3000 s to 5000 s are enlarged in Figure 4b,d to reflect the usual battery discharge conditions that the SoC value drops from 0.6 to 0.4. The root means square error (RMSE) is used to evaluate how close a fitted line consisting of estimates is to the measured data points. Figure 4e,f illustrate the estimated SoC error.
From Figure 4, the red dotted line (indicating estimated SoC using the modified model) is closer to the solid green line (indicating measured SoC). In addition, battery SoC varies more frequently under the FUDS test. Therefore, the FUDS test requires a faster response speed and a more stable system. The RMSEs are 1.24% and 1.34% under DST and FUDS tests based on the nominal electrical circuit model, while the RMSEs are 0.95% under both DST and FUDS tests based on the hysteresis RC battery model. Therefore, the proposed observer generates a remarkably smaller estimation error with RMSE under 1%.

4.3. Performance Evaluation between Different Observer Methods

To verify the response speed of estimating battery SoC, the performance of battery SoC estimation has been evaluated using Luenberger observers [19] (solid lines, Figure 5) and TSMOs (dotted lines, Figure 5) based on the hysteresis RC battery model with different initial SoC guess values. Taking initial SoC guess values at 0.7, 0.5, and 0.3 as examples, both observer-based methods can force the estimated states to converge to the measured SoC (solid green line, Figure 5).
Figure 6 illustrates the estimated results from 0 s to 4000 s. Figure 5a,c show the comparative results of convergence speed between Luenberger observers and TSMOs under DST and FUDS. Figure 5b,d illustrate the SoC estimation error. It is clear that the TSMO has a faster response speed compared with the Luenberger observer. For Luenberger observer-based SoC estimation, there is a specific point to which all the curves converged. Since the estimated curves are overlapped after that point, it can be identified as the convergence point and represents the convergence time of the algorithm. Regarding the terminal sliding motion and finite time convergence equations given by [15], the convergence time of TSMO is influenced by the SoC guess values. Therefore, the estimated curves cannot be overlapped.
From the above experimental results, it is clear that battery SoC estimation accuracy and response speed have been improved by considering the hysteresis and using TSMOs.

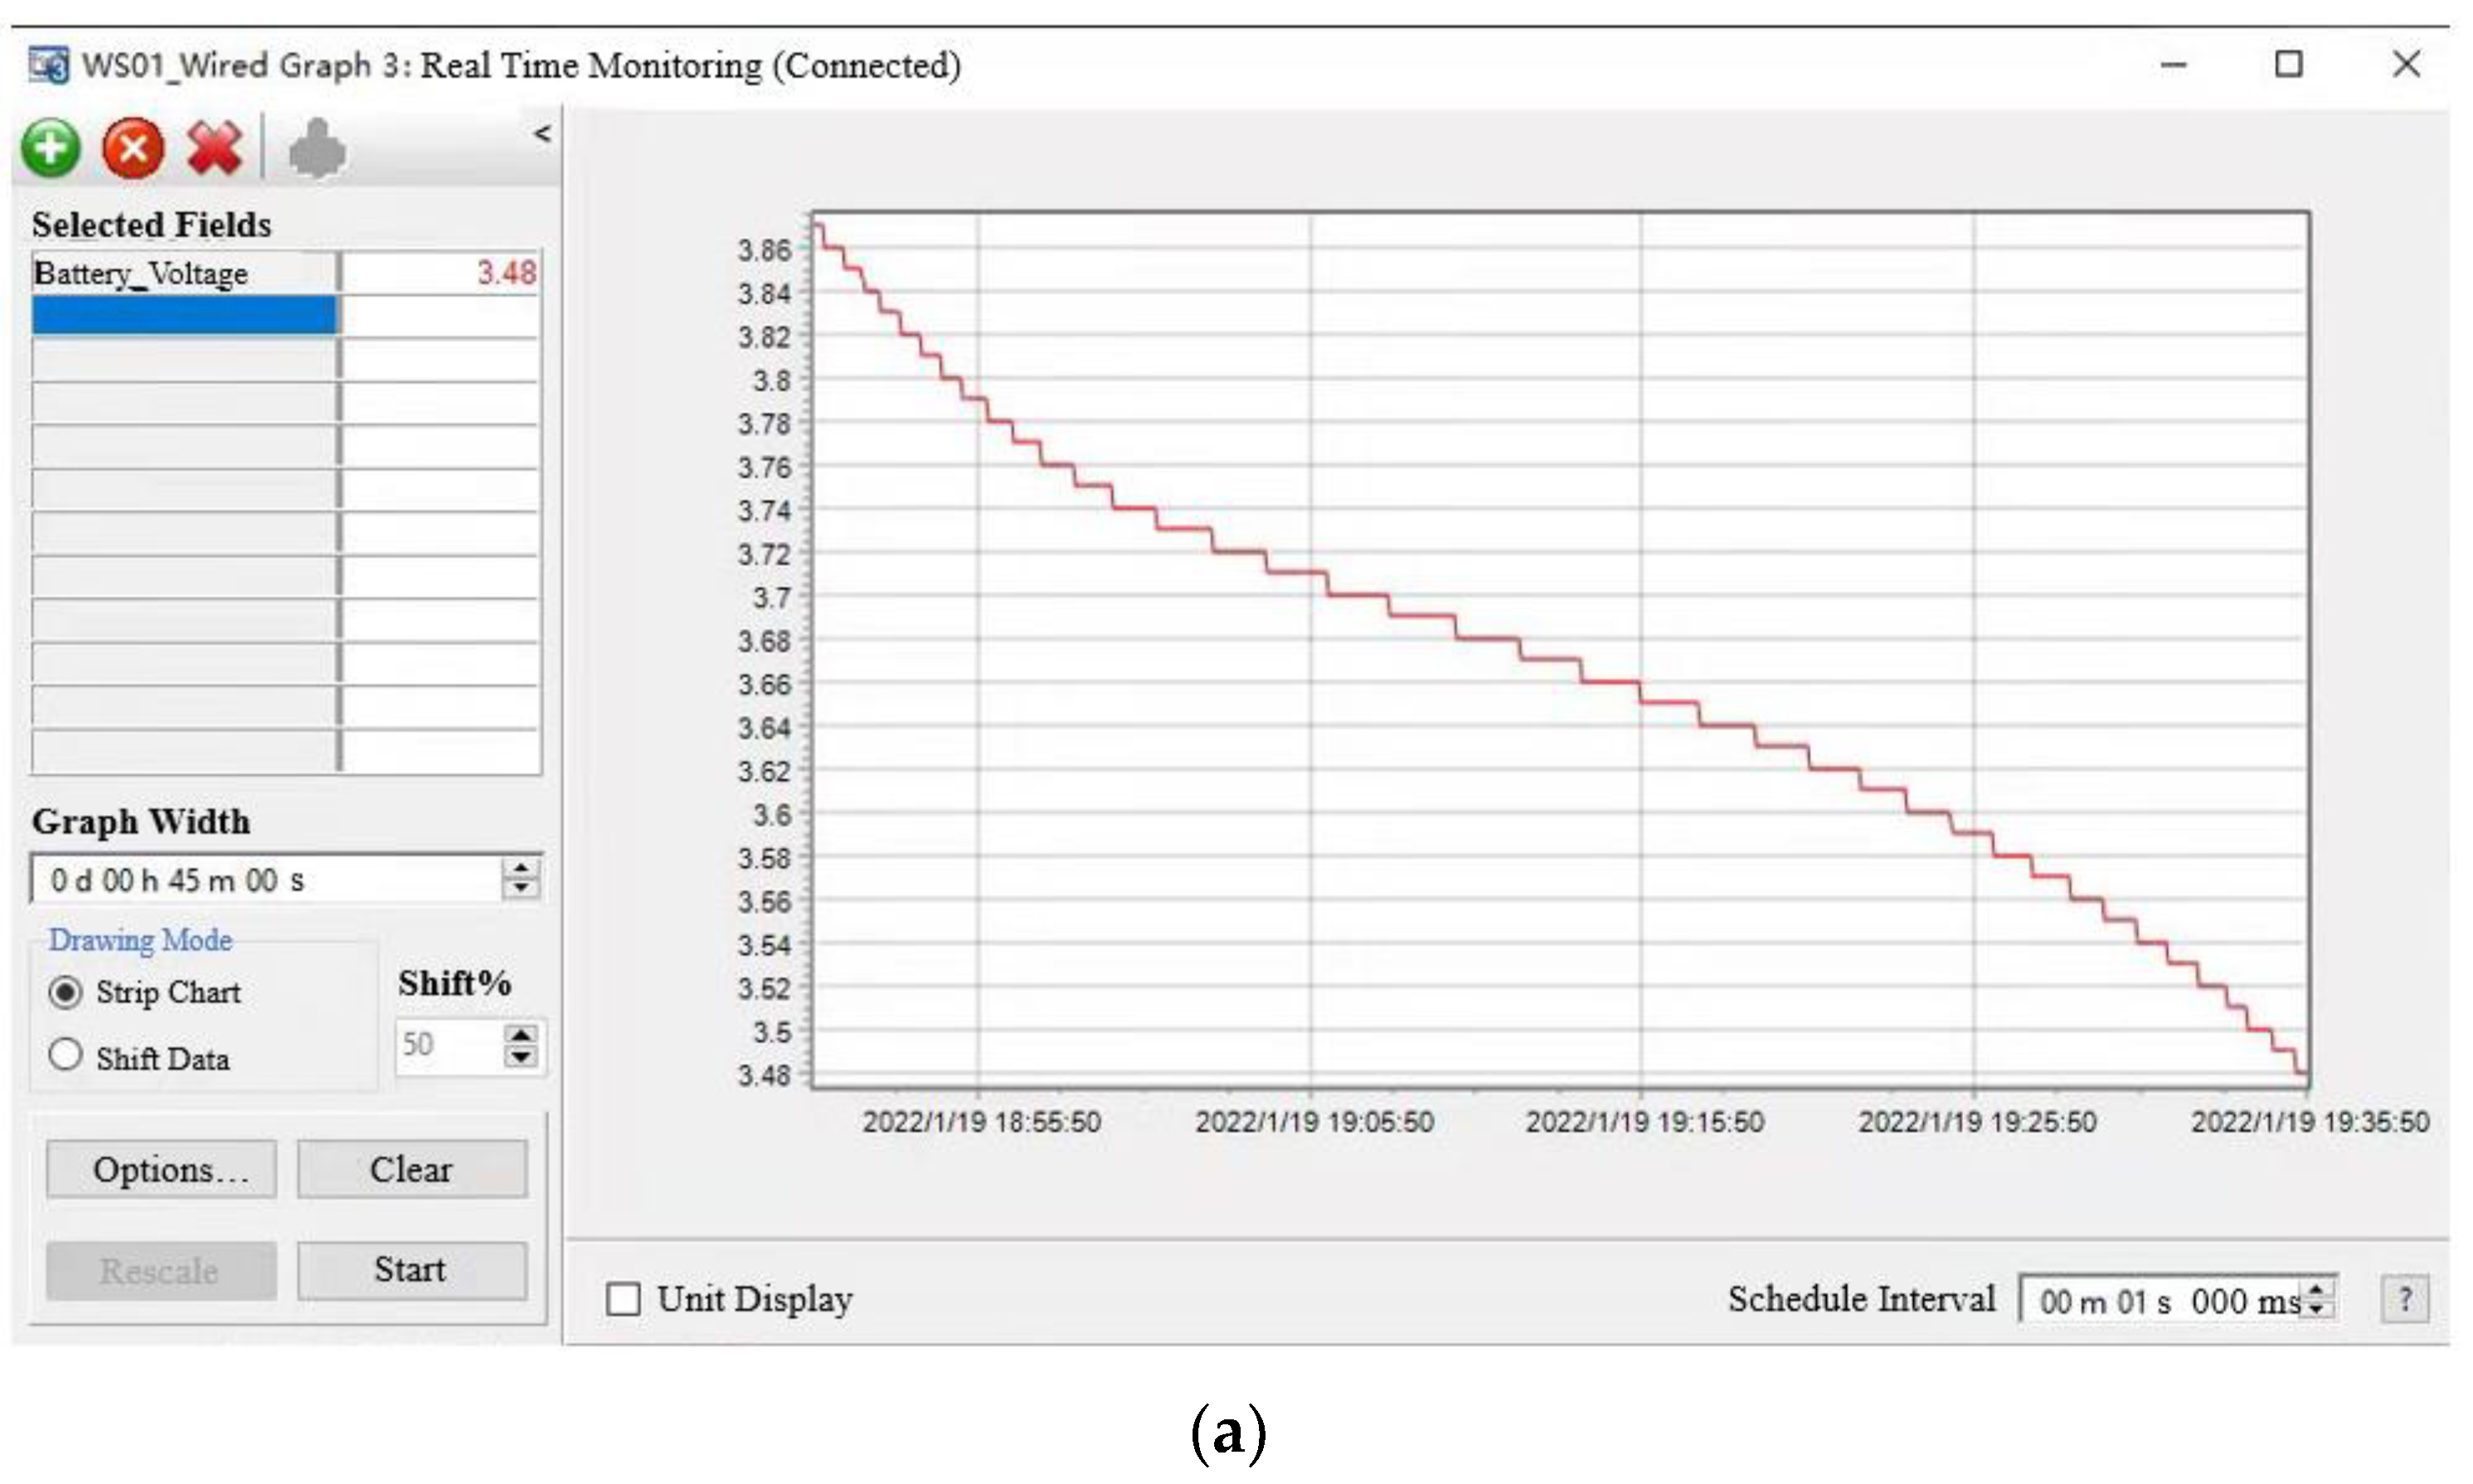
5. Automatic Monitoring System

An automatic monitoring system allows real-time data display and fault alarm, which is the fundamental basis for battery management systems (BMS) and subsequent Internet of things (IoT) applications. Based on the proposed battery SoC estimation algorithm in Section 3, an automatic monitoring system is developed for energy storage devices in power stations, as shown in Figure. 6. The monitoring system set-up includes: (1) sensors (GLT-B direct voltage intelligent sensors) for data acquisition and signal exchange with the upper machine through RS485 serial interface using Modbus protocol; (2) a CR1000X Datalogger and its software for providing data storage, processing and demonstration; and (3) a Data Transfer Unit (DTU) for data publishing. The automated monitoring system will output voltage, current, and SoC of the storage batteries. This setting can also be used as a reference for monitoring other measurable parameters.
  • Data Acquisition
In the battery monitoring system, sensors are used to measure the output voltage and current of the Li-ion battery with a time interval of every 5 s. The sampled voltage and current are transmitted through the RS485 communication interface following the support Modbus protocol. In this case, we choose one of the most common, stable, and cheap sensors used in industry, GLT-B direct voltage intelligent sensors [29]. In addition to sensing the physical change and transmit signals, the data acquisition system is capable of strengthening input signals for further processing.
  • Data Processing
A data logger is adopted for providing signal measurement and data storage. The program algorithm of the data logger could calculate battery SoC based on the measured voltage and current.
The CR1000X datalogger [30] of Campbell Scientific, Inc., is used for converting electrical signals into sampled data, which is stored in its internal memory. The CR1000X datalogger is a low-powered device that provides a precision measurement of sensors, drives direct communication and telecommunications, analyses, and stores data and programs onboard [30]. BASIC-like programming language, CRBasic [31], has been used to support data processing and analysis routines. The LoggerNet software [32] is used to support programming, communication, and data retrieval between data loggers and a PC computer. Real-time collected battery data could be observed and analyzed by the software. By programming the data logger, the battery SoC can be calculated using the algorithm in Section 3. The real-time measured battery input current, output voltage, and calculated SoC results will be demonstrated in a table and graph on the PC. To simplify the test, the input current is chosen as a constant value 2A. Then, the output voltage and calculated SoC is shown in Figure 7a,b. From Figure 7, it can be seen that during the battery discharge, battery output voltage and SoC values drop simultaneously.
  • Data Publishing
A data transfer unit (DTU) is required to provide the conversion between serial data and IP data. The F2X16 V2 series IP Modem [33] is a wireless data terminal used in the Internet of things (IoT), providing wireless long-distance data transmission through public cellular networks. After connecting DTU to a data logger through RS485, battery information could be published through a wireless network. Therefore, real-time Li-ion battery information, including output voltage, current, and SoC, could be both automatically monitored for safety reasons and published for subsequent processing in battery networks.

6. Conclusions

The purpose of this research is to rapidly and accurately acquire real-time battery SoC, which could ensure batteries work within a safe range and prevent overcharge and over-discharge. The accuracy of battery SoC estimation has been increased using a hysteresis RC battery model, which diminishes estimated errors due to the hysteresis effect. By applying a terminal sliding mode observer (TSMO), higher estimation accuracy and faster response speed can be obtained simultaneously compared with the Luenberger observer-based method. The battery SoC estimation accuracy has been evaluated under two dynamic battery tests based on battery models with and without hysteresis included using TSMO. Additionally, the response speed of battery SoC estimation was verified using different observer methods, Luenberger observers and TSMOs, based on the hysteresis RC battery model. Simulation results show that the TSMO-based SoC estimation method achieves higher estimation accuracy and faster response speed when integrating hysteresis effect into RC equivalent circuit battery model compared with the Luenberger observer. Moreover, real-time battery information, including output voltage and SoC, was acquired and demonstrated by a designed automatic monitoring system. The designed system is valuable for all battery application cases. Future works could focus on battery information exchange and energy control.

Author Contributions

Conceptualization, M.C. and F.H.; methodology, M.C., C.X., and Y.F.; software, M.C., W.G., and J.X.; validation, M.C. and F.H.; formal analysis, M.C.; investigation, M.C.; resources, M.C. and C.X.; data curation, M.C.; writing—original draft preparation, M.C.; writing—review and editing, F.H, Y.F., C.X., J.X., and L.S.; visualization, M.C.; supervision, F.H. and L.S.; project administration, M.C. All authors have read and agreed to the published version of the manuscript.

Funding

This research received no external funding.

Institutional Review Board Statement

Not applicable.

Informed Consent Statement

Not applicable.

Data Availability Statement

Publicly available datasets were analyzed in this study. This data can be found here: https://web.calce.umd.edu/batteries/data.htm (accessed on 1 April 2022).

Conflicts of Interest

The authors declare no conflict of interest.

References

  1. Diouf, B.; Pode, R. Potential of lithium-ion batteries in renewable energy. Renew. Energy 2015, 76, 375–380. [Google Scholar] [CrossRef]
  2. Aylor, J.H.; Thieme, A.; Johnso, B.W. A battery state-of-charge indicator for electric wheelchairs. IEEE Trans. Ind. Electron. 1992, 39, 398–409. [Google Scholar] [CrossRef]
  3. Xing, Y.; He, W.; Pecht, M.; Tsui, K.L. State of charge estimation of lithium-ion batteries using the open-circuit voltage at various ambient temperatures. Appl. Energy 2014, 113, 106–115. [Google Scholar] [CrossRef]
  4. Barai, A.; Widanage, W.D.; Marco, J.; McGordon, A.; Jennings, P. A study of the open circuit voltage characterization technique and hysteresis assessment of lithium-ion cells. J. Power Sources 2015, 295, 99–107. [Google Scholar] [CrossRef]
  5. Kang, L.; Zhao, X.; Ma, J. A new neural network model for the state-of-charge estimation in the battery degradation process. Appl. Energy 2014, 121, 20–27. [Google Scholar] [CrossRef]
  6. Jiani, D.; Zhitao, L.; Youyi, W.; Changyun, W. A fuzzy logic-based model for Li-ion battery with SOC and temperature effect. In Proceedings of the 11th IEEE International Conference on Control & Automation (ICCA), Taichung, Taiwan, 18–20 June 2014; pp. 1333–1338. [Google Scholar]
  7. Saji, D.; Babu, P.S.; Ilango, K. SoC Estimation of Lithium Ion Battery Using Combined Coulomb Counting and Fuzzy Logic Method. In Proceedings of the 2019 4th International Conference on Recent Trends on Electronics, Information, Communication & Technology (RTEICT), Bangalore, India, 17–18 May 2019; pp. 948–952. [Google Scholar]
  8. Ipek, E.; Eren, M.K.; Yilmaz, M. State-of-charge estimation of li-ion battery cell using support vector regression and gradient boosting techniques. In Proceedings of the 2019 International Aegean Conference on Electrical Machines and Power Electronics (ACEMP) & 2019 International Conference on Optimization of Electrical and Electronic Equipment (OPTIM), Istanbul, Turkey, 27–29 August 2019; pp. 604–609. [Google Scholar]
  9. Wang, T.; Chen, S.; Ren, H.; Zhao, Y. Model-based unscented Kalman filter observer design for lithium-ion battery state of charge estimation. Int. J. Energy Res. 2018, 42, 1603–1614. [Google Scholar] [CrossRef]
  10. Zhao, L.; Liu, Z.; Ji, G. Lithium-ion battery state of charge estimation with model parameters adaptation using H∞ extended Kalman filter. Control Eng. Pract. 2018, 81, 114–128. [Google Scholar] [CrossRef]
  11. Linghu, J.; Kang, L.; Liu, M.; Luo, X.; Feng, Y.; Lu, C. Estimation for state-of-charge of lithium-ion battery based on an adaptive high-degree cubature Kalman filter. Energy 2019, 189, 116204. [Google Scholar] [CrossRef]
  12. Hu, X.; Sun, F.; Zou, Y. Estimation of state of charge of a lithium-ion battery pack for electric vehicles using an adaptive Luenberger observer. Energies 2010, 3, 1586–1603. [Google Scholar] [CrossRef]
  13. Barsali, S.; Ceraolo, M.; Li, J.; Lutzemberger, G.; Scarpelli, C. ELECTRIMACS 2019; Springer: Cham, Switzerland, 2020; pp. 655–667. [Google Scholar]
  14. Zou, C.; Hu, X.; Dey, S.; Zhang, L.; Tang, X. Nonlinear fractional-order estimator with guaranteed robustness and stability for lithium-ion batteries. IEEE Trans. Ind. Electron. 2017, 65, 5951–5961. [Google Scholar] [CrossRef]
  15. Feng, Y.; Xue, C.; Han, Q.L.; Han, F.; Du, J. Robust estimation for state-of-charge and state-of-health of lithium-ion batteries using integral-type terminal sliding-mode observers. IEEE Trans. Ind. Electron. 2019, 67, 4013–4023. [Google Scholar] [CrossRef]
  16. Zhang, F.; Liu, G.; Fang, L. A battery state of charge estimation method using sliding mode observer. In Proceedings of the 2008 7th world congress on intelligent control and automation, Chongqing, China, 25–27 June 2008; pp. 989–994. [Google Scholar]
  17. Du, J.; Liu, Z.; Wang, Y.; Wen, C. An adaptive sliding mode observer for lithium-ion battery state of charge and state of health estimation in electric vehicles. Control Eng. Pract. 2016, 54, 81–90. [Google Scholar] [CrossRef]
  18. Ning, B.; Cao, B.; Wang, B.; Zou, Z. Adaptive sliding mode observers for lithium-ion battery state estimation based on parameters identified online. Energy 2018, 153, 732–742. [Google Scholar] [CrossRef]
  19. Chen, M.; Han, F.; Shi, L.; Feng, Y.; Xue, C.; Li, C. Accurate Estimation on the State-of-Charge of Lithium-Ion Battery Packs. In Proceedings of the International Conference on Broadband Communications, Networks and Systems, Virtual Event, 28–29 October 2021; pp. 251–262. [Google Scholar]
  20. Huang, C.; Wang, Z.; Zhao, Z.; Wang, L.; Lai, C.S.; Wang, D. Robustness evaluation of extended and unscented Kalman filter for battery state of charge estimation. IEEE Access 2018, 6, 27617–27628. [Google Scholar] [CrossRef]
  21. Tian, Y.; Xia, B.; Sun, W.; Xu, Z.; Zheng, W. A modified model based state of charge estimation of power lithium-ion batteries using unscented Kalman filter. J. Power Sources 2014, 270, 619–626. [Google Scholar] [CrossRef]
  22. Luo, Y.; Qi, P.; Kan, Y.; Huang, J.; Huang, H.; Luo, J.; Wang, J.; Wei, Y.; Xiao, R.; Zhao, S. State of charge estimation method based on the extended Kalman filter algorithm with consideration of time-varying battery parameters. Int. J. Energy Res. 2020, 44, 10538–10550. [Google Scholar] [CrossRef]
  23. Zheng, Y.; Gao, W.; Ouyang, M.; Lu, L.; Zhou, L.; Han, X. State-of-charge inconsistency estimation of lithium-ion battery pack using mean-difference model and extended Kalman filter. J. Power Sources 2018, 383, 50–58. [Google Scholar] [CrossRef]
  24. Ma, Y.; Li, B.; Xie, Y.; Chen, H. Estimating the state of charge of lithium-ion battery based on sliding mode observer. IFAC-PapersOnLine 2016, 49, 54–61. [Google Scholar] [CrossRef]
  25. Kim, I.S. Nonlinear state of charge estimator for hybrid electric vehicle battery. IEEE Trans. Power Electron. 2008, 23, 2027–2034. [Google Scholar]
  26. Dey, S.; Ayalew, B.; Pisu, P. Nonlinear robust observers for state-of-charge estimation of lithium-ion cells based on a reduced electrochemical model. IEEE Trans. Control Syst. Technol. 2015, 23, 1935–1942. [Google Scholar] [CrossRef]
  27. Zheng, F.; Xing, Y.; Jiang, J.; Sun, B.; Kim, J.; Pecht, M. Influence of different open circuit voltage tests on state of charge online estimation for lithium-ion batteries. Appl. Energy 2016, 183, 513–525. Available online: https://web.calce.umd.edu/batteries/data.htm (accessed on 1 April 2022). [CrossRef]
  28. Biswas, A.; Gu, R.; Kollmeyer, P.; Ahmed, R.; Emadi, A. Simultaneous state and parameter estimation of li-ion battery with one state hysteresis model using augmented unscented kalman filter. In Proceedings of the 2018 IEEE Transportation Electrification Conference and Expo (ITEC), Long Beach, CA, USA, 13–15 June 2018; pp. 1065–1070. [Google Scholar]
  29. HUAIDIAN. Available online: https://www.yiqi800.com/huaidian/ (accessed on 13 February 2022).
  30. CR1000X Measurement and Control Datalogger. Available online: https://www.campbellsci.com/cr1000x (accessed on 13 February 2022).
  31. CRBasic Editor Stand-Alone Installation for CRBasic Editor. Available online: https://www.campbellsci.com/crbasiceditor (accessed on 13 February 2022).
  32. LoggerNet Datalogger Support Software. Available online: https://www.campbellsci.com/loggernet (accessed on 13 February 2022).
  33. Four-Faith. Available online: http://www.four-faith.com/ (accessed on 13 February 2022).
Figure 1. (a) OCV curves of a 18650 type battery [27] during charge and discharge; (b) SoC discrepancy between OCV curves during battery charge and discharge.
Energies 15 02658 g001
Figure 2. The first order hysteresis RC equivalent circuit model.
Energies 15 02658 g002
Figure 3. Voltage and current profiles of 18650 Li-ion battery: (a) current profile under DST; (b) voltage profile under DST; (c) current profile under FUDS; and (d) voltage profile under FUDS.
Energies 15 02658 g003
Figure 4. Battery SoC estimation results using TSMO: (a) SoC estimation results using DST; (b) enlarged simulated result of (a) between 3000 s–5000 s; (c) SoC estimation results using FUDS; (d) enlarged simulation result of (c) between 3000 s–5000 s; (e) SoC estimation error under DST; and (f) SoC estimation error under FUDS.
Energies 15 02658 g004
Figure 5. Comparison results between Luenberger observer and TSMO with different initial SoC guess values: (a) SoC estimation results under DST; (b) SoC estimation error under DST; (c) SoC estimation results under FUDS; and (d) SoC estimation error under DST.
Energies 15 02658 g005
Figure 6. Overall architecture of the lithium battery monitoring system.
Energies 15 02658 g006
Figure 7. Real-time battery information demonstration: (a) real-time battery output voltage; and (b) real-time battery SoC.
Energies 15 02658 g007aEnergies 15 02658 g007b
Table 1. Specifications of INR 18650-20R Li-ion battery.
Model TypeLNMC/Graphite
Nominal capacity2000 mAh
Nominal voltage3.6 V
Charging cut-off voltage4.2 V
Discharging cut-off voltage2.5 V
Maximum current22 A
Publisher’s Note: MDPI stays neutral with regard to jurisdictional claims in published maps and institutional affiliations.

