Article

A Group-Based Droop Control Strategy Considering Pitch Angle Protection to Deloaded Wind Farms

1
School of Electrical Engineering, Guangxi University, Nanning 530004, China
2
Guangxi Key Laboratory of Power System Optimization and Energy Technology, Guangxi University, Nanning 530004, China
*
Author to whom correspondence should be addressed.
Energies 2022, 15(8), 2722; https://doi.org/10.3390/en15082722
Submission received: 2 March 2022 / Revised: 30 March 2022 / Accepted: 31 March 2022 / Published: 8 April 2022
(This article belongs to the Special Issue Power System Dynamics and Renewable Energy Integration)

Abstract

:
To promote the frequency stability of a system with high penetration of wind power integrated into it, this paper presents a systematic frequency regulation strategy for wind farms (WFs). As preparation for frequency response, a coordinated deloading control (CDC) scheme combining the over-speed control (OSC) and the pitch angle control (PAC) methods is proposed for wind turbine generators (WTGs) to preserve power reserve. The novelty lies in the consideration of high wind speed situations and pitch angle protection. Then, a group-based droop control (GBDC) scheme is proposed for a WF consisting of WTGs with the CDC. In this scheme, WTGs are divided into two groups for different controls. To improve the frequency response performance and ensure stable operation, the droop coefficients of the WF, groups, and all WTGs are determined according to their frequency regulation capabilities (FRCs). Moreover, pitch angle protection during the frequency response process is considered in this scheme. The effectiveness of the GBDC scheme is verified by comparing it with several existing droop control schemes in various situations.

1. Introduction

Owing to the properties of cleanness, renewability, and abundance, the exploitation of wind energy for power generation has been identified with vital significance by many countries in recent decades [1]. As wind penetration increases, the intermittency of wind power and the de-inertia behavior of wind turbine generators (WTGs) bring unprecedented challenges to the frequency stability of the power system [2]. In this situation, the ancillary service of frequency regulation provided by WTGs becomes indispensable.
To obtain the optimal wind energy capture efficiency, WTGs usually operate in the maximum power point tracking (MPPT) state [3,4]. Once frequency fluctuations are detected, WTGs will temporarily deviate from the MPPT state to provide extra active power by releasing the rotational kinetic energy in their rotors to support frequency stability. There are different kinds of control methods for WTGs in the MPPT state to participate in frequency regulation, including droop control, virtual inertia control [5,6,7,8,9,10], fixed trajectory control [11,12,13,14,15], and combinations of the above control methods [16,17]. However, after the early power-increasing stage, the rotor speeds need to be restored and returned to their optimal value, which may lead to a secondary dip in the system frequency [6].
To address this problem, WTGs can preserve a part of the output reserve for frequency regulation through a so-called deloading control. Generally, there are two kinds of deloading controls: pitch angle control (PAC) and over-speed control (OSC). With the PAC method in [18,19], power reserves are produced by increasing the pitch angles of WTGs to reduce the wind power coefficients before frequency events. Although the PAC method can complete the deloading task at various ranges of wind speeds, the frequent action on the blade pitch angle can easily cause wear on the mechanical devices of WTGs and, consequently, shorten their service lives [20]. With the OSC method, the rotor speed is adjusted to exceed the optimal value to obtain a sub-optimal wind power coefficient so that an active power headroom can be produced for frequency regulation. Considering convenience and the harmlessness property, references [17,21] suggest that WTGs can accomplish a deloading task through an independent OSC approach. However, the optimal rotor speed gradually approaches its limit with increasing wind speed, which indicates the attenuation of the exceeding room. Given the wide range of operating environments, the OSC method may not fulfill the deloading requirements, especially when an order of large deloading extent coincides with a high wind speed situation. Considering the harmful property of the PAC and the narrow control range of the OSC [22], a sophisticated deloading scheme combining the PAC and the OSC is demanded as preparation for frequency regulation.
The frequency regulation controls of deloading WTGs are similar to those of WTGs in the MPPT state. Affected by the wake effect [23,24,25], the frequency regulation capability (FRC) of each WTG in a wind farm (WF) can be different because of the various arriving wind speeds. Thus, setting the same control parameters for different WTGs will not only waste resources but even endanger operating stability [26]. In order to solve this problem, some works adjust the control parameters of WTGs in the MPPT state according to the kinetic energy stored in their rotors [7,9,27,28,29]. For WTGs in the deloading state, references [30,31] proposed reserve-based control schemes where the droop loop gains are generally proportional to the power reserve margins. However, large droop coefficients for WTGs at high wind speed will inevitably lead to large-scale movements of the blade pitch angle, which will have a negative effect on the WTGs’ long-term service. Moreover, the FRCs of WTGs are underestimated by reserve-based strategies. Therefore, a novel frequency regulation strategy from the perspective of a WF is urgently demanded.
This paper proposes a systematic control strategy to enable WFs to participate in system frequency regulation. The main contributions of this paper are as follows: First, this paper presents a coordinated deloading scheme (CDS) combining the OSC and the PAC methods. Compared with the traditional deloading scheme, the CDS applies to the situation of high wind speed where the OSC cannot accomplish the deloading target alone. The problem of frequent pitch angle actions caused by the PAC is also addressed through the CDS. Second, the FRCs of deloading WTGs and WFs are evaluated based on the mechanism of power point tracking control, which is more precise than the prevalent reserve-based evaluation. Third, a group-based droop control (GBDC) scheme considering the diversity of WTGs is proposed for deloading WFs. In this scheme, WTGs are divided into two groups for different controls. The performance of frequency regulation is improved since the droop coefficients are determined according to the FRCs. On the premise of improving frequency response guarantee, pitch angle protection is also considered in this scheme. Moreover, since the control methods proposed for over-frequency and under-frequency events are symmetrical, this paper is presented from an under-frequency perspective for concision and comprehensibility.

2. Cooperative Deloading Scheme

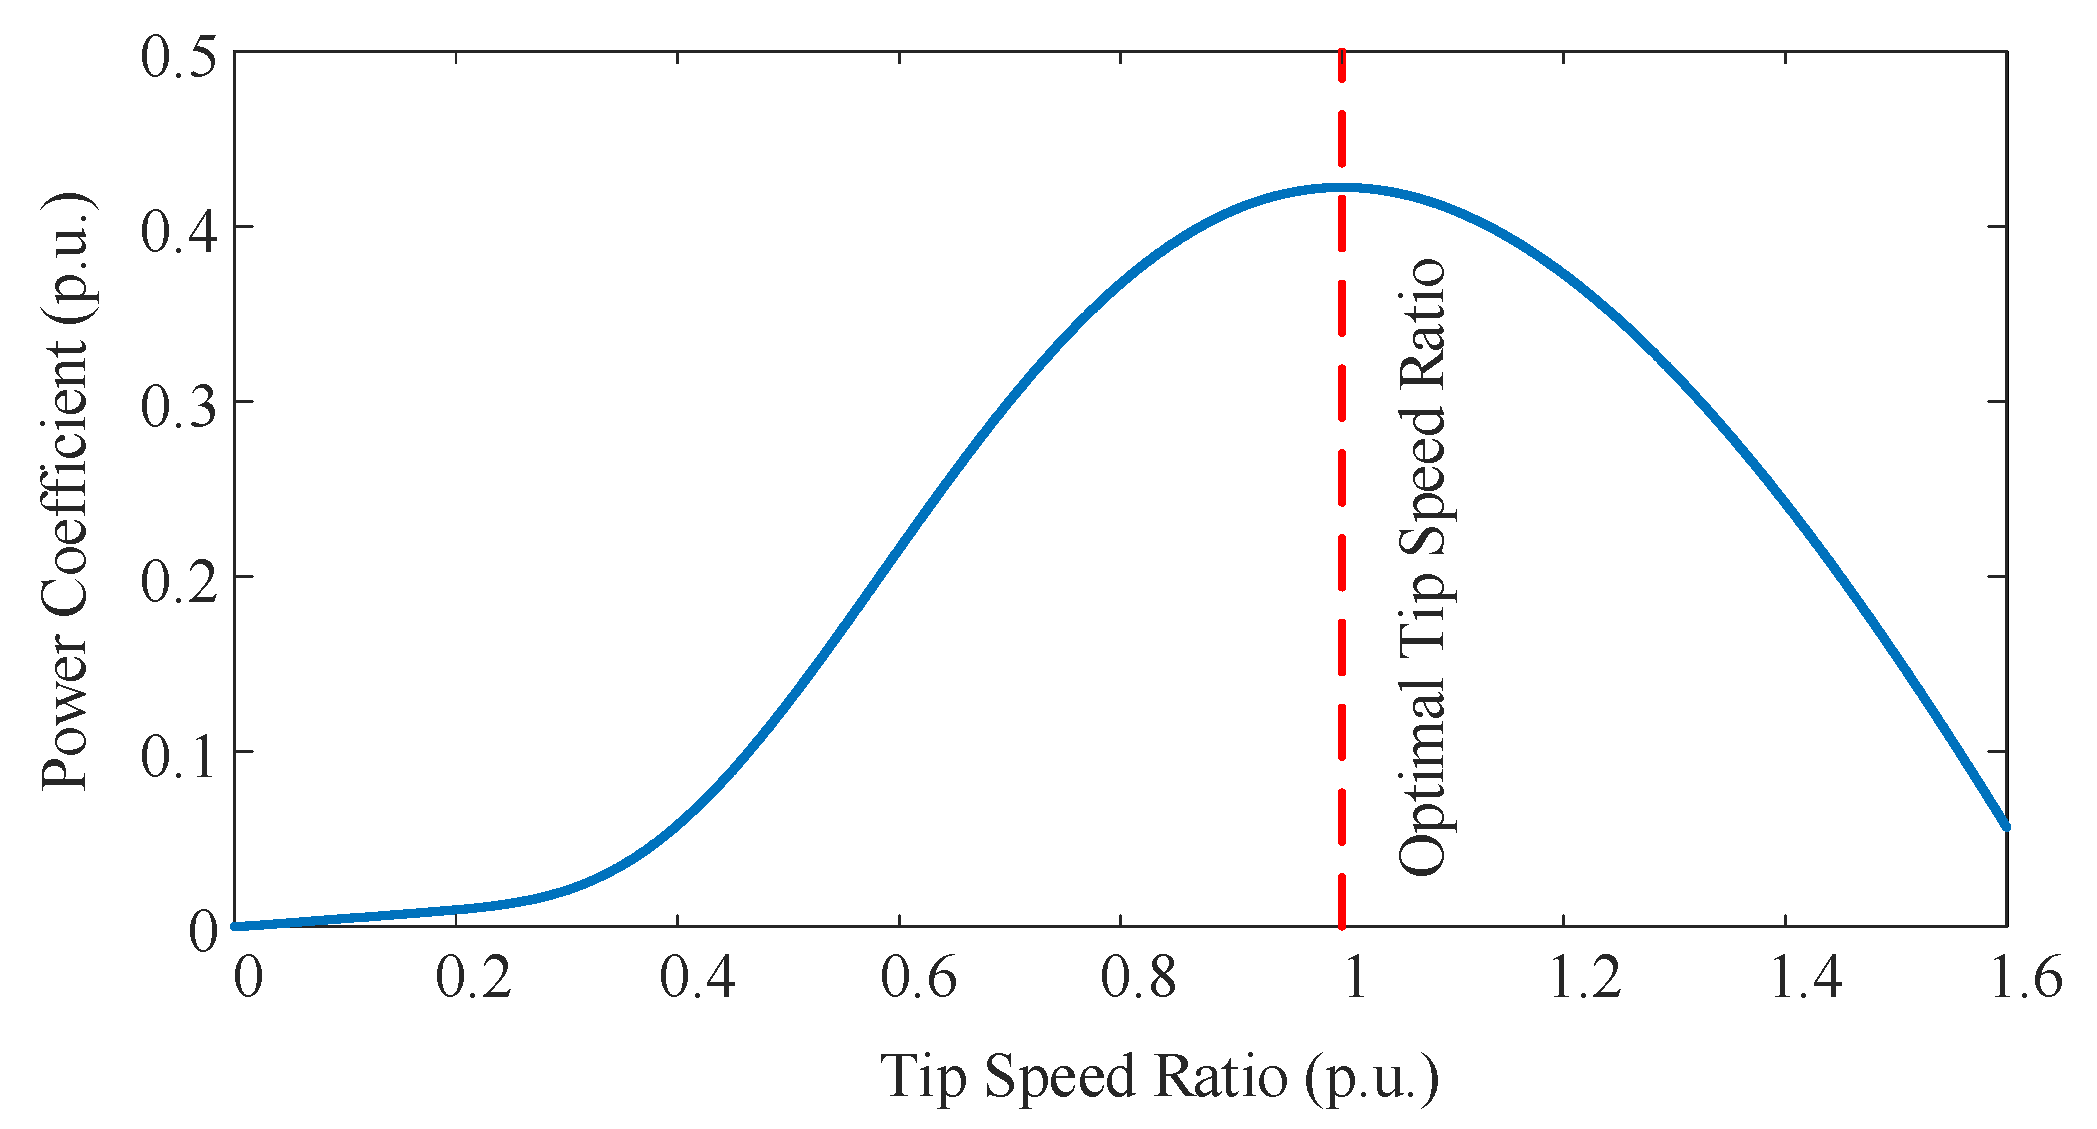
2.1. MPPT Control Principle

Doubly fed induction generators (DFIGs) and direct-drive permanent magnet synchronous generators (PMSGs) are currently the most prevalent wind generators. These two types of WTGs are both composed of a wind turbine, a generator, and a couple of back-to-back power electronic converters. As these WTGs adopt analogous power control frameworks, the research in this paper applies to both DFIGs and PMSGs. In this paper, the simplified model of WTGs in [32] is applied and modified for simulation efficiency. Since the research is mainly focused on the mechanism between the system and the frequency response power with different schemes, parametric uncertainty is not considered in this paper.
Ignoring the loss caused by mechanical friction, the mechanical power, P m , extracted by the wind turbine can be calculated by
P m = 1 2 ρ π R 2 C p ( λ , β ) v 3
where ρ , R , v , and β are the air density, blade radius, wind speed, and blade pitch angle, respectively. The power coefficient, C p , is defined as
C p = 0.5176 ( 116 λ i 0.4 β 5 ) e 21 λ i + 0.0068 λ
where
1 λ i = 1 λ + 0.08 β 0.035 β + 1
The λ among the above equations represents the tip–speed ratio, which can be obtained by
λ = ω r R v
where ω r is the angular speed of the WT. In this paper, a one-mass drive train model is adopted, and the rotating equation of the WTG is described as
P e P m = J ω r d ω r d t
The mechanical power and the power coefficient curves of wind turbines are presented in Figure 1 and Figure 2, respectively. For each definite wind speed, there is a so-called optimal tip–speed ratio, λ opt , and a corresponding rotor speed, ω r   opt , enabling maximum power extraction efficiency. The black dashed curve in Figure 1 is the well-known MPPT curve, consisting of an ordinary operation zone, Zone2 (Segment BC); two constant speed zones, Zone1 and Zone3 (Segments AB and CD); and a constant power zone, Zone4 (Ray DE). WTGs in Zone1, 3, and 4 are under protection controls, which are not suitable for participating in frequency regulation. Thus, the studies in this paper are mainly focused on the WTGs in Zone2.
The optimal active power reference of a WTG in Zone2 is given by
P MPPT = K opt ω r 3
where K opt is the MPPT coefficient, whose expression is
K opt = 1 2 ρ π R 5 λ opt 3 C p ( λ opt , 0 )
As explained above, WTGs in Zone2 are in safe operation; thus, β is set to zero in order to acquire the maximum wind energy harvest.

2.2. Coordinated Deloading Scheme

To address the secondary-frequency-dip issue, WTGs are generally released from the MPPT state to preserve active power reserve margins for frequency regulation. The deloading ratio is generally determined according to the system structure and the operating status of the WF. With an appropriate frequency regulation strategy, 10% deloading work can provide adequate headroom in a system with wind penetration up to 50% [21]. For a given deloading ratio, d % , the deloading power reference is
P del = ( 1 d % ) P MPPT
As illustrated in Figure 3, WTGs can reach the assigned deloading points by adjusting the power point tracking curve. The brown dashed curve is the prevalent over-speed curve (deloading without the PAC). When the wind speed is 9.5 m/s (a low wind speed case), there is adequate margin between the MPPT point, B, and the reference rotor speed for speed protection, ω r   ref . Thus, WTGs can switch to the deloading point, B1, through the traditional OSC method. The active power reference under this control is given by
P del = K del ω r 3
The K del in (9) is the deloading power point tracking (DPPT) coefficient, which is calculated by
K del = 1 2 ρ π R 5 λ del 3 C p ( λ del , 0 )
where λ del is the corresponding deloading tip–speed ratio, which can be obtained from (2–4) or Figure 2. Since the WTG is at low wind speed and only the OSC is used for deloading, the pitch angle, β , in (10) is equal to 0.
When the wind speed is 10.5 m/s (a high wind speed case), the optimal rotor speed, ω r   opt , at the MPPT point, A, is close to ω r   ref . The rotor speed at the OSC-deloading point, A 1 , exceeds the reference rotor speed, which means the deloading requirement is beyond the OSC-deloading potential. In such a situation, the PAC should be applied to help accomplish the required deloading ratio.
To minimize the action of the pitch angle and maximize the stored kinetic energy, the deloading power point, A1, is located at the maximum speed line. Then, we can find a deloading pitch angle β 0 ( β 0 = 1.9 when d % = 10 % ), with which the mechanical power curve at 10.5 m/s wind speed intersects the ω r   ref line at A1. The blue dashed line is the DPPT line when v = 10.5   m / s and d % = 10 % . As the deloading rotor speed is at the reference value, the DPPT coefficient should be further adjusted to
K del = P del ω r   ref 3 = ( 1 d % ) K opt ω r   opt 3 ω r   ref 3
As ω r   opt varies with wind speed, K del can be considered as a function of v and d % . The deloading pitch angle can be obtained through a lookup table method. Table 1 shows part of the β 0 table.
The boundary between high wind speed and low wind speed is given by
v b = ω r   ref R λ del
The definition of v b is the maximum wind speed where WTGs can fulfill the deloading requirement only through the OSC. Because of the correlation between λ del and d % depicted in Figure 2, v b also varies with d % . The DPPT coefficient is rewritten as
K del = { 1 2 ρ π R 5 λ del 3 C p ( λ del , 0 )   , v 0 v v b 1 2 ρ π R 5 λ opt 3 C p ( λ opt , 0 ) ( 1 d % ) ω r   opt 3 ω r   ref 3   , v b v v 1
where v 0 and v 1 are the cut-in wind speed and the minimum wind speed in the constant speed interval (Zone3), respectively.
The procedure for each control cycle of the CDS scheme is described in detail in Figure 4. When receiving deloading signals from the system operator, the control center broadcasts the deloading order, d % , and wind speed boundary, v b , to all the WTGs. Then, WTGs in low wind speed adjust the DPPT coefficients, K del , according to (13), and they accomplish the deloading task through the OSC. For the WTGs in high wind speed, the PAC and the OSC are both applied to deload. The corresponding K del can be calculated from (13), and the deloading pitch angle is obtained through the β 0 table.

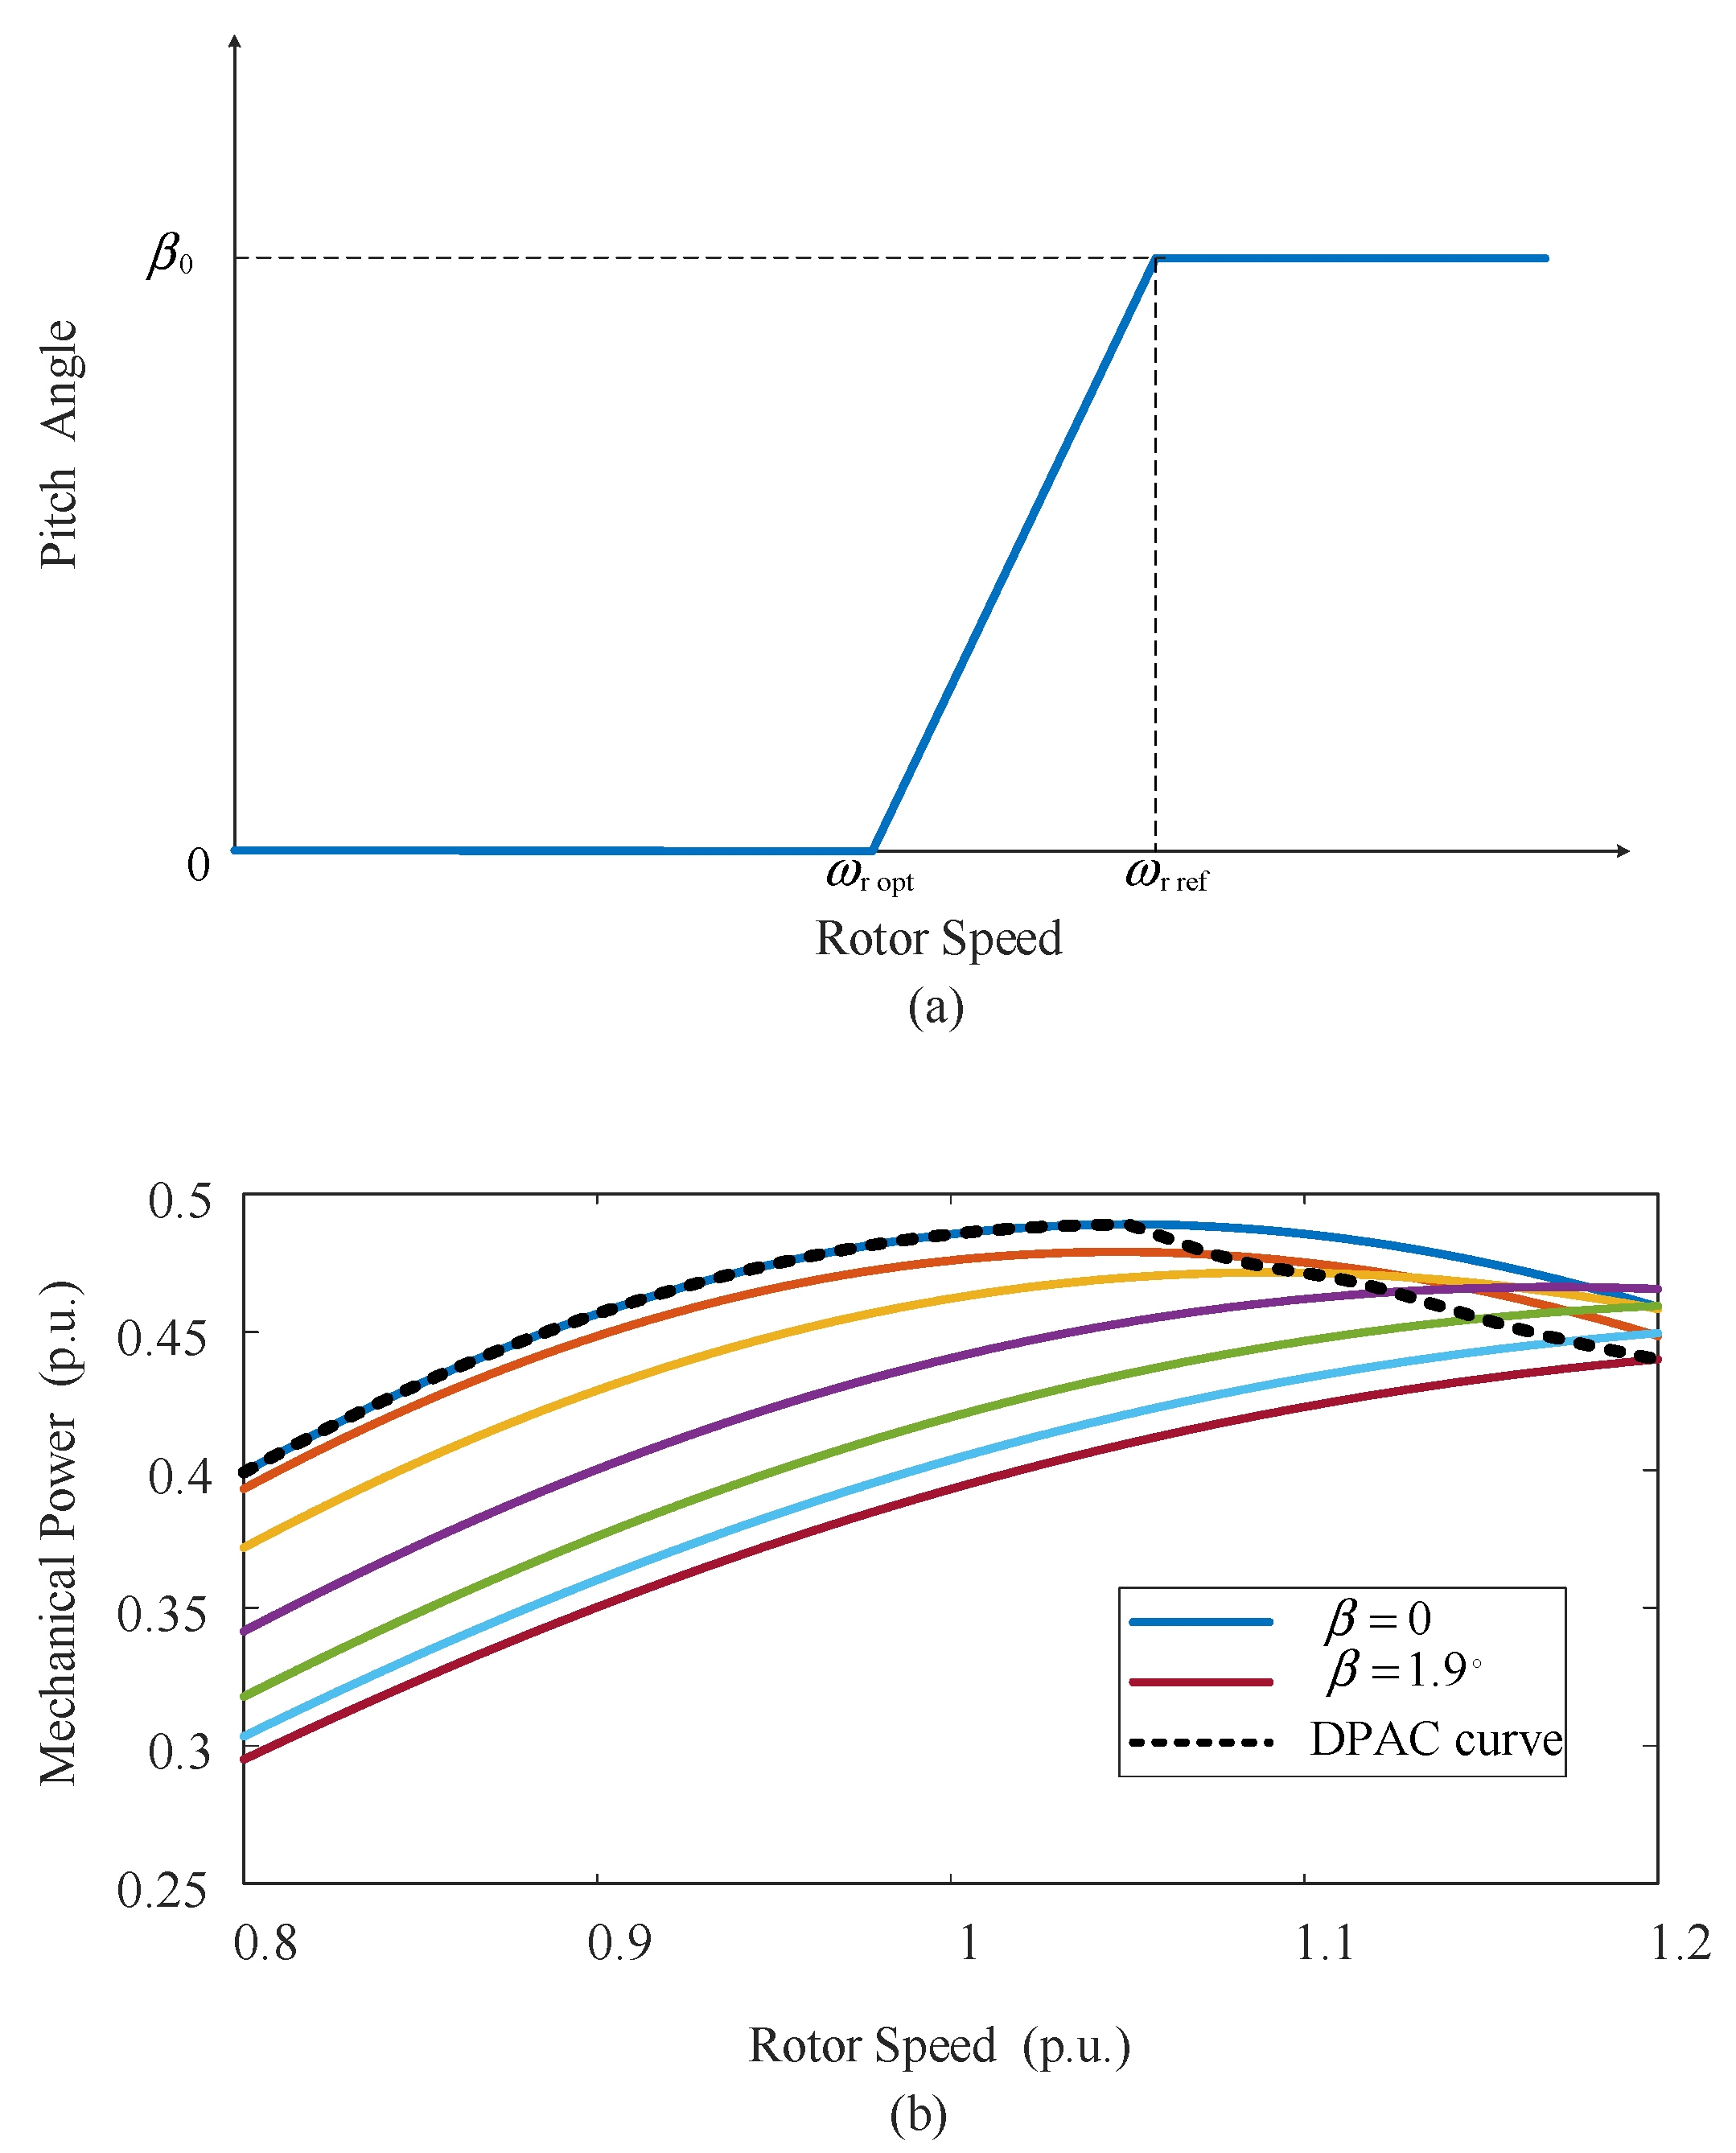
2.3. The Developed Pitch Angle Control

The frequency response of deloading WTGs is realized by extracting the reserve power stored by the OSC and the PAC. Figure 5 presents the active power reference of a WTG, which can be calculated by
P ref * = P ref + Δ P ref = K del ω r 3 K p Δ f K d d f d t
For the WTGs with the OSC, an increase in active power reference, Δ P ref , produces an imbalance between electrical and mechanical power, causing a reduction in the rotor speed, ω r , according to (5). The mechanical power thus increases with ω r approaching the optimal speed, ω r   opt . In this process, the reserve power stored by the OSC can be naturally extracted. However, the reserve power provided by the PAC cannot be released spontaneously because of the lack of frequency response from the pitch angle.
To overcome this problem, a developed pitch angle control (DPAC) scheme, as shown in Figure 6, is introduced in this paper. β f in Figure 6 is the frequency response component of the pitch angle. To release the power reserve provided by the PAC, the pitch angle decreases with the rotor speed in this scheme. As is shown in Figure 7a, β is proportional to ω r within the interval [ ω r   opt , ω r   ref ] . Thus, the expression of β f is
β f = { β 0   , ω r ω r   opt K β ω r + B β   , ω r   opt < ω r ω r   ref 0   , ω r > ω r   ref
The coefficients K β and B β are given by
K β = β 0 ω r   ref ω r   opt
B β = β 0 ω r   opt ω r   ref ω r   opt
As the value of β 0 + β f decreases to 0 at the optimal rotor speed, ω r   opt , the synchronization between the extractions of the power reserve stored by the OSC and the PAC can be realized. The above conclusion can also be verified in Figure 7b. With the DPAC scheme, the mechanical power curve reaches the maximum value through an optimal route. Additionally, the proposed PAC scheme retains the speed protection function. When the reference rotor speed is exceeded, the pitch angle will increase to keep the rotor speed within a safe range. β ω r in Figure 6 is the speed protection component of the pitch angle.

3. Evaluation of Frequency Regulation Capability

As calculated in (14), the active power reference is adjusted according to the frequency deviation, Δ f , and the rate of change of frequency (ROCOF), d f / d t . To avoid operating on the left of the MPPT curve, which causes instability of small disturbances, Δ P ref in (12) cannot transcend a certain limit. Inspired by reference [17,33], the limit is obtained by
Δ P max = P MPPT K del ω r   opt 3 = K opt ω r   opt 3 K del ω r   opt 3
We can readily acquire the limits at wind speeds of 10.5 m/s and 9.5 m/s from Figure 3, which are Segment AA2 and Segment BB2, respectively. Naturally, the power increase limit of the WF is the sum of those of the WTGs, which is
Δ P max WF = i = 1 n Δ P max WTG   i
where Δ P max WTG   i is the limit of the i - th WTG, and n is the number of WTGs in the WF.
In the frequency regulation process, the active power increases with the drop in the system frequency. The FRC in this paper is defined as the difference between the power increase and the limit. The FRC of the i - th deloading WTG can be calculated by
P cap WTG   i = Δ P max WTG   i Δ P ref WTG   i
The total FRC of the WF can be estimated by
P cap WF = i = 1 n P cap WTG   i
The limits Δ P max WTG   i and Δ P max WF are the FRCs prior to disturbances, which are also defined as the maximum FRCs. For the long-term service of WTGs, frequent actions on pitch angle should be inhibited during frequency regulation. Therefore, WTGs in the WF are divided into two groups according to whether the PAC is applied in the deloading process. The two groups, G 1 and G 2 , are defined by
G 1 = { i | v 0 v i v b }
G 2 = { i | v b v i v 1 }
The WTGs of G 1 are at low wind speed, and the deloading tasks of them are accomplished only with the OSC. Inversely, the WTGs of G 2 are at high wind speed and are deloaded with the OSC and the PAC.
The power increase limit of these two groups can be calculated by
Δ P max G 1 = i G 1 Δ P max WTG   i  
Δ P max G 2 = i G 2 Δ P max WTG   i  
Similarly, the FRCs of these two groups are calculated by
P cap G 1 = i G 1 P cap WTG   i
P cap G 2 = i G 2 P cap WTG   i

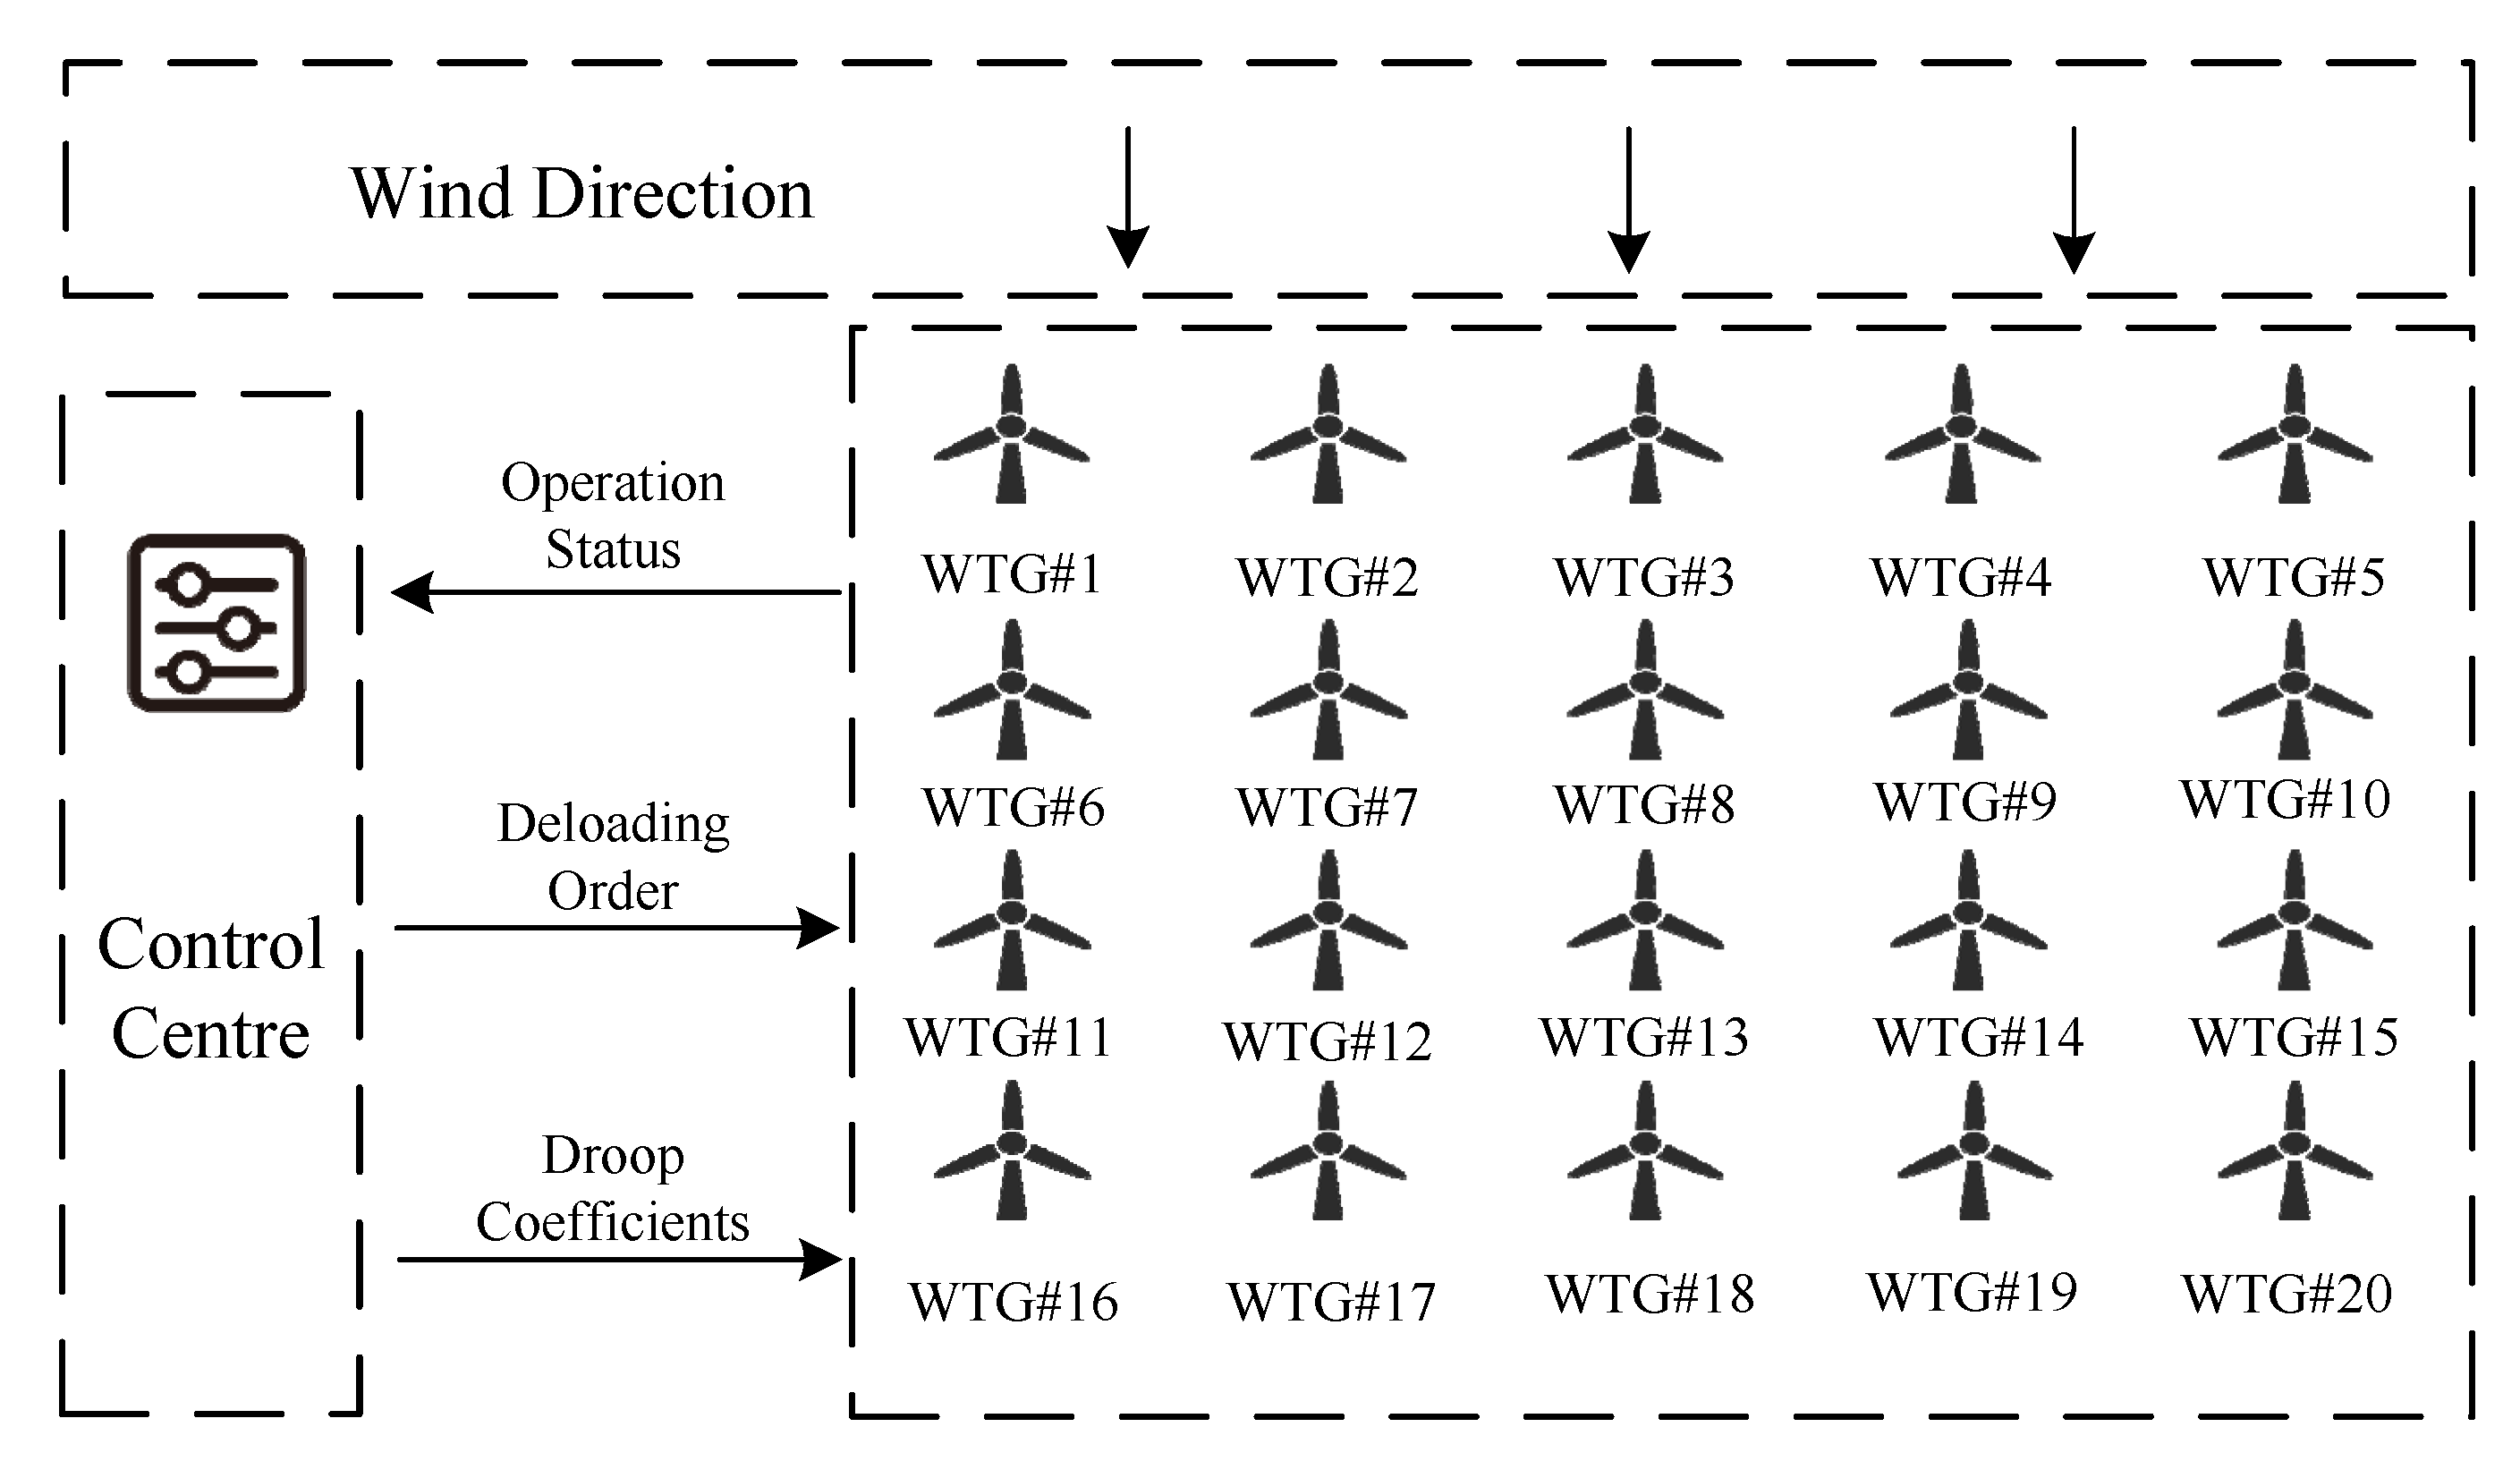
4. The Group-Based Droop Control

As a commonly applied method of frequency regulation, droop control is favorable for both transient and steady-state characteristics of the system frequency [10,35]. Based on the evaluation of FRC in Section 3, a novel droop scheme for WFs in CDS-deloading operation is presented in this section. Considering the sensitivity to measurement errors [10,34], the virtual inertia loop gains are universally set to 0.

4.1. Total Droop Coefficient of the WF

In the frequency regulation process, the control center determines the total droop coefficient of the WF. The total droop coefficient is defined as the sum of all droop gains of WTGs:
K p WF = K p G 1 + K p G 2 = i G 1 K p WTG   i + i G 2 K p WTG   i = i = 1 n K p WTG   i
where K p G 1 and K p G 2 are the total coefficients of G 1 and G 2 , respectively.
To improve the frequency response of the WF, K p WF should be determined depending on the FRC of the WF. When the FRC is large, a large droop gain can be set to make full use of the resources; when the FRC is small, the droop gain should be sufficiently small in case the headroom of the power increase is exceeded. The droop gain of WFs is determined as follows:
K p WF = Δ P max WF | Δ f | max
where | Δ f | max is the threshold of low-frequency load shedding. As such, K p WF is proportional to the maximum FRC, and the frequency response power can be calculated by
Δ P ref = Δ P max WF | Δ f | max Δ f
when the frequency deviation touches the threshold, | Δ f | max , Δ P ref is equal to the maximum FRC of the WF.

4.2. Total Droop Coefficients of the Groups

As mentioned in Section 3, WTGs in G 2 deload with the OSC and the PAC methods. The frequency response of these WTGs is probably likely to cause the action of pitch angles. Thus, the total droop coefficients (TDCs) of G 1 and G 2 should be determined reasonably in different disturbances so that the pressure of the mechanical devices of WTGs in G 2 can be alleviated. When the system frequency fluctuates gently, the response of WTGs in G 2 should be minimized, and the frequency regulation task is mainly completed by G 1 . However, when the fluctuation is intense, the response of WTGs in G 1 alone can no longer meet the demand of frequency regulation in the WF. In this case, the resources in G 2 should be effectively extracted to support frequency stability.
Therefore, a pair of exponential membership functions are introduced to allocate the frequency regulation tasks of G 1 and G 2 . The variable of the functions is the ratio of the FRC of G 1 and the power increase limit of the WF, calculated by
x = P cap G 1 Δ P max WF
The participation degrees of these two groups are then obtained by
K p G 1 K p WF = Δ P max G 1 Δ P max WF ( 1 1 1 + e a ( x 0.1 ) ) ( 1 1 + e a ( x + 0.1 ) )
K p G 2 K p WF = 1 K p G 1 K p WF
The constant, a , is the conversion factor. A larger a means a higher participation degree of the frequency response from G 1 and more protection for WTGs in G 2 . However, a too-large value of a may also weaken the frequency regulation effect, as it limits the participation of G 2 to a large extent. Considering the effect from both aspects, a is set to 800 in this paper.
The dynamic properties of the participating extent of the two groups K p G 1 / K p WF and K p G 2 / K p WF are depicted in Figure 8. When P cap G 1 / Δ P max WF is greater than 0.1, it means that there are still sufficient frequency regulation resources in G 1 . Thus, K p G 1 / K p WF at this time equals 1. WTGs in G 1 take over the whole droop control task of the WF, while WTGs in G 2 only add a small amount of active power through the virtual inertia control. Inversely, when P cap G 1 / Δ P max WF is less than 0.1, the resources of G 1 are close to running out. Thus, K p G 1 / K p WF decreases gradually with P cap G 1 / Δ P max WF . The task undertaken by G 1 gradually decreases while that of G 2 increases. To prevent an excessive response to the frequency deviation, which endangers the stable operation of the WTGs of G 1 , the slope of the curves around 0.1 is sufficiently large. As the P cap G 1 / Δ P max WF ratio decreases further, which means the resources of both G 1 and G 2 are running out, K p G 1 / K p WF and K p G 2 / K p WF converge to Δ P max G 1 / Δ P max WF and Δ P max G 2 / Δ P max WF , respectively. At this time, the frequency regulation tasks of G 1 and G 2 are assigned according to their own resources.

4.3. Droop Coefficients of WTGs

Due to the wake effect, the arriving wind speed of a WF possesses a declining trend while traversing each row of WTGs. The universal parameter setting of the conventional droop control is not suitable for WTGs with different FRCs. Moreover, FRCs also vary because of wind fluctuation and power variation in the frequency response process. In this situation, the droop coefficients of WTGs in each group are proportional to their real-time FRCs, i.e.,
K p WTG   i P cap WTG   i
Considering the constraint of (19), K p WTG   i for WTGs in the two groups can be calculated by
K p WTG   i = { K p G 1 P cap WTG   i P cap G 1   , i G 1 K p G 2 P cap WTG   i P cap G 2   , i G 2
WTGs with greater capabilities provide more output in frequency regulation while those with less capability give a small output increase to guarantee stable operation. Therefore, the resources of frequency regulation can be efficiently utilized with the proposed coefficients.

5. Case Studies

The simulations in this paper are implemented using MATLAB/Simulink. A developed low-order power system model [32] (Figure 9) is adopted to verify the proposed GBDC scheme of a deloading WF. The voltage control involving the dynamics of the system’s reactive power is not considered. The system contains a 20 MW small hydropower station, a 120 MW thermal power plant with combined-cycle gas turbines, and a wind farm. All of the conventional power plants are equipped with droop control to participate in frequency regulation, and the gains of the droop loops, K p , are set to 20. H e in Figure 9 is the equivalent inertia time constant of the system, which can be calculated by [35,36]
H e = r W H W + r T H T
H W and H T are the inertia time constants of the hydropower station and the thermal power plant, and the values of them are 3.6 s and 6.5 s, respectively. r W and r T are the hydro and thermal penetrations, which are 10% and 50%, respectively. The load damping, D , is 0.5 in each unit.
The wind farm is composed of twenty 3 MW DFIGs, arranged in four rows (as shown in Figure 10). The wind power penetration of the system is 30%. The GBDC scheme is compared with three different droop control schemes, namely, (1) traditional fixed droop control (FDC), (2) adaptive droop control (ADC), and (3) no droop control (NDC), for wind farms. In the FDC scheme, every WTG responds to the frequency with a fixed droop coefficient. The droop coefficients of the FDC scheme are obtained by the trial and error method to ensure that all WTGs operate stably in the frequency response process. The ADC scheme has no function of pitch angle protection; thus, the droop coefficients of all WTGs are proportional to their maximum FRCs, which are calculated by
K p WTG   i = Δ P max WTG   i   | Δ f | max
The WTGs in all these schemes operate with a 10% deloading ratio through the CDS strategy. The gains of the virtual inertial control are all set to 0. Additionally, all the generators in this system respond to the frequency deviation through a ± 0.01   H z dead band.

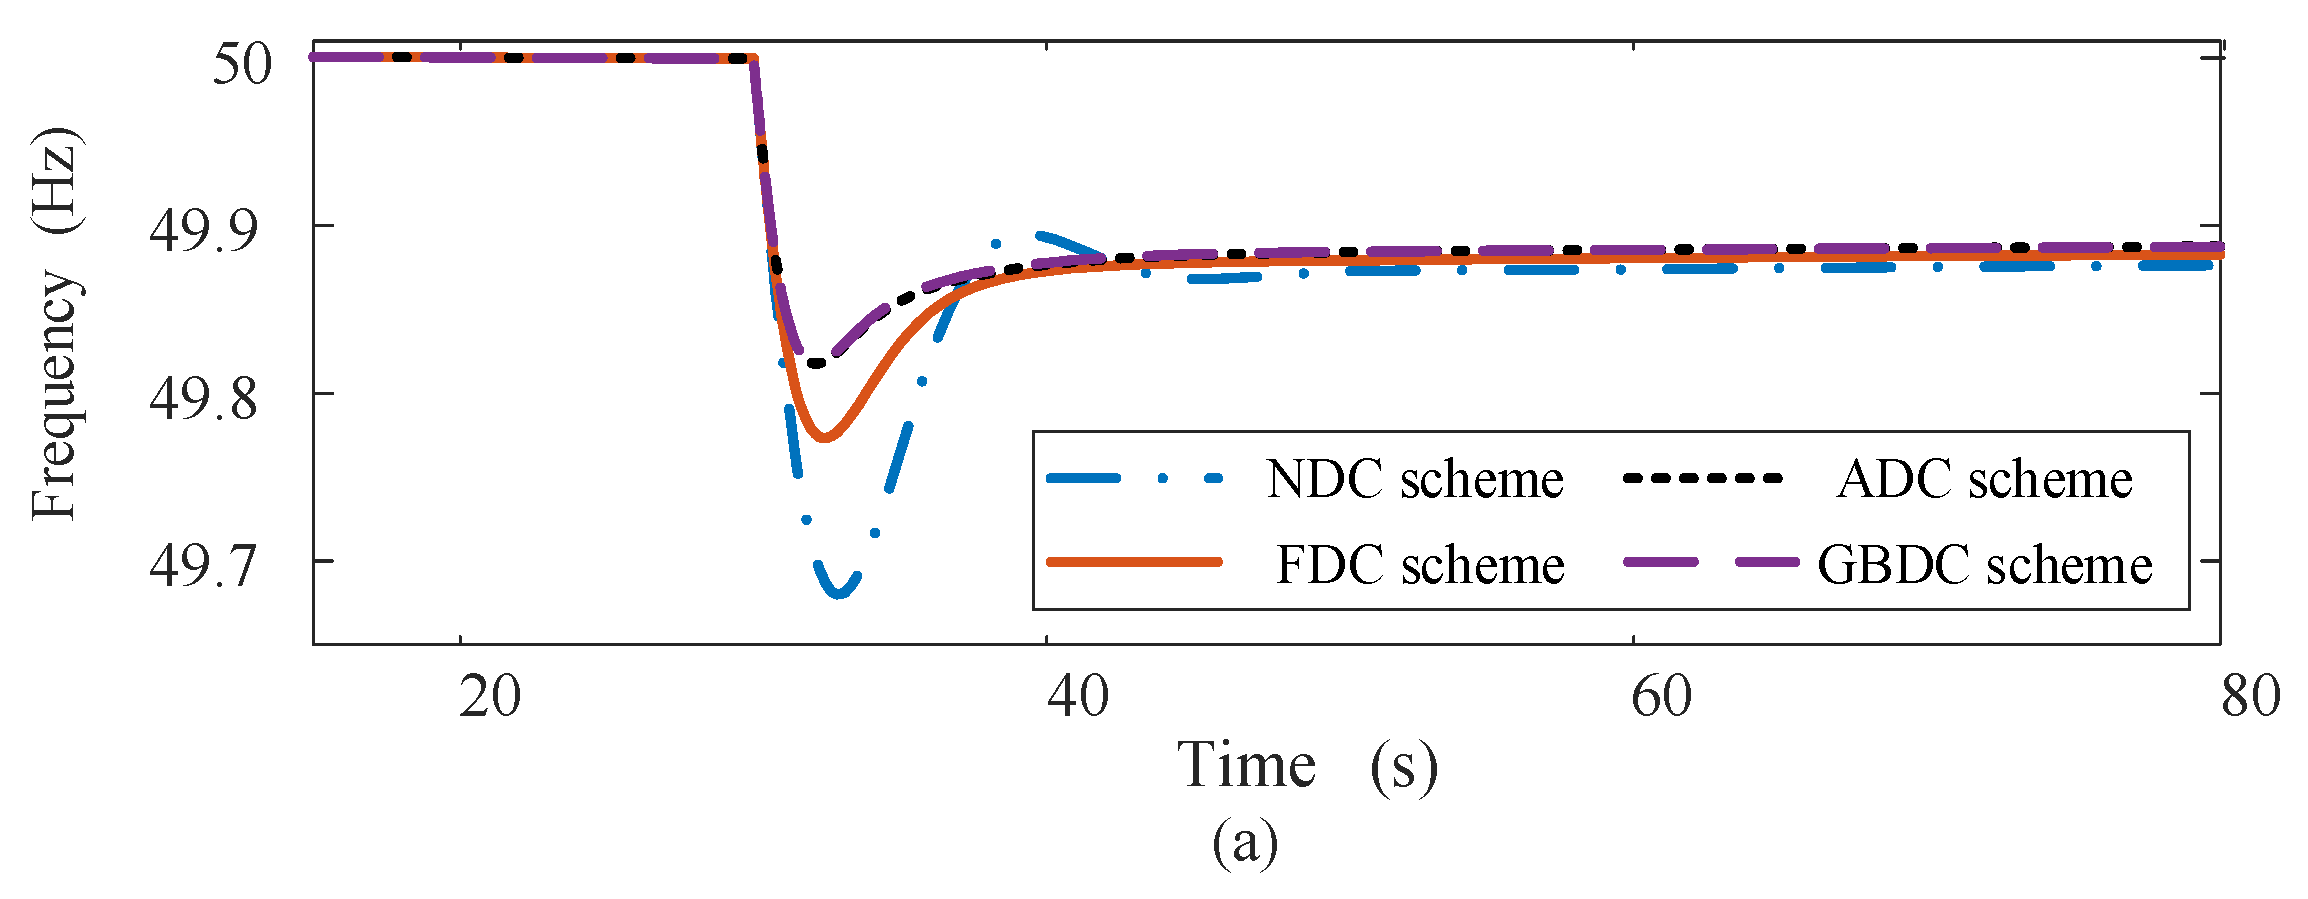
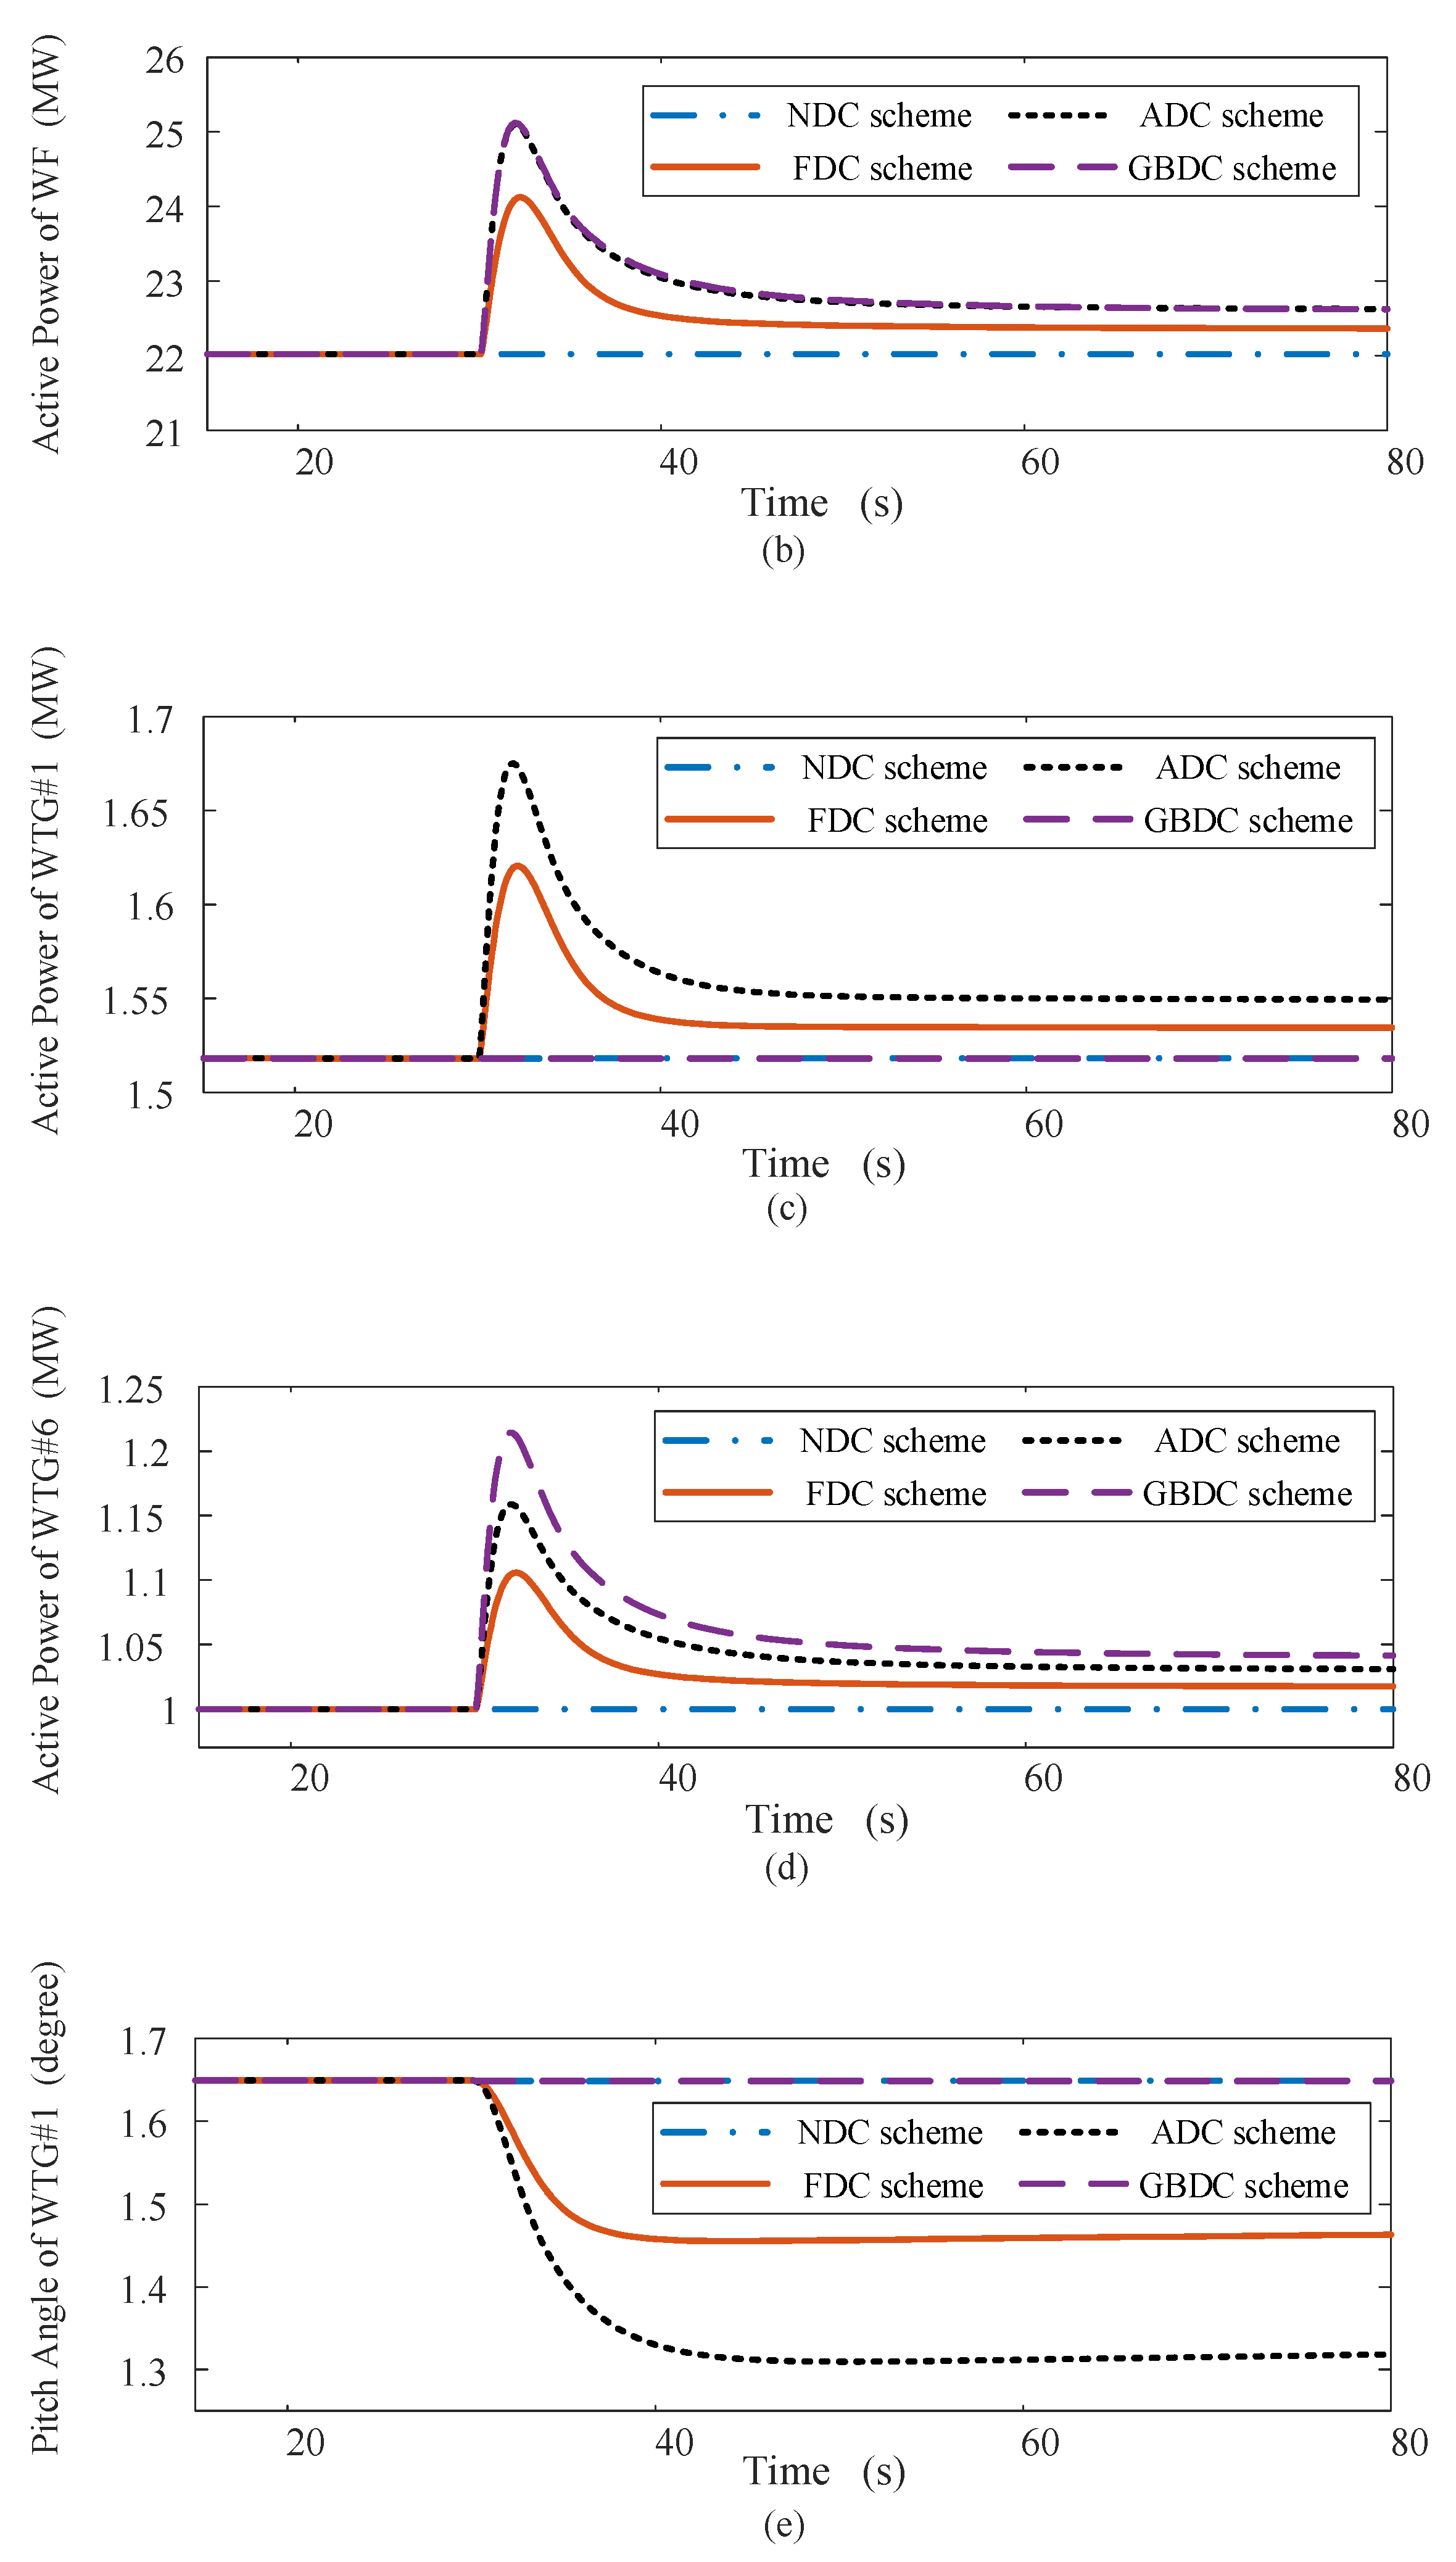
5.1. Case 1: Small Load Disturbance

The free wind speed in this case is 11.00 m/s and remains unchanged. The wind direction is shown in Figure 10. Due to the wake effect, the actual wind speed received by each row of WTGs gradually decreases. In this paper, the arriving wind speed of each row is calculated by the Jansen wake model [24]. The wind speeds from front to back are set as 11.00 m/s, 9.57 m/s, 9.41 m/s, and 9.36 m/s. The WTGs in the first row are under high wind speed, while the others are under low wind speed. At t = 30   s , the system load suddenly increases from 120 MW to 126 MW.
The results of Case 1 are presented in Figure 11. Since both the GBDC and the ADC schemes determine the total droop coefficient according to the FRC of the wind farm, the total active power increase in the wind farm is greater than in the case of the FDC scheme. With the GBDC scheme, the frequency nadir, f nadir , is 49.83 Hz, which is almost the same as that with the ADC scheme. f nadir with the GBDC and the ADC schemes is higher than that with the FDC and the NDC schemes by 0.06 Hz and 0.15 Hz, respectively, and the steady-state frequency is closer to the standard frequency, 50 Hz. It needs to be pointed out that the frequency curves of the proposed scheme and the ADC scheme are slightly different. The reason for this is that the different droop coefficient distributions in these two schemes cause different rotor speeds of the WTGs; thus, the sum of P ref in (14) is also different.
The dynamics of WTGs are also presented in Figure 11 to prove the advancement of the GBDC scheme. We can observe in Figure 11c,d that, when the disturbance is small, the resources of frequency regulation in G 1 (represented by WTG#6) are adequate; thus, there is no need for WTGs in G 2 (represented by WTG#1) to participate in the droop control of the WF. When the proposed scheme is adopted, the power increase in WTG#1 is negligible, which is the same as that using the NDC scheme and much smaller than those with the FDC and ADC schemes. The power increase in WTG#6 with the proposed droop scheme is larger than those with the other schemes, which suggests that the power deficit is supplemented by the WTGs in G 1 . As the WTGs all deload with the CDS, the pitch angles of WTG#1 are all 1.649 in the initial stage of the simulation. The pitch angle curve of the proposed scheme is the same as that of the NDC scheme and almost remains unchanged. With the FDC scheme, the pitch angle is gradually reduced to 1.460 . Due to the larger power increase, the change in the pitch angle of the ADC scheme is greater, which is reduced to 1.312 .

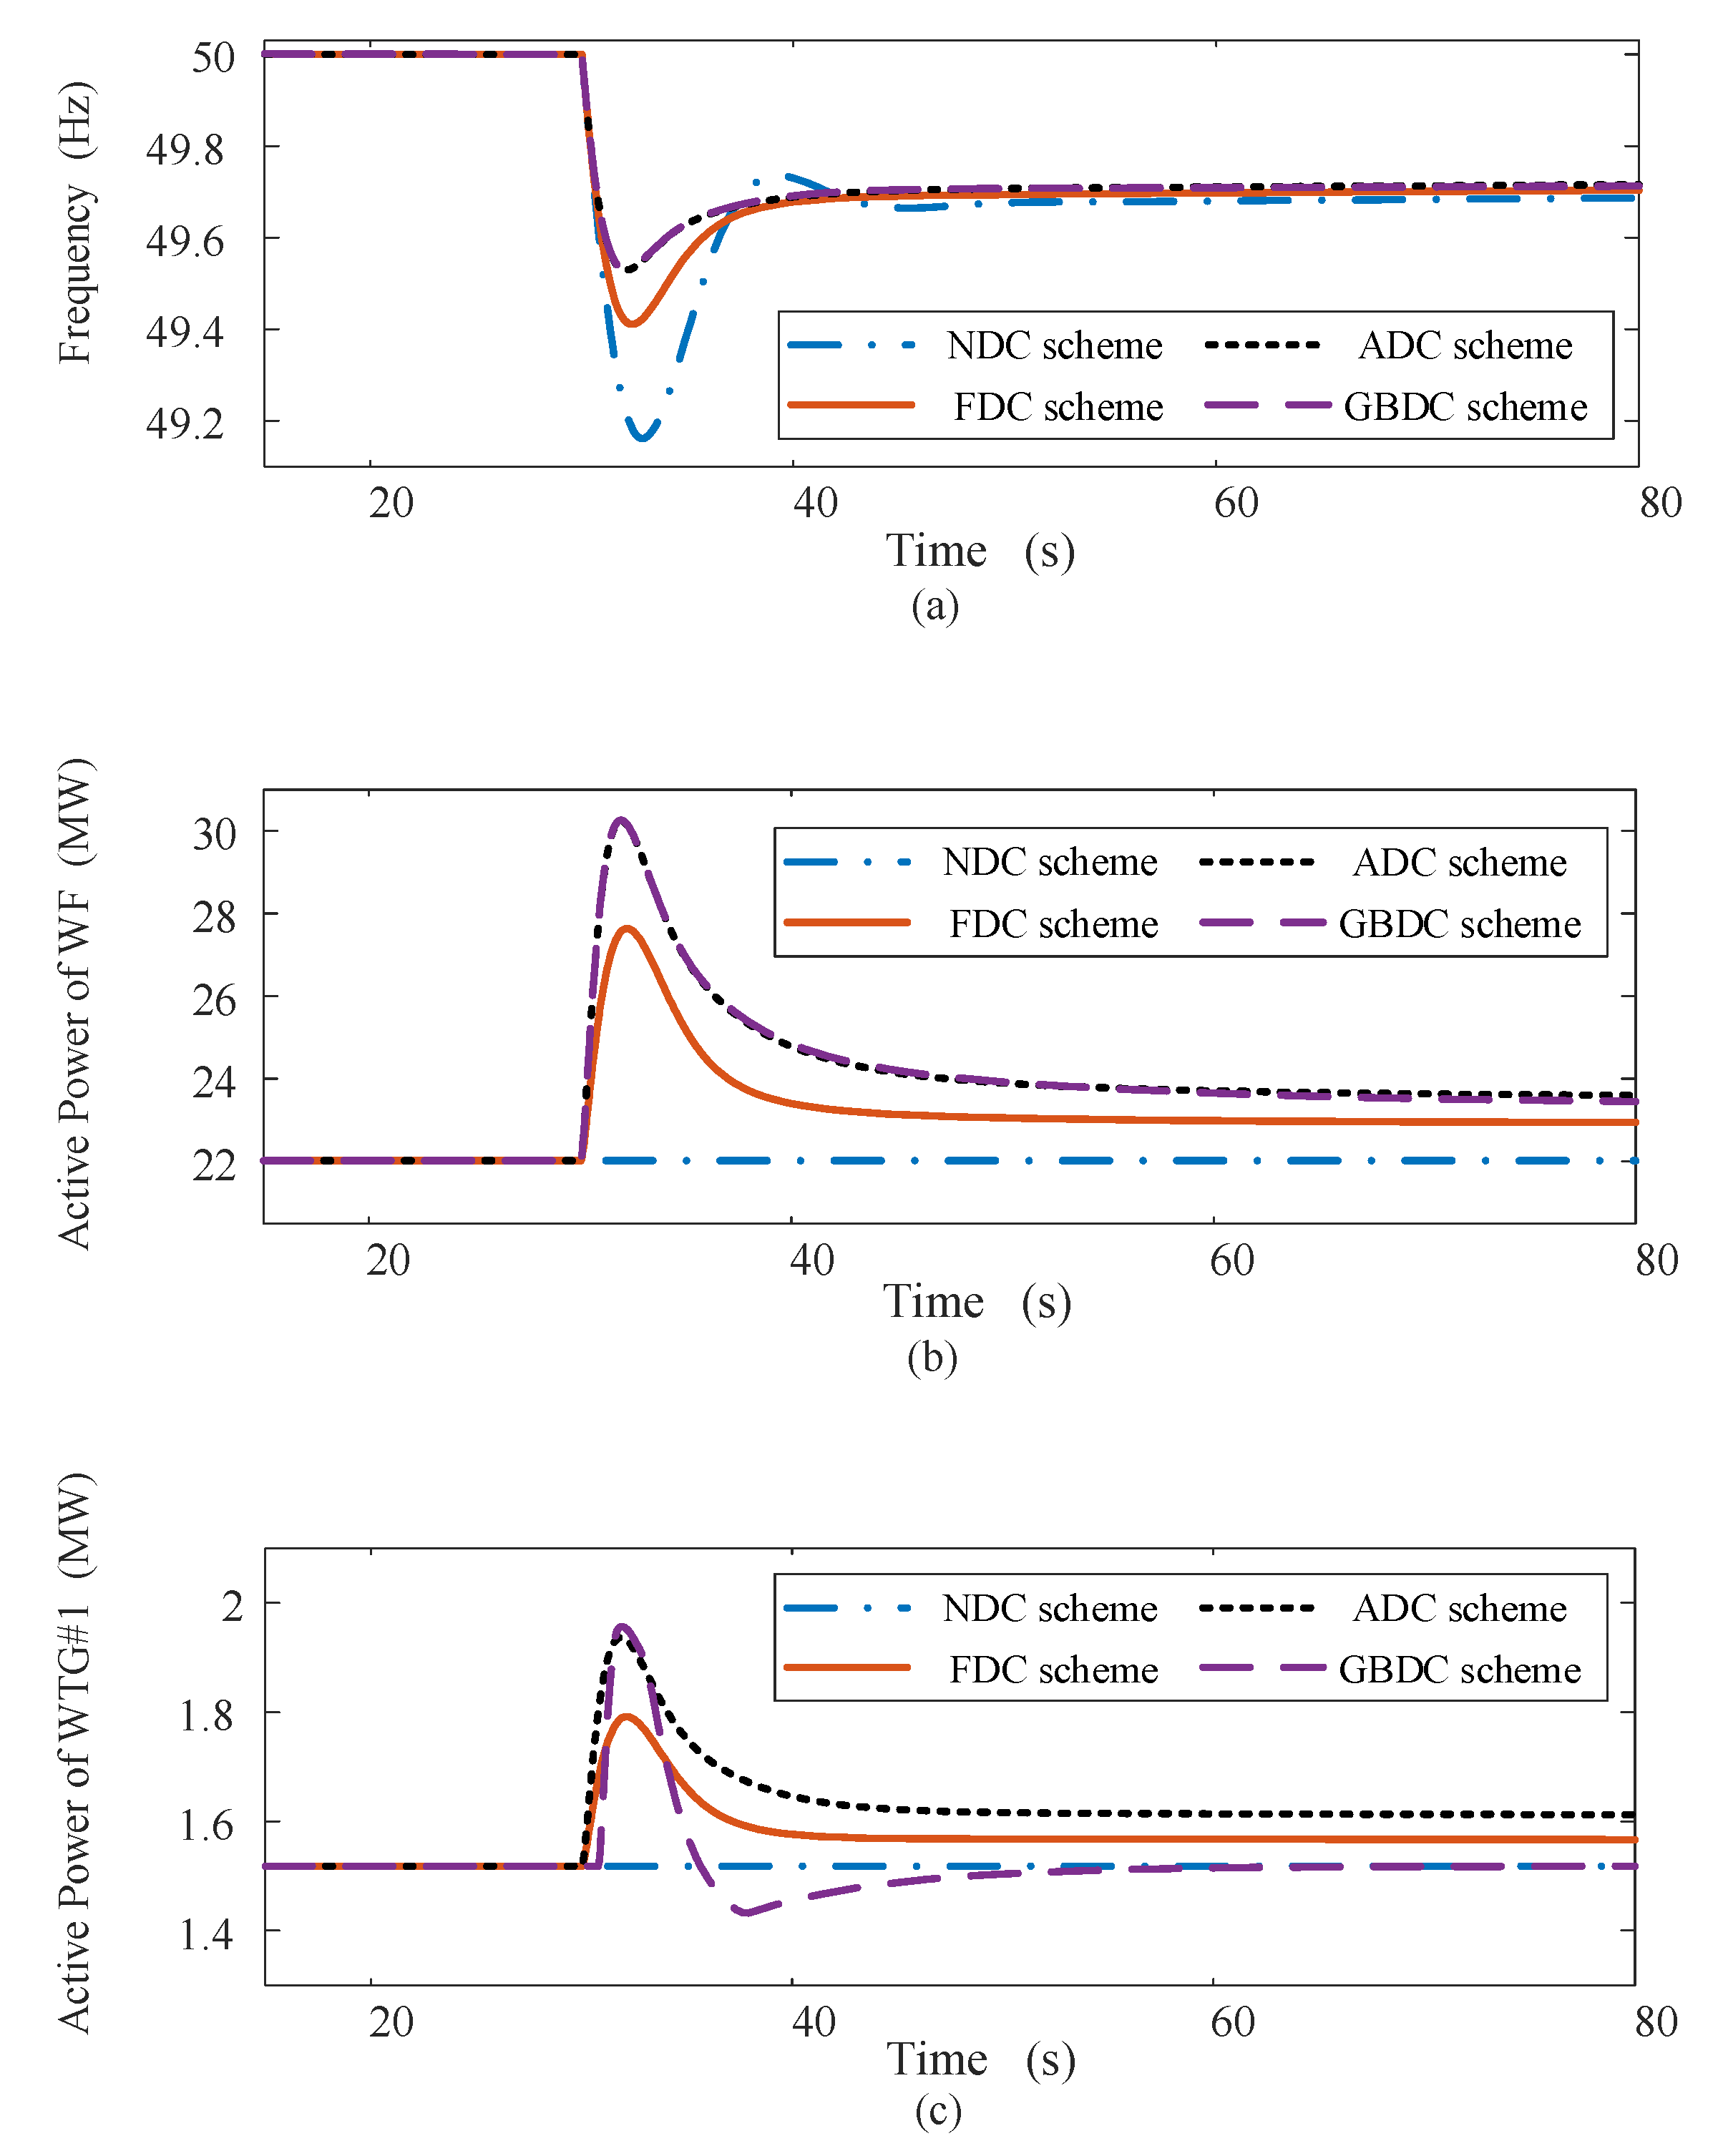
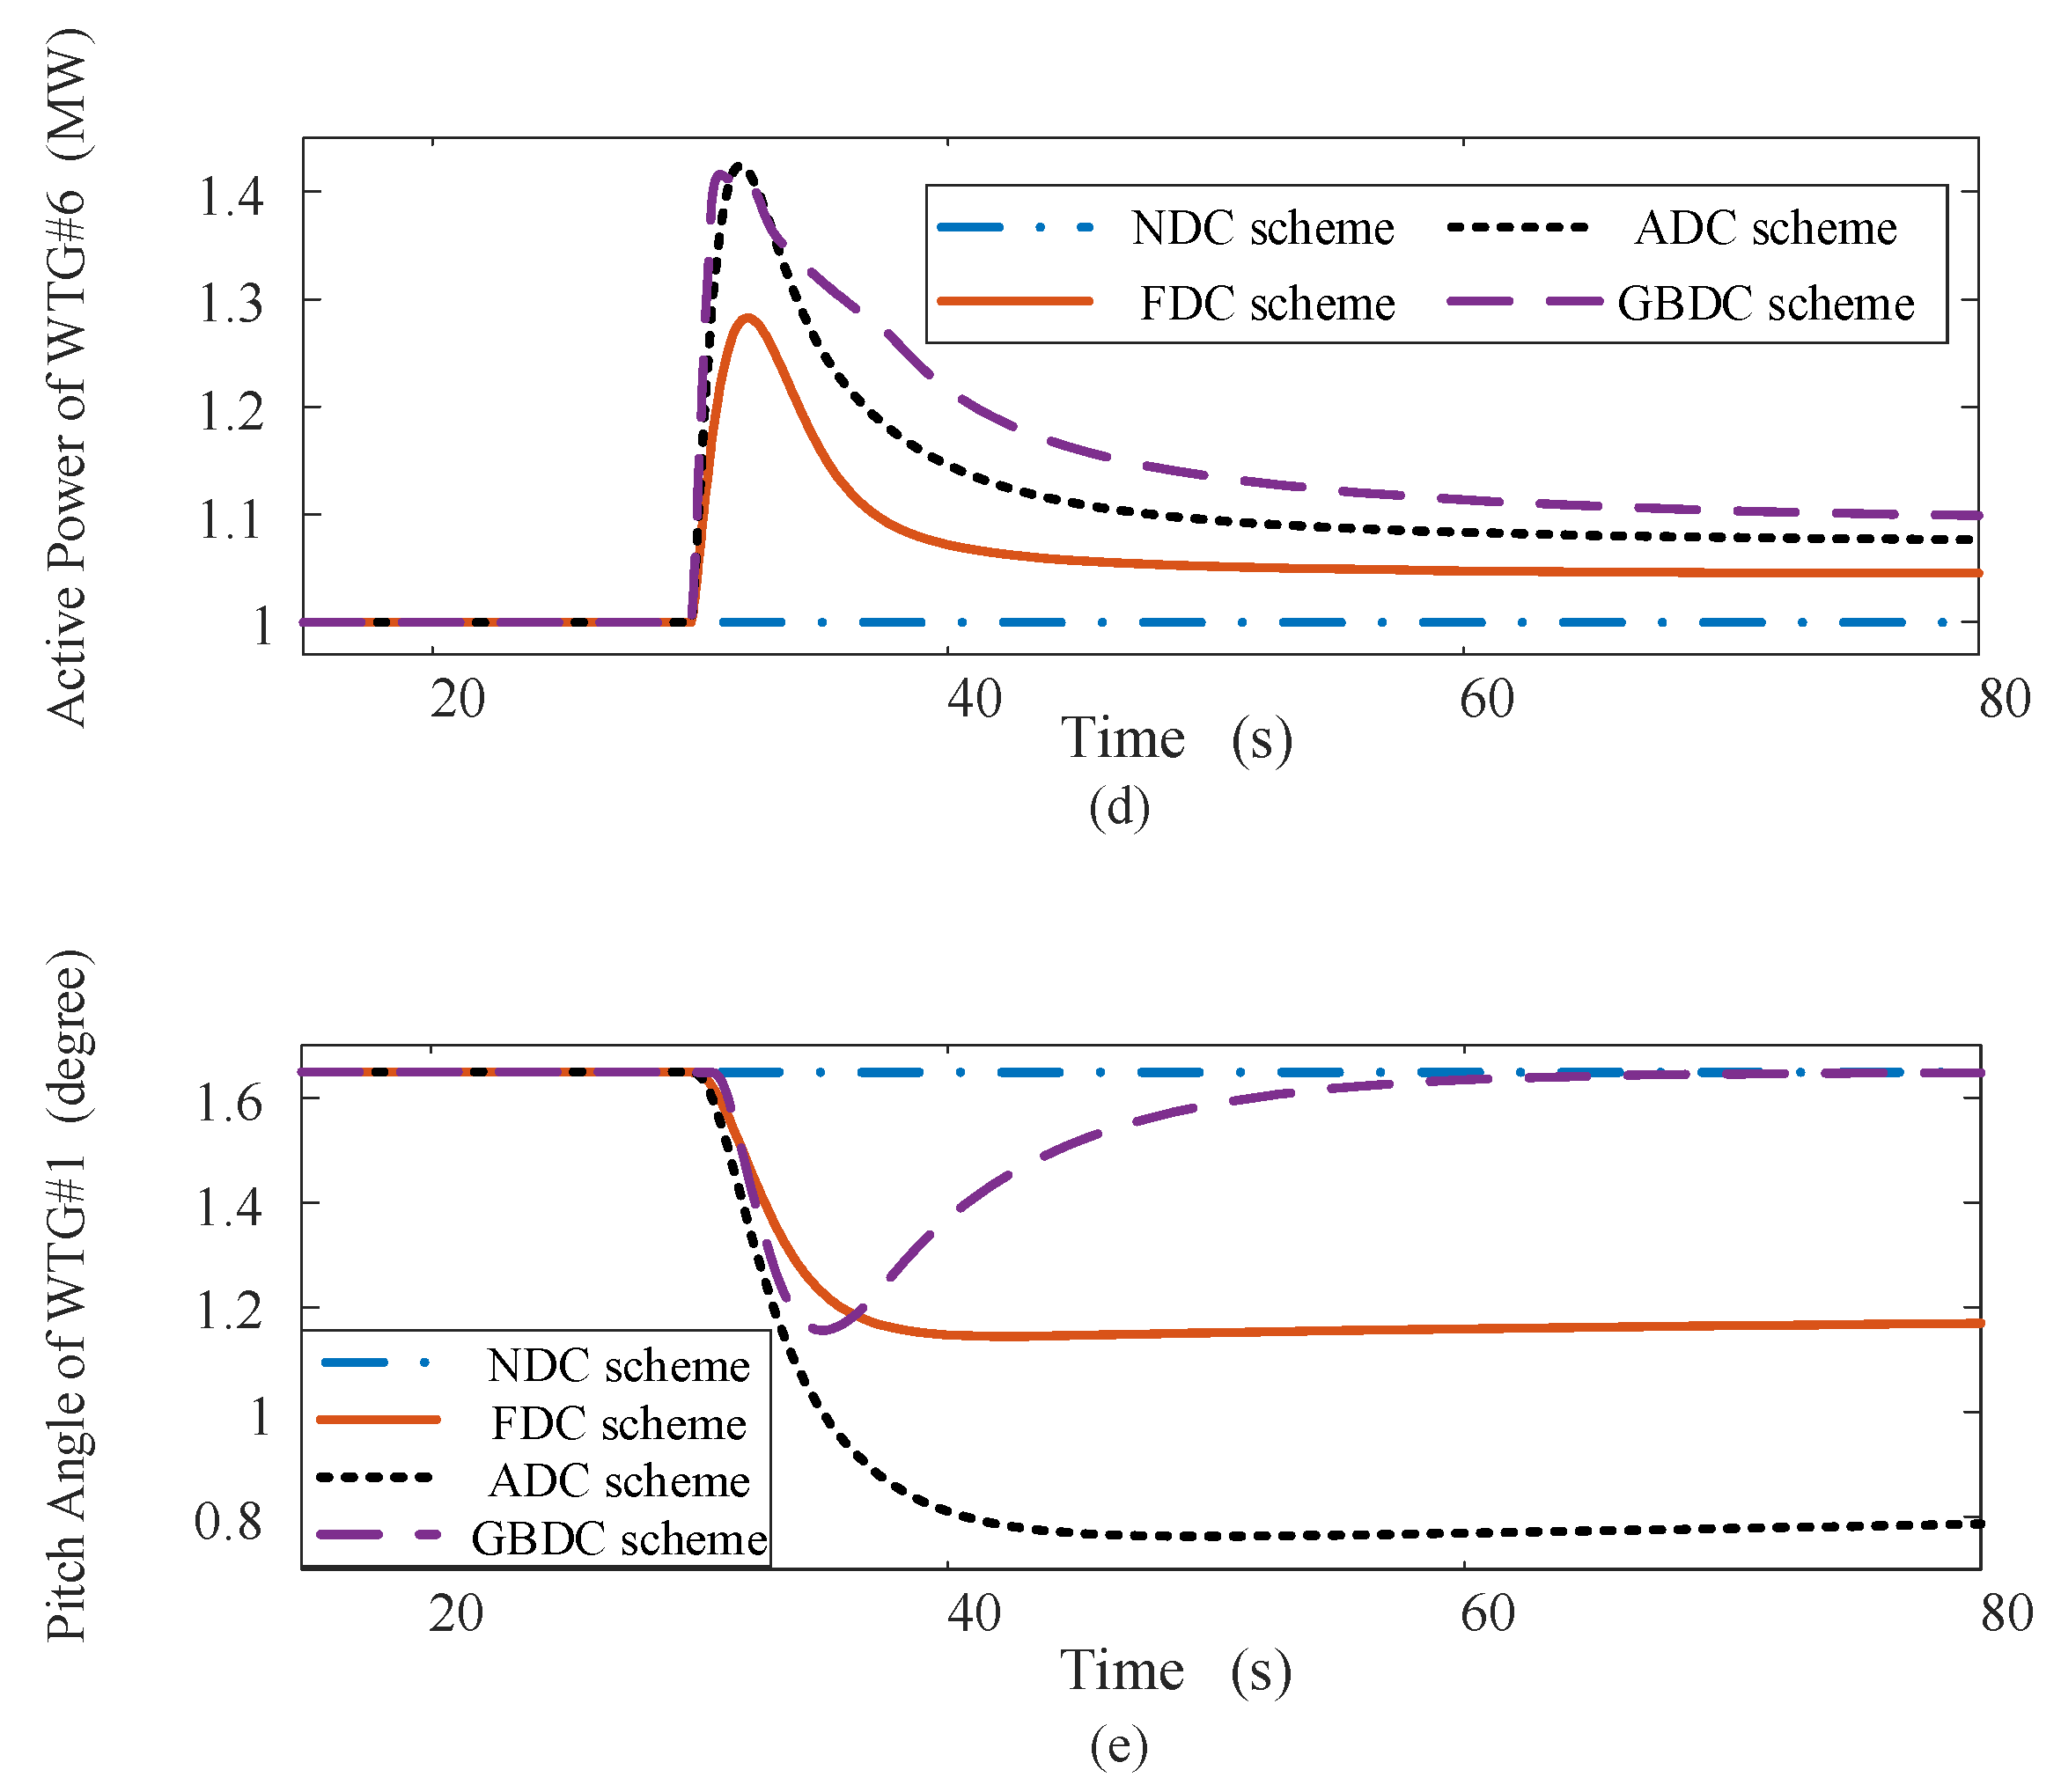
5.2. Case 2: Large Load Disturbance

The wind speed of the wind farm is the same as that in Case 1. At t = 30   s , the load increases from 120 MW to 136 MW.
The results of Case 2 are presented in Figure 12. Because of the FRC-based droop coefficients, the power increases in the WF with the GBDC and the ADC schemes are very close, and they are both higher than those with the other two schemes. f nadir with the GBDC scheme is 49.71 Hz, which is the same as that with the ADC scheme and higher than that with the FDC and NDC schemes by 0.30 Hz and 0.55 Hz, respectively. The steady-state frequency with the GBDC and the ADC schemes is 49.71 Hz, which is higher than those with the FDC and NDC schemes by 0.01 Hz and 0.03 Hz, respectively.
The power and pitch angle curves of WTG#1 and WTG#6 are also presented in Figure 12. In the GBDC scheme, G 1 and G 2 are both appointed to participate in frequency regulation because of the large frequency deviation. The power increases in WTG#1 and WTG#6 are larger than those in the FDC scheme. In the ADC scheme, the peak powers of WTG#1 and WTG#6 are almost the same as those in the GBDC scheme. As the deviation decreases in the frequency regulation process, the GBDC scheme reduces the participating degree of G 2 . This is why the power of WTG#1 decreases faster than that in the ADC scheme. In the ADC scheme, the pitch angle of WTG#1 is reduced from 1.649 to 0.770 to capture more mechanical power. In the FDC scheme, the settled value is 1.160 . In the GBDC scheme, the pitch angle is reduced to 1.158 at t = 34.9   s and finally returns to 1.649 .
Compared with the traditional FDC scheme, the GBDC and the ADC schemes can both improve the frequency response performance. For the same extent of frequency improvement, the GBDC scheme makes the pitch angle move less than the ADC scheme.

5.3. Case 3: Wind Disturbance

In this case, the system load remains unchanged at 120 MW. Initially, the wind speed of the WF is 11.00 m/s, and it drops to 10.30 m/s at t = 30   s . To simplify the simulation, the time delay of the wind speed drops of each row of WTGs is ignored. Therefore, the arriving wind speeds of each row are reduced from 11.50 m/s, 10.09 m/s, 9.93 m/s, and 9.88 m/s to 10.50 m/s, 9.05 m/s, 8.89 m/s, and 8.83 m/s at t = 30   s , respectively.
The results of Case 3 are presented in Figure 13. It can be seen in Figure 13b that, due to the decrease in wind speed, the power of the WF decreases at t = 30   s , producing a disturbance in the system frequency. When detecting the frequency deviation, the WF begins to increase its output to participate in frequency regulation. The power increases in the GBDC and the ADC schemes are larger than that in the FDC scheme because of the larger droop coefficients. Therefore, the frequency curves of these two schemes are higher than those of the FDC and the NDC schemes in the whole simulation. The f nadir of the NDC scheme is 49.82 Hz and appears at 34.33 s. At the same time, the frequencies of the proposed scheme and the ADC scheme are both 49.89 Hz, while the frequency value of the FDC scheme is 49.87 Hz.
As the deloading pitch angle, β 0 , varies with the wind speed, the pitch angle of the WF increases to a new value at t = 30   s . After that, the pitch angle of the FDC and the ADC schemes is reduced so that the power reserve stored by the PAC can be extracted. The active power curves of WTG#1 and WTG#6 are presented in Figure 13c,d, which represent the WTGs of G 2 and G 1 , respectively. With the proposed scheme, the power increase in WTG#1 is the same as that with the NDC scheme, which is negligible. The power increase in the ADC scheme is the largest, as the first row of WTGs possess the largest FRC. As for the power increase in WTG#6, the schemes, in descending order, are the proposed scheme, the ADC scheme, the FDC scheme, and the NDC scheme. With the proposed scheme, the pitch angle of WTG#1 remains at the new deloading value, 1.900 , the same as that with the NDC scheme. The curves of the ADC and the FDC schemes decrease to 1.469 and 1.691 , respectively.

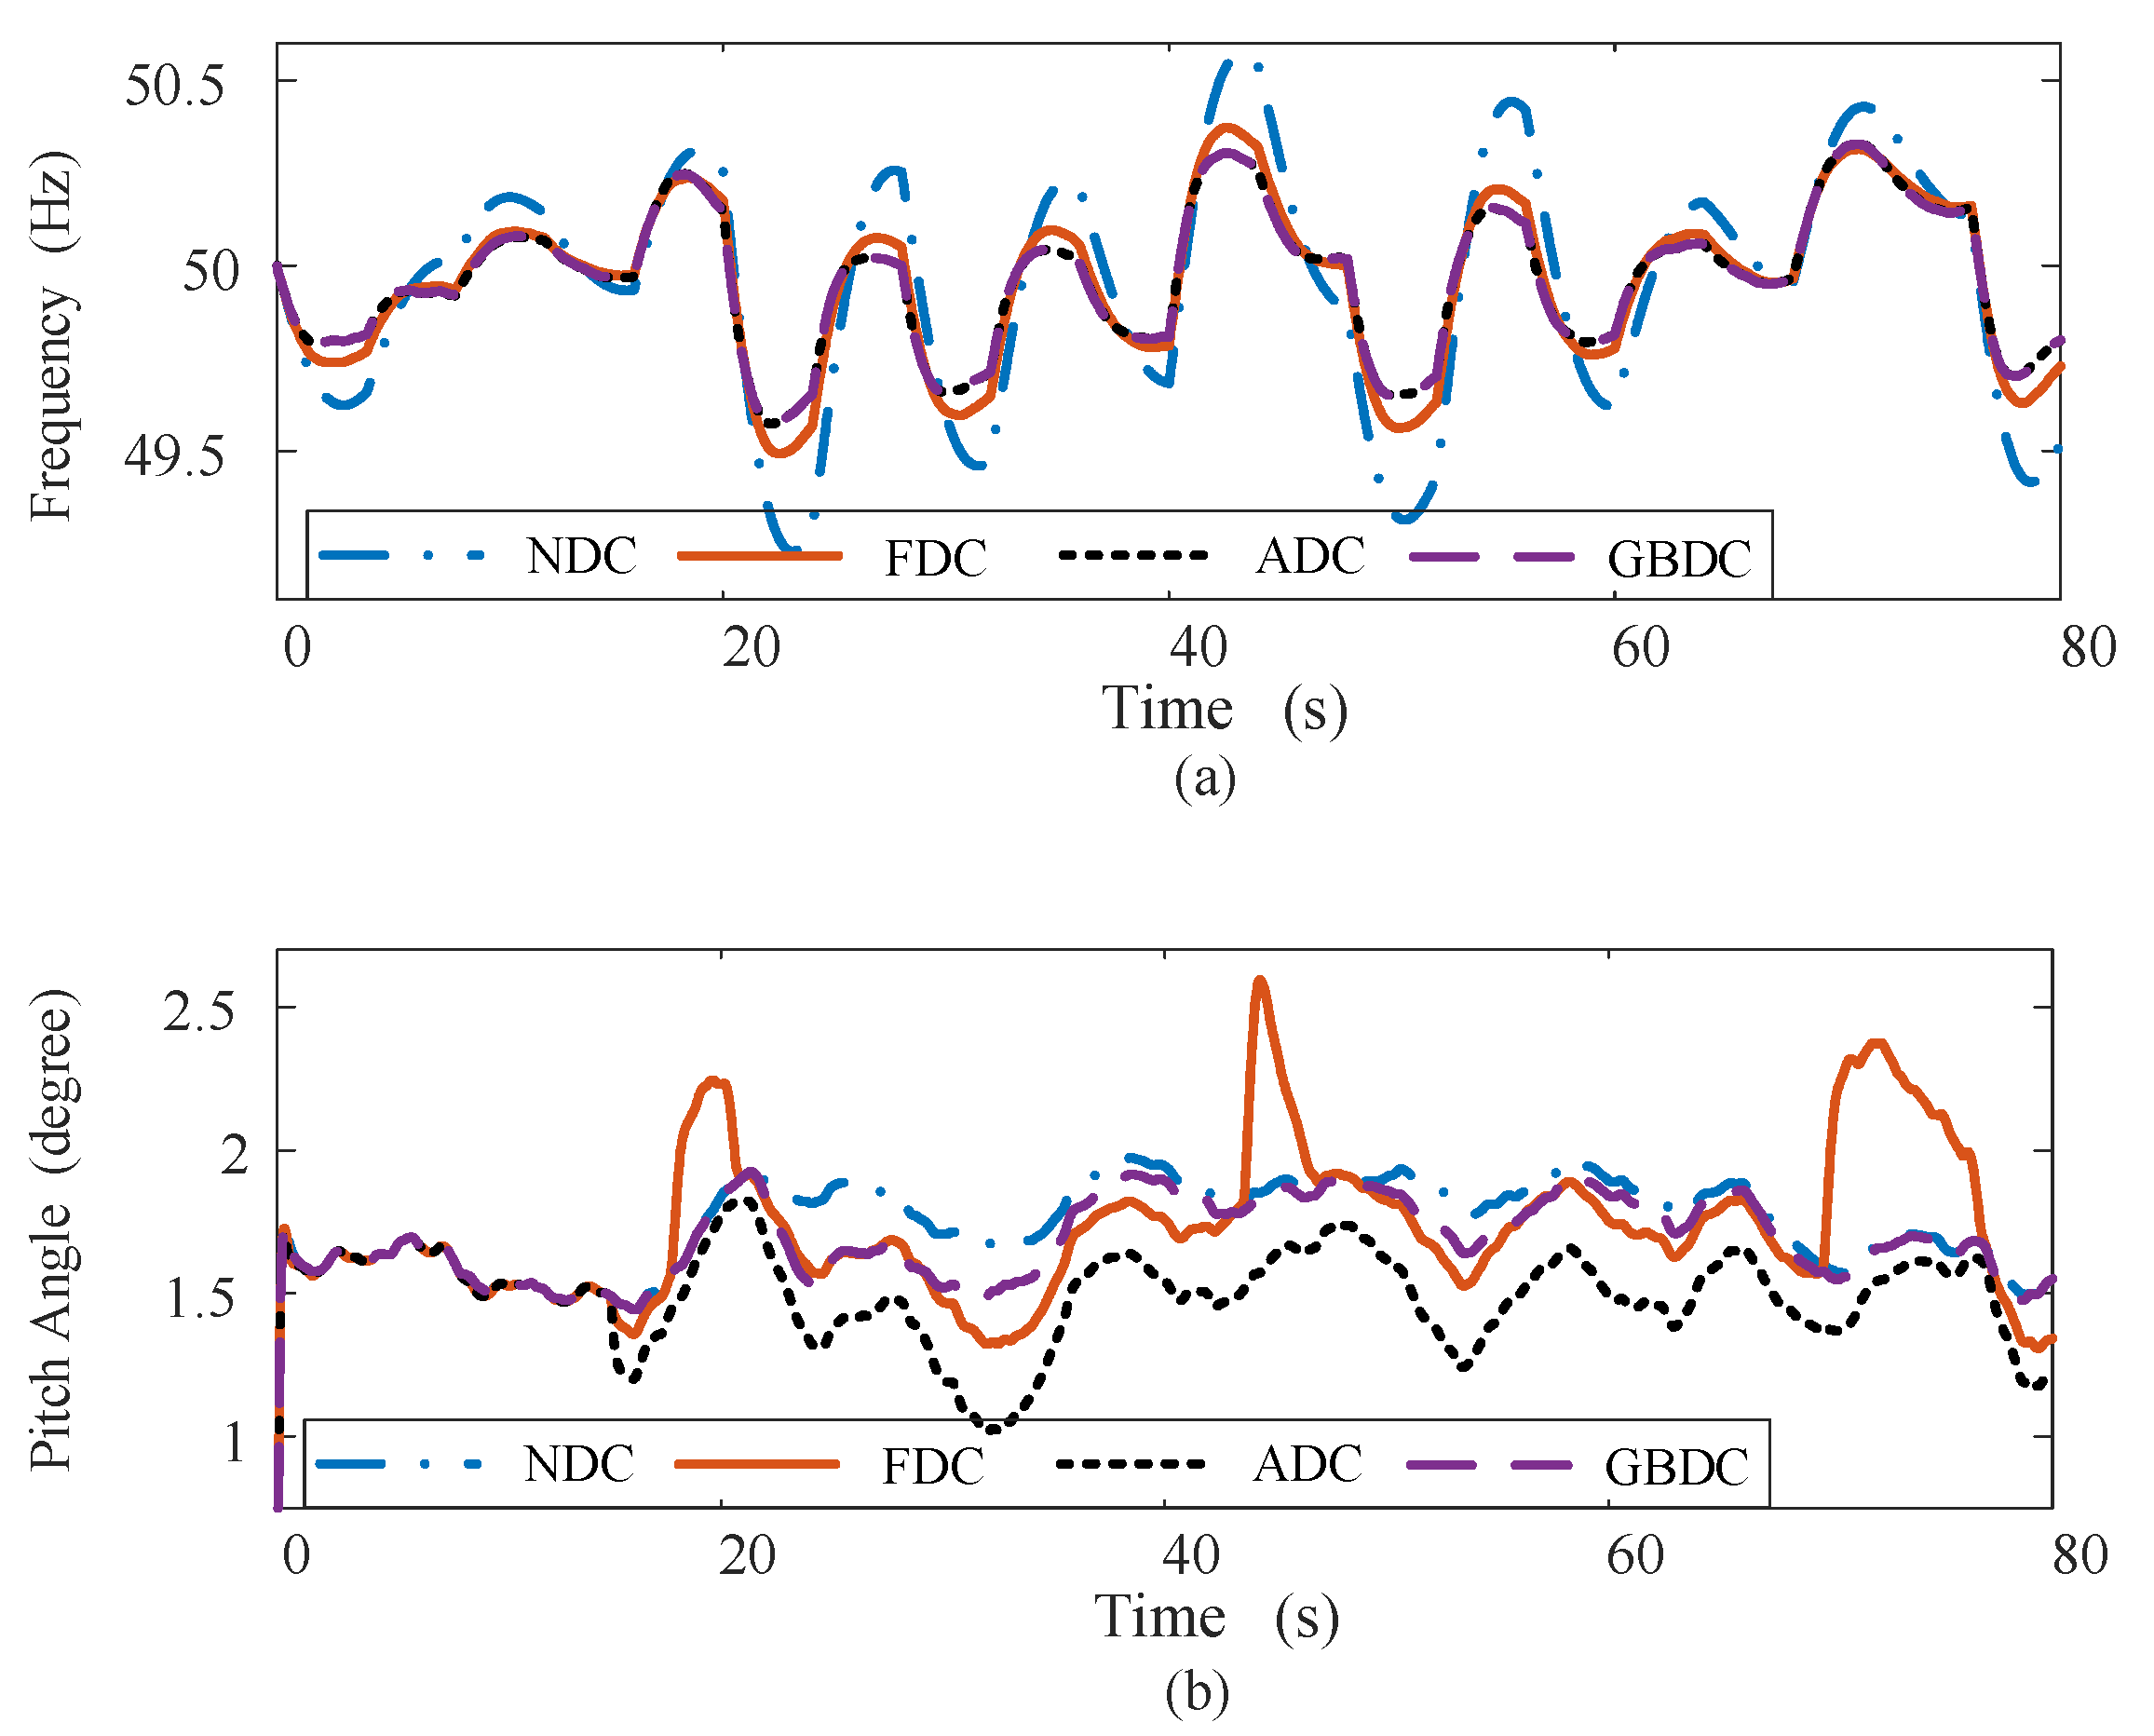
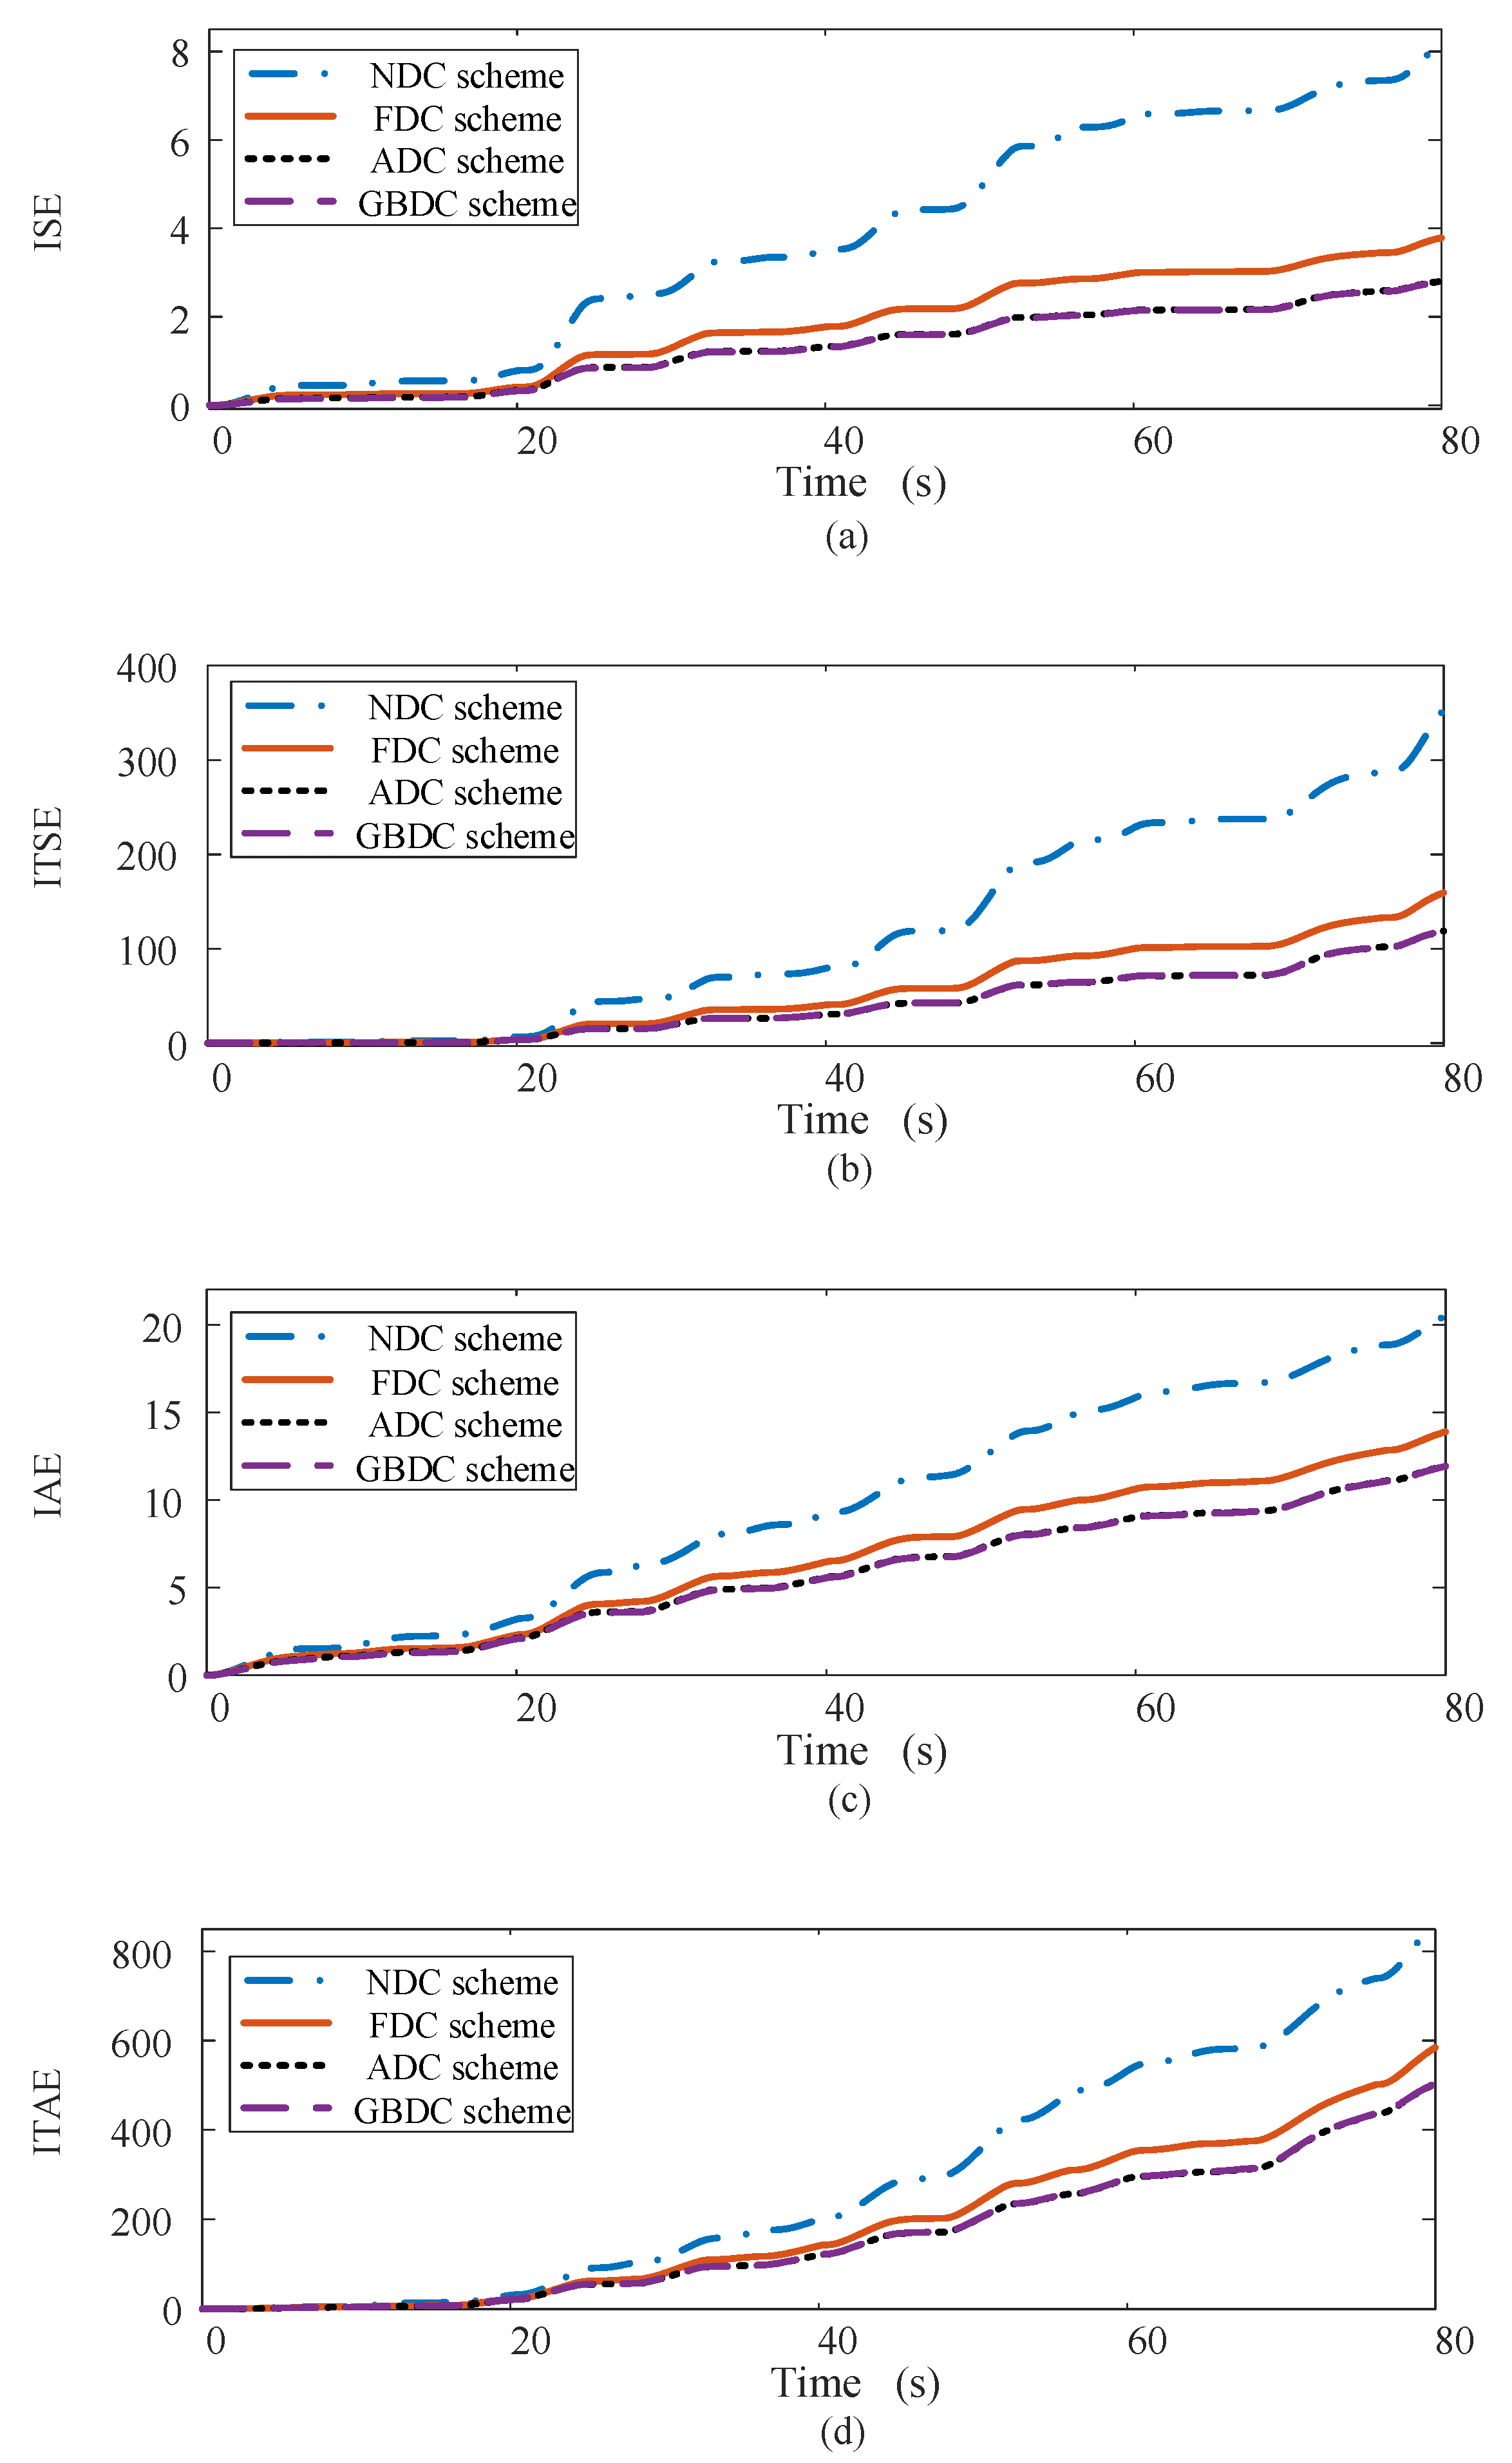
5.4. Case 4: Random Wind Conditions

To verify the practicality of the proposed scheme, a simulation under continuous wind and load disturbances is carried out in this section. The wind speed of each row is shown in Figure 14a, while the load disturbance is presented in Figure 14b. Moreover, the uncertainty of the frequency measurement is also included as a disturbance to test the robustness of the schemes. The measurement error is shown in Figure 14c.
The simulation results are presented in Figure 15. Compared with the NDC scheme, where WTGs do not participate in frequency regulation, the other schemes can all mitigate the frequency fluctuations. The frequency curves of the GBDC and ADC schemes are coincident and fluctuate more gently than that of the FDC scheme most of the time. Since there is no frequency regulation control, the pitch angle in the NDC scheme only changes with the wind speed. Therefore, the pitch angle of the NDC scheme can be applied as a reference to evaluate the fluctuation of the other schemes. Compared with the FDC and ADC schemes, the pitch angle curve of the GBDC scheme is closer to that of the NDC scheme, which means that the pitch angle changes more gently.
To further verify the superiority of the GBDC scheme, four indices are applied to evaluate the performances of the schemes. As introduced in [37], the expressions of the indices are as follows:
{ ISE Δ f = 0 t s [ Δ f ( t ) ] 2 d t ITSE Δ f = 0 t s t [ Δ f ( t ) ] 2 d t IAE Δ f = 0 t s | Δ f ( t ) | d t ITAE Δ f = 0 t s t | Δ f ( t ) | d t
{ ISE Δ β = 0 t s [ Δ β ( t ) ] 2 d t ITSE Δ β = 0 t s t [ Δ β ( t ) ] 2 d t IAE Δ β = 0 t s | Δ β ( t ) | d t ITAE Δ β = 0 t s t | Δ β ( t ) | d t
where t s is the simulation time, and Δ β ( t ) is the difference between the pitch angles of the evaluated and the NDC schemes.
The curves of the indices are presented in Figure 16 and Figure 17. The comparison proves that the ADC and the GBDC schemes can both improve the frequency to a satisfactory level.
As for the pitch angle indices, the accumulative error of the GBDC is closest to the reference (curves of the NDC scheme), which means that the fluctuation is the most gentle.

6. Conclusions

This paper proposes a sophisticated frequency regulation strategy for WFs. To prepare an adequate active power reserve for frequency response, a CDC scheme combining the OSC and the PAC is presented. In this scheme, WTGs at different ranges of wind speed deload using different methods. For WTGs at low wind speed, only the OSC is adopted so that the frequent pitch angle action caused by the PAC is avoided. For WTGs at high wind speed, the deloading work is accomplished by the coordination of the OSC and the PAC. In this study, the PAC is only adopted as a supplementary control method. Compared with the OSC scheme, the coordination enables the WTGs at high wind speed to possess a large deloading ratio.
For the frequency response of WFs consisting of WTGs with the CDC scheme, a GBDC scheme is proposed in this paper. In this scheme, the droop coefficients of the WF and the WTGs are determined according to the precisely evaluated FRCs. To improve the frequency response and ensure stable operation, the droop coefficients are proportional to the FRCs in the whole process. Moreover, to reduce the pitch angle action in the frequency response process, the WTGs are divided into two groups according to whether the PAC is adopted in the deloading process. Then, a pair of exponential functions are adopted to determine their participation degrees of frequency response. The simulations demonstrate that the GBDC scheme can improve the system frequency to the same extent as the ADC scheme, while the pitch angle action of the GBDC scheme is smaller. In some small disturbances, the GBDC scheme can even make the pitch angle fluctuate more gently than the conventional FDC scheme.
One consideration for future work is the influence of parametric uncertainty. In this paper, the interest is mainly focused on the mechanism between the system frequency and the frequency response power of WFs with different schemes. The WTG model is simplified to improve simulation efficiency. Considering various problems that may be encountered in practice, including the difficulty of parameter measurement, the frequency regulation methods based on parametric uncertainty and their influence on the frequency stability are of vital significance. Moreover, wind power fluctuation is a main disturbance source to the frequency. An accurate wind power prediction is helpful to develop the frequency regulation strategy. Therefore, a novel strategy that contains deloading and frequency response schemes based on wind power prediction is under ongoing investigation.

Author Contributions

Conceptualization, H.L.; methodology, H.L. and P.W.; software, P.W.; validation, H.L., T.Z. and Z.F.; formal analysis, T.Z.; investigation, P.W.; resources, P.W. and T.Z.; data curation, P.W.; writing—original draft preparation, P.W. and T.Z.; writing—review and editing, T.Z.; visualization, H.L. and H.P.; supervision, H.L. and Z.F. All authors have read and agreed to the published version of the manuscript.

Funding

This research was funded in part by the Natural Science Foundation for Distinguished Young Scholars of Guangxi (Grant No.2018GXNSFFA281006).

Institutional Review Board Statement

Not applicable.

Informed Consent Statement

Not applicable.

Data Availability Statement

Not applicable.

Conflicts of Interest

The authors declare no conflict of interest.

References

  1. Vargas, S.A.; Esteves, G.R.T.; Maçaira, P.M.; Bastos, B.Q.; Cyrino Oliveira, F.L.; Souza, R.C. Wind Power Generation: A Review and a Research Agenda. J. Clean. Prod. 2019, 218, 850–870. [Google Scholar] [CrossRef]
  2. Ye, L.; Zhang, C.; Xue, H.; Li, J.; Lu, P.; Zhao, Y. Study of Assessment on Capability of Wind Power Accommodation in Regional Power Grids. Renew. Energy 2019, 133, 647–662. [Google Scholar] [CrossRef]
  3. Kumar, D.; Chatterjee, K. A Review of Conventional and Advanced MPPT Algorithms for Wind Energy Systems. Renew. Sustain. Energy Rev. 2016, 55, 957–970. [Google Scholar] [CrossRef]
  4. Hu, L.; Xue, F.; Qin, Z.; Shi, J.; Qiao, W.; Yang, W.; Yang, T. Sliding Mode Extremum Seeking Control Based on Improved Invasive Weed Optimization for MPPT in Wind Energy Conversion System. Appl. Energy 2019, 248, 567–575. [Google Scholar] [CrossRef]
  5. Bonfiglio, A.; Invernizzi, M.; Labella, A.; Procopio, R. Design and Implementation of a Variable Synthetic Inertia Controller for Wind Turbine Generators. IEEE Trans. Power Syst. 2019, 34, 754–764. [Google Scholar] [CrossRef]
  6. Cheng, Y.; Azizipanah-Abarghooee, R.; Azizi, S.; Ding, L.; Terzija, V. Smart Frequency Control in Low Inertia Energy Systems Based on Frequency Response Techniques: A Review. Appl. Energy 2020, 279, 115798. [Google Scholar] [CrossRef]
  7. Yang, D.; Jin, Z.; Zheng, T.; Jin, E. An Adaptive Droop Control Strategy with Smooth Rotor Speed Recovery Capability for Type III Wind Turbine Generators. Int. J. Electr. Power Energy Syst. 2022, 135, 107532. [Google Scholar] [CrossRef]
  8. Boyle, J.; Littler, T.; Muyeen, S.M.; Foley, A.M. An Alternative Frequency-droop Scheme for Wind Turbines That Provide Primary Frequency Regulation via Rotor Speed Control. Int. J. Electr. Power. Energy Syst. 2021, 133, 107219. [Google Scholar] [CrossRef]
  9. Wu, Y.; Yang, W.; Hu, Y.; Dzung, P.Q. Frequency Regulation at a Wind Farm Using Time-varying Inertia and Droop Controls. IEEE Trans. Ind. Appl. 2019, 55, 213–224. [Google Scholar] [CrossRef]
  10. Van de Vyver, J.; De Kooning, J.D.M.; Meersman, B.; Vandevelde, L.; Vandoorn, T.L. Droop Control as an Alternative Inertial Response Strategy for the Synthetic Inertia on Wind Turbines. IEEE Trans. Power Syst. 2016, 31, 1129–1138. [Google Scholar] [CrossRef]
  11. Prakash, V.; Kushwaha, P.; Sharma, K.C.; Bhakar, R. Frequency Response Support Assessment from Uncertain Wind Generation. Int. J. Electr. Power Energy Syst. 2022, 134, 107465. [Google Scholar] [CrossRef]
  12. Hafiz, F.; Abdennour, A. Optimal Use of Kinetic Energy for the Inertial Support from Variable Speed Wind Turbines. Renew. Energy 2015, 80, 629–643. [Google Scholar] [CrossRef]
  13. Wang, H.; Chen, Z.; Jiang, Q. Optimal Control Method for Wind Farm to Support Temporary Primary Frequency Control with Minimised Wind Energy Cost. IET Renew. Power Gener. 2015, 9, 350–359. [Google Scholar] [CrossRef]
  14. Yang, D.; Kim, J.; Kang, Y.C.; Muljadi, E.; Zhang, N.; Hong, J.; Song, S.; Zheng, T. Temporary Frequency Support of a DFIG for High Wind Power Penetration. IEEE Trans. Power Syst. 2018, 33, 3428–3437. [Google Scholar] [CrossRef]
  15. Altin, M.; Hansen, A.D.; Barlas, T.K.; Das, K.; Sakamuri, J.N. Optimization of Short-term Overproduction Response of Variable Speed Wind Turbines. IEEE Trans. Sustain. Energy 2018, 9, 1732–1739. [Google Scholar] [CrossRef]
  16. Ruttledge, L.; Flynn, D. Emulated Inertial Response from Wind Turbines: Gain Scheduling and Resource Coordination. IEEE Trans. Power Syst. 2016, 31, 3747–3755. [Google Scholar] [CrossRef]
  17. Wang, S.; Tomsovic, K. A Novel Active Power Control Framework for Wind Turbine Generators to Improve Frequency Response. IEEE Trans. Power Syst. 2018, 33, 6579–6589. [Google Scholar] [CrossRef]
  18. Wilches-Bernal, F.; Chow, J.H.; Sanchez-Gasca, J.J. A Fundamental Study of Applying Wind Turbines for Power System Frequency Control. IEEE Trans. Power Syst. 2016, 31, 1496–1505. [Google Scholar] [CrossRef]
  19. Liu, Z.; He, H.; Jiang, S.; Yu, H.; Xiao, S. The Effects of Wind Turbine and Energy Storage Participating in Frequency Regulation on System Frequency Response. In Proceedings of the 2021 IEEE 5th Advanced Information Technology, Electronic and Automation Control Conference (IAEAC), Chongqing, China, 12–14 March 2021; Volume 5, pp. 283–288. [Google Scholar]
  20. Lyu, X.; Zhao, J.; Jia, Y.; Xu, Z.; Wong, K.P. Coordinated Control Strategies of PMSG-based Wind Turbine for Smoothing Power Fluctuations. IEEE Trans. Power Syst. 2019, 34, 391–401. [Google Scholar] [CrossRef]
  21. Ye, H.; Pei, W.; Qi, Z. Analytical Modeling of Inertial and Droop Responses from a Wind Farm for Short-term Frequency Regulation in Power Systems. IEEE Trans. Power Syst. 2016, 31, 3414–3423. [Google Scholar] [CrossRef]
  22. Fernández-Bustamante, P.; Barambones, O.; Calvo, I.; Napole, C. Provision of Frequency Response from Wind Farms: A Review. Energies 2021, 14, 6689. [Google Scholar] [CrossRef]
  23. Abraham, A.; Hong, J. Dynamic Wake Modulation Induced by Utility-scale Wind Turbine Operation. Appl. Energy 2020, 257, 114003. [Google Scholar] [CrossRef]
  24. Gao, X.; Wang, T.; Li, B.; Sun, H.; Yang, H.; Han, Z.; Wang, Y.; Zhao, F. Investigation of Wind Turbine Performance Coupling Wake and Topography Effects Based on LiDAR Measurements and SCADA Data. Appl. Energy 2019, 255, 113816. [Google Scholar] [CrossRef]
  25. Brogna, R.; Feng, J.; Sørensen, J.N.; Shen, W.; Porté-Agel, F. A New Wake Model and Comparison of Eight Algorithms for Layout Optimization of Wind Farms in Complex Terrain. Appl. Energy 2019, 259, 114189. [Google Scholar] [CrossRef]
  26. Aziz, A.; Oo, A.M.T.; Stojcevski, A. Frequency regulation capabilities in wind power plant. Sustain. Energy Technol. Assess. 2018, 26, 47–76. [Google Scholar] [CrossRef]
  27. Choi, S.; Kang, Y.C.; Kim, K.; Lee, Y.; Terzija, V. A Frequency-responsive Power-smoothing Scheme of a Doubly-fed Induction Generator for Enhancing the Energy-absorbing Capability. Int. J. Electr. Power Energy Syst. 2021, 131, 107053. [Google Scholar] [CrossRef]
  28. Li, Y.; Xu, Z.; Zhang, J.; Wong, K.P. Variable Gain Control Scheme of DFIG-based Wind Farm for Over-frequency Support. Renew. Energy 2018, 120, 379–391. [Google Scholar] [CrossRef]
  29. Lee, J.; Muljadi, E.; Srensen, P.; Kang, Y.C. Releasable Kinetic Energy-based Inertial Control of a DFIG Wind Power Plant. IEEE Trans. Sustain. Energy 2016, 7, 279–288. [Google Scholar] [CrossRef]
  30. Vidyanandan, K.V.; Senroy, N. Primary Frequency Regulation by Deloaded Wind Turbines Using Variable Droop. IEEE Trans. Power Syst. 2013, 28, 837–846. [Google Scholar] [CrossRef]
  31. Mahish, P.; Pradhan, A.K. Distributed Synchronized Control in Grid Integrated Wind Farms to Improve Primary Frequency Regulation. IEEE Trans. Power Syst. 2020, 35, 362–373. [Google Scholar] [CrossRef]
  32. Ochoa, D.; Martinez, S. Frequency Dependent Strategy for Mitigating Wind Power Fluctuations of a Doubly-fed Induction Generator Wind Turbine Based on Virtual Inertia Control and Blade Pitch Angle Regulation. Renew. Energy 2018, 128, 108–124. [Google Scholar] [CrossRef]
  33. Ding, L.; Yin, S.; Wang, T.; Jiang, J.; Cheng, F.; Si, J. Integrated Frequency Control Strategy of DFIGs Based on Virtual Inertia and Over-speed Control. Power Syst. Technol. 2015, 35, 2385–2391. [Google Scholar]
  34. Datta, U.; Kalam, A.; Shi, J. Frequency Performance Analysis of Multi-gain Droop Controlled DFIG in an Isolated Microgrid Using Real-time Digital Simulaton. Eng. Sci. Technol. Int. J. 2020, 23, 1028–1041. [Google Scholar]
  35. Hwang, M.; Muljadi, E.; Park, J.; Sørensen, P.; Kang, Y.C. Dynamic Droop–based Inertial Control of a Doubly-fed Induction Generator. IEEE Trans. Sustain. Energy 2016, 7, 924–933. [Google Scholar] [CrossRef]
  36. Xu, B.; Zhang, L.; Yao, Y.; Yu, X.; Yang, Y.; Li, D. Virtual Inertia Coordinated Allocation Method Considering Inertia Demand and Wind Turbine Inertia Response Capability. Energies 2021, 14, 5002. [Google Scholar] [CrossRef]
  37. Zafran, M.; Khan, L.; Khan, Q.; Ullah, S.; Sami, I. Finite-Time Fast Dynamic Terminal Sliding Mode Maximum Power Point Tracking Control Paradigm for Permanent Magnet Synchronous Generator-Based Wind Energy Conversion System. Appl. Sci. 2020, 10, 6361. [Google Scholar] [CrossRef]
Figure 1. Mechanical power and the MPPT curves.
Energies 15 02722 g001
Figure 2. Power coefficient curve.
Energies 15 02722 g002
Figure 3. Principle of the cooperative deloading control.
Energies 15 02722 g003
Figure 4. Algorithm of the CDS.
Energies 15 02722 g004
Figure 5. Configuration of active power reference.
Energies 15 02722 g005
Figure 6. Configuration of DPAC.
Energies 15 02722 g006
Figure 7. Schematic of DPAC: (a) turning the pitch angle depending on rotor speed; (b) mechanical power with the DPAC scheme.
Energies 15 02722 g007
Figure 8. Exponential membership functions.
Energies 15 02722 g008
Figure 9. Primary frequency control of the low-order system.
Energies 15 02722 g009
Figure 10. Structure of the wind farm.
Energies 15 02722 g010
Figure 11. Simulation results of Case 1: (a) system frequency; (b) active power of WF; (c) active power of WTG#1; (d) active power of WTG#6; (e) pitch angle of WTG#1.
Energies 15 02722 g011aEnergies 15 02722 g011b
Figure 12. Simulation results of Case 2: (a) system frequency; (b) active power of WF; (c) active power of WTG#1; (d) active power of WTG#6; (e) pitch angle of WTG#1.
Energies 15 02722 g012aEnergies 15 02722 g012b
Figure 13. Simulation results of Case 3: (a) system frequency; (b) active power of WF; (c) active power of WTG#1; (d) active power of WTG#6; (e) pitch angle of WTG#1.
Energies 15 02722 g013
Figure 14. Disturbances: (a) wind disturbance; (b) load disturbance; (c) frequency measurement error.
Energies 15 02722 g014
Figure 15. Simulation results of Case 4: (a) frequency; (b) pitch angle of WTG#1.
Energies 15 02722 g015
Figure 16. Indices of frequency deviation: (a) ISE; (b) ITSE; (c) IAE; (d) ITAE.
Energies 15 02722 g016
Figure 17. Indices of pitch angle deviation: (a) ISE; (b) ITSE; (c) IAE; (d) ITAE.
Energies 15 02722 g017aEnergies 15 02722 g017b
Table 1. Lookup table for deloading pitch angle.
Wind
Speed
(m/s)
10% Deloading20% Deloading
Deloading Pitch Angle β 0
(Degree)
10.41.9472.899
10.71.8062.753
11.01.6492.553
11.31.4932.308
11.61.3472.042
11.91.2161.788
Publisher’s Note: MDPI stays neutral with regard to jurisdictional claims in published maps and institutional affiliations.

