Abstract
Digital Business Services (DBS), industries that have grown rapidly in recent years, played important roles in facilitating the adoption of digital technologies, as well as having applications in innovative products, transforming business processes across the economy. If DBS firms are committed to reducing negative environmental impacts, they should be able to make more positive contributions to their clients’ performance; for instance, promoting the digitalization of businesses process in ways that can reduce greenhouse gas emissions and inefficient energy usage. But what are DBS business practices, in terms of greenhouse gas emissions and related topics? This study examines the Environmental, Social and Governance (ESG) disclosures of leading companies providing consultancy, advertising/marketing, and information technology services. The plans, targets, and actions of DBS companies with above-average ESG scores, as indexed by the Refinitiv dataset, are examined. The results indicate that all of these firms express goals, and almost all of them have set clear targets, in terms of moving to net zero. A wide range of relevant activities is being implemented, including services that promote energy efficiency. The diversity of these actions suggests that these firms can learn from each other, and that companies with lower ESG ratings have models to emulate.
1. Introduction
Most governments worldwide have accepted the need to address climate change as one of the crucial pillars of sustainable development. According to the report of the World Economic Forum, failure to mitigate climate change is perceived as one of the most serious risks for the next 10 years [1].
More than 40 countries use carbon-pricing mechanisms—carbon tax and emission trading systems, which cover half of their Greenhouse Gas (GHG) emissions and 13% of global emissions [2]. Responding to criticisms that rich countries are offshoring their emissions, the EU carbon border tax will be the first carbon tax (The Carbon Border Adjustment Mechanism CBAM is a controversial measure, as the implementation effort is rather high, while the projected extra reduction in global carbon emissions is estimated at merely 0.2 percentage points [3] to be applied to imported goods [4].
Taking urgent action to combat climate change is one of the United Nations (UN) Sustainable Development Goals (SDGs), which contribute to poverty reduction, well-being, peace and other aspects securing the future of the planet [5]. The private sector, one of the main contributors to global warming, has already recognized the necessity of integrating sustainable development principles into their corporate policy and decision-making. A survey of 1141 companies from 31 countries and 7 industries (energy, utilities and mining (23% of the sample); industrial manufacturing and automotive (21%); consumer markets (20%); financial services (20%); technology, media and telecoms (20%); health (2%))was undertaken by PwC in 2019 [6]. This found that 72% of companies mentioned SDGs in their integrated, annual or sustainability reporting, whereas 25% of companies included them in their published strategies. Moreover, 77% of mining and metal companies have already set carbon neutrality objectives, while 41% of these companies plan to reach carbon neutrality in 2030–2040 [7]. The Glasgow Climate Change Conference (COP26), in 2021, sought to define the global climate agenda for the next decade. Countries agreed to cut methane emissions and reduce coal production by 2030. A total of 500 global financial services firms agreed to match their portfolios to the Paris Agreement goals and avoid investing in “dirty energy” companies [8].
A general concept for the incorporation of sustainability concerns into corporate strategies and operations is commonly referred to as “Environmental, Social and Governance) performance” (ESG). These three factors were first introduced in 2006 by the United Nations Principles for Responsible Investment (for more information, see [9]) and were used by Goldman Sachs in the Environmental Policy report [10]. The first dimension includes ways to improve environmental performance in production and operation by managing resources (energy, water), environmental preservation and, importantly, greenhouse gas (GHG) emissions. The social dimension refers to the activities associated with employees, customers, and human rights, while the government dimension covers the mechanisms for improving the corporate system and specific actions to promote environmental and social policies [11,12]. Despite the absence of common standards of ESG disclosure, this is currently one of the most important indicators of non-financial performance, and is widely relied upon by investors [13].
International regulatory frameworks assist investors in assessing climate change issues. Companies’ ability to raise funds, and, thus, their long-term development, may now depend on how they set ESG goals and restructure their processes to adhere to these, so as to meet investor expectations and conform to responsible investing principles. Apart from calculating emissions, companies are also required to model the climate risks and opportunities that may affect their financial performance and financial strategies (For more information, see [14]). The UK, for instance, will be the first G20 country where financial institutions and large private companies will be required to disclose climate-related financial information, in line with requirements of the Task Force on Climate-Related Financial Disclosures [15]. Furthermore, the Bank of England and the Prudential Regulation Authority consider that a potential requirement for banks could be that they are instructed to hold extra capital to cover risks from climate change; this could make providing loans and services to fossil fuel companies and “high carbon” projects more expensive [16] Reducing investments in “less green” companies and assets may jeopardize business relations between financial institutions and their clients [17]. At the same time, investment in green assets may also involve certain risks, such as asset price volatility and development and bursting of “bubbles” connected with ill-informed attitudes concerning the supply and demand side of more sustainable production [18,19]. Meanwhile, there is a growing consumer demand for more sustainable products, with lower carbon footprints [20].
The growing importance of ESG performance for investors has created a requirement for the standardization of ESG disclosure frameworks. The responses have included the Global Reporting Initiative (GRI) standards, promoting global transparency, and comparability and quality of economic, environmental, and social information (For more information, see [21]). In Europe, another result is the 2014/95/EU Directive on non-financial and diversity reporting, that, since 2017, has required large companies to disclose non-financial information. In 2019, the European Council introduced the Sustainable Finance Disclosure Regulation (SFDR), which aimed to incorporate ESG-related disclosure information into the financial sector’s investment decisions. This came into force in 2021 [22].
A total of 82% of investment firms reported incorporating the ESG agenda into their decision-making, which became essential for attracting funds from investors in 2019 [23]. ESG standards extend beyond the immediate activities of the covered firms and consider the indirect impacts related to their use of suppliers and contractors. The Scope 3 Standard requires companies to count value chain emissions; this implies that B2B services (for more information, see [24]) may have major emissions concerning their own suppliers. These standards are especially important for financial service companies. The direct impact of their operations can suggest that their disclosures will be relatively small. However, their broader investment decisions—the businesses they invest in or provide with loans—can present a much larger source of emissions; by some accounts [25], these are almost 700 times higher. Major potential for improvement lies in the creation of new “green” products that can meet the growing customer demand, for instance, net zero-aligned funds [26]. Digital business services companies are also recognizing the importance of climate change and the need to improve their eco-performance. The Science-Based Targets initiative (SBTi) provides the best practice in emissions reductions for a variety of industries, including financial institutions and information and communications technology (ICT) companies (For more information, see [27]). Companies use special guidance to commit to net-zero targets based on scientific criteria.
The COVID-19 pandemic has had a profound effect on energy supply and demand. Substantial measures are needed to help countries and industries recover from the recession. Energy transition is a crucial element of meeting sustainability goals such as limiting the impact of climate change. These goals are unlikely to be achieved without improving the carbon neutrality of the corporate sector [28].
Companies develop different approaches to reach carbon neutrality goals. Innovation is one response to climate change—more than 87.5 bn USD was invested by various industries in so-called “climate tech” in 2020–2021 [26]. The Measuring Eco-Innovation (MEI) project distinguished between several categories (for more information, see [29]). Practices focused on environmental technologies include tools applied to waste, water, pollution and energy management, mitigation of carbon emissions, and recycling. Organizational practices encompass voluntary certification (EMS/ISO 14000, LEED), “green” human resource management, the independent auditing of environmental indicators, management responsibilities regarding sustainability, and green supply chain management (“sustainable green logistics”). Business services can be “green” (for example, a climate-change-related mortgage service), generate less pollution, be less resource-intensive (e.g., platforms to support the sharing of cars and other equipment), or be otherwise environmentally improved (eco-design). They can also have an environmental purpose (environmental consulting, testing, engineering and analytics).
This range of practices raises questions as to how various types of companies address environmental issues, which policies and targets they settle upon, and which actions are undertaken to reduce greenhouse gas emissions. As Carroll (2021) and Latapí Agudelo et al. (2019) [30,31] stated in their literature reviews (examining the understanding of corporate social responsibility by academicians and professionals), there is limited research that provides an overview of the business practices that are actually undertaken by companies. Such an overview could provide insights for the design of net zero strategies and management of climate risks for companies seeking to meet sustainable development requirements, as well as helping to address the challenges related to climate change. Our explanatory analysis of company’s current activities intends to fill this gap; it may be helpful for companies considering how their energy transition may be facilitated, for example, by financing renewable energy products and supply chain improvements in respect to net-zero emissions and building future operational resilience.
Our contribution is fourfold. First, our case-based research investigates the determinants of firms’ strategy-making, relating their stated strategic goals to specific sectoral and supply chain locations, their governance and market position, and similar characteristics. Second, the study focuses on the environmental practices of one sector, the digital business service (DBS) industry, and discusses the substantial potential of this rapidly growing industry in reaching carbon neutrality goals. Third, the paper reviews DBS practices aimed at enhancing energy efficiency, reducing the use of natural resources, curbing GHG emissions, and applying special policies to design green supply chains. Finally, the paper addresses the question of which digital solutions these companies develop to help their clients become “greener”, including cloud services, emissions and resources calculation tools, remote working tools, and climate risk assessment models, among others. The present research contributes to the literature on corporate social responsibility by focusing on eco-innovations aimed at addressing climate change and systematizing the evidence collected in Refinitiv.
2. Literature Review
The literature review provides insights into the link between a company’s performance and sustainability. Particular attention is paid to the various types of digital business services whose growth has been very rapid in recent decades, and to corporate social responsibility practices as indicators of shared value and pro-social corporate objectives.
2.1. Corporate Performance and Sustainability
An important issue for investors is whether it pays to be green. Overall, the evidence suggests that environmental practices improve corporate financial performance and firm value. Studies examining this often use indicators such as debt ratio, profit margin, market-to-book ratio, return on assets, return on invested capital [32], return on sales, Tobin’s Q, and current ratio [33,34] as indicators of corporate performance. Some studies feature market-based indicators of increases in access to new markets, market share/competitive advantage, and customer willingness to pay a premium price for products [35]. Furthermore, Wieczorek-Kosmala et al. (2021) [11] use operating profit margin and assets’ productivity. In a meta-review of 2000 empirical studies, Friede et al. (2015) [36] found that the majority of research studies in different years show a significant positive relationship between corporate performance and ESG. A more recent meta-analysis of 142 studies by Hang et al. (2019) [37] concluded that, while corporate environmental performance may not result in substantial short-term impacts, it does increase long-term financial performance. Studies for separate countries and industries, such as Italy, Germany, China, report that environmentally related actions have a positive effect on a company’s performance [11,32,35,38], while cross-country research provides national differences in the relationship between environmental practices and corporate performance (for example, [39]). There is a large variation in the sampled firms and measured variables (including metrics of ESG performance), which may partly explain the observed differences in results. Research on service industries is rather scarce and often limited to financial services [34,40].
2.2. Digital Business Services
Increasingly advanced ICT systems have been applied across almost all sectors of the economy in the decades since discussions on “the microelectronics revolution” took off in the 1980s—an ever-widening set of applications of more powerful and user-friendly systems, often linked together via sophisticated telecommunication networks (cf. [41]). Numerous user devices are now employed (including tablets and smartphones), with interfaces including speech recognition and augmented reality, and tools such as advanced data analytics and artificial intelligence being deployed to provide decision support, if not complete automation, in novel circumstances. The underpinning digital technologies are supported by a range of service activities. Specialized digital service firms have proliferated to facilitate companies initiating or adopting innovations to enhance their efficiency, effectiveness, market reach, and customer loyalty. Such digital business services (DBS) are mainly delivered by companies from three types of industry: digital business consultancy services, digital advertising, and ICT services [42,43]. The latter sometimes evolved or spun off from more “traditional” ICT hardware, telecommunications, advertising/marketing, and consultancy services firms, and sometimes they are fairly new entrants.
Taking the three types of DBS in turn, consultancy services can focus on specific ICT-related aspects of corporate and innovation culture, as well as providing more general insights concerning benchmarking and best practice, the management of technological transformation and related organizational change, and digital strategy design and execution. Investigation of the trade-offs between market and technological opportunities, and the corresponding risks associated with rapid digital transformation, can inform the redesign of business models and restructuring of value chains (hopefully bolstering their operational flexibility, reliability, and resilience). For example, market research company “Facts and Factors” [44] estimated the digital transformation consulting market size alone to grow by 7.5% a year, from USD 5 bn in 2020 to USD 11bn in 2026, while the global digital transformation market size was valued at USD 336 bn in 2020 and is expected to grow at a compound annual growth rate of 23.6% from 2021 to 2028.
Digital advertising, including search advertising (the largest segment) and social media, has displaced a lot of traditional advertising in recent years. Statista estimated this market as USD 465.6 bn globally in 2021, and it is anticipated to reach USD 643.7 bn in 2025 [45]. Digital advertising businesses apply their expertise in using digital media to promote messages—typically ones that encourage consumers to purchase particular products, but these messages also span a wider range. They take advantage of the ability to locate (and often personalize messages to) potential target audiences, and to gather information on the successes and limitations of particular techniques, campaigns and strategies. For example, we know that, in 2021, the majority of US advertising revenue was generated by digital advertising [46]. Although in 2019, global advertising dollars were still mainly spent on traditional media [47], in recent years, traditional media expenditures have been slashed on a regular basis, while marketers continue to place a premium on digital media [48].
ICT services, in particular, have provided information and remote computing (cloud) services, requiring them to operate and/or access data centers with computing, storage and router facilities. These have supported clients’ use of cloud computing, Software as a Service (SaaS), online security services, etc. According to Statista (2021) [49], in 2020, all ICT services generated more than USD 0.9 trillion, of which 35% was generated by ICT outsourcing and 6% by ICT consulting and implementation. Statista (2021) [50] forecast that the market for software application in respect to business intelligence and analytics, which is very prominent for digital business consulting, will grow from USD 15.9 bn in 2021 to 17.6 bn in 2024. Consultancy services inform and advise clients’ decisions concerning the use of cloud services, knowledge management practices and systems, and AI applications.
While much of the research is focused on energy and industrial sectors, service industries—with the exception of transportation—are often considered to be relatively unimportant from the perspective of GHG reduction [51]. However, transport is not the only energy-intensive services industry. The ICT sector has an environmental footprint, not least during the stage of digital transformation observed in manufacturing at present. Earlier, the Global eSustainability Initiative forecasted the ICT sector reducing its carbon footprint to 1.97% of global emissions by 2030 [52]. The recent adjustment shows that the share of global GHG emissions associated with ICT-related services is estimated to be 2.1–3.9% [53]. ICT services consume electrical energy, which may or may not be “green”: the emissions associated with this largely depends on the resources used to produce this electricity. Technologies such as artificial intelligence and large-scale data analytics can be energy-intensive, as the learning phase of complex algorithms requires high computing power, while data centers for cloud computing require a high amount of electricity [54]. However, future GHG reductions are possible. In 2020, the International Telecommunication Union (ITU) introduced a new standard, providing a framework for the ICT sector industry to achieve the goals of the Paris agreement and reduce GHG emissions by 45% from 2020 to 2030 [54]. According to some estimates, the transition to renewable energy could reduce the ICT sector’s emissions by 85% [55]. Some internet and software giants have pledged GHG-related goals (such as Microsoft’s aim to reach net zero by 2030 and be carbon-negative by 2040), or are already using only renewable energy sources to cover their power consumption (Netflix, Google, Apple) [55].
ICT firms can play a large role in global GHG reduction by providing “green know-how” to improve energy efficiency, inventory management and transfer products from analogue to digital format, leading to assertions about, for example, green software, services, consulting and platforms, and even the “green internet of things” where smart grids, connected vehicles, and other resource-efficient applications support a smart city [56]. Meanwhile, the DBS industry, which combines ICT companies, digital advertising and consultancy services, has thrived in the energy services market since the implementation of the European Energy Efficiency Directive [57], which is having profound effects, for example, in Germany. The industry features companies that perform energy audit, energy management and contracting services, facility management, software development, monitoring and measuring services, which also prominently contribute to sustainable development [58]. Meanwhile, we see the emergence of ESG professional service firms that provide expertise on relevant training, reporting, certification, and data platforms for measuring ESG performance. In 2021, there were over 40 ESG professional services firms in Europe [59].
2.3. Corporate Social Responsibility
The recent advances in digital technologies have been accompanied by social expectations about business behavior. Pressure has grown for strategies to be driven by socially responsible investment decisions, and to contribute to the goal of sustainable development. The term corporate social responsibility (CSR) is applied to the set of corporate practices and models that corporations adopt to reflect the interests of the diversified set of stake-holders, and the public in general (not least regarding environmental issues), is recognized, as CSR ideas have become the benchmark in assessing companies’ roles in pursuing socially responsible business [30,60]. This concept leads companies to seek to align profit maximization with broader social goals [31].
Although related ideas were mentioned by researchers 70 years ago, CSR came to be established as a business practice, and to be acknowledged by investors, at around the turn of the century [61]. Chandler and Werther [62] were early advocates of the view that CSR brought a sustainable competitive advantage to companies; this idea was also supported by Porter and Kramer (2006) [63]. They stated that CSR practices led to a competitive advantage that created value for shareholders; Husted and Allen (2007) [64] saw such a value creation as being deeply connected with social demands. The minimization of environmental externalities as a strategic goal was introduced by Heslin and Ochoa (2008) [65], who made the case for green supply chains, and a strategic decrease in environmental footprints. Companies will engage with stakeholders in setting business ethical standards and concrete practices to execute corporate sustainability strategies [60,66] and daily operations [62].
Recent detailed literature reviews by Carroll (2021) and Latapí Agudelo et al. (2019) [31,61] have argued that there is a need to explore CSR through the core business activities of companies, to address how companies’ initiatives can contribute to the transformation of the overall economy to be in line with sustainable development trajectories. Our study should fill this niche by examining how companies find productive ways to generate shared value and reduce environmental footprints by considering the potential of approaches such as supply chain management, generating energy through renewable power stations, and purchasing carbon offsets.
3. Methodology
This section explains how ESG score is gathered for sampling and compared with the insights taken from companies’ annual reports, including those reports that are strictly devoted to their sustainable development. We are specifically concerned with the ESG scoring methodology, as it serves as a main instrument for selecting companies for analysis. It also overviews the sampling procedure used to collect DBS companies as cases.
3.1. ESG Score
There are two key databases that provide ESG data. The first is the ESG dataset of Bloomberg, and the second is Refinitiv’s ESG database (formerly known as Thomson Reuters’ ASSET4 database. These information agencies annually collect the ESG actions reported by listed companies and derive ESG scores for each company from this information. Both data providers cover the same environmental issues, such as emissions, water, waste, resource reduction, biodiversity, and the environmental impact of a company’s products and services.
The Refinitiv dataset comprises over 850 binary datapoints, linked to facets of sustainability reporting; over 250 ESG ‘Key Performance Indicators’ (KPIs) are compiled from these datapoints. These KPIs are then integrated into 18 ‘category scores,’ which are sub-components of the so-called ‘pillars,’ which represent the economic, environmental, social, and corporate governance aspects of company’s performance. A score between 0 and 100 can be assigned to each pillar: a high score in this category implies a strong performance compared to all graded organizations, with low scores indicating relatively poor performance. All scores are normalized using z-scoring and benchmarked against the entire universe of companies, according to Refinitiv’s dataset.
Refinitiv’s classification system covers about 72 thousand public companies and 2.4 million private ones, grouping them into 154 industries in terms of the Business Classification (TRBC). TRBC differs from standard industrial classifications of companies (for example, the NACE or NAICS systems), which focus on the product that companies pro-duce. TRBC also considers the markets where these products are sold. For example, a company that supplies snacks for aircraft passengers would be classified as a restaurant business in the standard classification, whereas, in TRBC, it would belong to services to aviation. The large knowledge-intensive business services (KIBS) sectors examined in the current study serve a wide range of business clients; this means that there will be little difference in practice.
Bloomberg similarly combines more than 100 ESG datapoints to yield a ‘Total ESG Disclosure Score’, combining the environmental, social, and governance disclosure scores. Bloomberg adjusts scores to different business sectors, to evaluate each company on datapoints that are relevant to its industry. The disclosure scores vary from 0.1 for companies revealing few datapoints to 100 for organizations who disclose every sustainability-related datapoint.
However, there are some significant differences, with only Refintiv covering data on animal testing, whereas only Bloomberg considers whether a company’s practices are compliant with environmental rules. In addition, Bloomberg’s ESG disclosure scores only indicate how transparent a company is in terms of such non-financial reporting. The Refinitiv Eikon database aims to focus not only on data availability, but also on capturing the involved activities [67].
A comprehensive comparison of Bloomberg and Refinitiv datasets by Dorfleitner et al. (2015) [67] provides results that serve as arguments to choose the Refinitiv ESG dataset rather than that of Bloomberg. Although a positive correlation can be observed between the two datasets (for both ESG total scores and sub-criteria, the correlation is around 50%), the variability of Refinitiv scores measured by standard deviations is higher, as this rater’s scoring model involves a larger database. The Refinitiv scores also fluctuate less from year to year, which reflects fewer changes in the valuation approach and the rated universe on a yearly basis.
There is support for the reliability of Refinitiv ESG ratings in terms of environmental performance measurement [68,69]. Semenova and Hassel (2015) [69] show that Refinitiv’s ESG rating consistently captures the environmental performance (EP) of companies and presents it in a comparable manner. One recent study [68] acknowledge the transparency in the institutionalized and complex reporting on a company’s sustainability actions accounted for by Refinitiv’s methodology, and its wide use among scholars and investors. Furthermore, Refinitiv’s ESG dataset has a high level of recognition among experts from the project Rate of Raters and is widely used in the existing literature as an environmental and sustainable performance metric [70,71,72,73]. Of the two databases described in detail above, it is reasonable to use Refinitiv for our study, given its larger data basis, more stable yearly scores and consistency regarding the available data on a company’s environmental performance.
3.2. Company Web Pages as an Information Source for Carbon Emission Practices
As online communication with clients has expanded (cf. [74]), business web pages have become popular instruments for firms seeking to attract potential customers and keep their current ones [75]. Companies use websites to improve their reputation and strengthen their relationships with stakeholders, customers and the public [76]. Websites can thus provide customers, investors or suppliers with information relevant to a wide range of topics: from the values a firm professes and the main products it supplies to actual data on finances, employment, etc. [77,78]. Thus, business website information is widely employed as a source of competitive intelligence (see for example [79,80]). It can also be applied in social research, as noted in modern methodology guides (for example, see the chapter “e-Research: Internet Research Methods” in Bryman (2012) [81]). This makes websites another source of information for matching ESG disclosure and performance regarding climate change and company’s effort for net-zero greenhouse gas emissions.
Both for service firms in general and for DBS in particular, brand and reputation are important assets. Such companies usually try to leverage their brands through their websites [82]. Hence, business web pages may be used as a source of information on such firms [83]. One example of an analysis of business services firms through corporate websites is Pina, Tether (2016) [84], who note that web pages are a public source of information, providing insights into the firm’s identity, activity and strategy. Of course, websites are often partial sources of information, and small companies may not have enough resources to regularly update their websites. There are many reasons why companies may be cautious about presenting information—for example, they may restrict information concerning intellectual property that is still in development [85], or confidential discussions concerning acquisitions, mergers and other business matters. Another limit to website analysis can be referred to as a “greenwashing” problem, a type of misleading communication intended to positively influence stakeholders and customers through the selective disclosure of a company’s environmental performance (for example, see [86,87]).
Large global corporations tend to disclose large volumes of information to attract different customers. Specifically, these companies pay more attention to ESG disclosure [88]. To support this statement, we can mention the work of Ertem-Eray (2020) [89], which applies website content analysis to investigation of ESG responsibility in large US companies. We can also refer to the abovementioned work [67], which points out the significant and positive correlation between companies’ ESG disclosure (Bloomberg ESG disclosure score) and their market capitalization.
3.3. Sampling Steps
This study focuses on globally traded DBS companies with high market capitalization, examining cases with ESG Score Grades at or above B- on the basis of Refinitiv’s TRBC. For digital consulting services, these industries are used: Professional Information Services and Business Support Services (including Corporate Accounting Services, Legal Services and Management Consulting Services activities). For the second type of DBS, we use only one sector: Advertising and Marketing, which includes Market Research and Market Consulting Services activities. For the technology-driven ICT DBS, the two selected industries were IT Services and Consulting (including Cloud Computing Services activities), and Software (including Application Software and Enterprise Software activities).
Not all the abovementioned sectors are strictly connected to the digital sphere, since not all of them are inherently digital (e. g., Business Support Services or Advertising and Marketing). However, while many of the firms that belong to these industries are long-established and still in the process of digitalization, the world-leading companies featured in the Refinitiv dataset are all firms that have made substantial investments in new digital systems, as a significant part of their business is dedicated to digital services, an integral part of the modern business space.
At the next stage of the study, we sorted the companies whose activities correspond to the abovementioned areas (for more information, see [90]) by their current market capitalization in Refinitiv. In each area, the 17 companies with the highest market capitalization who had a relatively high ESG performance (in comparison to their industry peers) were identified. This was accomplished by using the firm’s ESG score according to Refinitiv, which reflects the company’s ESG performance, commitment and effectiveness based on publicly reported information. Refinitiv also grades each company’s ESG score from “D” (lowest) to “A” (highest); we used only companies scoring above grade C (in other words, companies with a percentile of 50% or less, as each grade stands for a relative comparison with all other companies within the industry and can also be described as the company’s ESG rank).
Consideration of the highest ESG-performing companies may be questionable, as such an approach implies limited analysis, but is necessary, as higher ESG scores mean higher data availability. Analyzing low-ranked companies leads to significant gaps in ESG variables, as ESG disclosure is an important component of the Refinitiv total ESG score. Therefore, by considering the top ESG-performing companies we allow ourselves to conduct more comprehensive research, including more ESG parameters. The modern literature on social surveys and data collection supports the choice of a non-random sample (see [91,92]). In addition, we extracted textual information on ESG strategy and plans for future ESG development from the website of each observed firm. Thus, we collect information about the company’s practices based on the following criteria:
- Availability of an English-language version of the website (for this reason, we could not examine some top Chinese companies).
- Mentioning ESG-related terms (“ESG”, “CSR”, “corporate responsibility”, etc.) in different parts of the English versions of the websites (the main page, specific website sections on sustainable development and emission reduction goals, etc.).
- Environmental disclosures published in texts such as:
- Annual reports;
- Corporate social responsibility or sustainability reports;
- ESG releases;
- Corporate Governance reports.
The list of companies is given in Table 1 (the descriptive statistics of our sample are given in Appendix A). All 17 selected companies have a positive ESG score grade (at least “B”, which indicates good relative ESG performance and above average degree of transparency in publicly reporting material ESG data; combined A and B scores cover the top 50% of companies in one industry). Thus, these are the top companies in their industries (ESG Scores from Refinitiv, 2020).

Table 1.
Sample characteristics.
4. Results
The results of the data analysis are organized into three key categories, moving from statements of principle, through to the ambitions, to the actual steps being taken. We start with systemizing emission and resource-use-related policies in the areas that are most relevant for DBS. Then, we move to the presentation of companies’ targets, including an exploration of their CO2 emissions structure and the established goals for a reduction in these emissions, including the increase in the use of renewable energy. Finally, we explore the actual emissions-related, resource-use-related and innovation-related steps being taken, trying to illustrate Refinitiv’s quantitative data with a description of the examples taken from company websites.
4.1. Policies
Policies—statements concerning environmental goals—are the most general of the three categories. Indeed, the Refinitiv data show that all considered companies have elaborated specific environment-related policies in at least four key areas: energy efficiency, resource reduction, emissions and supply chain management (see Table 2).
Table 2.
The share of companies implementing environment-related policies.
Although DBS are not generally particularly energy- or resource-intensive, and are similarly not liable to be major sources of emission, these firms can still see scope for improving their operational energy efficiency, reducing their use of natural resources, and measuring and limiting the associated environmental impacts. Furthermore, they are extending the scope of their environmental impact assessment to the whole supply chain. This essentially states an intention to acquire data on their suppliers’ environmental footprints, so that corresponding environment-related criteria can inform supply chain management decisions.
Specifying such policies may be easier than taking further steps, as in the following two categories that we examine. However, it can be argued that this is a first step that needs to be taken to consolidate commitment to more substantive—and often more costly—steps. The finding that policies have been articulated regarding the companies’ own energy and resources use, their emissions, and the corresponding features of their supply chains, is encouraging—so what about the further steps?
4.2. Targets
Targets are more specific than the ambitions expressed in policies. They involve particular criteria, and ambitions to achieve (at least) a given level of performance in terms of the associated metrics, within a particular timeframe. For Climate Change concerns, the targets may be expressed in terms of overall energy use, use of fossil-fuel-derived energy, or, more directly, in terms of the GGEs connected with the firms’ activities.
The Refinitiv database only provides data on CO2 emissions for approximately half of the companies being considered (Figure 1). Furthermore, firms’ data for 2020, displayed here, often diverge quite substantially from the equivalent figures for 2019. Whether this is due to changes in methodology, changes associated with the pandemic, or more fundamental shifts in business practice, is far from clear. However, some general features are apparent. For all firms, Scope 1 emissions are the lowest—typically about 5–10% of the total emissions. In all cases, the lion’s share of emissions emerges from Scope 2 and Scope 3. In most cases, the distribution between these two is highly skewed: Scope 2 dominates for some companies (e.g., IBM, Nielsen, Oracle, RelX, Thomson Reuters), while for others most emissions are reported under Scope 3 (Accenture, Adobe, Publicis). Microsoft displays rather similar levels of emissions for Scope 2 and Scope 3—but the figures for 2019, where Scope 2 predominates, are very different (the Scope 1 figures change relatively little, but Scopes 2, and especially 3, differ considerably). Obtaining data for more companies is important, but this suggests that future work will also require a more consistent methodology.
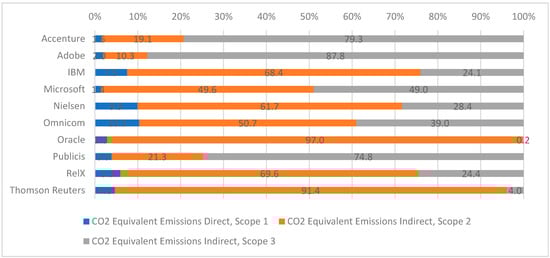
Figure 1.
Structure of CO2 (or equivalent) emissions among Scopes 1–3 in 2020 financial year. Source: Refinitiv database, authors’ calculations.
ESG data as processed by Refinitiv indicate that emissions targets are the most common strategic goals that are specified—with 88.3% of companies from our sample supporting them. Targets either for resource reduction or energy efficiency are somewhat less prevalent (about 71% of the firms propose these). Table 3 systematizes information on emissions targets (including plans for renewable energy usage). Most companies are planning to become net-zero; some of them further specify that they are targeting not just their own practices, but also those of their supply chain. In addition, some of them have already switched to renewable energy use, and others mostly aim towards a complete shift to renewable sources.
Table 3.
Companies’ emissions and renewable energy targets.
The firms have fleshed out their policy goals, at least in part, by setting themselves ambitious targets. Some of these are directly comparable; however, overall, there is such variety across important details making it difficult to compare timescales and extent of ambition. A more standardized roadmapping framework could both aid a comparison of companies, and provide a context within which actions and planned actions could be located and related. Until such a system is available and implemented, we can only examine those actions that have already been announced; while, in some cases, these may evidently help to achieve the targets, in other cases, this is inconclusive.
4.3. Actions Undertaken
Actions speak louder than words, and Refinitiv data enable us to examine three types of actions among firms in our sample, related to overall emissions, resource use and innovations. While not all of these actions are focused on energy use and GGEs, all three have implications for energy use, and are therefore reviewed here. Table 4 summarizes the results of our analysis of Refinitiv data and, subsequently, we will provide more context concerning its contents and try to illustrate these actions by the examples taken from companies’ websites. (The authors have no connections with the companies discussed. All the information presented here is derived from publicly available sources. The aim is to illustrate the range of actions that were undertaken by presenting some real examples. The discussion is not a comprehensive listing of all actions that have been located; instead, we attempt to represent all companies to approximately the same extent, despite some companies presenting more information than others.)
Table 4.
Companies reporting different actions in the financial year 2020.
It is apparent from Table 4 that some types of action are very prevalent, notably efforts to reduce waste and staff transport-related emissions, and initiatives to monitor and manage supply chains, which are universal in our sample. A focus on e-waste and the use of renewables is displayed by more than 4/5ths of the sample, green buildings by more than three quarters, and efforts to render products, and their use, more environmentally sustainable by more than two-thirds of the firms. Just under two-thirds undertake environmental restoration initiatives, just under half aim to minimize the product impacts, and only two firms have introduced a service specifically aimed at renewable/clean energy. We briefly explore the content of these various activities in the following discussion.
4.3.1. Emission-Related Actions
In the financial year 2020, all of the considered companies reported taking some initiatives to reduce their total waste. For example, Nielsen reduces the consumption of paper by using reusable mugs instead of paper cups, while FTI Consulting calculated that the installation of bottle filter stations in the offices allows the company to reduce annual landfill waste by up to 100,000 plastic bottles per annum. Although this impressive-sounding figure may seem trivial compared to the overall quantity of plastic entering the environment (research shows that 12 million tonnes of plastic are deposited into oceans annually [94,95]), such actions may constitute significant reductions in the waste that is directly generated by these DBS. About 80% of companies also reported actions aimed specifically at reducing e-waste, i.e., waste involving electrical and electronic equipment (computers, batteries, printers, toner cartridges, etc.). For example, Nielsen reported that cooperation with specialists in the recycling and reuse of such equipment allowed them to avert over 50 thousand metric tons of CO2 in 2019–2020.
As would be anticipated for a DBS who assists other businesses with their digitalization practices, these companies frequently seek to reduce their emissions by implementing digital solutions in their daily operations. Knowledge-intensive companies are reliant on their expert professional employees interacting with each other and with clients and business partners. They have considerable scope to make greater use of digital communications and reduce the overall environmental impact associated with the transport of staff to workplaces and other venues. These actions may be significant for professional service companies, for many of whom business travel emissions constitute the largest part of Scope 3 emissions related to the company’s own operations (see, for example, GHG Emissions Methodology by FTI Consulting [96]. Indeed, some actions to reduce the environmental impact caused by staff transportation are undertaken by all companies from our sample. However, the particular approaches that are pursued may be quite different.
Many companies declare that they encourage the usage of various digital communication and collaboration tools, and promote moving to virtual events where possible. Omnicom highlights that the COVID-19 pandemic significantly boosted this shift to remote working and communication; the firm expects the various digital tools employed here to be widely used beyond the pandemic. However, not all business trips can be avoided; companies can then act to reduce or at least compensate for the environmental impacts. Some companies, such as S&P or WPP, purchase carbon offsets to compensate for emissions from business travel. Some companies seek to change the way their employees travel, for example, by charging internal carbon fees (RELX, SAP). Another strategy is to cooperate with specific travel suppliers using sustainable practices (Nielsen), for example, air transport firms who use sustainable fuel (Microsoft). As well as business trips, some companies implement programs to change employees’ transit from home to the office. SAP thus provides special subsidy programs for bicycles and electric vehicles. The former supports those employees who want to hire a bicycle and provides them with the opportunity to purchase these after three years. The latter refers to subsidies for batteries and the installation of charging points at home, incentivizing employees’ transition to high-cost electric vehicles. Forrester has invested in charging stations at its headquarters.
The actions described here should all contribute to reduced GHG emissions, although it is difficult to assess how extensively they contribute to the companies reaching the targets that are outlined above. Other types of emission-related action, such as emissions trading or proactive future-oriented environmental investments, are still not widely undertaken by the companies from our sample. One type of initiative that is not strictly a matter of emission-reduction, but that can be aimed at the reduction in atmospheric GHGs, is fairly widely adopted. This involves efforts towards environmental restoration, remediation or rehabilitation. One of the most popular examples of such an initiative is developing forest areas—these are typically considered to naturally sequester carbon. Thus, one of Omnicom’s agencies in 2020 created a special ‘agency forest’ by planting a sapling for each of its worldwide employees. Accenture focuses on reforesting land with native species, and SAP planned to plant 5 million trees in 2018–2025. A different type of initiative is undertaken by Microsoft, which has established a USD 1bn Climate Innovation Fund, to focus on the development of carbon reduction and removal solutions.
4.3.2. Actions Related to Resource Use
A range of initiatives aimed at reducing resource use—including energy use—are widely adopted by companies from our sample. One of the most popular of these reported, by about 90% of companies, is the effort to use renewable energy. However, the actual scope of its usage varies significantly: some companies are just at the beginning of the transition to renewable sources, while others are already making extensive use of such sources. For example, Tata and Omnicom reported just 10% and 19%, respectively, of the energy used as being sourced from renewable sources, while Oracle or IBM reported that about 60% of the electricity used for their cloud data centers was sourced from renewable sources. Many companies reported that at least some of their offices were fully powered using renewable sources. The issue of just what the companies consider to be renewable sources requires further investigation, and of course, there can is debate about the use of biofuels and nuclear power.
The most frequently reported renewable energy source is solar energy (e.g., Photovoltaic panels in the Microsoft campus in Silicon Valley and, Solar Rooftop systems in Tata and Adobe’s Lehi offices). However, there are also some examples of the usage of other renewable energy sources, such as hydropower (Microsoft) or wind energy (Nielsen). While all means of generating energy involve some use of materials and land, and some of these are more problematic than others, only the use of biomass (IBM) as a power source has renewable criteria that are often challenged, and the even more controversial nuclear power option is not mentioned by the firms.
In addition, over 70% of companies reported efforts to develop environmentally friendly or “green” offices. Most companies try to ensure that their buildings (at least those that are newly constructed or leased) are in line with specific internationally recognized green building standards such, as LEED [97] or BREEAM [98]. The most popular features of green building solutions include energy-efficient lighting and cooling/heating systems. For instance, Nielsen reported that the implementation of light-emitting diode (LED) lighting solutions in its offices allowed for the company to reduce electricity consumption in 2020 by almost 176,000 kWh, while the implementation of modern Heating, Ventilation, and Air Conditioning (HVAC) systems allowed for a reduction in energy consumption of about 2.8 million kWh.
Another important approach, allowing companies to not only replace their real estate portfolios with new green facilities but also to reduce extra waste, is the optimization of office space. For example, WPP reports specifically closing small sites and moving to large modern campuses. Other actions that can reduce the office space used and, thus, the related costs (electricity, heating, etc.) include the virtualization of server infrastructure and shifting to cloud solutions (these are mentioned by FTI Consulting, Interpublic, and Nielsen). Evidently, the shift to remote and digital work can also have a role to play here.
Almost all of the companies from our sample report engaging in both environmental monitoring and management of their supply chain. Monitoring may involve conducting surveys on, or seeking audits of, the environmental performance of suppliers. Management approaches here involve implementation of environmental criteria in the process of selection of partners and suppliers.
These actions are specifically important for those companies who have already set targets to become carbon neutral across their supply chain, since the emissions by suppliers may constitute a large portion of the company’s total emissions. For example, S&P has estimated that about two-thirds of its total greenhouse gases emissions come from its top 50 suppliers: the inclusion of environmental criteria in the procurement processes is crucial. Actions focused on the assessment and proactive engagement of the suppliers in the reduction in carbon emissions are highlighted by many companies in our sample. Thus, in 2020, Microsoft updated its Supplier Code of Conduct, and improved its supplier emissions’ data tracking; WPP requested carbon data from core vendors and developed a ‘media channel-level’ calculator to evaluate the emissions from all content they produce. Publicis has developed a special sustainable supply-chain platform P.A.S.S for suppliers’ self-assessment to support its own internal CSR evaluation tool. Those who refuse to participate are automatically excluded from the supply chain.
Again, we can see numerous cases of companies acting in ways that support more sustainable business practices, both in their own actions and in their supply chains. Without belittling these actions, it should be noted that they vary considerably in the extent of their likely impact and, in several cases, are really only first steps towards zero emissions—which suggests that even these above-average companies still have a great deal of ground to make up in the next decade.
4.3.3. Innovation-Related Actions
Table 4 shows that about 2/3 of companies from our sample reported developing, or seeking to develop, products or services intended to have positive, or reduce negative, environmental effects (including noise and other pollution, as well as energy use, etc.). IT-related companies often suggest that the use of their services may help their clients to reduce their energy consumption and carbon footprint. Microsoft has even introduced a specific Sustainability Calculator, which estimates the reduction in clients’ emissions due to the use of its cloud services. Adobe estimates that the use of Adobe Sign for a million transactions can reduce the annual emissions from 2300 cars. By moving to a paperless digital workflow in this way, one of their clients is reported to have saved more than 9 million sheets of paper and about 1 million gallons of water by using this digital solution. Zoom also estimates that, in 2020, during the pandemic the use of its platform for remote working not only supported people’s safety, but helped to reduce emissions by more than 55 million metric tons of CO2.
Another set of products and services may not directly reduce negative environmental effects, but could provide clients with insights, methods and even consultancy to support their path towards sustainable and eco-friendly development. One example of such services is the FTI Consulting’s development of frameworks for the qualitative and quantitative assessment of climate-related risks, opportunities and economic impacts. Other specific services concern the more efficient use of resources, based on the evaluation of impacts in areas such as electricity use (SAP) or company travel (Salesforce).
About half of the companies also reported having designed some features of their products and services so that they could be used in more eco-friendly ways. For example, Microsoft (which is responsible for some hardware, as well as software and other services) aims to increase its products’ energy efficiency, implementing some solutions in both its devices (e.g., a new power mode for Xbox to reduce its energy use) and software (Windows Software Sustainability Initiative). IBM reported work on more sustainable packaging and logistics for its products; Oracle reported taking energy efficiency and recyclability into consideration while designing its hardware solutions. Environmentally related services are provided by Publicis, who developed A.L.I.C.E (Advertising Limiting Impacts and Carbon Emissions), an online platform for simulating possible carbon emissions when using different options for clients’ projects or campaigns.
The innovation-related actions are probably those whose impact is the hardest to assess, because the success of these innovation efforts is never guaranteed. Nevertheless, these actions hold great promise for the wider transformation of business practices, and the topic of pro-environmental innovation is rightly attracting much attention. It should be noted that some of the innovations outlined here are aimed at the DBS customers as much as the firms themselves, which suggests prospects for economy-wide transformation.
4.3.4. Actions Reviewed
All DBS firms can develop policies and targets of some kind. Indeed, it is difficult to imagine that well-functioning businesses in any sector cannot develop any kind of plan or targets. Of course, the process of developing completely new goals and targets, if seriously undertaken, can be very time-consuming; therefore, on occasion, analysts may have to wait for a firm to make announcements concerning its new orientation.) This section has shown that more concrete activities are also being undertaken by all of the DBS firms whose ESG performance is considered to be above-average. Most of the actions considered above are pursued by more than half of the firms, some—by all of them. Activities concerning the firms’ own processes and, in many cases, those of their supply chains, are most prevalent; changes in their products/services and their patterns of usage, appear to be more difficult to achieve.
It is interesting that environmental remediation is neglected by a third of firms—a possible explanation for this is that remediation is liable to be seen as just an example of charitably “doing good”. This might be investigated further, for example, by considering whether remediation investments are related to the businesses’ own impacts on land use, or to the use of its products. For example, if they are historically related to paper consumption, then investing in forest renewable may be seen as a measure of atonement.
Finally, we should reiterate that assessing how far these actions will concretely contribute to the companies meeting their targets, and thus the achievement of their ambitious goals, is problematic. Further analysis—and evidence—is required for a thorough examination of the roadmaps implicit in the companies’ practices.
5. Conclusions
Digital Business Services may not be the most obvious targets for efforts to increase the sustainability of our economies. With the exception of the large computer installations operated by some of the ICT firms included in this study, these are not often seen as major users of energy or producers of GHGs and other pollutants. However, these leaders in the industry demonstrate that substantial efforts to transform their own businesses—and often those of their supply chains—are underway. The sorts of strategies depicted in the preceding sections can be used to inspire other firms in DBS sectors. They demonstrate the scope for DBS of all kinds—or at least, for larger firms in the industry—to plan, set targets, and act in more sustainable ways. Since these are above-average firms, their examples may be deployed to place pressure on other businesses. Some of the pressure to which the firms we have studied are responding may come from having to comply with current regulations, with companies acting on the basis of expectations of future regulations. Some of the pressure may come from their own users demanding evidence for their own supply chain management and/or ethical imperatives. This driver may be most important for the ICT firms. Finally, knowledge-intensive firms may also face pressure from their own staff, since environmental concerns are typically stronger among people in higher status occupations and with greater educational levels [99]. A total of 73% impact investors used United Nations Sustainable Development Goals, meanwhile only 9% of them had Sustainability Accounting Standards Boards as an impact measurement and management system [100]. In this context, appointing people with a sense of responsibility for environmental issues may help consolidate such internal sources of pressure. For example, the U.S. Bureau of Labor Statistics [101] expected 9400 positions to open for environmental scientists and specialists on an annual basis by 2030.
Our results should help policy makers further develop their roadmaps for targeting reductions in carbon emissions, considering the roles which DBS might play. These include not only the footprint of these businesses themselves, but also their contributions to the dissemination of environmental knowledge and practice, and the effective establishment of carbon pricing rates by providing actions to decrease the impacts of Scope 3. These practices also provide the basis for initiatives in climate-related taxation of businesses; this could consider not only their own practices for sustainable development in production processes, but also their strategies for shaping client and supply chains’ GHG emissions (and other environmental activities) in greener directions. Finally, the shift towards the use of renewable energy and financing of eco-innovation initiatives should promote favorable financial conditions for reducing environmental footprints and execute other objectives expressed by corporate social responsibility commitments. Our research is related to a variety of qualitative and case-study papers that explore how industries, as well as certain companies, use environment practices, and how these drive their development —for example, the pharmaceutical industry [102], banks [103], petrochemicals [104], brewery [105] and other industries (for example, [106]).
We cannot immediately deduce from these data how far these efforts are liable to really move the industries into a net-zero position within a specific common timescale. To do this would require a much closer inspection of the claims and practices of the firms involved. However, it is clear that these leading firms are being pushed to take the climate crisis seriously, and to demonstrate that they are responding to this in multiple ways. Furthermore, other environmental concerns are also addressed by many firms, which makes sense in terms of a serious commitment to CSR.
This study has some limitations that point to directions for further research. Perhaps the most obvious limitation stems from the selection of our sample. It concerns large companies: a systematic study of smaller companies would be valuable. These are typically well-established companies, and the sample thus demonstrates the scope for firms to reconfigure themselves in more sustainable directions. There are many knowledge-intensive business service companies that were founded in order to promote more sustainable businesses— “green” consulting, marketing, design, engineering services, etc. Such businesses are often relatively niche, newer firms, and usually smaller businesses; they deserve specific attention in their own right, and their relations (competitive and as business partners) with the sorts of firm we have studied would be particularly valuable: what are the knowledge flows between the different types of business?
Our sample focuses, furthermore, on the firms in each industry who are performing at above average levels of ESG. Clearly, the remainder of the sectors would be important to examine—the below-average firms will have much to accomplish in order to achieve sustainability, as Magazzino et al. (2021) [107] suggest. It will be valuable to explore the factors that have impeded their shifts in this direction, and how these can be overcome. Another question is how far does their inferior performance reflect a relative decline in all of the categories of environmental practice discussed here— another way of putting this is to ask which of the activities appear to be more “optional” or less readily adopted? Another obvious limitation in this study is the attention only to English-language sources: how similar would the results be if other languages are examined?
The data we use are limited, and additional sources of material may be required to present a rounded view. Researchers using information derived from the web pages of companies must concede that, since these are aimed at attracting new customers and investors [108], they are likely to elide less praiseworthy aspects of their behavior. Therefore, the materials derived from such sources can reflect only the positive aspects of the companies’ policies, which may lead to an overrepresentation of “good news”. For a more complete view, it will be necessary to develop methods of systematically sampling news media and the work of independent auditors and campaign groups. Such analysis may well conclude that even these above-average DBS firms have further to go in terms of meeting the GGE and other environmental challenges than the website analysis suggests.
Finally, our data consider the practices of the DBS firms: what about their impact on their clients? DBS businesses play important roles across the economy, providing advice, intelligence, and support with business processes to private and public sector organizations across the economy. These roles have been growing in scale over recent decades, and they are widely seen as important in shaping the orientations of knowledge-intensive clients [109]. Thus, we might anticipate that DBS that take environmental considerations seriously— which will be evidenced through their own practice—will embed this commitment within their services. We saw cases of new, pro-environment services being introduced, but a steer toward sustainability can be more or less manifest across a wide range of DBS activities and relations with their clients. An important topic for further research is how, and how far, these service firms are supporting their clients in the transition to more sustainable business operations.
A last point to note is that, even with its limitations, the study indicates that many of the elements of policy, targets, and activity for sustainability are only partly addressed— even by better-performing firms in DBS. There is clearly scope for more effort here. Industries that portray themselves as forward-looking and responsible clearly have commensurate obligations to be at the forefront of climate action and the move to net zero. This is not merely a matter of fashion: it is one of survival, according to reputable climate scientists. DBS should be encouraged to play a leading role in this transition.
Author Contributions
Conceptualization, V.B. and I.M.; investigation, O.B., N.C. and D.L.; methodology, V.B. and I.M.; project administration, V.B.; supervision, V.B. and I.M.; validation, V.B., O.B., N.C., D.L. and I.M.; writing—original draft, V.B., O.B., N.C., D.L. and I.M.; writing—review and editing, V.B., O.B. and I.M. All authors have read and agreed to the published version of the manuscript.
Funding
The article is based on the study funded by the Basic Research Program of the HSE University.
Institutional Review Board Statement
Not applicable.
Informed Consent Statement
Not applicable.
Data Availability Statement
Not applicable.
Acknowledgments
We thank Zhaklin Krayushkina (Geneva Finance Research Institute, Geneva School of Economics and Management, University of Geneva, and Unit for Intellectual Services Market Research, Institute for Statistical Studies and Economics of Knowledge (HSE ISSEK)) for gathering the information on corporate ESG practices from companies’ web pages.
Conflicts of Interest
The authors declare no conflict of interest.
Appendix A. Descriptive Statistics
Table A1.
Descriptive statistics.
Table A1.
Descriptive statistics.
| Descriptive Statistics | Company Market Capitalization (bn USD) | Number of Employees | ESG Score | ESG Score among Peers |
|---|---|---|---|---|
| Mean | 113.03 | 144,222.41 | 74.40 | 54.74 |
| Std. Dev | 102.70 | 185,175.55 | 12.72 | 6.04 |
| Min value | 5.20 | 6690.00 | 53.99 | 45.81 |
| Max value | 271.00 | 624,000.00 | 93.45 | 69.80 |
References
- World Economic Forum. The Global Risks Report 2022, 17th ed. Insight Report. 2022. Available online: https://www.weforum.org/reports/global-risks-report-2022 (accessed on 1 February 2022).
- World Bank. Pricing Carbon. 2020. Available online: https://www.worldbank.org/en/programs/pricing-carbon (accessed on 1 February 2022).
- Bloomberg. How the World’s First Carbon Border Tax May Play Out. 2021. Available online: https://www.bloomberg.com/news/articles/2021-07-15/how-the-world-s-first-carbon-border-tax-may-play-out (accessed on 1 February 2022).
- BCG. The EU’s Carbon Border Tax Will Redefine Global Value Chains. 2021. Available online: https://www.bcg.com/publications/2021/eu-carbon-border-tax (accessed on 1 February 2022).
- Global Goals. 2022. Available online: https://www.globalgoals.org/ (accessed on 1 February 2022).
- PwC. PwC’s SDG Challenge 2019. 2019. Available online: https://www.pwc.com/gx/en/services/sustainability/sustainable-development-goals/sdg-challenge-2019.html (accessed on 1 February 2022).
- EY. Top 10 Business Risks and Opportunities for Mining and Metals in 2022. 2021. Available online: https://www.ey.com/en_gl/mining-metals/top-10-business-risks-and-opportunities-for-mining-and-metals-in-2022 (accessed on 1 February 2022).
- UN News. 2021. Available online: https://news.un.org/en/story/2021/11/1104812 (accessed on 1 February 2022).
- About the PRI. Available online: https://www.unpri.org/pri/about-the-pri (accessed on 1 February 2022).
- Goldman Sachs. Goldman Sachs Environmental Policy: 2006 Year-End Report. 2006. Available online: https://www.goldmansachs.com/citizenship/sustainability-reporting/env-report-2006.pdf (accessed on 1 February 2022).
- Wieczorek-Kosmala, M.; Marquardt, D.; Kurpanik, J. Drivers of Sustainable Performance in European Energy Sector. Energies 2021, 14, 7055. [Google Scholar] [CrossRef]
- Gao, S.; Meng, F.; Gu, Z.; Liu, Z.; Farrukh, M. Mapping and Clustering Analysis on Environmental, Social and Governance Field a Bibliometric Analysis Using Scopus. Sustainability 2021, 13, 7304. [Google Scholar] [CrossRef]
- Asia-Pacific Research Exchange. Towards Investor-Oriented Carbon Targets Data. 2021. Available online: https://www.arx.cfa/-/media/regional/arx/post-pdf/2021/11/23/towards-investor-oriented-carbon-targets-data.pdf?sc_lang=en&hash=DCAFB2AB1C4B48E13F3E365CC5799436 (accessed on 1 February 2022).
- Task Force on Climate-related Financial Disclosures. 2022. Available online: https://www.fsb-tcfd.org/ (accessed on 1 February 2022).
- Netzero Carbon. Largest UK Companies Required by Law to Disclose Climate Risks from April 2022. 2021. Available online: https://netzerocarbon.com/news/largest-uk-companies-required-by-law-to-disclose-climate-risks-from-april-2022/ (accessed on 1 February 2022).
- Guardian. Banks ‘Being Let Off Hook by Weak Climate Regulation’. 2021. Available online: https://www.theguardian.com/business/2021/nov/02/bank-of-england-under-fire-over-climate-stress-tests (accessed on 11 January 2022).
- Financial Times. Bank of England Considers Capital Rules for Banks to Cover Climate Risks. 2021. Available online: https://www.ft.com/content/2b853165-7f42-4790-8506-e12eb915cf36 (accessed on 1 April 2021).
- Bloomberg. Green Investment Frenzy Runs Risk of Becoming a Bubble. BIS Says. 2021. Available online: https://www.bloomberg.com/news/articles/2021-09-20/green-investment-frenzy-runs-risk-of-becoming-a-bubble-bis-says (accessed on 1 February 2022).
- Bank for International Settlements. BIS Quarterly Review. International Banking and Financial Market Developments. Bank for International Settlements. September 2021. Available online: https://www.bis.org/publ/qtrpdf/r_qt2109.pdf (accessed on 1 February 2022).
- Consultancy.uk. Demand for Sustainable Finance Services Outweighs Supply. 2021. Available online: https://www.consultancy.uk/news/29670/demand-for-sustainable-finance-services-outweighs-supply (accessed on 1 February 2022).
- Global Reporting Initiative. 2022. Available online: https://www.globalreporting.org/ (accessed on 1 February 2022).
- S&P Global. What Is the Impact of the EU Sustainable Finance Disclosure Regulation (SFDR)? 2021. Available online: https://www.spglobal.com/marketintelligence/en/news-insights/blog/what-is-the-impact-of-the-eu-sustainable-finance-disclosure-regulation-sfdr (accessed on 1 February 2022).
- Accenture. Energizing Industry. 2021. Available online: https://www.accenture.com/_acnmedia/PDF-147/Accenture-Energizing-Industry-Through-European-Industrial-Decarbonization-Full-Report.pdf (accessed on 1 February 2022).
- Corporate Value Chain (Scope 3) Standard. 2022. Available online: https://ghgprotocol.org/standards/scope-3-standard (accessed on 1 February 2022).
- Carbon Development Project. Finance Sector’s Funded Emissions over 700 Times Greater than Its Own. 2021. Available online: https://www.cdp.net/en/articles/media/finance-sectors-funded-emissions-over-700-times-greater-than-its-own (accessed on 1 February 2022).
- PwC. State of Climate Tech 2021. 2021. Available online: https://www.pwc.com/gx/en/services/sustainability/publications/state-of-climate-tech.html (accessed on 1 February 2022).
- The Science-Based Targets initiative. 2022. Available online: https://sciencebasedtargets.org/ (accessed on 1 February 2022).
- S&P Global. How Is COVID-19 Impacting the Energy Transition? 2020. Available online: https://www.spglobal.com/en/research-insights/featured/how-is-covid-19-impacting-the-energy-transition (accessed on 1 February 2022).
- Measuring Eco-innovation. 2008. Available online: https://cordis.europa.eu/project/id/44513/reporting (accessed on 1 February 2022).
- Carroll, A.B. Corporate social responsibility: The centerpiece of competing and complementary frameworks. Organ. Dyn. 2015, 44, 87–96. [Google Scholar] [CrossRef]
- Latapí Agudelo, M.A.; Jóhannsdóttir, L.; Davídsdóttir, B. A literature review of the history and evolution of corporate social responsibility. Int. J. Corp. Soc. Responsib. 2019, 4, 1. [Google Scholar] [CrossRef] [Green Version]
- Farza, K.; Ftiti, Z.; Hlioui, Z.; Louhichi, W.; Omri, A. Does it pay to go green? The environmental innovation effect on corporate financial performance. J. Environ. Manag. 2021, 300, 113695. [Google Scholar] [CrossRef]
- van Emous, R.; Krušinskas, R.; Westerman, W. Carbon Emissions Reduction and Corporate Financial Performance: The Influence of Country-Level Characteristics. Energies 2021, 14, 6029. [Google Scholar] [CrossRef]
- El Khoury, R.; Nasrallah, N.; Alareeni, B. ESG and financial performance of banks in the MENAT region: Concavity–convexity patterns. J. Sustain. Financ. Investig. 2021, 1–25, in print. [Google Scholar] [CrossRef]
- Dangelico, R.M.; Pontrandolfo, P. Being ‘green and competitive’: The impact of environmental actions and collaborations on firm performance. Bus. Strategy Environ. 2015, 24, 413–430. [Google Scholar] [CrossRef]
- Friede, G.; Busch, T.; Bassen, A. ESG and financial performance: Aggregated evidence from more than 2000 empirical studies. J. Sustain. Financ. Investig. 2015, 5, 210–233. [Google Scholar] [CrossRef] [Green Version]
- Hang, M.; Geyer-Klingeberg, J.; Rathgeber, A.W. It is merely a matter of time: A meta-analysis of the causality between environmental performance and financial performance. Bus. Strategy Environ. 2019, 28, 257–273. [Google Scholar] [CrossRef]
- Shi, X.; Li, G.; Dong, C.; Yang, Y. Value Co-Creation Behavior in Green Supply Chains: An Empirical Study. Energies 2020, 13, 3902. [Google Scholar] [CrossRef]
- Chen, F.; Ngniatedema, T.; Li, S. A cross-country comparison of green initiatives, green performance and financial performance. Manag. Decis. 2018, 56, 1008–1032. [Google Scholar] [CrossRef]
- Klimontowicz, M.; Losa-Jonczyk, A.; Zacny, B. Banks’ Energy Behavior: Impacts of the Disparity in the Quality and Quantity of the Disclosures. Energies 2021, 14, 7325. [Google Scholar] [CrossRef]
- Miles, I. Transformations of Information Society. Chapter 4, Theme 1.24: Capital Resources, Issue IV: Global Transformations and World Futures: Knowledge, Economy and Society. In UNESCO Encyclopaedia of Life Support Systems; Inayatullah, S.T., Ed.; Eolss Publishers: Oxford, UK, 2002. [Google Scholar]
- Miles, I. From knowledge-intensive services to knowledge-intensive service systems. Int. J. Serv. Technol. Manag. 2011, 16, 141–159. [Google Scholar] [CrossRef]
- Miles, I.D.; Belousova, V.; Chichkanov, N. Knowledge intensive business services: Ambiguities and continuities. Foresight 2018, 20, 1–26. [Google Scholar] [CrossRef] [Green Version]
- Facts and Factors. Digital Transformation Consulting Market by Deployment Mode (on-Premises and Hosted), by Technology (Cloud Computing, AI, Big Data and Analytics, Mobility/Social Media, Cybersecurity, IoT, Blockchain and Robotics and Others), by Industry Vertical (BFSI, Healthcare, Telecom and IT, Manufacturing, Retail, Government and Others): Global Industry Perspective, Comprehensive Analysis, and Forecast, 2021–2026. 2021. Available online: https://www.fnfresearch.com/digital-transformation-consulting-market (accessed on 1 February 2022).
- Statista. Digital Advertising. 2021. Available online: https://www.statista.com/outlook/dmo/digital-advertising/worldwide?currency=USD (accessed on 29 January 2022).
- Statista. Advertising Revenue in the United States from 2012 to 2024. 2022. Available online: https://www.statista.com/statistics/236958/advertising-spending-in-the-us/ (accessed on 24 January 2022).
- WARC. Global Ad Trends: The Adspend Outlook. 2020. Available online: https://www.warc.com/content/paywall/article/Global_Ad_Trends_The_Adspend_Outlook/125445 (accessed on 24 January 2022).
- Statista. Change in Digital Marketing Spending and Traditional Advertising According to CMOs in the United States from 2012 to 2022. 2022. Available online: https://www.statista.com/statistics/693449/digital-vs-traditional-marketing-budget-change-according-to-cmos-usa/ (accessed on 11 January 2022).
- Statista. IT Consulting & Implementation Report. Statista Technology Market Outlook. October 2021. Available online: https://www.statista.com/study/84969/it-consulting-and-implementation-report/ (accessed on 24 January 2022).
- Statista. Global BI and Analytics Software Market Size 2019–2025. 2022. Available online: https://www.statista.com/statistics/590054/worldwide-business-analytics-software-vendor-market/ (accessed on 29 January 2022).
- Roberts, S.H.; Foran, B.D.; Axon, C.J.; Stamp, A.V. Is the service industry really low carbon? Energy, jobs and realistic country GHG emissions reductions. Appl. Energy 2021, 292, 116878. [Google Scholar] [CrossRef]
- Global e-Sustainability Initiative. ICT Solutions for 21st Century Challenges. 2015. Available online: https://smarter2030.gesi.org/downloads/Chapter_Environment.pdf (accessed on 1 February 2022).
- Freitag, C.; Berners-Lee, M.; Widdicks, K.; Knowles, B.; Blair, G.S.; Friday, A. The real climate and transformative impact of ICT: A critique of estimates, trends, and regulations. Patterns 2021, 2, 100340. [Google Scholar] [CrossRef]
- International Telecommunication Union. ICT Industry to Reduce Greenhouse Gas Emissions by 45 Percent by 2030. 2020. Available online: https://www.itu.int/en/mediacentre/Pages/PR04-2020-ICT-industry-to-reduce-greenhouse-gas-emissions-by-45-percent-by-2030.aspx (accessed on 1 February 2022).
- Freitag, C.; Berners-Lee, M.; Widdicks, K.; Knowles, B.; Blair, G.; Friday, A. The climate impact of ICT: A review of estimates, trends and regulations. arXiv 2021, arXiv:2102.02622. [Google Scholar]
- Xu, X.; Ström, P. The Transformative Roles of Knowledge-Intensive Business Services in Developing Green ICT: Evidence from Gothenburg, Sweden. In Services and the Green Economy; Palgrave Macmillan: London, UK, 2016; pp. 99–124. [Google Scholar] [CrossRef]
- EUR-Lex. Directive 2012/27/EU of the European Parliament and of the Council of 25 October 2012 on Energy Efficiency, Amending Directives 2009/125/EC and 2010/30/EU and Repealing Directives 2004/8/EC and 2006/32/EC. 2012. Available online: https://eur-lex.europa.eu/legal-content/EN/TXT/?uri=celex%3A32012L0027 (accessed on 1 February 2022).
- Weber, G.; Mateescu, R.M.; Lange, S.; Rauch, M. Knowledge intensive business services (KIBS) in the context of changing energy economics in Germany. Amfiteatru Econ. J. 2016, 18, 89–103. [Google Scholar]
- Strategy & PwC. ESG Professional Services. 2021. Available online: https://www.strategyand.pwc.com/de/en/unique-solutions/sustainable-impact-made-real/esg-professional-services.html (accessed on 1 February 2022).
- Carroll, A.B.; Brown, J.A. Corporate Social Responsibility: A Review of Current Concepts, Research, and Issues. Bus. Soc. 2018, 2, 39–69. [Google Scholar] [CrossRef]
- Carroll, A.B. Corporate Social Responsibility: Perspectives on the CSR Construct’s Development and Future. Bus. Soc. 2021, 60, 1258–1278. [Google Scholar] [CrossRef]
- Chandler, D.; Werther, W.B. Strategic Corporate Social Responsibility: Stakeholders, Globalization, and Sustainable Value Creation, 3rd ed.; SAGE Publications: Southend Oaks, CA, USA, 2013. [Google Scholar]
- Porter, M.E.; Kramer, M.R. Strategy and Society: The Link between Competitive Advantage and Corporate Social Responsibility. Harv. Bus. Rev. 2006, 84, 1–16. [Google Scholar]
- Husted, B.W.; Allen, D.B. Strategic corporate social responsibility and value creation among large firms: Lessons from the Spanish experience. Long Range Plan. 2007, 40, 594–610. [Google Scholar] [CrossRef] [Green Version]
- Heslin, P.A.; Ochoa, J.D. Understanding and developing strategic corporate social responsibility. Organ. Dyn. 2008, 37, 125–144. [Google Scholar] [CrossRef]
- Chandler, D. Strategic Corporate Social Responsibility: Sustainable Value Creation; SAGE Publications: Southend Oaks, CA, USA, 2016. [Google Scholar]
- Dorfleitner, G.; Halbritter, G.; Nguyen, M. Measuring the level and risk of corporate responsibility—An empirical comparison of different ESG rating approaches. J. Asset Manag. 2015, 16, 450–466. [Google Scholar] [CrossRef]
- Drempetic, S.; Klein, C.; Zwergel, B. The Influence of Firm Size on the ESG Score: Corporate Sustainability Ratings Under Review. J. Bus. Ethics 2020, 167, 333–360. [Google Scholar] [CrossRef]
- Semenova, N.; Hassel, L.G. On the Validity of Environmental Performance Metrics. J. Bus. Ethics 2015, 132, 249–258. [Google Scholar] [CrossRef]
- Aouadi, A.; Marsat, S. Do ESG Controversies Matter for Firm Value? Evidence from International Data. J. Bus. Ethics 2018, 151, 1027–1047. [Google Scholar] [CrossRef]
- Chollet, P.; Sandwidi, B.W. CSR engagement and financial risk: A virtuous circle? International evidence. Glob. Financ. J. 2018, 38, 65–81. [Google Scholar] [CrossRef]
- Hawn, O.; Ioannou, I. Mind the gap: The interplay between external and internal actions in the case of corporate social responsibility. Strateg. Manag. J. 2016, 37, 2569–2588. [Google Scholar] [CrossRef] [Green Version]
- Stellner, C.; Klein, C.; Zwergel, B. Corporate social responsibility and Eurozone corporate bonds: The moderating role of country sustainability. J. Bank. Financ. 2015, 59, 538–549. [Google Scholar] [CrossRef]
- Ena, O.V.; Abdrakhmanova, G.I. ICT through the prism of critical technologies. Foresight 2017, 19, 121–138. [Google Scholar] [CrossRef]
- Arora, S.K.; Li, Y.; Youtie, J.; Shapira, P. Using the wayback machine to mine websites in the social sciences: A methodological resource. J. Assoc. Inf. Sci. Technol. 2016, 67, 1904–1915. [Google Scholar] [CrossRef]
- Thakur, R.; AlSaleh, D. Drivers of managers’ affect (emotions) and corporate website usage: A comparative analysis between a developed and developing country. J. Bus. Ind. Mark. 2020, 36, 962–976. [Google Scholar] [CrossRef]
- Blazquez, D.; Domenech, J. Web data mining for monitoring business export orientation. Technol. Econ. Dev. Econ. 2018, 24, 406–428. [Google Scholar] [CrossRef]
- Soto-Acosta, P.; Popa, S.; Palacios-Marqués, D. E-business, organizational innovation and firm performance in manufacturing SMEs: An empirical study in Spain. Technol. Econ. Dev. Econ. 2016, 22, 885–904. [Google Scholar] [CrossRef] [Green Version]
- Calof, J.; Vibert, C. Competitive Intelligence in Canada in 2018. Rev. Int. D’intelligence Économique 2018, 10, 55–67. Available online: https://www.cairn.info/revue-internationale-d-intelligence-economique-2018-2-page-55.htm (accessed on 1 February 2022).
- Sewdass, N.; Calof, J. Contemporary practices of intelligence support for competitiveness. Foresight STI Gov. 2020, 14, 30–39. [Google Scholar] [CrossRef]
- Bryman, A. Social Research Methods, 4th ed.; Oxford University Press: Oxford, UK, 2012. [Google Scholar]
- Huggins, R.; Weir, M. Intellectual assets and small knowledge-intensive business service firms. J. Small Bus. Enterp. Dev. 2012, 19, 92–113. [Google Scholar] [CrossRef]
- Zieba, M.; Bolisani, E.; Paiola, M.; Scarso, E. Searching for innovation knowledge: Insight into KIBS companies. Knowl. Manag. Res. Pract. 2017, 15, 282–293. [Google Scholar] [CrossRef]
- Pina, K.; Tether, B.S. Towards understanding variety in knowledge intensive business services by distinguishing their knowledge bases. Res. Policy 2016, 45, 401–413. [Google Scholar] [CrossRef] [Green Version]
- Arora, S.K.; Youtie, J.; Shapira, P.; Gao, L.; Ma, T.T. Entry strategies in an emerging technology: A pilot web-based study of graphene firms. Scientometrics 2013, 95, 1189–1207. [Google Scholar] [CrossRef]
- Kassinis, G.; Panayiotou, A. Visuality as Greenwashing: The Case of BP and Deepwater Horizon. Organ. Environ. 2018, 31, 25–47. [Google Scholar] [CrossRef]
- Szabo, S.; Webster, J. Perceived Greenwashing: The Effects of Green Marketing on Environmental and Product Perceptions. J. Bus. Ethics 2021, 171, 719–739. [Google Scholar] [CrossRef]
- Blazquez, D.; Domenech, J. Big Data sources and methods for social and economic analyses. Technol. Forecast. Soc. Chang. 2018, 130, 99–113. [Google Scholar] [CrossRef]
- Ertem-Eray, T. Addressing corporate social responsibility in corporations: A content analysis of Amazon’s and Walmart’s websites. Corp. Commun. 2020, 26, 461–483. [Google Scholar] [CrossRef]
- Refinitiv. Starmine Quantitative Analytics. 2022. Available online: https://www.refinitiv.com/content/dam/marketing/en_us/documents/brochures/starmine-quantitative-analytics-brochure.pdf (accessed on 1 February 2022).
- The Palgrave Handbook of Survey Research; Vannette, D.L.; Krosnick, J.A. (Eds.) Palgrave Macmillan: London, UK, 2018. [Google Scholar] [CrossRef]
- Wolf, C.; Joye, D.; Smith, T.W.; Fu, Y.-C. (Eds.) The SAGE Handbook of Survey Methodology; SAGE: Southend Oaks, CA, USA, 2016. [Google Scholar]
- Adobe. Letter to Shareholders. 2020. Available online: https://www.adobe.com/content/dam/cc/en/investor-relations/pdfs/AdobeShareholderLetter2020.pdf (accessed on 1 February 2022).
- Eunomia. Plastics in the Marine Environment Bristol: Eunomia Research and Consulting. 2016. Available online: https://www.eunomia.co.uk/reports-tools/plastics-in-the-marine-environment/ (accessed on 1 February 2022).
- Statista. Plastics Waste Worldwide—Statistics and Facts. 2021. Available online: https://www.statista.com/topics/5401/global-plastic-waste/#dossierKeyfigures (accessed on 29 January 2022).
- FTI Consulting. FTI Consulting GHG Emissions Methodology—2018–2020. 2018. Available online: http://images.info.fticonsulting.com/Web/FTIConsultingInc/%7bbdbf5bd9-bc8e-4c64-ad88-badb508c6345%7d_FTI_Consulting_GHG_Emissions_Methodology_2020.pdf (accessed on 1 February 2022).
- USGBC. LEED rating system. 2022. Available online: https://www.usgbc.org/leed (accessed on 1 February 2022).
- BREEAM. Technical Standards. 2022. Available online: https://www.breeam.com/discover/technical-standards/?cn-reloaded=1&cn-reloaded=1 (accessed on 1 February 2022).
- Franzen, A.; Vogl, D. Two Decades of Measuring Environmental Attitudes: A Comparative Analysis of 33 Countries. Glob. Environ. Chang. 2013, 23, 1001–1008. [Google Scholar] [CrossRef]
- Statista. Impact Measurement and Management Systems Used by Impact Investors Worldwide in 2020, by Type. 2022. Available online: https://www.statista.com/statistics/1200459/impact-measurements-used-by-impact-investors/ (accessed on 24 January 2022).
- U.S. Bureau of Labor Statistics. Environmental Scientists and Specialists. 2021. Available online: https://www.bls.gov/ooh/life-physical-and-social-science/environmental-scientists-and-specialists.htm (accessed on 1 February 2022).
- Paolone, F.; Cucari, N.; Wu, J.; Tiscini, R. How do ESG pillars impact firms’ marketing performance? A configurational analysis in the pharmaceutical sector. J. Bus. Ind. Market. 2021. in print. [Google Scholar] [CrossRef]
- D’Apolito, E.; Iannuzzi, A.P. Incentive plans, pay-for-non-financial performance and ESG criteria: Evidence from the European banking sector. Int. Bus. Res. 2017, 10, 169–181. [Google Scholar] [CrossRef] [Green Version]
- Singhania, M.; Saini, N. Systems approach to environment, social and governance (ESG): Case of Reliance industries. Sustain. Oper. Comput. 2022, 3, 103–117. [Google Scholar] [CrossRef]
- Shin, R.; Searcy, C. Evaluating the greenhouse gas emissions in the craft beer industry: An assessment of challenges and benefits of greenhouse gas accounting. Sustainability 2018, 10, 4191. [Google Scholar] [CrossRef] [Green Version]
- Penz, E.; Polsa, P. How do companies reduce their carbon footprint and how do they communicate these measures to stakeholders? J. Clean. Prod. 2018, 195, 1125–1138. [Google Scholar] [CrossRef]
- Magazzino, C.; Mele, M.; Schneider, N.; Asumadu Sarkodie, S. Waste generation, wealth and GHG emissions from the waste sector: Is Denmark on the path towards circular economy? Sci. Total Environ. 2021, 755, 142510. [Google Scholar] [CrossRef] [PubMed]
- Ageeva, E.; Foroudi, P.; Melewar, T.; Nguyen, B.; Dennis, C. A Holistic Framework of Corporate Website Favourability. Corp. Reput. Rev. 2020, 23, 201–214. [Google Scholar] [CrossRef]
- Shearmur, R.; Doloreux, D. KIBS as both innovators and knowledge intermediaries in the innovation process: Intermediation as a contingent role. Reg. Sci. 2019, 98, 191–209. [Google Scholar] [CrossRef] [Green Version]
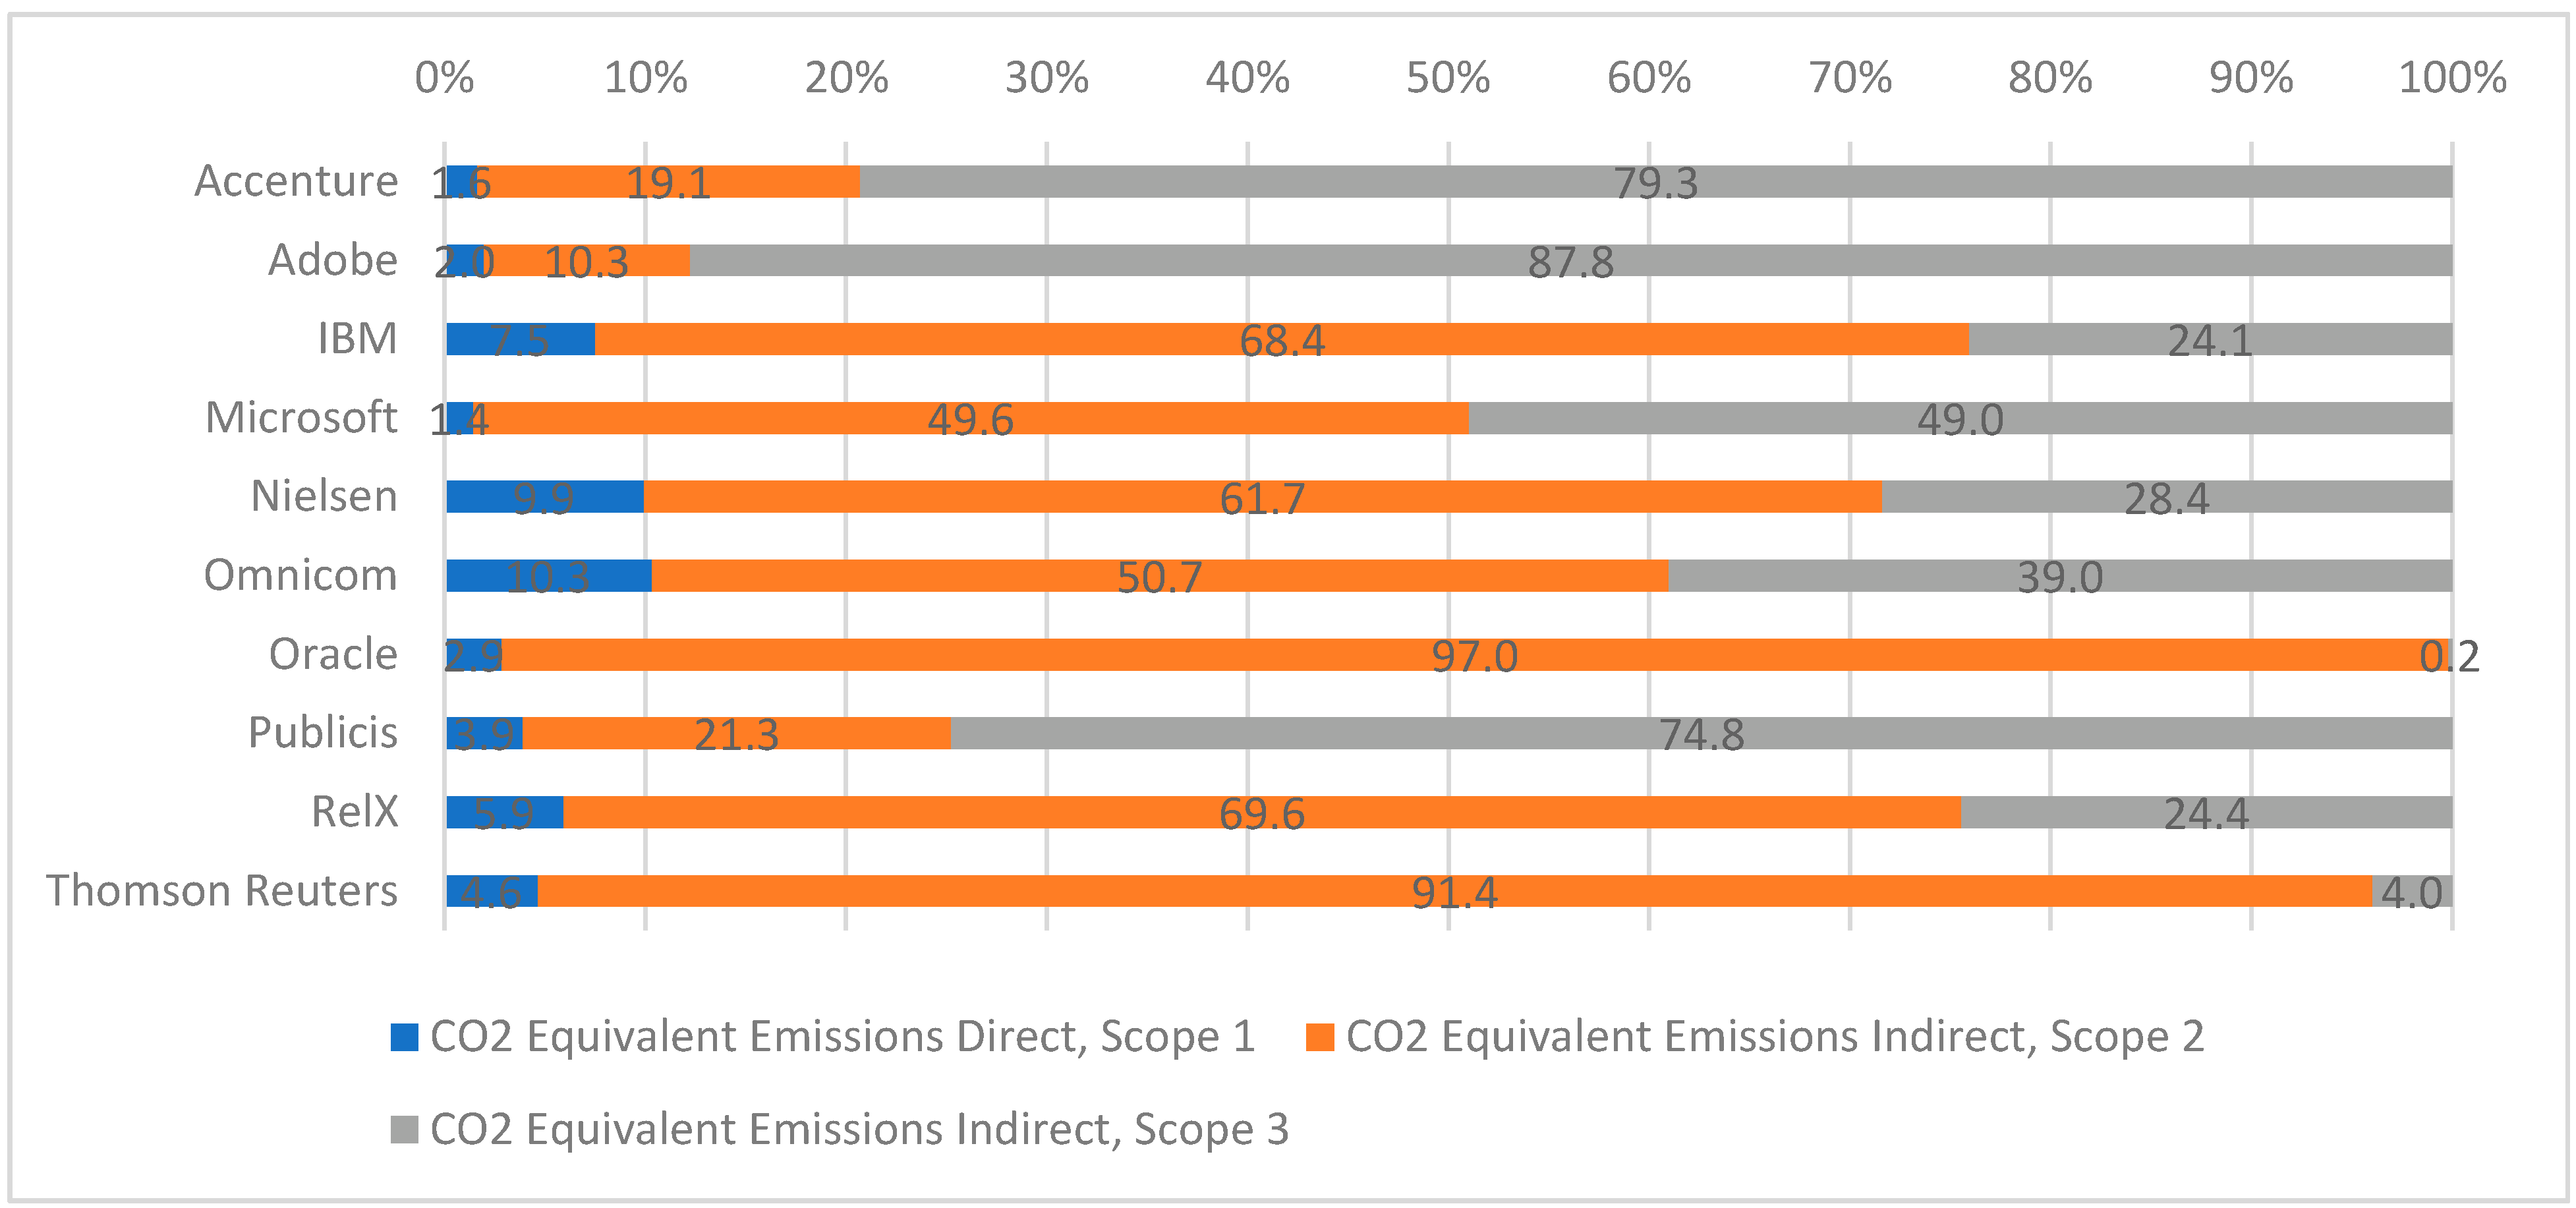
Publisher’s Note: MDPI stays neutral with regard to jurisdictional claims in published maps and institutional affiliations. |
© 2022 by the authors. Licensee MDPI, Basel, Switzerland. This article is an open access article distributed under the terms and conditions of the Creative Commons Attribution (CC BY) license (https://creativecommons.org/licenses/by/4.0/).