Article

Forced Oscillation Grid Vulnerability Analysis and Mitigation Using Inverter-Based Resources: Texas Grid Case Study

1
Department of Electrical Engineering and Computer Science, The University of Tennessee, Knoxville, TN 37996, USA
2
Electric Power Research Institute, Palo Alto, CA 94304, USA
3
Oak Ridge National Laboratory, Oak Ridge, TN 37830, USA
*
Author to whom correspondence should be addressed.
Energies 2022, 15(8), 2819; https://doi.org/10.3390/en15082819
Submission received: 24 February 2022 / Revised: 8 April 2022 / Accepted: 11 April 2022 / Published: 12 April 2022

Abstract

:
Forced oscillation events have become a challenging problem with the increasing penetration of renewable and other inverter-based resources (IBRs), especially when the forced oscillation frequency coincides with the dominant natural oscillation frequency. A severe forced oscillation event can deteriorate power system dynamic stability, damage equipment, and limit power transfer capability. This paper proposes a two-dimension scanning forced oscillation grid vulnerability analysis method to identify areas/zones in the system that are critical to forced oscillation. These critical areas/zones can be further considered as effective actuator locations for the deployment of forced oscillation damping controllers. Additionally, active power modulation control through IBRs is also proposed to reduce the forced oscillation impact on the entire grid. The proposed methods are demonstrated through a case study on a synthetic Texas power system model. The simulation results demonstrate that the critical areas/zones of forced oscillation are related to the areas that highly participate in the natural oscillations and the proposed oscillation damping controller through IBRs can effectively reduce the forced oscillation impact in the entire system.

1. Introduction

A forced oscillation in power systems is usually excited by an external periodic disturbance from a cyclic load, equipment failure, poor control design, or the mechanical oscillation of a generator during abnormal operation conditions [1,2,3,4]. With the increasing load variability and high penetration of renewable energy resources with intermittent nature, such as wind generation [5,6,7], forced oscillation events are becoming more frequent and more severe. In addition, in today’s deregulated and competitive market, more buyers and wind producers are joining the electricity market, and as a result, the strategic behavior of electricity consumers and renewable power producers might increase forced oscillation events [8,9]. Multiple forced oscillation events which were sustained for minutes to hours have been reported in the U.S., China, Canada etc. Forced oscillation can deteriorate power system stability, damage equipment, limit power transfer capability, and reduce power quality [10,11]. A recent example of a forced oscillation event occurred on 11 January 2019, in the U.S. Eastern Interconnection due to a faulty input to the steam turbine controller of a generator. The forced oscillation frequency was close to the natural oscillation mode of 0.25 Hz, and the forced oscillation lasted for 18 min before the source was removed [12].
Unlike forced oscillation, natural oscillation is the inherent oscillation due to the physical properties of the power grid. The damping of natural oscillation is becoming lower because of the high penetration of IBRs and the retirement of conventional synchronous generators with power system stabilizers (PSSs) [13,14,15]. Resonance can occur when the forced oscillation frequency is close to the frequency of a poorly damped natural oscillation mode. As a result, the oscillation amplitude can be significantly amplified and can propagate across the entire power system [16].
The most effective strategy to suppress the forced oscillation is to locate and remove the source from the power system [17,18]. However, accurate source identification may be a time-consuming process after the event is detected. Power oscillation damping controllers through IBRs and other devices have been proven to enhance the damping of a natural oscillation quickly and effectively [19,20,21]. Meanwhile, it is a feasible measure to suppress the forced oscillation energy to a safe level using a damping controller before the source is removed. Few papers have investigated the mitigation of a forced oscillation via a damping controller. In [22,23,24], power static synchronous compensator with energy storage (E-STATCOM), voltage source converter-based high voltage direct current (VSC-HVDC), and battery energy storage systems were investigated to suppress the forced oscillation by modulating their active or reactive power. Only [24] reports the testing of a large system among all the aforementioned strategies to mitigate forced oscillation. In [25], a forced oscillation damping controller with an event-triggered control strategy was proposed and tested on the IEEE 14-machine South-East Australian model.
Different from the previous work, this paper proposes a general method for forced oscillation grid vulnerability analysis and mitigation through IBRs in large-scale power grids. To reduce the forced oscillation effect in the entire system, a forced oscillation damping controller at an effective IBR actuator can be activated before the exact forced source is identified and removed. First, critical areas/zones under different specified forced oscillation frequencies that can excite the most severe forced oscillation across a large-scale power system can be identified by using a detailed location and frequency scanning method. These identified critical areas/zones under the specified forced oscillation frequencies are also effective locations as the actuators of forced oscillation damping controllers when the forced oscillation sources are narrowed down inside or close to the critical areas/zones. Secondly, a forced oscillation damping controller through active power modulation control via IBRs was designed to reduce the impact of the forced oscillation event before the forced source is removed. Finally, the 2000-bus synthetic Texas grid model in [26] is used as the study system to verify the proposed method.
The major contributions of this paper can be summarized as follows: (1) a two-dimension scanning forced oscillation grid vulnerability analysis method is proposed to identify the forced oscillation frequency and areas/zones that are critical to forced oscillation. (2) An effective IBR actuator location to forced oscillation damping controller is identified. (3) A forced oscillation damping controller is designed to reduce the impact of a forced oscillation event to a safe level and provide the system operator sufficient time to locate and remove the forced source.
The rest of this paper is outlined as follows: the forced oscillation grid vulnerability analysis, actuator selection of the forced oscillation controller, and forced oscillation mitigation methods are described in Section 2; the simulation results of the Texas grid case study are discussed in Section 3; and Section 4 gives the conclusion.

2. Forced Oscillation Vulnerability Analysis and Mitigation

2.1. Framework of the Algorithm

Figure 1 shows the framework of the proposed method to identify the critical areas/zones under different forced oscillation frequency events and the damping control of the forced oscillation.
To mimic the forced oscillation events in the simulation model, a sinusoidal signal with a specified frequency was added to the active power set point of the governor model at a synchronous generator. A two-dimensional (frequency and location) scanning method was utilized for the forced oscillation vulnerability analysis to identify the critical areas/zones and the oscillation frequencies that could excite the most severe forced oscillation. The frequency dimension scanning was performed by changing the forced oscillation frequency in a specific range (e.g., from 0.1 Hz to 1.5 Hz) at a fixed source location. A high-voltage bus frequency deviation in each area/zone was used as the indicator of the forced oscillation energy in each area/zone. The location dimension scanning was performed by changing the forced oscillation source location across the system under different specified forced oscillation frequencies. The critical frequency and critical locations that can excite the maximum bus frequency deviation were determined through frequency dimension scanning and location dimension scanning.
Once the critical areas/zones under different forced oscillation frequencies were identified, a local forced oscillation damping controller can be designed and implemented at IBRs in these areas as candidates to suppress the forced oscillation event. The ideal location of the damping controller/actuator would be the same as the external source to reduce the forced oscillation energy. However, when the forced source location can be quickly narrowed down in the relative area that is inside or close to the critical areas/zones with the forced damping controller, the damping controller can be activated to reduce the forced oscillation impact before the accurate forced source is identified and removed. In other words, the identified critical areas/zones are the effective locations of the actuator with a forced oscillation damping controller.

2.2. Forced Oscillation Vulnerability Analysis Method

Forced oscillation can be mimicked in simulations by changing the active power set point of a generator governor model or changing the voltage set point of the exciter model [24]. In this case study, a sinusoidal signal was added to the governor active power set point, as shown in Figure 2. The steam turbine-governor TGOV1 is used as an example, and the governor model parameter is shown in Table 1. The sinusoidal waveform is defined as:
P(t) = A sin(2πft)
where f is the forced oscillation frequency, A is the amplitude of the sinusoidal wave, and ΔP(t) is the active power that is added to the governor active power set point.
In the frequency dimension and location dimension scanning, the sinusoidal wave amplitude was adjusted to generate the same peak–peak forced oscillation energy for all sources. In this way, the bus frequency deviation can be compared fairly under all the disturbances with the same perturbation energy. The peak–peak forced oscillation energy was set to be such that it could excite a severe forced oscillation in the system. In this paper, the maximum frequency deviation over the ±36 mHz governor deadband was considered a severe forced oscillation. Figure 3 shows an example of the generator’s active power output when the forced oscillation frequency is 0.4 Hz. The peak–peak forced oscillation energy here is 100 MW.
The frequency dimension scanning was performed by changing the forced oscillation frequency with a small, fixed step size in a specified range of frequencies at a fixed source location. For each specified oscillation frequency, the bus frequency signals at the high voltage substations in each zone/area were recorded to calculate their peak–peak frequency deviation. In this paper, the maximum peak–peak bus frequency deviation in each zone was used as an indicator of the severity of a forced event impact in each zone. By comparing the peak–peak bus frequency deviation in all these zones/areas, the maximum value will be chosen to represent the peak–peak frequency deviation under this specified oscillation frequency. The peak–peak frequency deviations for the different frequencies are sorted in ascending order, and the frequency with the largest frequency deviation is determined as the most critical forced oscillation frequency at this fixed source location.
Location dimension scanning was conducted by changing the source location through the entire grid with the same forced energy. The peak–peak frequency deviations under different forced sources were then compared to identify the critical location to the forced oscillation event. The generator with the largest capacity in each area/zone was selected to add the sinusoidal signal at its governor active power set point. The above-mentioned frequency dimension scanning procedure was repeated at each selected generator. For each selected forced oscillation source, the maximum peak–peak bus frequency deviation under each specified forced oscillation frequency can be obtained. After the location dimension scanning, the peak–peak frequency deviations under each specified forced oscillation frequency at different forced oscillation sources were sorted in ascending order, and the source location with the largest frequency deviation was identified as the most critical location for the forced oscillation event with the specified forced oscillation frequency in the power system.
Based on the above procedure, the identified critical locations under different frequencies are the ones that can excite the largest frequency deviation in the system with the forced oscillation source.

2.3. Actuator Selection of Forced Oscillation Controller via IBRs

Based on the above two-dimension scanning results, the critical locations to the forced oscillation event under different specified oscillation frequencies can be further considered as the candidate effective actuator location of the oscillation damping controller to reduce the critical forced oscillation impact in the whole system.
Since the oscillation frequency and the relatively large area with the forced source can be quickly estimated, the effective candidate actuators (IBRs) that are close to or in the forced source areas can be activated to reduce the forced source impact before any accurate forced source is located and removed.

2.4. Forced Oscillation Mitigation Method

The proposed forced oscillation controller in [24], is implemented through a utility-scale wind/solar plant. The IBRs were modeled using the generic models that were developed by the Western Electricity Coordinating Council (WECC) Renewable Energy Modeling Task Force [27]. The proposed controller is a droop controller with the frequency deviation of its local high voltage bus as input. The controller’s output is added at Paux to modulate the active power output of the IBRs.

3. Texas Power System Case Study

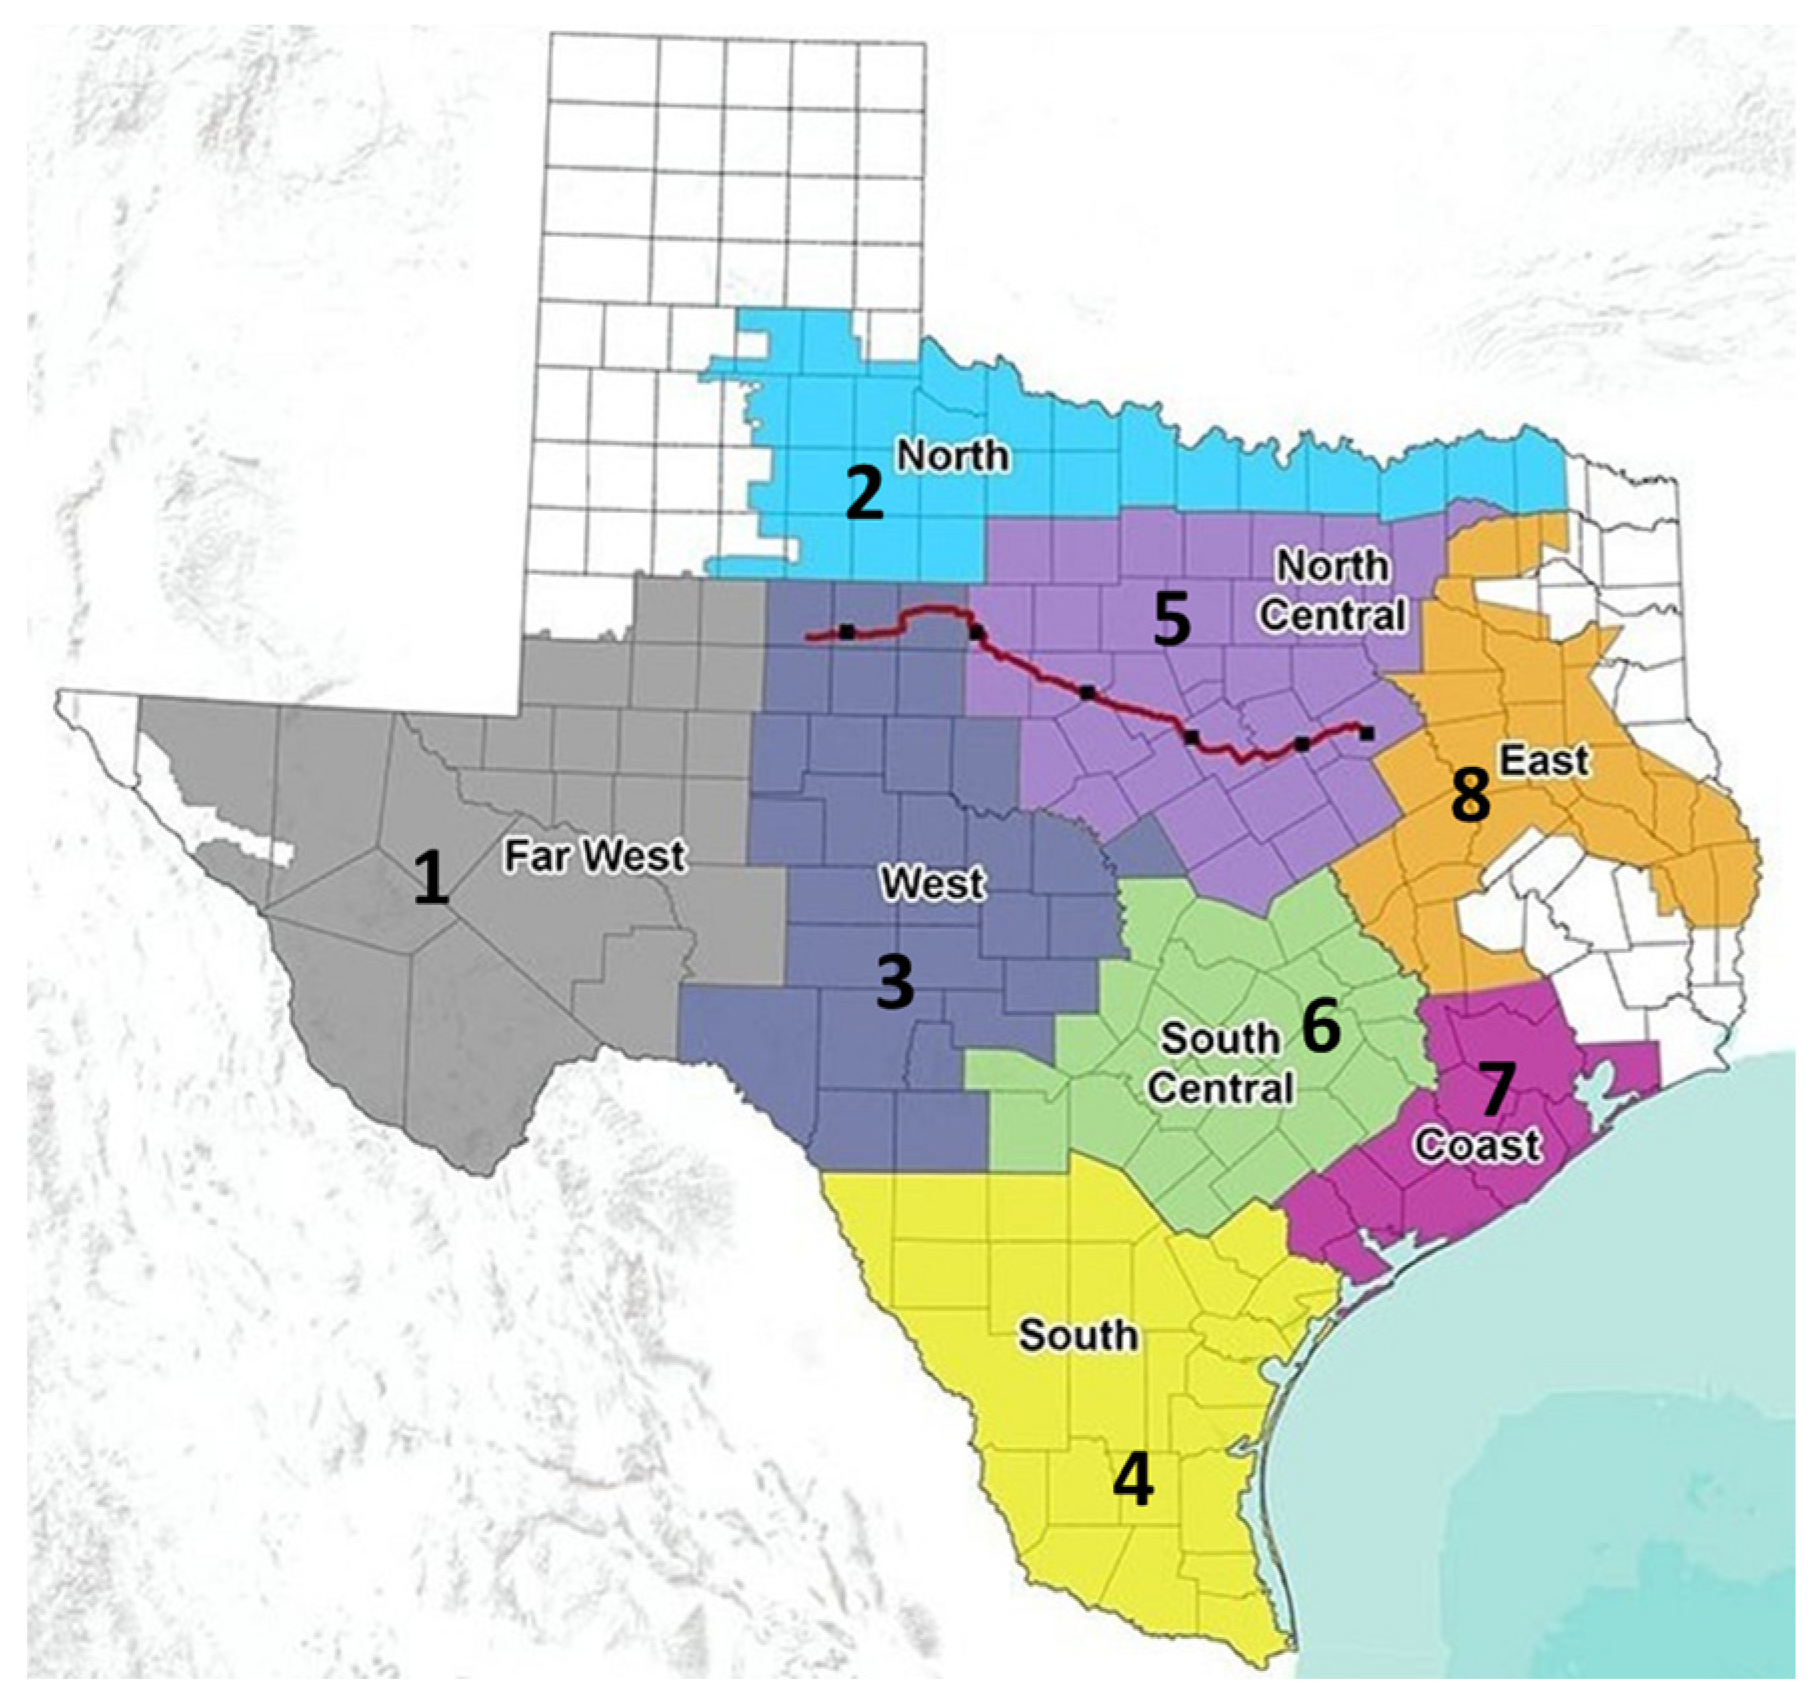
3.1. Synthetic Texas Power System Model Description

The 2000-bus synthetic Texas power grid model that was developed by Texas A&M was used in this paper for the forced oscillation study [26]. The model consists of 432 in-service machines with a maximum generation capacity of 84,996 MW that partially supply a total load of 67,109 MW. In these 432 machines, there are 81 renewable resources with a maximum capacity of 11,833 MW and an actual generation of 8875 MW. In addition, there are 2345 transmission lines and four high voltage levels: 500, 230, 161, and 115 kV. As shown in Figure 4, the synthetic Texas power grid consists of eight areas, and each area includes one or more zones with a total of 28 zones. Area 5 (North Central) is the load center which receives large power that is transmitted from Area 7 (Coast) and Area 8 (East). The renewables are located in Areas 1 to 5, with the renewable penetration level based on the maximum MW capacity of the whole system being 13.92%.
PSSs, governors, and exciters are implemented at each synchronous generator. For the dynamic models of the renewables, the generic models that were developed by the WECC were used, and in particular, the generator/converter model (REGCAU2) and the electrical control model (REECCU1). Small-signal analysis using the DSAtools/SSAT tool, showed that two natural oscillation modes exist in the system. One is a 0.67 Hz oscillation mode between Area 4 and Area 7, with a damping ratio of 5.1%. The other is a 0.60 Hz oscillation mode between Areas 1, 2, 3, 4, 5, and parts of Area 8 and Area 7, with a damping ratio of 6.31%. Table 2 shows the generators with a high participation factor of the two natural oscillation modes in different zones and it was calculated using the small-signal analysis tool in the DSAtools. It is noted that Area 4 has the highest participation factor for the natural oscillation mode of 0.67 Hz.

3.2. Grid Vulnerability Analysis

This section presents the grid vulnerability analysis in the Texas system using the proposed two-dimensional scanning method. The purpose of the scanning is to compare the forced oscillation energy at different frequencies and forced source locations in order to identify the areas that can excite the largest frequency deviation. In this study, the forced oscillation starts at t = 2 s and is simulated for 20 s. The conventional generator (coal, oil, nuclear, and hydro) with the maximum capacity at each zone in the Texas system was selected as the source of the forced oscillation. To excite sufficient frequency deviations in the system, the oscillation energy at each source location was set to 100 MW peak–peak for all the events.

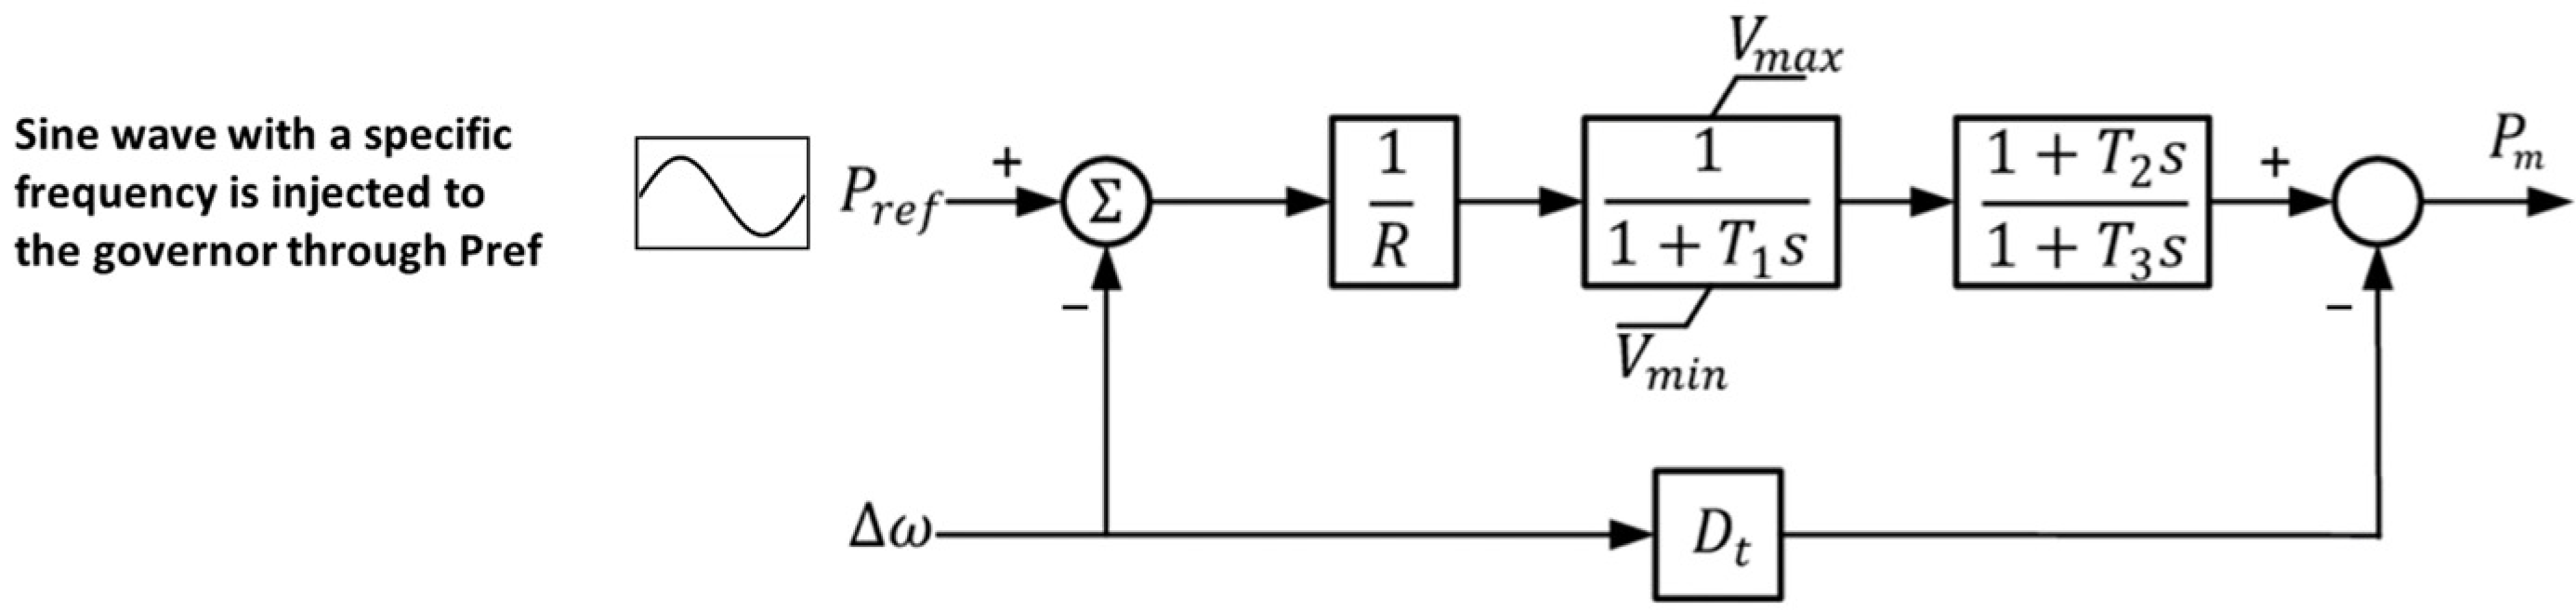
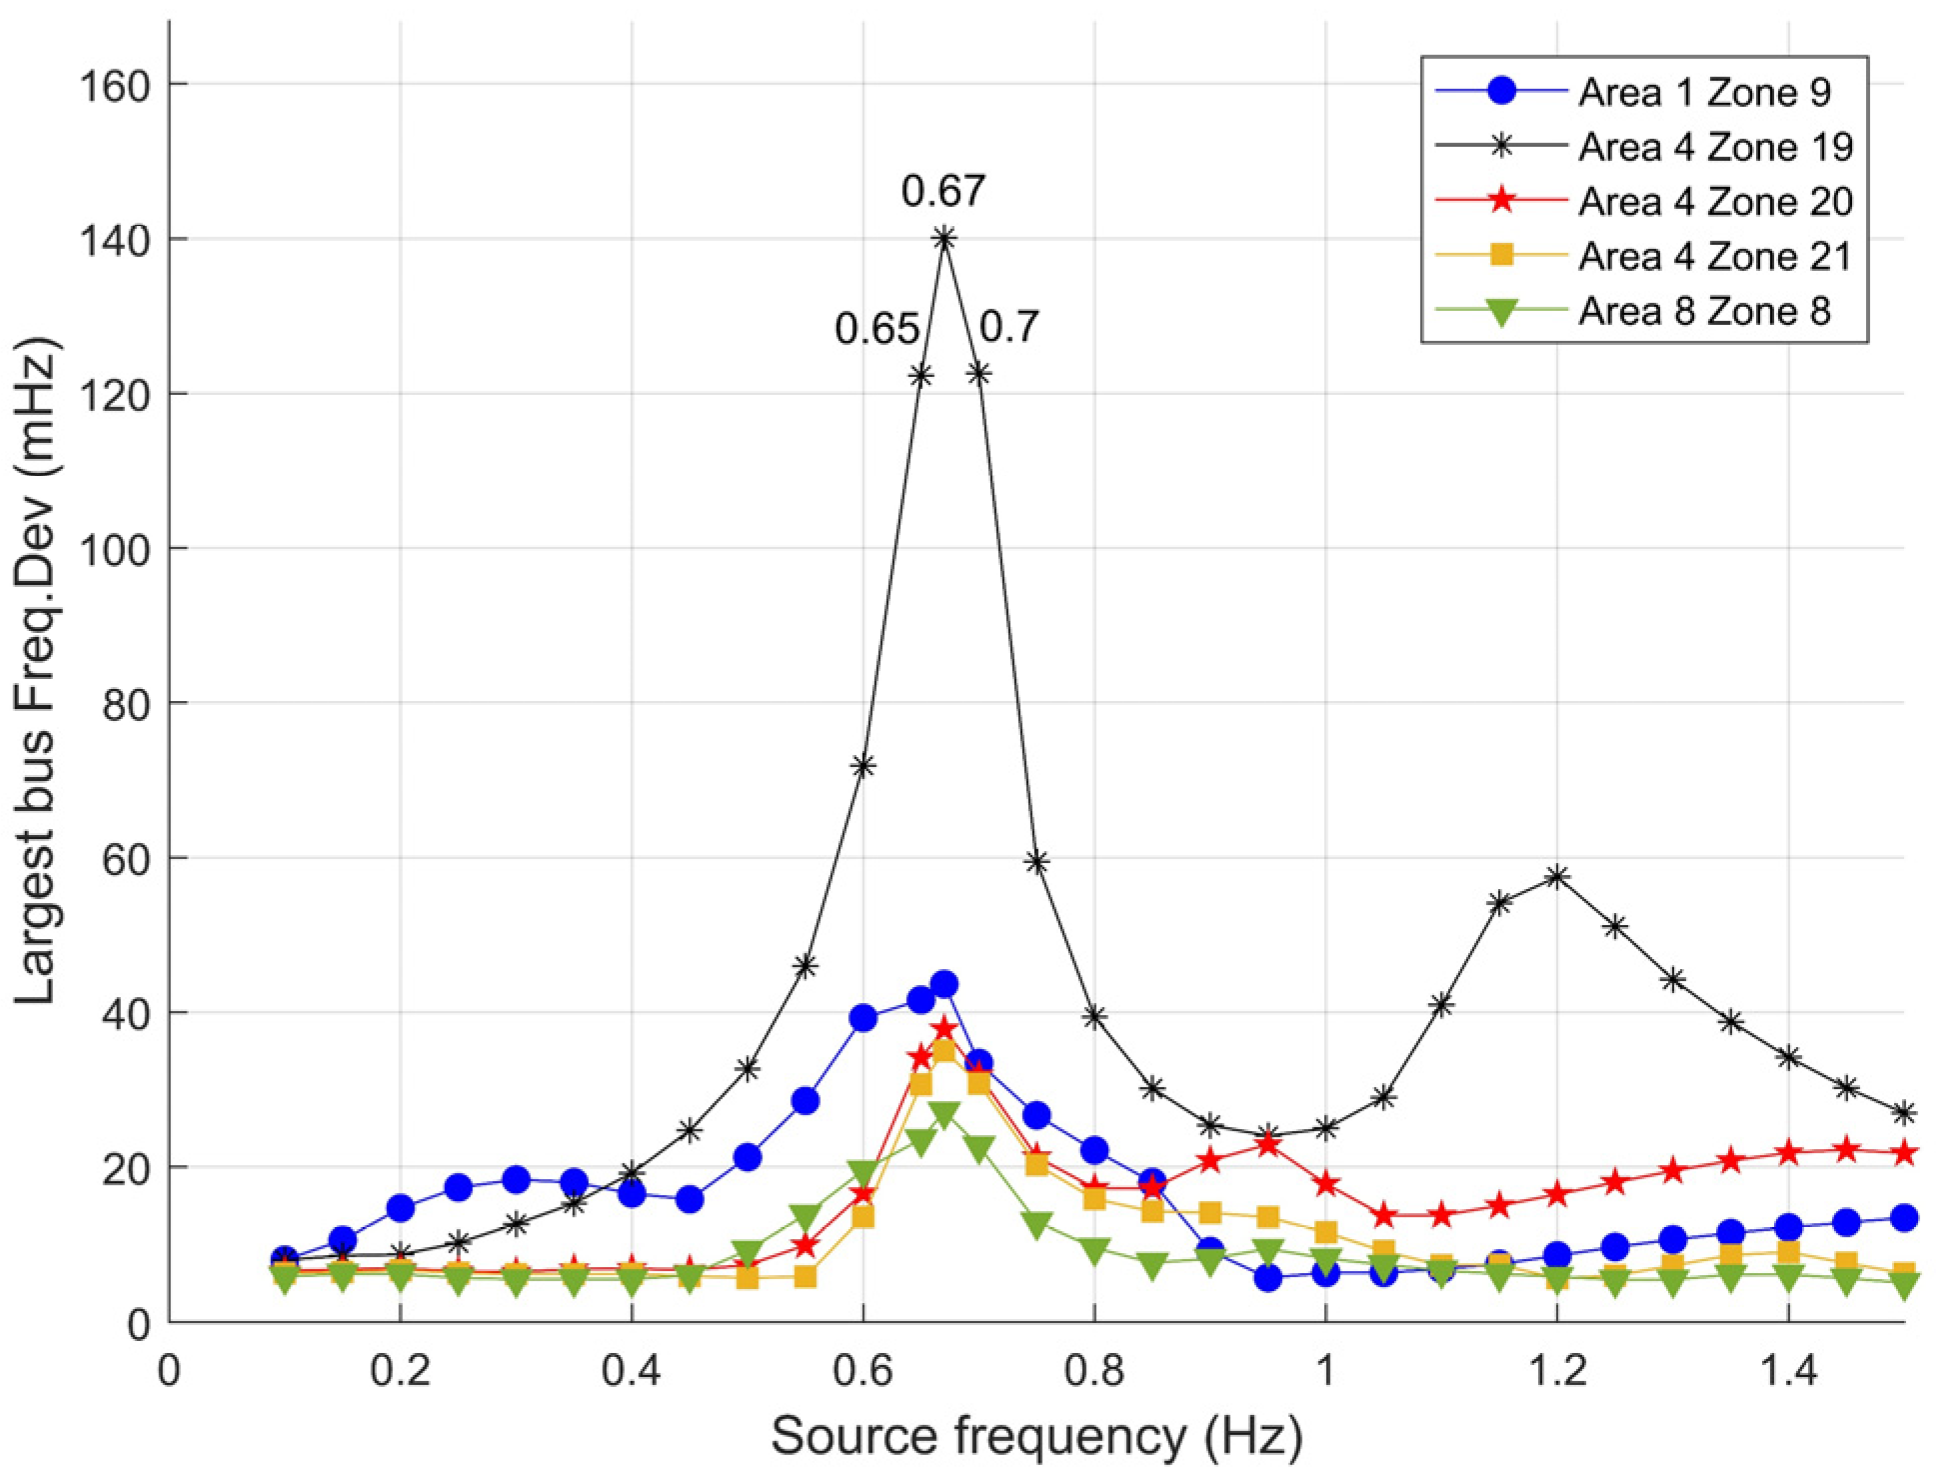
3.2.1. Frequency Dimension Scanning

The frequency dimension scanning procedure involves changing the forced oscillation frequency at a fixed source location. In this study, the oscillation frequency ranges from 0.1 Hz to 1.5 Hz with a step size of 0.05 Hz. A high voltage bus frequency response at each zone was selected to calculate its peak–peak bus frequency deviation by using its last 1.5 oscillation cycles. By comparing the peak–peak bus frequency deviation among the buses in different zones, the maximum peak–peak bus frequency deviation under each specified forced oscillation frequency was identified.
Figure 5 shows the maximum peak–peak bus frequency deviation under different frequencies when the forced oscillation source was located at Area 4 Zone 19. Figure 6 illustrates the frequency response of the selected high voltage buses at each zone in the Texas system when the 0.67 Hz oscillation source was located at Area 4 Zone 19. As shown in Figure 5, when the oscillation frequency goes to around 0.67 Hz (the natural oscillation frequency), the most severe oscillation deviation can be observed in the system than other forced oscillation frequencies.

3.2.2. Location Dimension Scanning

The location dimension scanning is to vary the location of the forced oscillation source across the system with different forced oscillation frequencies. Figure 7 shows the location scanning results of the forced oscillation source with the top five frequency deviations. Regardless of the forced source location, compared to other forced oscillation frequency ranges, the maximum frequency deviation can always be observed in the Texas synthetic system when the forced oscillation frequency is equal or close to the natural oscillation at 0.67 Hz. This proves that the forced oscillation impact on the power system stability is magnified when the forced oscillation frequency coincides with the natural oscillation frequency. What’s more, when the forced oscillation source was located at zones that have high participation of the natural 0.67 Hz oscillation (see Table 2), a larger frequency deviation can be observed in the system than other forced oscillation sources.
Table 3 shows an example of the location dimension scanning results under the critical 0.67 Hz forced oscillation. It can be observed that Area 4 Zone 19 is the critical source location that can excite the maximum peak–peak bus frequency deviation in the system. This is consistent with the participation factor sorting of 0.67 Hz natural oscillation in Table 2.

3.3. Actuator Selection of Forced Oscillation Controller via IBRs

Based on the two-dimension scanning, the critical areas/zones under different frequency range are summarized in Table 4. This table is useful for selecting the effective actuators to install the oscillation damping controller and reduce the forced oscillation in the power system. Based on Table 4, IBRs in Area 1, Zone 9 were effective in suppressing oscillations from 0.10 Hz to 0.35 Hz; IBRs in Area 4, Zone 19 were effective in suppressing oscillations around 0.4 Hz and from 0.5 Hz to 0.85 Hz and 1.10 Hz to 1.3 Hz; and IBRs in Area 3, Zone 28 were effective in suppressing oscillations around 0.45 Hz and from 0.90 Hz to 1.05 Hz and 1.35 Hz to 1.50 Hz. The IBRs with a large capacity in these areas are recommended to implement forced oscillation damping controllers.
When the forced oscillation frequency is monitored, the actuators that are effective to damp the oscillations can be identified from Table 4. Once the forced source is narrowed down within a relatively large area, the effective actuators (IBRs) that are close to or in the forced source areas can be activated to reduce the impact of the forced source energies before any accurate forced source is located.

3.4. Forced Oscillation Control via IBRs

This section demonstrates the performance of the forced oscillation damping controller. The aim of the controller is to reduce the impact of the forced oscillation until the forced oscillation source is located and removed. The controller performance is validated under the most serious resonance case, i.e., when the forced source is at Area 4 Zone 19 with the forced oscillation frequency coinciding with the natural oscillation mode 1 (0.67 Hz). Based on the results in Table 3 and Table 4, the effective location for a forced oscillation damping controller is at Area 4 Zone 19. The 243.6 MVA IBR at bus 4183 in Area 4 Zone 19 is then selected as the actuator and the feedback signal is the 230 kV bus 4070 that is connected with the IBR in Area 4 Zone 19.
In this paper, the droop controller gain was set to be −190. Figure 8 depicts the Area 4 Zone 19 frequency deviation improvement and the active power output of the actuator when the forced source at Area 4 Zone 19 before and after implementing the control. Table 5 illustrates the peak–peak frequency deviation improvement of the selected high voltage buses at each zone in the Texas system after implementing the controller. The largest deviation of the entire system can be reduced to less than ±36 mHz (66.6 mHz) with −190 control gain and 17% limiter. The peak–peak actuator output is 50.05 MW which is around ±16.44% of the actual active power of the actuator of 152.25 MW. Table 5 shows when the actuator is at the same zones of the forced source, the peak –peak bus frequency deviation is reduced at all the zones in the system.
Considering that the governors in the system have a 36 m Hz deadband before being activated, the forced oscillation damping controller is helpful to ensure the system response is limited in the deadband of governors, and reduces the forced oscillation impact on the entire system.
Figure 9 illustrates Area 4 Zone 19 frequency deviation improvement and the active power output of the actuator when the forced source at Area 4 Zone 20 before and after implementing the control. In this case, the peak–peak forced oscillation energy is increased to 160 MW in order for the peak–peak bus frequency deviation to exceed the deadband of the governor (±36 mHz). Area 4 Zone 19 had the largest peak–peak frequency deviation, and it can be reduced to 40.51 mHz. The peak–peak actuator output was 30.73 MW which is around ±10.1% of the actual active power of the actuator of 152.25 MW.

4. Conclusions

A two-dimension scanning forced oscillation grid vulnerability analysis method in large-scale power grids was proposed in this paper. Based on the grid vulnerability analysis results, the effective location for forced oscillation damping controller can be selected. Active power modulation control through IBRs at the effective location with local measurement was also designed to mitigate forced oscillation under serious forced oscillation cases.
The key findings of this paper are summarized below:
  • Based on frequency dimension scanning, forced oscillation at or close to the natural oscillation excites the largest peak–peak frequency deviation in the entire system.
  • When the forced oscillation source is located at the areas that have high participation of the natural oscillations, the forced oscillation will be further magnified throughout the system and significantly impact the system stability.
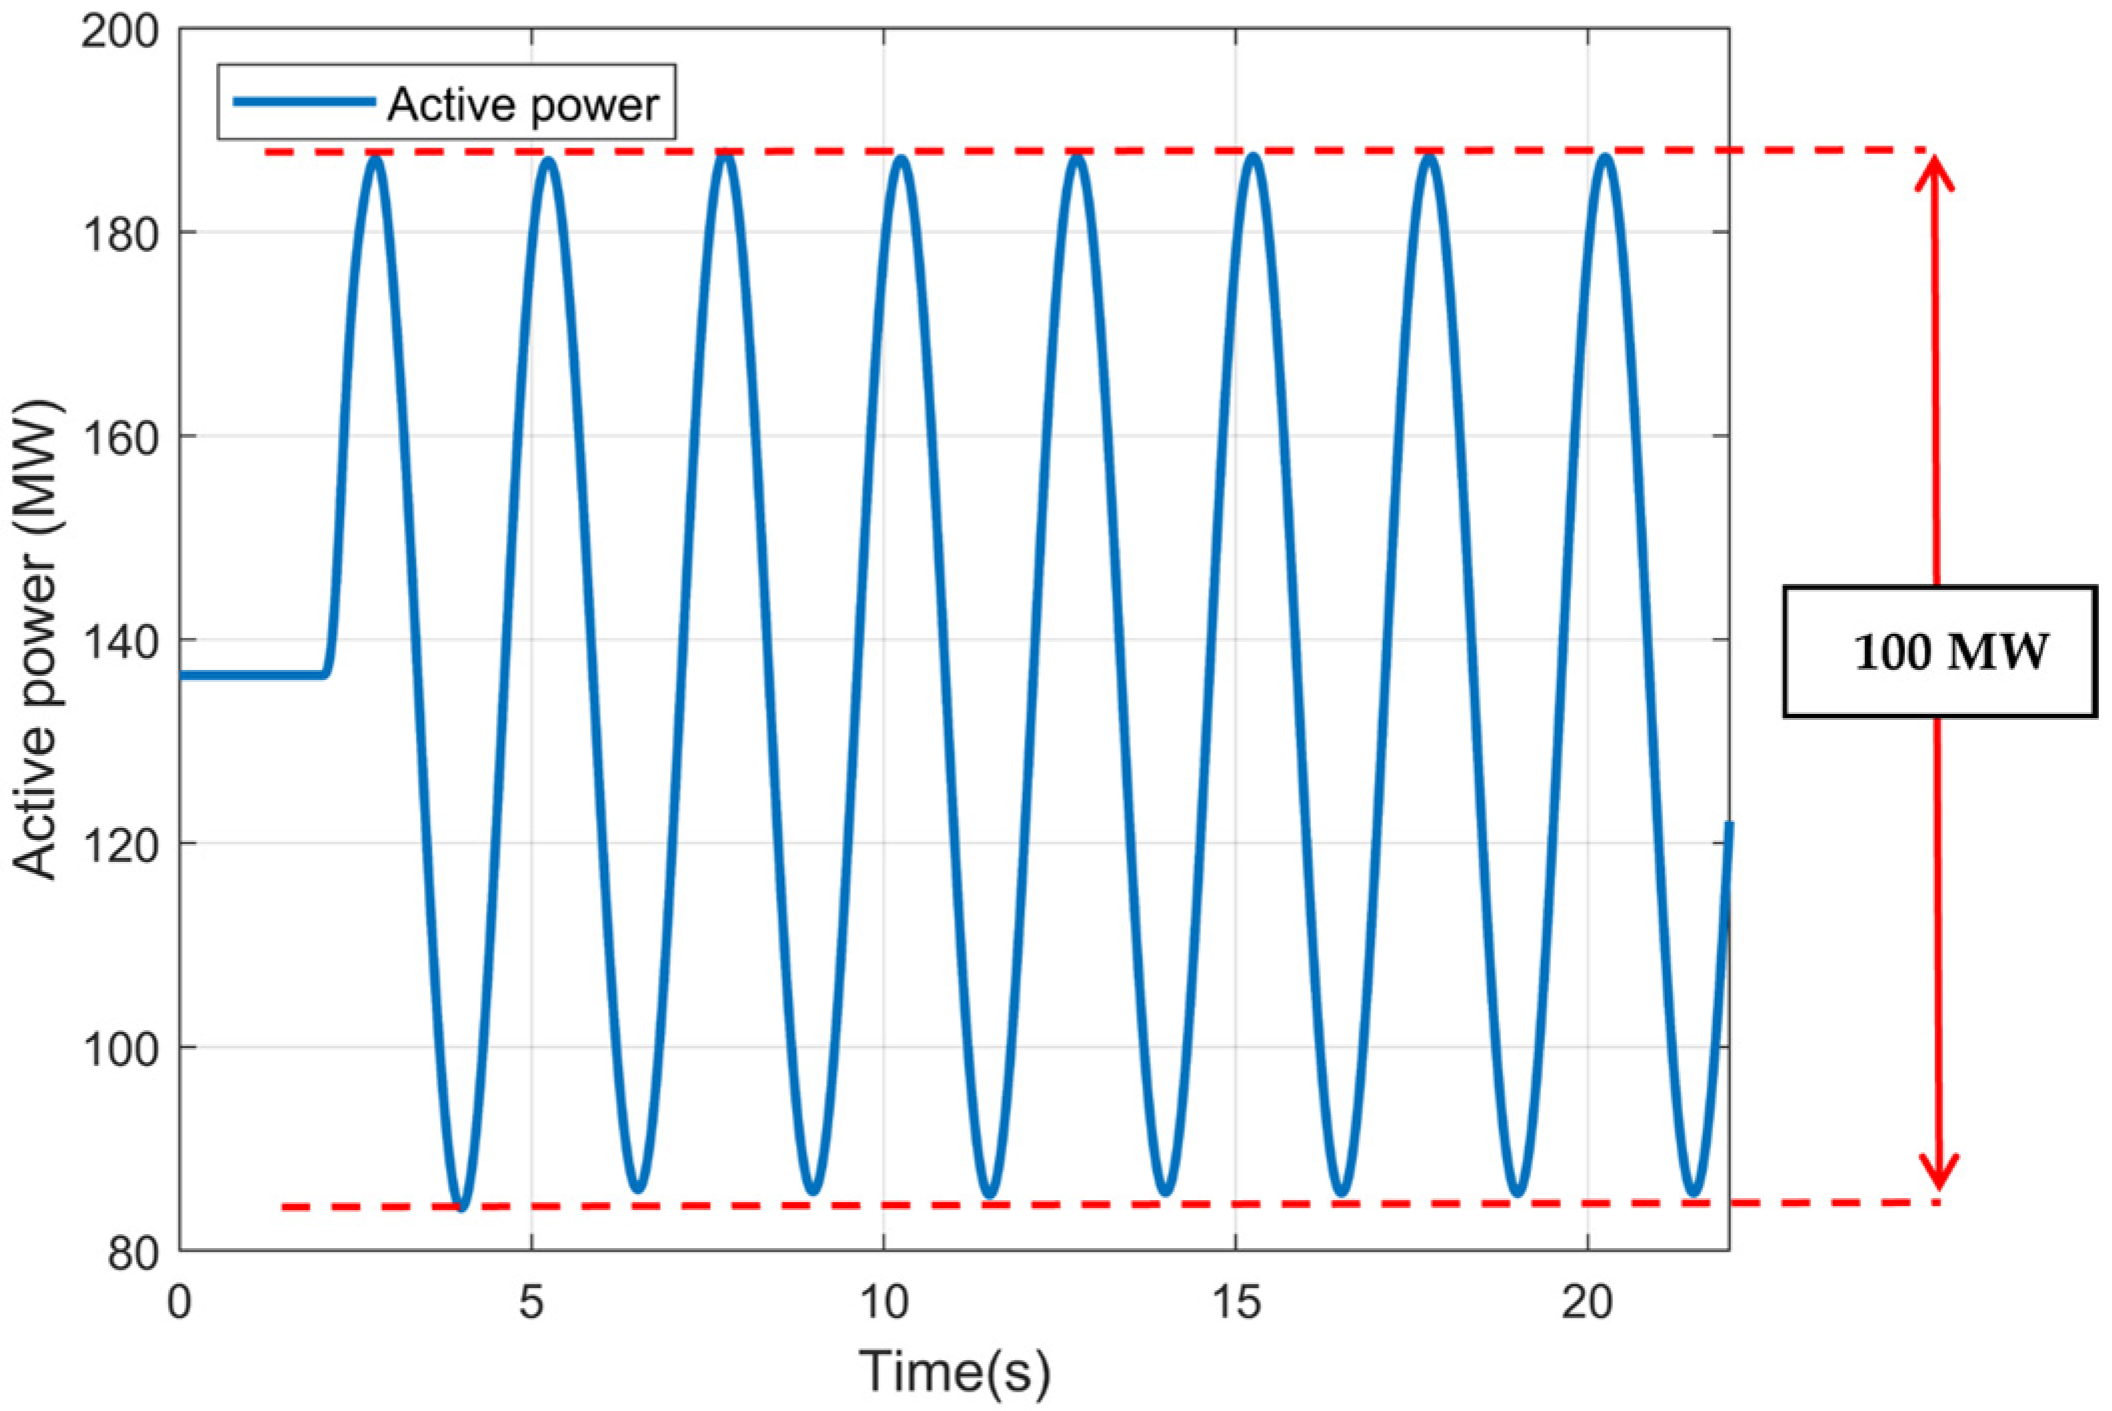
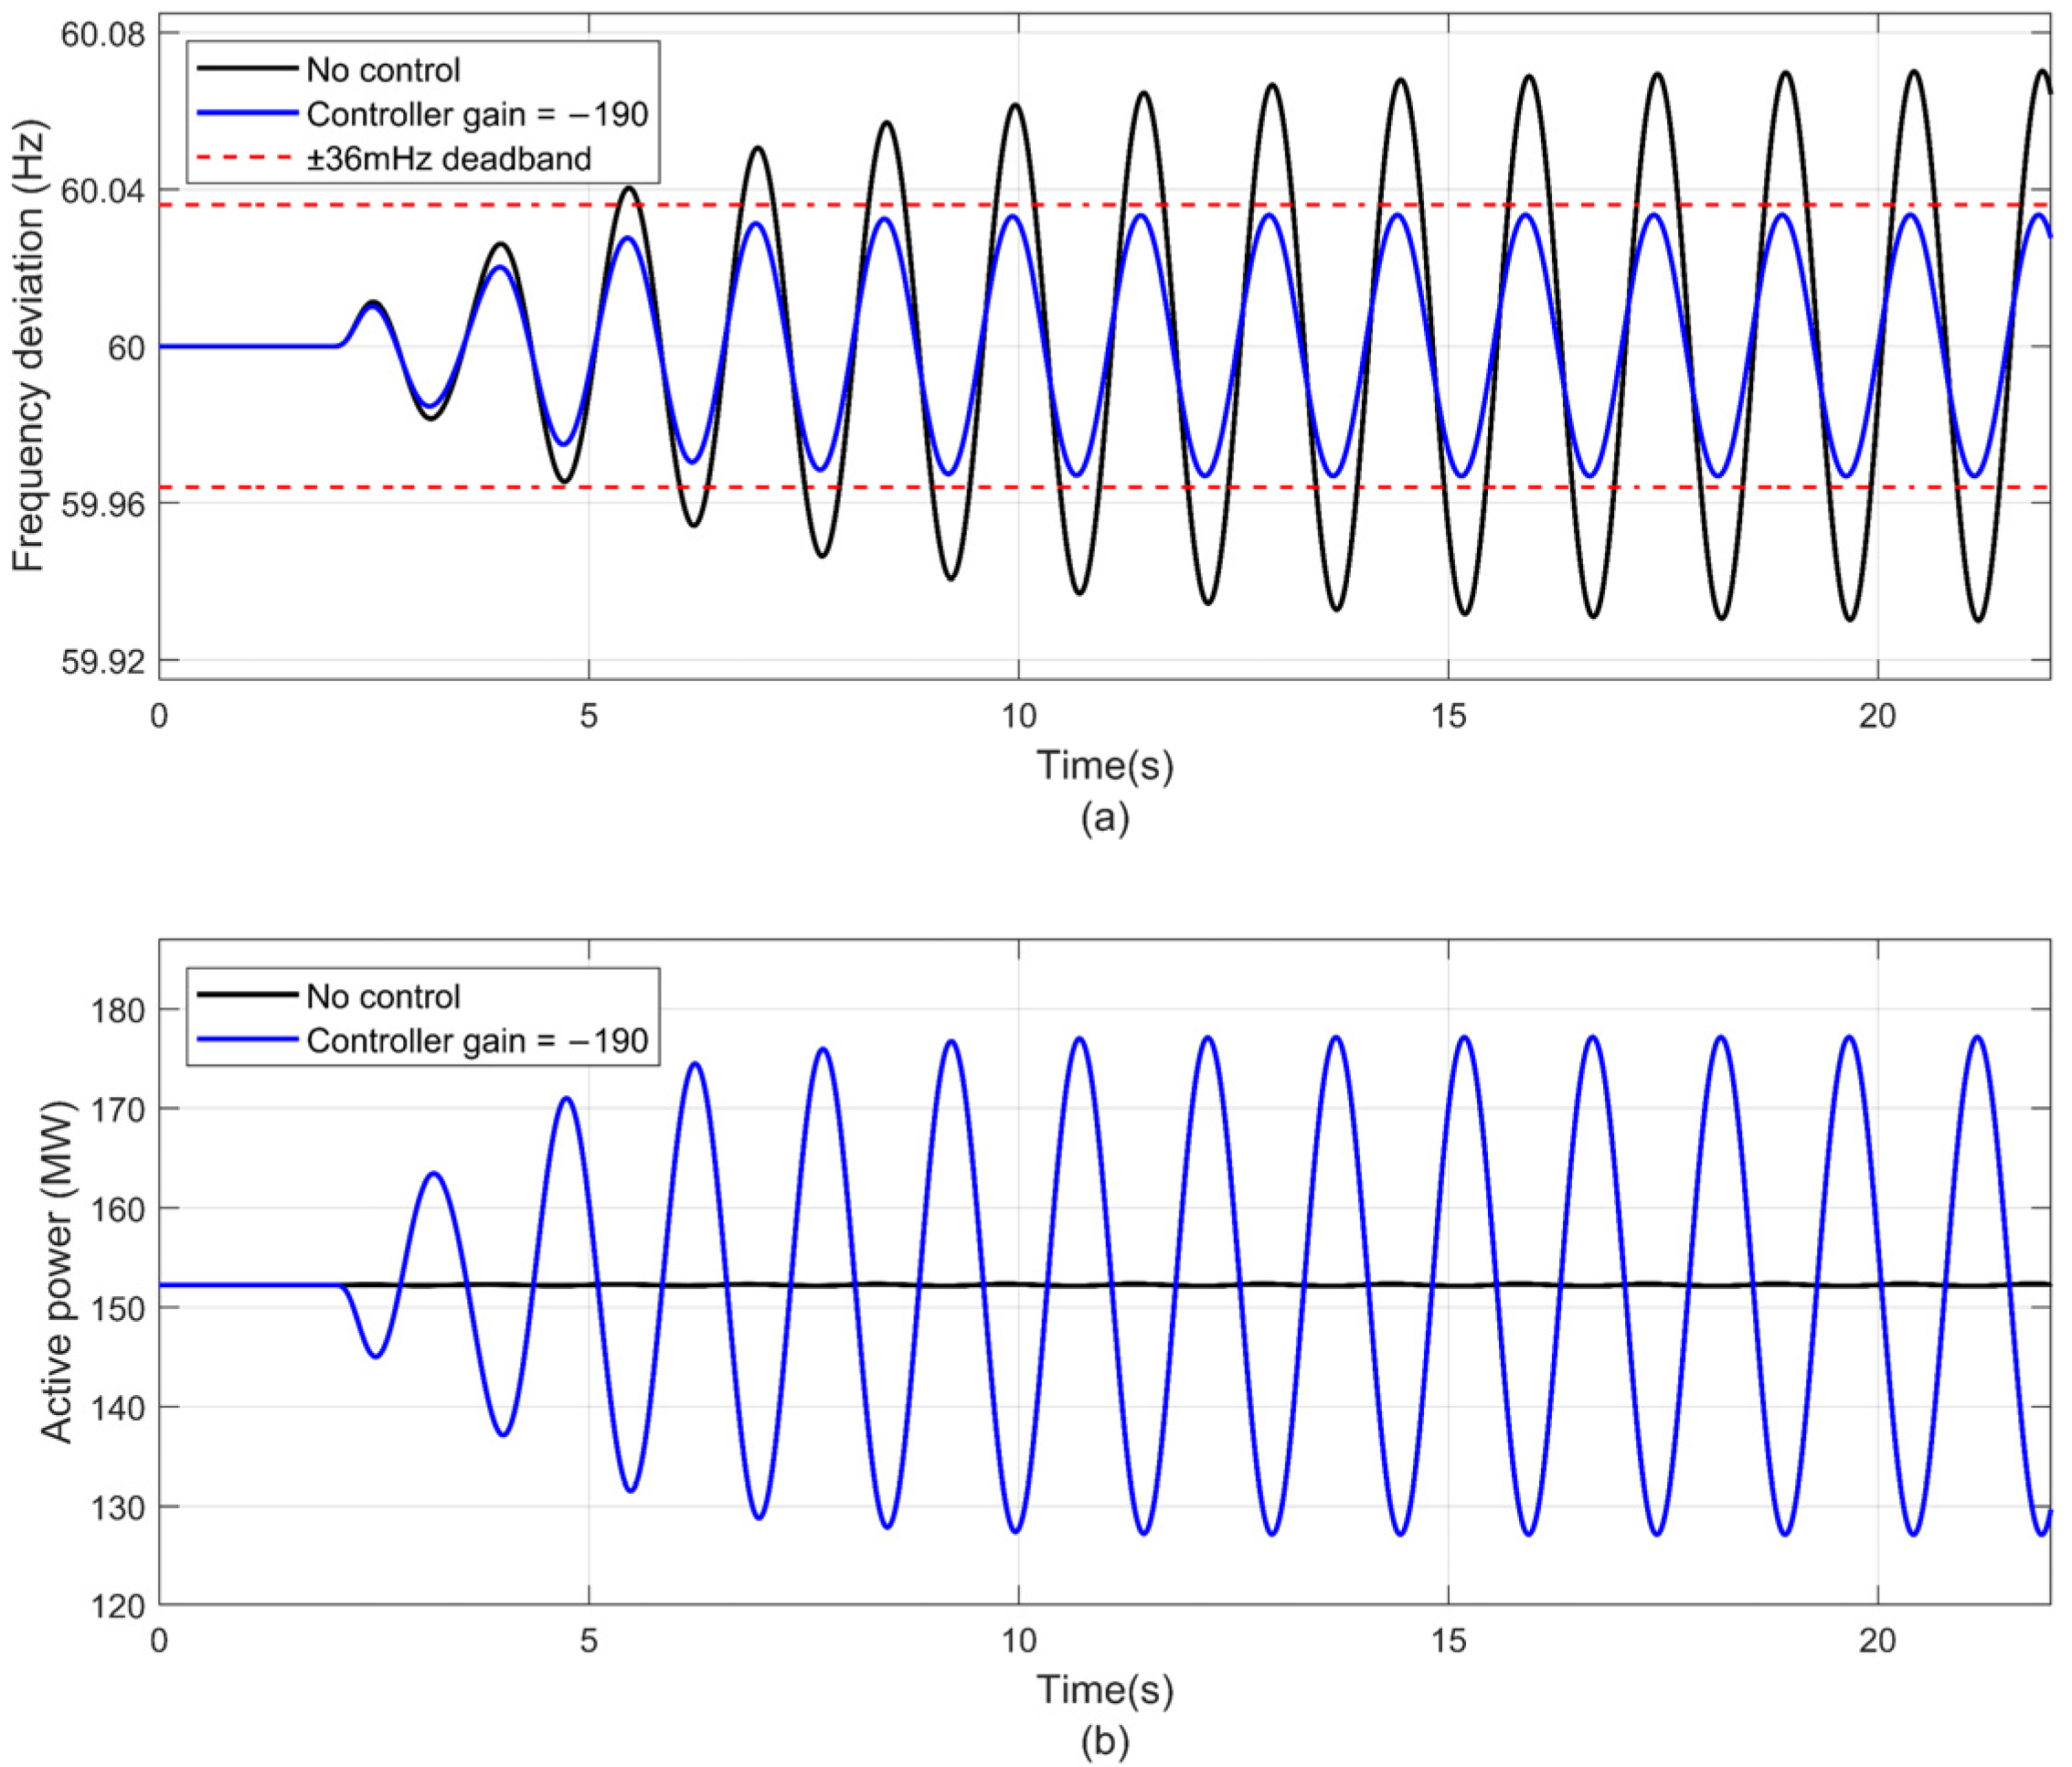
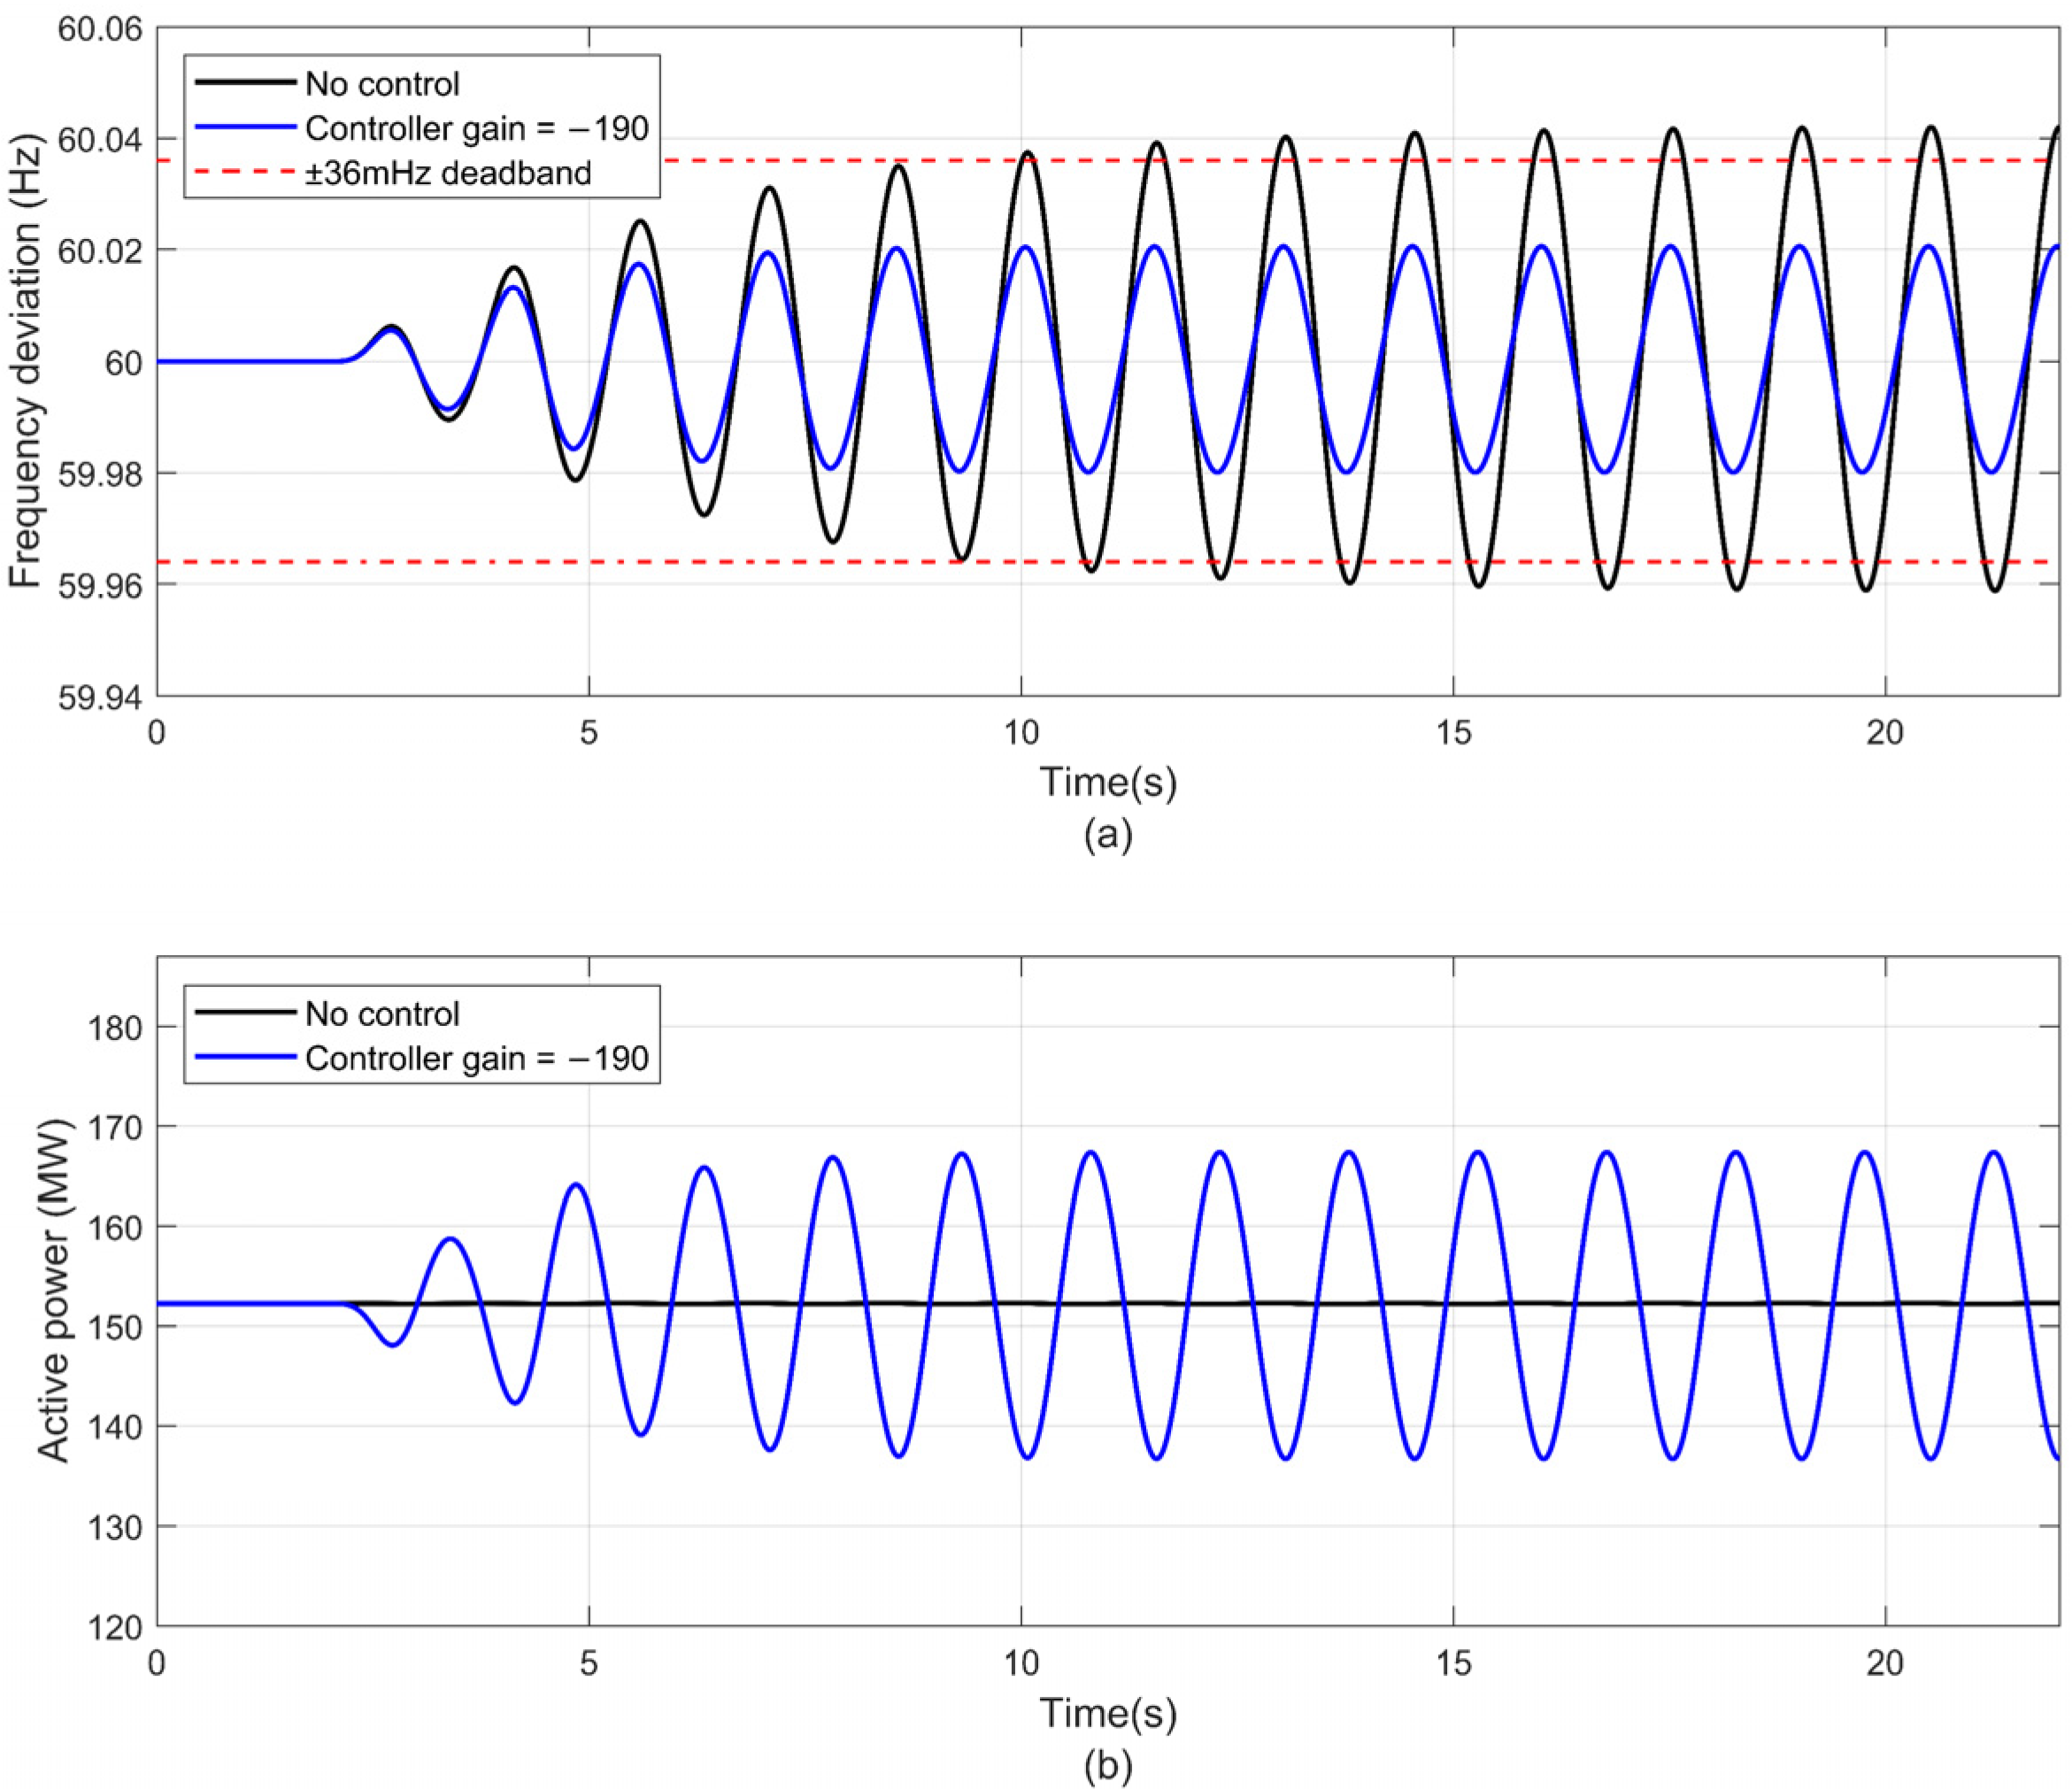
  • Active power modulation control through IBRs with local measurement was effective in reducing the frequency deviation that was caused by the forced oscillation. This will allow the operator to have sufficient time to locate and disconnect the forced source.
  • The proposed forced oscillation controller can reduce all the zones’ frequency deviation to a safety level in the synthetic Texas power grid when the actuator is close to the forced source. The largest peak–peak bus frequency deviation can be reduced by more than 50%, to 66.6 mHz (in the range of governor deadband ±36 mH) with appropriate control gain.
Future work may include the investigation of the impact of forced oscillation through reactive power perturbation using the proposed two-dimension scanning method. The forced oscillation damping controller through reactive power modulation of IBRs will be designed to mitigate the forced oscillation.

Author Contributions

Conceptualization, L.Z., E.F., D.R. and Y.L.; methodology, K.A., Y.Z. and L.Z.; software, K.A., Y.Z. and W.Y.; validation, K.A. and Y.Z.; formal analysis, K.A. and Y.Z.; investigation, K.A. and Y.Z.; resources, K.A., Y.Z. and W.Y.; data curation, K.A., Y.Z. and W.Y.; writing—original draft preparation, K.A. and Y.Z.; writing—review and editing, L.Z., E.F., D.R. and Y.L.; visualization, K.A. and W.Y.; supervision, L.Z., E.F., D.R. and Y.L.; project administration, L.Z., E.F., D.R. and Y.L.; funding acquisition, E.F. All authors have read and agreed to the published version of the manuscript.

Funding

This work was primarily supported by Electric Power Research Institute (EPRI) and partly supported by National Science Foundation under the Award Number 1839684 and 1941101. This work also made use of Engineering Research Center Shared Facilities supported by the Engineering Research Center Program of the National Science Foundation and DOE under NSF Award Number EEC-1041877 and the CURENT Industry Partnership Program.

Data Availability Statement

Not applicable.

Conflicts of Interest

The authors declare no conflict of interest.

References

  1. Reliability Guideline: Forced Oscillation Monitoring and Mitigation; The North American Electric Reliability Corporation (NERC): Atlanta, GA, USA, 2017; Available online: https://www.nerc.com/comm/PC_Reliability_Guidelines_DL/Reliability_Guideline_-_Forced_Oscillations_-_2017-07-31_-_FINAL.pdf (accessed on 27 December 2021).
  2. Ghorbaniparvar, M. Survey on forced oscillations in power system. J. Mod. Power Syst. Clean Energy 2017, 5, 671–682. [Google Scholar] [CrossRef]
  3. Power System Oscillatory Behaviors: Sources, Characteristics, and Analyses; North American SynchroPhasor Initiative (NASPI), USA, Technical Report, May 2017. Available online: https://www.pnnl.gov/main/publications/external/technical_reports/PNNL-26375.pdf (accessed on 27 December 2021).
  4. Khan, M.A.; Pierre, J.W. Detection of Periodic Forced Oscillations in Power Systems Using Multitaper Approach. IEEE Trans. Power Syst. 2019, 34, 1086–1094. [Google Scholar] [CrossRef]
  5. Zuhaib, M.; Rihan, M.; Saeed, M.T. A novel method for locating the source of sustained oscillation in power system using synchrophasors data. Prot. Control Mod. Power Syst. 2020, 5, 30. [Google Scholar] [CrossRef]
  6. Ye, H.; Liu, Y.; Zhang, P.; Du, Z. Analysis and Detection of Forced Oscillation in Power System. IEEE Trans. Power Syst. 2017, 32, 1149–1160. [Google Scholar] [CrossRef]
  7. Su, C.; Hu, W.; Chen, Z.; Hu, Y. Mitigation of power system oscillation caused by wind power fluctuation. IET Renew. Power Gener. 2013, 7, 639–651. [Google Scholar] [CrossRef]
  8. Srinivasan, D.; Trung, L.T.; Singh, C. Bidding and cooperation strategies for electricity buyers in power markets. IEEE Syst. J. 2014, 10, 422–433. [Google Scholar] [CrossRef]
  9. Xiao, D.; AlAshery, M.K.; Qiao, W. Optimal price-maker trading strategy of wind power producer using virtual bidding. J. Mod. Power Syst. Clean Energy Early Access. 2021, 1–3. [Google Scholar] [CrossRef]
  10. Surinkaew, T.; Emami, K.; Shah, R.; Islam, S.; Mithulananthan, N. Forced Oscillation in Power Systems with Converter Controlled-Based Resources–A Survey with Case Studies. IEEE Access 2021, 9, 150911–150924. [Google Scholar] [CrossRef]
  11. Estevez, P.G.; Marchi, P.; Galarza, C.; Elizondo, M. Non-Stationary Power System Forced Oscillation Analysis Using Synchrosqueezing Transform. IEEE Trans. Power Syst. 2021, 36, 1583–1593. [Google Scholar] [CrossRef]
  12. Eastern Interconnection Oscillation Disturbance January 11, 2019 Forced Oscillation Event; The North American Electric Reliability Corporation (NERC): Atlanta, GA, USA, 2019; Available online: https://www.nerc.com/pa/rrm/ea/Documents/January_11_Oscillation_Event_Report.pdf (accessed on 27 December 2021).
  13. Rogers, G. Power System Oscillations; Kluwer Academic Publishers: New York, NY, USA, 2000. [Google Scholar]
  14. Venkatraman, A.; Markovic, U.; Shchetinin, D.; Vrettos, E.; Aristidou, P.; Hug, G. Improving Dynamic Performance of Low-Inertia Systems Through Eigensensitivity Optimization. IEEE Trans. Power Syst. 2021, 36, 4075–4088. [Google Scholar] [CrossRef]
  15. Tan, A.; Lin, X.; Sun, J.; Lyu, R.; Li, Z.; Peng, L.; Khalid, M.S. A Novel DFIG Damping Control for Power System with High Wind Power Penetration. Energies 2016, 9, 521. [Google Scholar] [CrossRef] [Green Version]
  16. Sarmadi, S.A.N.; Venkatasubramanian, V. Inter-Area Resonance in Power Systems from Forced Oscillations. IEEE Trans. Power Syst. 2016, 31, 378–386. [Google Scholar] [CrossRef]
  17. Chevalier, S.; Vorobev, P.; Turitsyn, K. A Bayesian Approach to Forced Oscillation Source Location Given Uncertain Generator Parameters. IEEE Trans. Power Syst. 2019, 34, 1641–1649. [Google Scholar] [CrossRef] [Green Version]
  18. Feng, S.; Zheng, B.; Jiang, P.; Lei, J. A Two-Level Forced Oscillations Source Location Method Based on Phasor and Energy Analysis. IEEE Access 2018, 6, 44318–44327. [Google Scholar] [CrossRef]
  19. Zhao, Y.; Zhu, L.; Xiao, H.; Liu, Y.; Farantatos, E.; Patel, M.; Darvishi, A.; Fardanesh, B. An Adaptive Wide-Area Damping Controller via FACTS for the New York State Grid Using a Measurement-Driven Model. In Proceedings of the 2019 IEEE Power & Energy Society General Meeting (PESGM), Atlanta, GA, USA, 8 August 2019; pp. 1–5. [Google Scholar] [CrossRef]
  20. Zhu, Y.; Liu, C.; Wang, B.; Sun, K. Damping control for a target oscillation mode using battery energy storage. J. Mod. Power Syst. Clean Energy 2018, 6, 833–845. [Google Scholar] [CrossRef] [Green Version]
  21. Saadatmand, M.; Gharehpetian, C.B.; Moghassemi, A.; Guerrero, J.M.; Siano, P.; Alhelou, H.H. Damping of Low-Frequency Oscillations in Power Systems by Large-Scale PV Farms: A Comprehensive Review of Control Methods. IEEE Access 2021, 9, 72183–72206. [Google Scholar] [CrossRef]
  22. Feng, S.; Wu, X.; Jiang, P.; Xie, L.; Lei, J. Mitigation of Power System Forced Oscillations: An E-STATCOM Approach. IEEE Access 2018, 6, 31599–31608. [Google Scholar] [CrossRef]
  23. Xu, Y.; Bai, W.; Zhao, S.; Zhang, J.; Zhao, Y. Mitigation of forced oscillations using VSC-HVDC supplementary damping control. Electr. Power Syst. Res. 2020, 184, 106333. [Google Scholar] [CrossRef]
  24. Lin, Z.; Yu, W.; Jiang, Z.; Zhang, C.; Zhao, Y.; Dong, J.; Wang, W.; Liu, Y.; Farantatos, E.; Ramasubramanian, D.; et al. A Comprehensive Method to Mitigate Forced Oscillations in Large Interconnected Power Grids. IEEE Access 2021, 9, 22503–22515. [Google Scholar]
  25. Surinkaew, T.; Shah, R.; Nadarajah, M.; Muyeen, S.M. Forced Oscillation Damping Controller for an Interconnected Power System. IET Gener. Transm. Distrib. 2020, 14, 339–347. [Google Scholar] [CrossRef]
  26. ACTIVSg2000: 2000-Bus Synthetic Grid on Footprint of TEXAS. Available online: https://electricgrids.engr.tamu.edu/electric-grid-test-cases/activsg2000/ (accessed on 20 December 2021).
  27. Generic Solar Photovoltaic System Dynamic Model Specification; Prepared by Western Electricity Coordinating Council (WECC) Renewable Energy Modeling Task Force: Salt Lake City, UT, USA, 2012; Available online: https://www.wecc.org/_layouts/15/WopiFrame.aspx?sourcedoc=/Reliability/WECC%20Solar%20PV%20Dynamic%20Model%20Specification%20-%20September%202012.pdf&action=default&DefaultItemOpen=1 (accessed on 21 February 2022).
  28. ERCOT Load Zones. Available online: https://www.lonestartransmission.com/what-we-do/ercot-load-zones.html (accessed on 23 February 2022).
Figure 1. Framework of the forced oscillation identification and mitigation procedure.
Energies 15 02819 g001
Figure 2. TGOV1 governor turbine model with an external sinusoidal signal.
Energies 15 02819 g002
Figure 3. Active power output in MW of a generator with a 0.4 Hz sinusoidal wave added to the governor reference power set point.
Energies 15 02819 g003
Figure 4. 2000-bus synthetic Texas power grid diagram [28].
Energies 15 02819 g004
Figure 5. Frequency dimension scanning results when the forced source at Area 4 Zone 19.
Energies 15 02819 g005
Figure 6. Frequency response at different zones when the 0.67 Hz forced oscillation source is located at Area 4 Zone 19.
Energies 15 02819 g006
Figure 7. Location dimension scanning results of the forced oscillation source with the top five frequency deviations.
Energies 15 02819 g007
Figure 8. (a) Area 4 Zone 19 frequency deviation improvement. (b) Active power output of the actuator at Area 4 Zone 19 when the forced source is at Area 4 Zone 19.
Energies 15 02819 g008
Figure 9. (a)Area 4 Zone 19 frequency deviation improvement. (b) Active power output of the actuator at Area4 Zone 19 when the forced source at Area 4 Zone 20.
Energies 15 02819 g009
Table 1. TGOV1 governor parameter.
RT1VmaxVminT2T3Dt
200.199−990.10.10
Table 2. Participation factor for natural 0.67 Hz and 0.60 Hz oscillation.
Generator LocationGenerator Bus NO.Participation Factor
(0.67 Hz)
Participation Factor
(0.60 Hz)
Area 4 Zone 1941921.000.14
Area 4 Zone 2140580.720.01
Area 4 Zone 2041150.400.22
Area 8 Zone 880800.190.77
Area 1 Zone 910510.181.00
Area 5 Zone 1250630.180.01
Area 2 Zone 1120230.180.76
Area 5 Zone 1853190.170.73
Table 3. Location dimension scanning results when the critical forced oscillation frequency is 0.67 Hz.
Source LocationArea—Zone with
Largest Bus
Frequency Deviation
Peak–Peak Bus
Frequency Deviation (mHz)
Area 4 Zone 19Area 4 Zone 19140.090
Area 1 Zone 9Area 4 Zone 1943.622
Area 4 Zone 20Area 4 Zone 1937.798
Area 4 Zone 21Area 4 Zone 1934.996
Area 8 Zone 8Area 4 Zone 1930.780
Area 5 Zone 12Area 4 Zone 1927.221
Area 7 Zone 4Area 4 Zone 1927.125
Area 2 Zone 11Area 4 Zone 1926.910
Area 7 Zone 3Area 4 Zone 1925.536
Area 5 Zone 18Area 4 Zone 1924.451
Area 7 Zone 2Area 4 Zone 1923.359
Area 3 Zone 28Area 3 Zone 2823.172
Area 8 Zone 7Area 4 Zone 1919.345
Area 7 Zone 5Area 4 Zone 1918.532
Area 5 Zone 14Area 4 Zone 1918.099
Area 5 Zone 16Area 4 Zone 1917.938
Area 6 Zone 22Area 4 Zone 1917.764
Area 5 Zone 13Area 4 Zone 1917.663
Area 5 Zone 17Area 4 Zone 1915.185
Area 6 Zone 26Area 4 Zone 1913.886
Area 7 Zone 6Area 4 Zone 1912.948
Area 6 Zone 25Area 4 Zone 1911.598
Area 6 Zone 23Area 4 Zone 199.652
Area 7 Zone 1Area 7 Zone 49.191
Table 4. The critical areas/zones under different frequency range based on two-dimensional scanning.
Source LocationOscillation
Frequency (Hz)
Area—Zone with Largest Bus Frequency DeviationPeak–Peak Bus Frequency Deviation (mHz)
Area 1 Zone 90.1Area 7 Zone 48.00
Area 1 Zone 90.15Area 7 Zone 410.53
Area 1 Zone 90.2Area 7 Zone 414.67
Area 1 Zone 90.25Area 7 Zone 417.33
Area 1 Zone 90.3Area 7 Zone 418.35
Area 1 Zone 90.35Area 7 Zone 418.00
Area 4 Zone 190.4Area 4 Zone 1919.19
Area 3 Zone 280.45Area 3 Zone 2825.22
Area 4 Zone 190.5Area 4 Zone 1932.63
Area 4 Zone 190.55Area 4 Zone 1945.95
Area 4 Zone 190.6Area 4 Zone 1971.88
Area 4 Zone 190.65Area 4 Zone 19122.30
Area 4 Zone 190.67Area 4 Zone 19140.09
Area 4 Zone 190.7Area 4 Zone 19122.58
Area 4 Zone 190.75Area 4 Zone 1959.45
Area 4 Zone 190.8Area 4 Zone 2139.37
Area 4 Zone 190.85Area 4 Zone 2130.16
Area 3 Zone 280.9Area 3 Zone 2830.35
Area 3 Zone 280.95Area 3 Zone 2831.79
Area 3 Zone 281Area 3 Zone 2831.78
Area 3 Zone 281.05Area 3 Zone 2833.20
Area 4 Zone 191.1Area 4 Zone 1940.93
Area 4 Zone 191.15Area 4 Zone 1954.10
Area 4 Zone 191.2Area 4 Zone 1957.49
Area 4 Zone 191.25Area 4 Zone 1951.09
Area 4 Zone 191.3Area 4 Zone 1944.23
Area 3 Zone 281.35Area 3 Zone 2846.49
Area 3 Zone 281.4Area 3 Zone 2848.79
Area 3 Zone 281.45Area 3 Zone 2851.21
Area 3 Zone 281.5Area 3 Zone 2853.53
Table 5. The peak–peak bus frequency deviation improvement before and after implementing the forced oscillation damping controller.
Area-ZonePeak–Peak Bus Frequency Deviation (mHz)Bus Frequency Deviation Reduction (mHz)
No ControlWith Control
Area 1 Zone 913.005.997.01
Area 2 Zone 1118.418.539.88
Area 2 Zone 1014.746.767.98
Area 3 Zone 2713.446.197.25
Area 3 Zone 287.833.624.21
Area 4 Zone 19140.0966.6073.49
Area 4 Zone 2051.1123.6427.47
Area 4 Zone 21101.9547.1054.85
Area 5 Zone 1216.077.438.65
Area 5 Zone 1312.955.996.95
Area 5 Zone 1415.297.088.21
Area 5 Zone 1512.015.556.46
Area 5 Zone 1618.398.529.87
Area 5 Zone 1717.528.119.41
Area 5 Zone 1816.247.518.72
Area 6 Zone 2213.466.247.22
Area 6 Zone 238.193.784.40
Area 6 Zone 2425.0111.5713.44
Area 6 Zone 257.853.634.23
Area 6 Zone 2613.536.277.26
Area 7 Zone 11.270.540.73
Area 7 Zone 214.986.948.03
Area 7 Zone 313.106.077.03
Area 7 Zone 415.477.178.30
Area 7 Zone 513.276.157.12
Area 7 Zone 611.205.196.01
Area 8 Zone 711.975.546.43
Area 8 Zone 819.288.9310.35
Publisher’s Note: MDPI stays neutral with regard to jurisdictional claims in published maps and institutional affiliations.

